Presidential Lakes Estates, NJ Map & Demographics
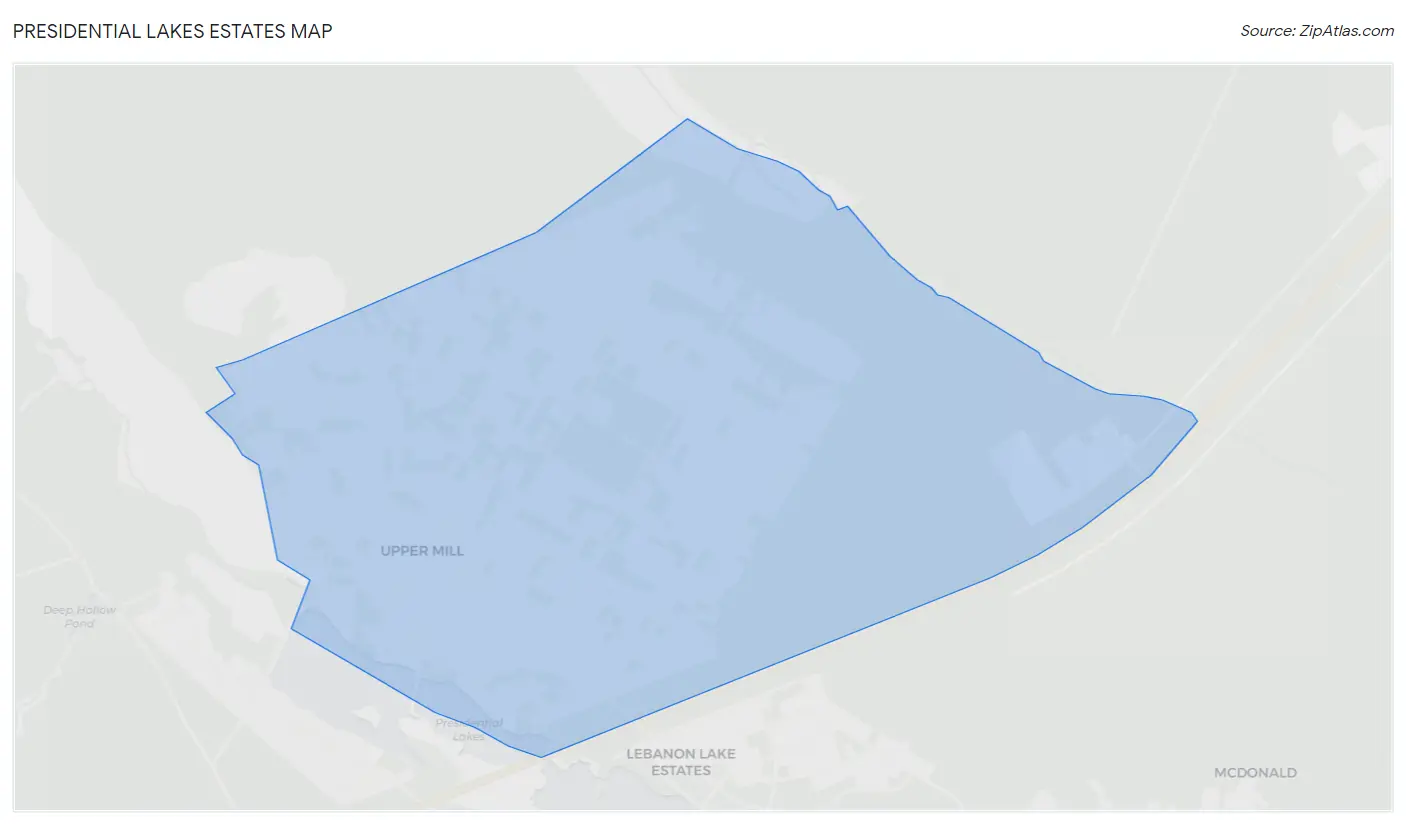
Presidential Lakes Estates Map
Presidential Lakes Estates Overview
$37,971
PER CAPITA INCOME
$74,745
AVG FAMILY INCOME
$84,423
AVG HOUSEHOLD INCOME
0.37
INEQUALITY / GINI INDEX
2,460
TOTAL POPULATION
1,388
MALE POPULATION
1,072
FEMALE POPULATION
129.48
MALES / 100 FEMALES
77.23
FEMALES / 100 MALES
42.0
MEDIAN AGE
3.1
AVG FAMILY SIZE
2.7
AVG HOUSEHOLD SIZE
1,454
LABOR FORCE [ PEOPLE ]
70.7%
PERCENT IN LABOR FORCE
12.6%
UNEMPLOYMENT RATE
Income in Presidential Lakes Estates
Income Overview in Presidential Lakes Estates
Per Capita Income in Presidential Lakes Estates is $37,971, while median incomes of families and households are $74,745 and $84,423 respectively.
| Characteristic | Number | Measure |
| Per Capita Income | 2,460 | $37,971 |
| Median Family Income | 672 | $74,745 |
| Mean Family Income | 672 | $100,681 |
| Median Household Income | 922 | $84,423 |
| Mean Household Income | 922 | $95,822 |
| Income Deficit | 672 | $0 |
| Wage / Income Gap (%) | 2,460 | 0.00% |
| Wage / Income Gap ($) | 2,460 | 100.00¢ per $1 |
| Gini / Inequality Index | 2,460 | 0.37 |
Earnings by Sex in Presidential Lakes Estates
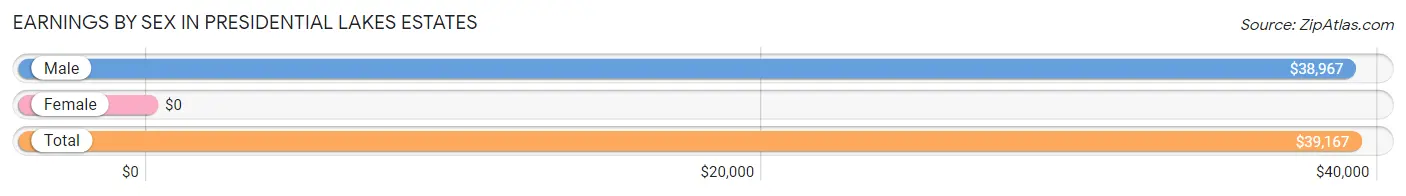
| Sex | Number | Average Earnings |
| Male | 966 (68.5%) | $38,967 |
| Female | 444 (31.5%) | $0 |
| Total | 1,410 (100.0%) | $39,167 |
Earnings by Sex by Income Bracket in Presidential Lakes Estates
The most common earnings brackets in Presidential Lakes Estates are $35,000 to $39,999 for men (177 | 18.3%) and $100,000+ for women (135 | 30.4%).
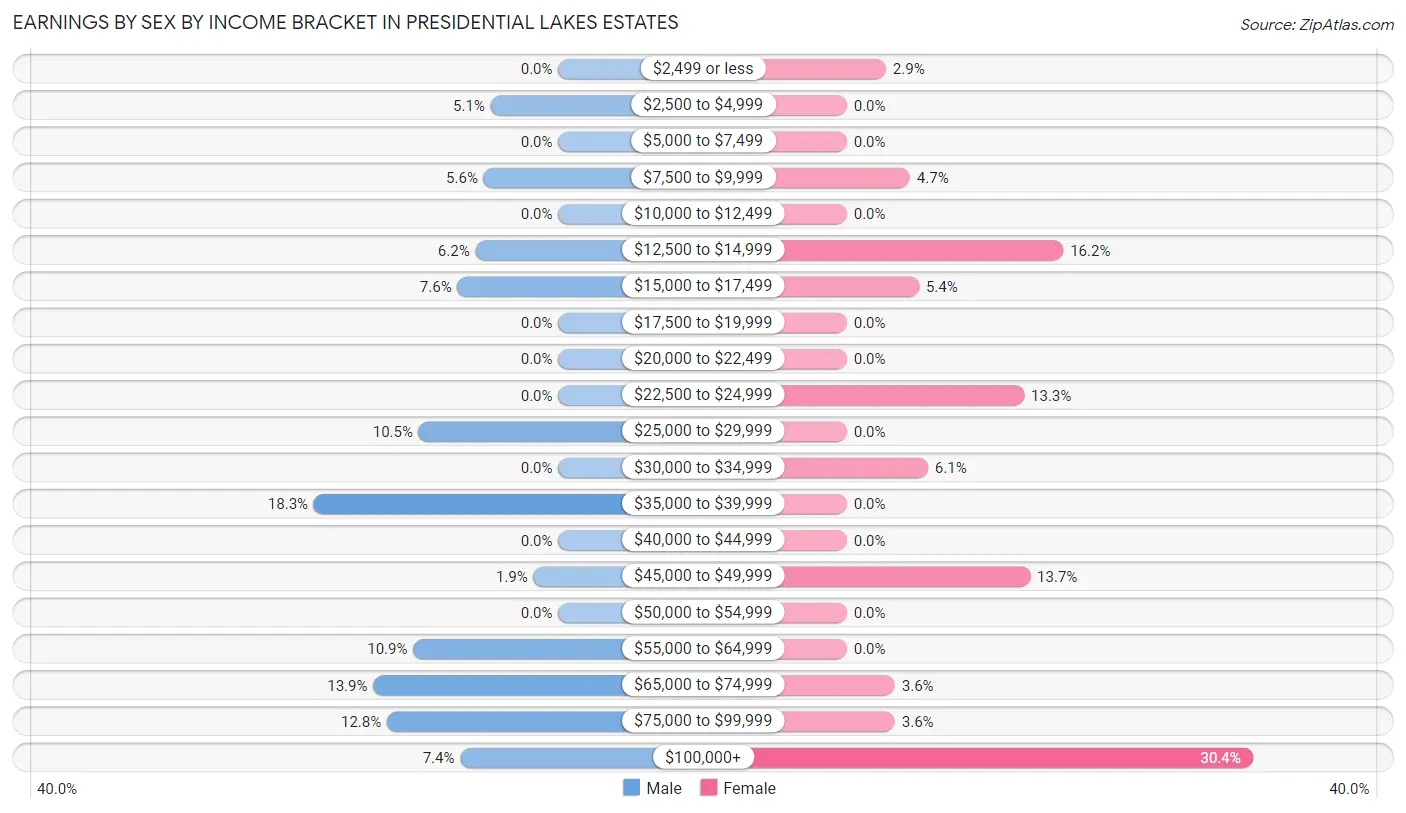
| Income | Male | Female |
| $2,499 or less | 0 (0.0%) | 13 (2.9%) |
| $2,500 to $4,999 | 49 (5.1%) | 0 (0.0%) |
| $5,000 to $7,499 | 0 (0.0%) | 0 (0.0%) |
| $7,500 to $9,999 | 54 (5.6%) | 21 (4.7%) |
| $10,000 to $12,499 | 0 (0.0%) | 0 (0.0%) |
| $12,500 to $14,999 | 60 (6.2%) | 72 (16.2%) |
| $15,000 to $17,499 | 73 (7.6%) | 24 (5.4%) |
| $17,500 to $19,999 | 0 (0.0%) | 0 (0.0%) |
| $20,000 to $22,499 | 0 (0.0%) | 0 (0.0%) |
| $22,500 to $24,999 | 0 (0.0%) | 59 (13.3%) |
| $25,000 to $29,999 | 101 (10.5%) | 0 (0.0%) |
| $30,000 to $34,999 | 0 (0.0%) | 27 (6.1%) |
| $35,000 to $39,999 | 177 (18.3%) | 0 (0.0%) |
| $40,000 to $44,999 | 0 (0.0%) | 0 (0.0%) |
| $45,000 to $49,999 | 18 (1.9%) | 61 (13.7%) |
| $50,000 to $54,999 | 0 (0.0%) | 0 (0.0%) |
| $55,000 to $64,999 | 105 (10.9%) | 0 (0.0%) |
| $65,000 to $74,999 | 134 (13.9%) | 16 (3.6%) |
| $75,000 to $99,999 | 124 (12.8%) | 16 (3.6%) |
| $100,000+ | 71 (7.3%) | 135 (30.4%) |
| Total | 966 (100.0%) | 444 (100.0%) |
Earnings by Sex by Educational Attainment in Presidential Lakes Estates
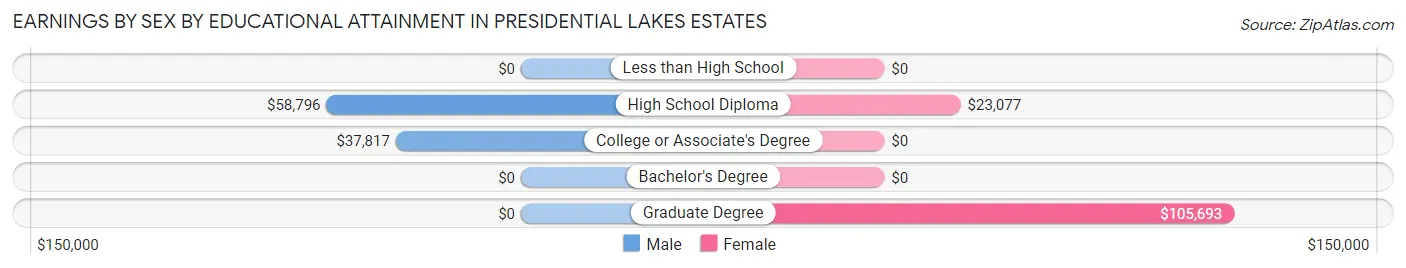
| Educational Attainment | Male Income | Female Income |
| Less than High School | - | - |
| High School Diploma | $58,796 | $23,077 |
| College or Associate's Degree | $37,817 | $0 |
| Bachelor's Degree | - | - |
| Graduate Degree | - | - |
| Total | $39,467 | $0 |
Family Income in Presidential Lakes Estates
Family Income Brackets in Presidential Lakes Estates
According to the Presidential Lakes Estates family income data, there are 167 families falling into the $50,000 to $74,999 income range, which is the most common income bracket and makes up 24.8% of all families.
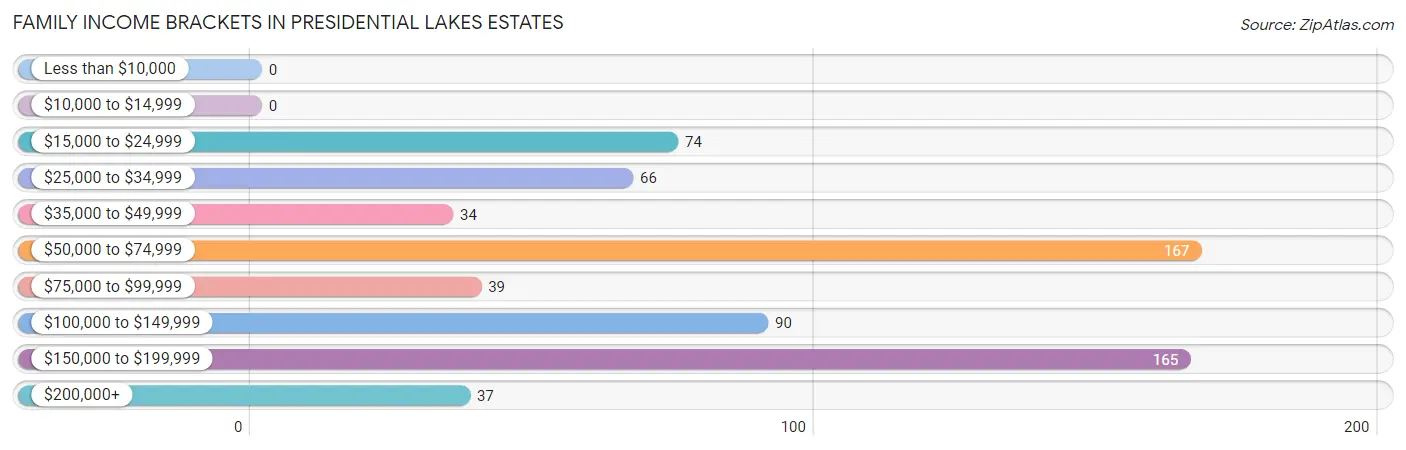
| Income Bracket | # Families | % Families |
| Less than $10,000 | 0 | 0.0% |
| $10,000 to $14,999 | 0 | 0.0% |
| $15,000 to $24,999 | 74 | 11.0% |
| $25,000 to $34,999 | 66 | 9.8% |
| $35,000 to $49,999 | 34 | 5.1% |
| $50,000 to $74,999 | 167 | 24.9% |
| $75,000 to $99,999 | 39 | 5.8% |
| $100,000 to $149,999 | 90 | 13.4% |
| $150,000 to $199,999 | 165 | 24.6% |
| $200,000+ | 37 | 5.5% |
Family Income by Famaliy Size in Presidential Lakes Estates
2-person families (418 | 62.2%) account for the highest median family income in Presidential Lakes Estates with $74,388 per family, while 2-person families (418 | 62.2%) have the highest median income of $37,194 per family member.
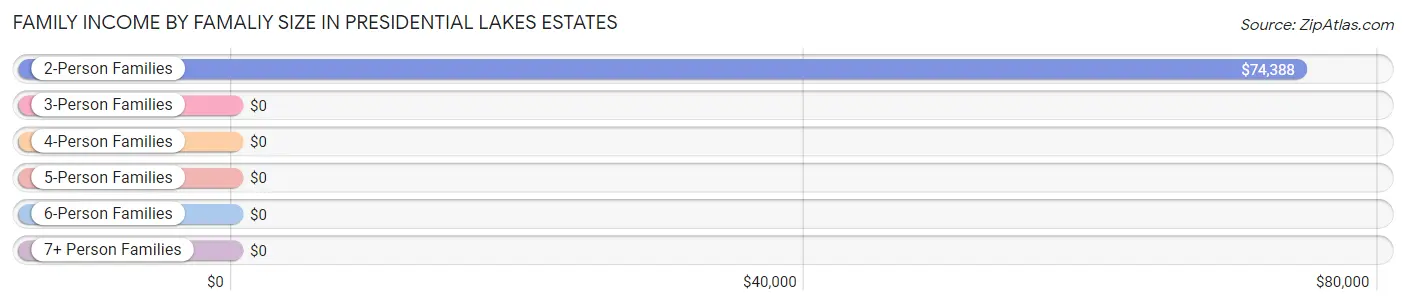
| Income Bracket | # Families | Median Income |
| 2-Person Families | 418 (62.2%) | $74,388 |
| 3-Person Families | 104 (15.5%) | $0 |
| 4-Person Families | 72 (10.7%) | $0 |
| 5-Person Families | 0 (0.0%) | $0 |
| 6-Person Families | 59 (8.8%) | $0 |
| 7+ Person Families | 19 (2.8%) | $0 |
| Total | 672 (100.0%) | $74,745 |
Family Income by Number of Earners in Presidential Lakes Estates
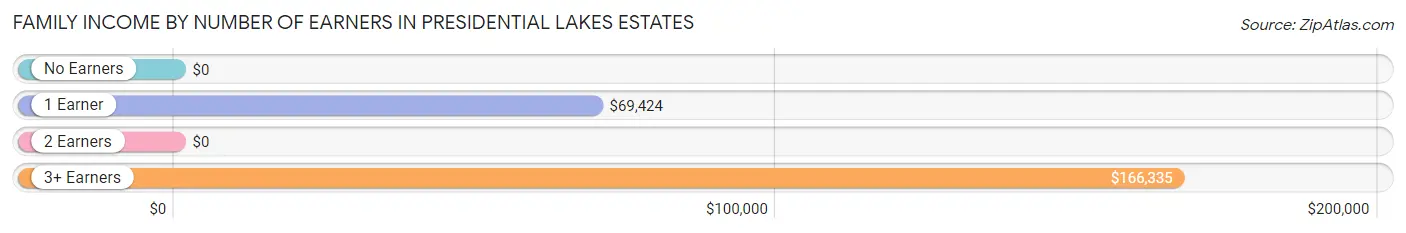
| Number of Earners | # Families | Median Income |
| No Earners | 104 (15.5%) | $0 |
| 1 Earner | 295 (43.9%) | $69,424 |
| 2 Earners | 158 (23.5%) | $0 |
| 3+ Earners | 115 (17.1%) | $166,335 |
| Total | 672 (100.0%) | $74,745 |
Household Income in Presidential Lakes Estates
Household Income Brackets in Presidential Lakes Estates
With 221 households falling in the category, the $100,000 to $149,999 income range is the most frequent in Presidential Lakes Estates, accounting for 24.0% of all households.
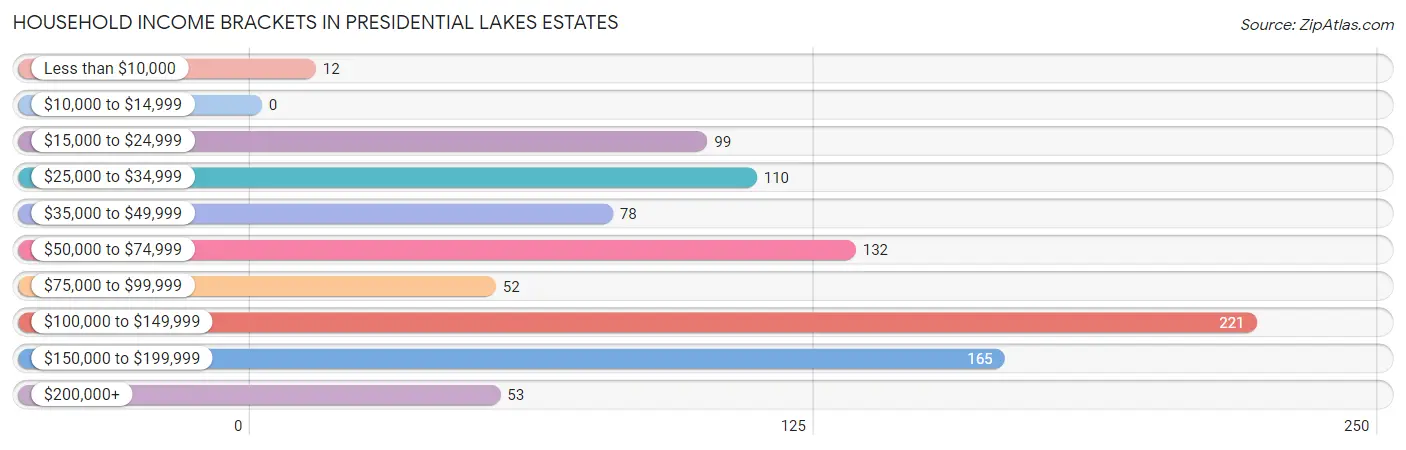
| Income Bracket | # Households | % Households |
| Less than $10,000 | 12 | 1.3% |
| $10,000 to $14,999 | 0 | 0.0% |
| $15,000 to $24,999 | 99 | 10.7% |
| $25,000 to $34,999 | 110 | 11.9% |
| $35,000 to $49,999 | 78 | 8.5% |
| $50,000 to $74,999 | 132 | 14.3% |
| $75,000 to $99,999 | 52 | 5.6% |
| $100,000 to $149,999 | 221 | 24.0% |
| $150,000 to $199,999 | 165 | 17.9% |
| $200,000+ | 53 | 5.7% |
Household Income by Householder Age in Presidential Lakes Estates
The median household income in Presidential Lakes Estates is $84,423, with the highest median household income of $149,844 found in the 45 to 64 years age bracket for the primary householder. A total of 372 households (40.4%) fall into this category. Meanwhile, the 15 to 24 years age bracket for the primary householder has the lowest median household income of $0, with 24 households (2.6%) in this group.
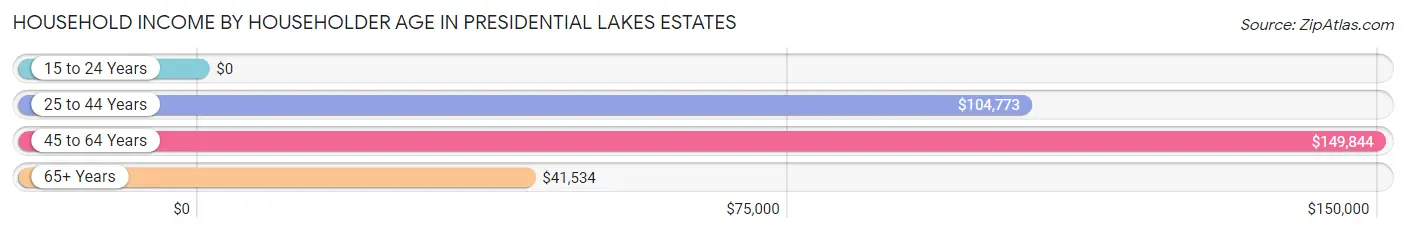
| Income Bracket | # Households | Median Income |
| 15 to 24 Years | 24 (2.6%) | $0 |
| 25 to 44 Years | 230 (24.9%) | $104,773 |
| 45 to 64 Years | 372 (40.4%) | $149,844 |
| 65+ Years | 296 (32.1%) | $41,534 |
| Total | 922 (100.0%) | $84,423 |
Poverty in Presidential Lakes Estates
Income Below Poverty by Sex and Age in Presidential Lakes Estates
With 5.3% poverty level for males and 13.8% for females among the residents of Presidential Lakes Estates, 45 to 54 year old males and 6 to 11 year old females are the most vulnerable to poverty, with 74 males (74.8%) and 68 females (60.7%) in their respective age groups living below the poverty level.
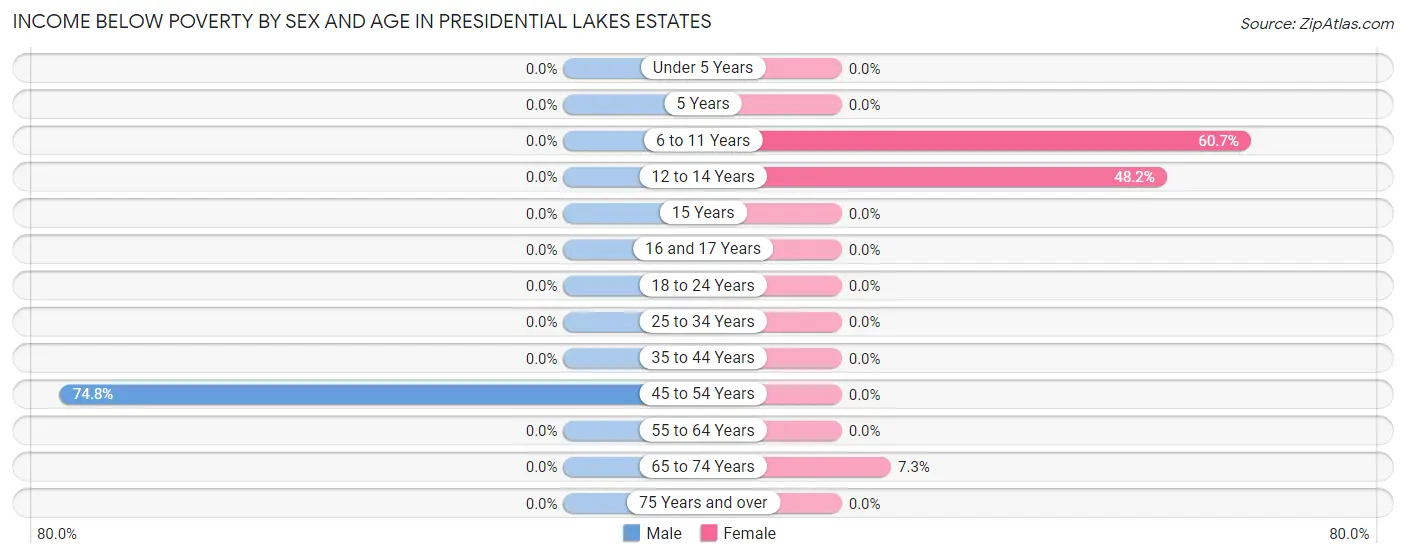
| Age Bracket | Male | Female |
| Under 5 Years | 0 (0.0%) | 0 (0.0%) |
| 5 Years | 0 (0.0%) | 0 (0.0%) |
| 6 to 11 Years | 0 (0.0%) | 68 (60.7%) |
| 12 to 14 Years | 0 (0.0%) | 68 (48.2%) |
| 15 Years | 0 (0.0%) | 0 (0.0%) |
| 16 and 17 Years | 0 (0.0%) | 0 (0.0%) |
| 18 to 24 Years | 0 (0.0%) | 0 (0.0%) |
| 25 to 34 Years | 0 (0.0%) | 0 (0.0%) |
| 35 to 44 Years | 0 (0.0%) | 0 (0.0%) |
| 45 to 54 Years | 74 (74.8%) | 0 (0.0%) |
| 55 to 64 Years | 0 (0.0%) | 0 (0.0%) |
| 65 to 74 Years | 0 (0.0%) | 12 (7.3%) |
| 75 Years and over | 0 (0.0%) | 0 (0.0%) |
| Total | 74 (5.3%) | 148 (13.8%) |
Income Above Poverty by Sex and Age in Presidential Lakes Estates
According to the poverty statistics in Presidential Lakes Estates, males aged under 5 years and females aged under 5 years are the age groups that are most secure financially, with 100.0% of males and 100.0% of females in these age groups living above the poverty line.
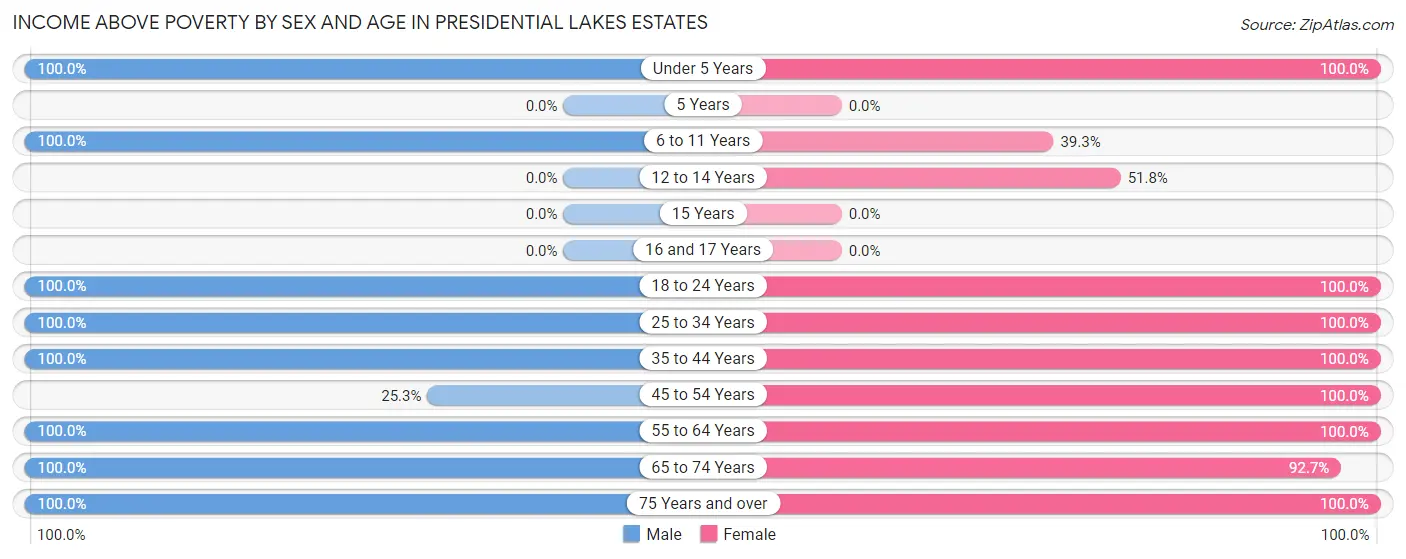
| Age Bracket | Male | Female |
| Under 5 Years | 20 (100.0%) | 62 (100.0%) |
| 5 Years | 0 (0.0%) | 0 (0.0%) |
| 6 to 11 Years | 69 (100.0%) | 44 (39.3%) |
| 12 to 14 Years | 0 (0.0%) | 73 (51.8%) |
| 15 Years | 0 (0.0%) | 0 (0.0%) |
| 16 and 17 Years | 0 (0.0%) | 0 (0.0%) |
| 18 to 24 Years | 78 (100.0%) | 98 (100.0%) |
| 25 to 34 Years | 316 (100.0%) | 67 (100.0%) |
| 35 to 44 Years | 299 (100.0%) | 16 (100.0%) |
| 45 to 54 Years | 25 (25.3%) | 137 (100.0%) |
| 55 to 64 Years | 228 (100.0%) | 210 (100.0%) |
| 65 to 74 Years | 133 (100.0%) | 152 (92.7%) |
| 75 Years and over | 146 (100.0%) | 65 (100.0%) |
| Total | 1,314 (94.7%) | 924 (86.2%) |
Income Below Poverty Among Married-Couple Families in Presidential Lakes Estates
| Children | Above Poverty | Below Poverty |
| No Children | 365 (100.0%) | 0 (0.0%) |
| 1 or 2 Children | 83 (100.0%) | 0 (0.0%) |
| 3 or 4 Children | 19 (100.0%) | 0 (0.0%) |
| 5 or more Children | 0 (0.0%) | 0 (0.0%) |
| Total | 467 (100.0%) | 0 (0.0%) |
Income Below Poverty Among Single-Parent Households in Presidential Lakes Estates
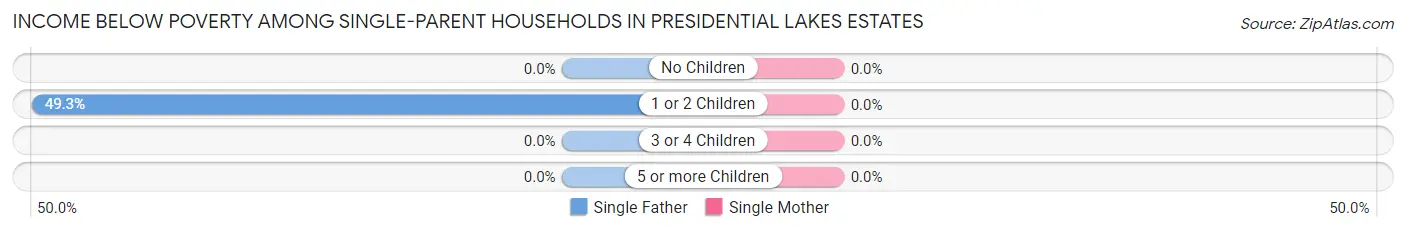
| Children | Single Father | Single Mother |
| No Children | 0 (0.0%) | 0 (0.0%) |
| 1 or 2 Children | 74 (49.3%) | 0 (0.0%) |
| 3 or 4 Children | 0 (0.0%) | 0 (0.0%) |
| 5 or more Children | 0 (0.0%) | 0 (0.0%) |
| Total | 74 (36.1%) | 0 (0.0%) |
Income Below Poverty Among Married-Couple vs Single-Parent Households in Presidential Lakes Estates
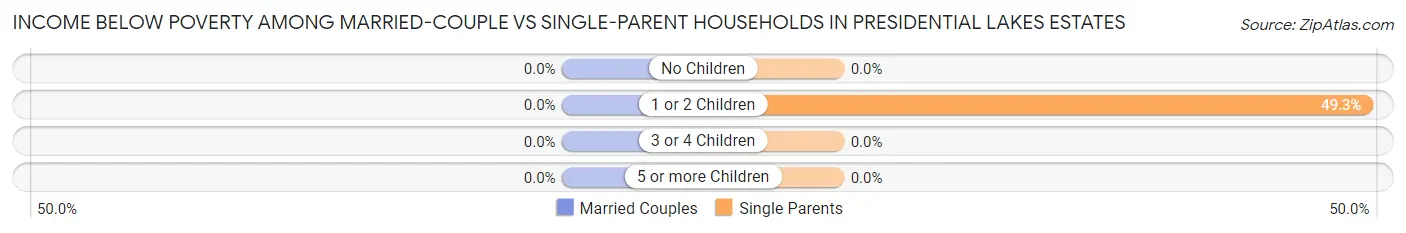
| Children | Married-Couple Families | Single-Parent Households |
| No Children | 0 (0.0%) | 0 (0.0%) |
| 1 or 2 Children | 0 (0.0%) | 74 (49.3%) |
| 3 or 4 Children | 0 (0.0%) | 0 (0.0%) |
| 5 or more Children | 0 (0.0%) | 0 (0.0%) |
| Total | 0 (0.0%) | 74 (36.1%) |
Race in Presidential Lakes Estates
The most populous races in Presidential Lakes Estates are White / Caucasian (1,643 | 66.8%), Hispanic or Latino (542 | 22.0%), and Some other Race (467 | 19.0%).
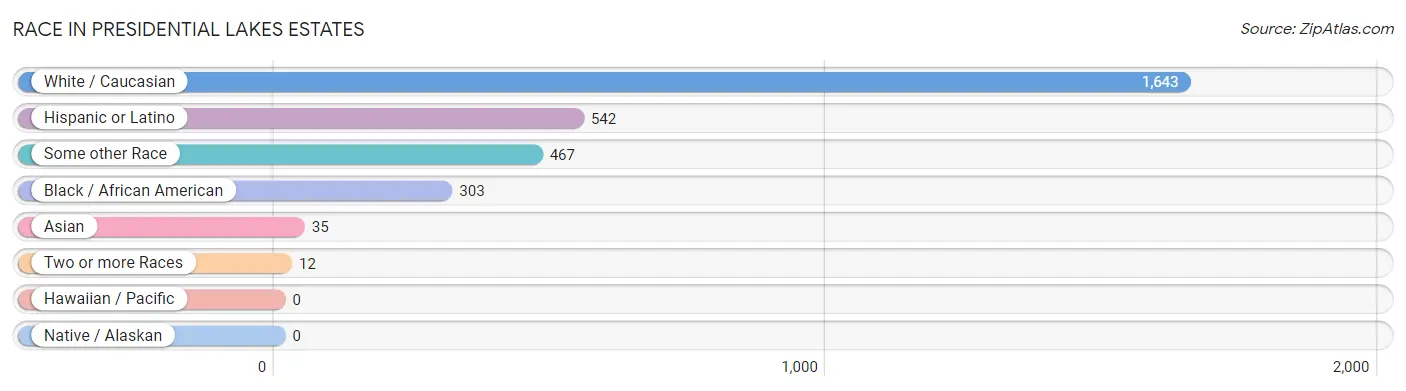
| Race | # Population | % Population |
| Asian | 35 | 1.4% |
| Black / African American | 303 | 12.3% |
| Hawaiian / Pacific | 0 | 0.0% |
| Hispanic or Latino | 542 | 22.0% |
| Native / Alaskan | 0 | 0.0% |
| White / Caucasian | 1,643 | 66.8% |
| Two or more Races | 12 | 0.5% |
| Some other Race | 467 | 19.0% |
| Total | 2,460 | 100.0% |
Ancestry in Presidential Lakes Estates
The most populous ancestries reported in Presidential Lakes Estates are Puerto Rican (542 | 22.0%), Irish (488 | 19.8%), German (458 | 18.6%), Italian (355 | 14.4%), and African (153 | 6.2%), together accounting for 81.1% of all Presidential Lakes Estates residents.
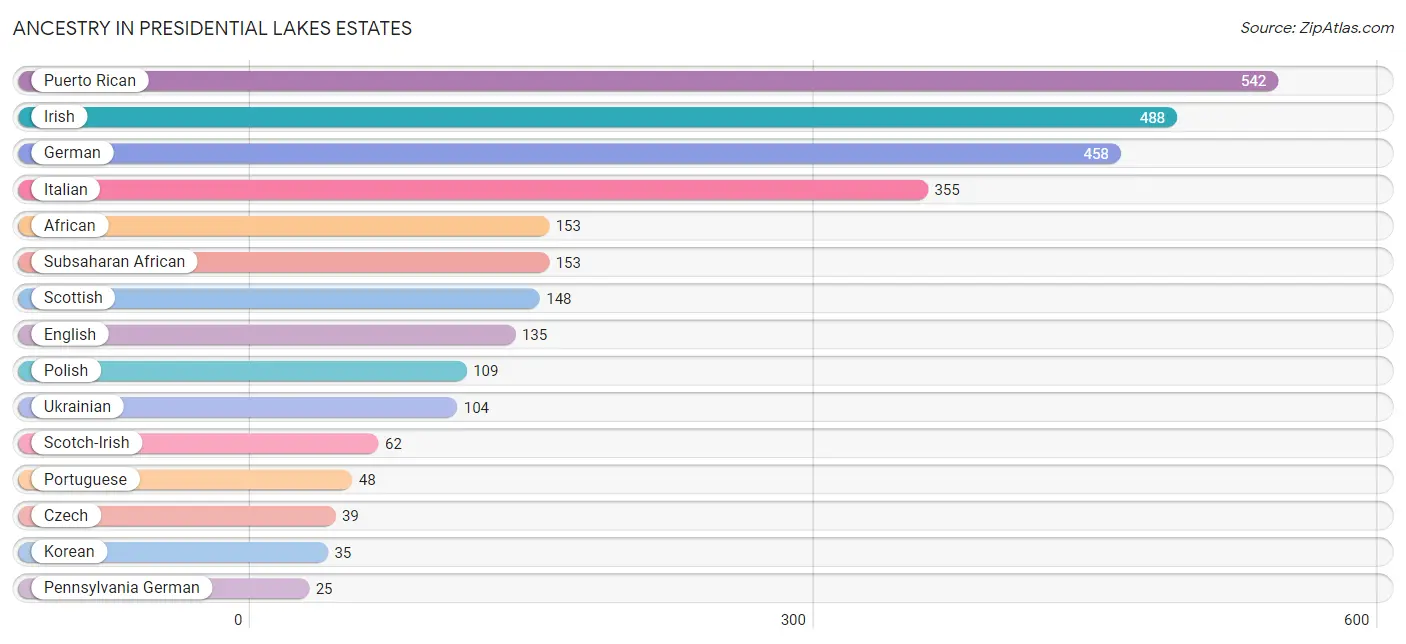
| Ancestry | # Population | % Population |
| African | 153 | 6.2% |
| Czech | 39 | 1.6% |
| English | 135 | 5.5% |
| European | 21 | 0.9% |
| German | 458 | 18.6% |
| Greek | 14 | 0.6% |
| Irish | 488 | 19.8% |
| Italian | 355 | 14.4% |
| Korean | 35 | 1.4% |
| Pennsylvania German | 25 | 1.0% |
| Polish | 109 | 4.4% |
| Portuguese | 48 | 1.9% |
| Puerto Rican | 542 | 22.0% |
| Russian | 25 | 1.0% |
| Scotch-Irish | 62 | 2.5% |
| Scottish | 148 | 6.0% |
| Slovak | 13 | 0.5% |
| Subsaharan African | 153 | 6.2% |
| Swiss | 7 | 0.3% |
| Ukrainian | 104 | 4.2% | View All 20 Rows |
Immigrants in Presidential Lakes Estates
The most numerous immigrant groups reported in Presidential Lakes Estates came from Europe (84 | 3.4%), Africa (83 | 3.4%), Sierra Leone (83 | 3.4%), Western Africa (83 | 3.4%), and England (70 | 2.9%), together accounting for 16.4% of all Presidential Lakes Estates residents.
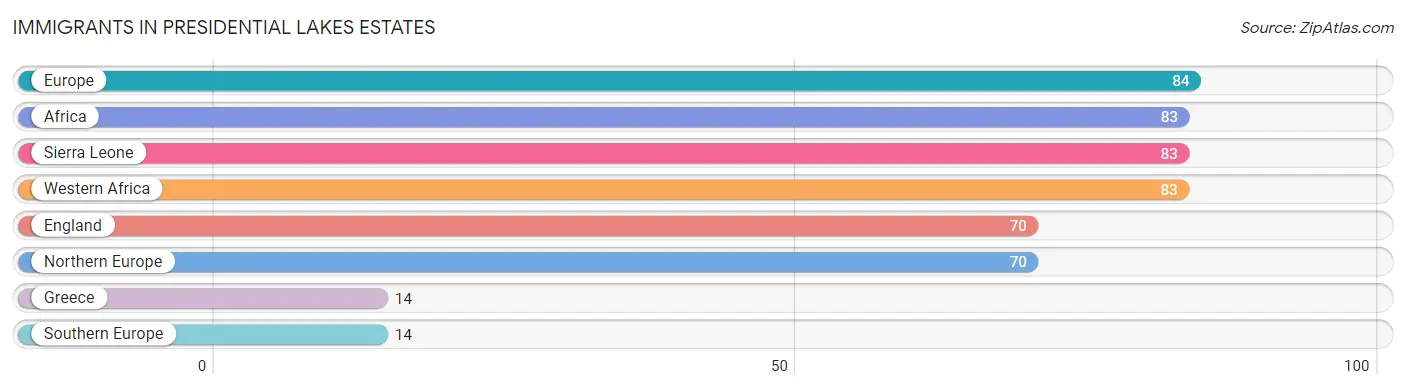
| Immigration Origin | # Population | % Population |
| Africa | 83 | 3.4% |
| England | 70 | 2.9% |
| Europe | 84 | 3.4% |
| Greece | 14 | 0.6% |
| Northern Europe | 70 | 2.9% |
| Sierra Leone | 83 | 3.4% |
| Southern Europe | 14 | 0.6% |
| Western Africa | 83 | 3.4% | View All 8 Rows |
Sex and Age in Presidential Lakes Estates
Sex and Age in Presidential Lakes Estates
The most populous age groups in Presidential Lakes Estates are 40 to 44 Years (181 | 13.0%) for men and 10 to 14 Years (163 | 15.2%) for women.
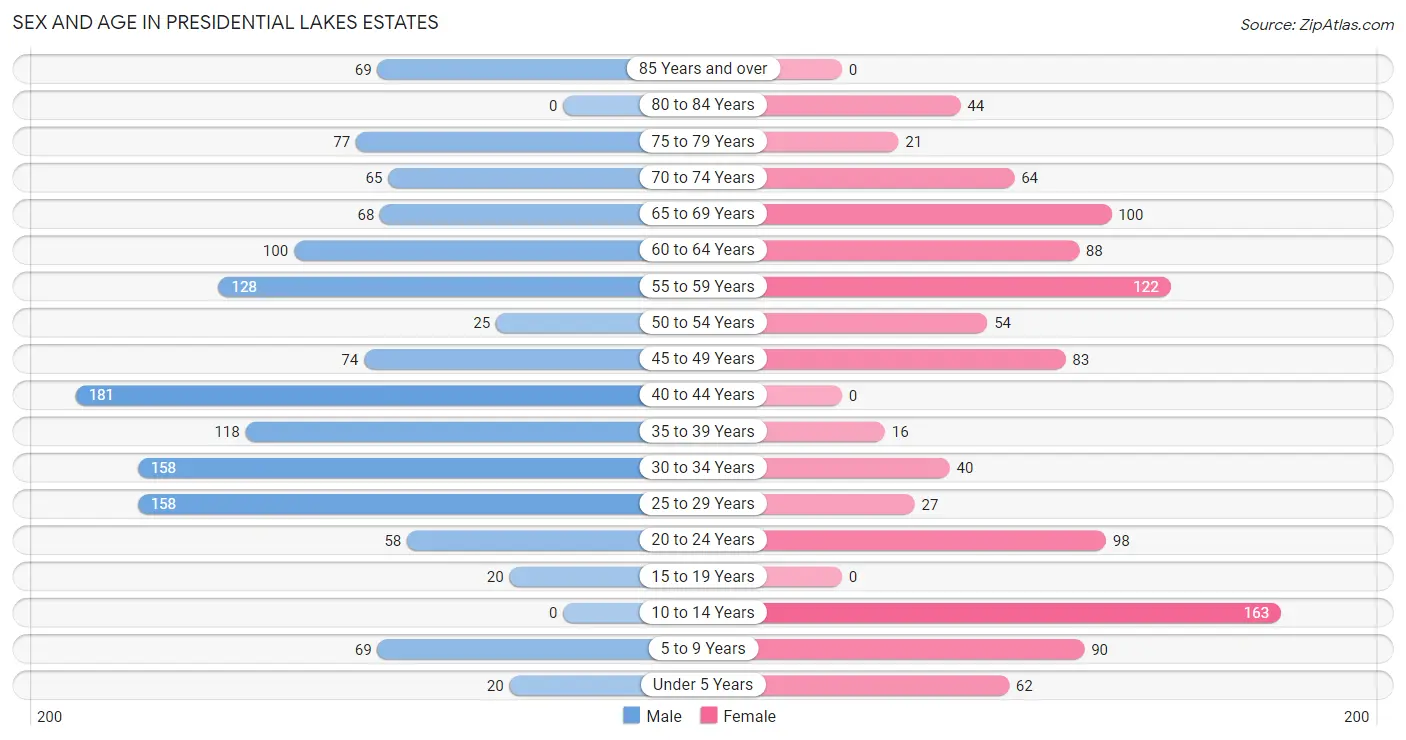
| Age Bracket | Male | Female |
| Under 5 Years | 20 (1.4%) | 62 (5.8%) |
| 5 to 9 Years | 69 (5.0%) | 90 (8.4%) |
| 10 to 14 Years | 0 (0.0%) | 163 (15.2%) |
| 15 to 19 Years | 20 (1.4%) | 0 (0.0%) |
| 20 to 24 Years | 58 (4.2%) | 98 (9.1%) |
| 25 to 29 Years | 158 (11.4%) | 27 (2.5%) |
| 30 to 34 Years | 158 (11.4%) | 40 (3.7%) |
| 35 to 39 Years | 118 (8.5%) | 16 (1.5%) |
| 40 to 44 Years | 181 (13.0%) | 0 (0.0%) |
| 45 to 49 Years | 74 (5.3%) | 83 (7.7%) |
| 50 to 54 Years | 25 (1.8%) | 54 (5.0%) |
| 55 to 59 Years | 128 (9.2%) | 122 (11.4%) |
| 60 to 64 Years | 100 (7.2%) | 88 (8.2%) |
| 65 to 69 Years | 68 (4.9%) | 100 (9.3%) |
| 70 to 74 Years | 65 (4.7%) | 64 (6.0%) |
| 75 to 79 Years | 77 (5.6%) | 21 (2.0%) |
| 80 to 84 Years | 0 (0.0%) | 44 (4.1%) |
| 85 Years and over | 69 (5.0%) | 0 (0.0%) |
| Total | 1,388 (100.0%) | 1,072 (100.0%) |
Families and Households in Presidential Lakes Estates
Median Family Size in Presidential Lakes Estates
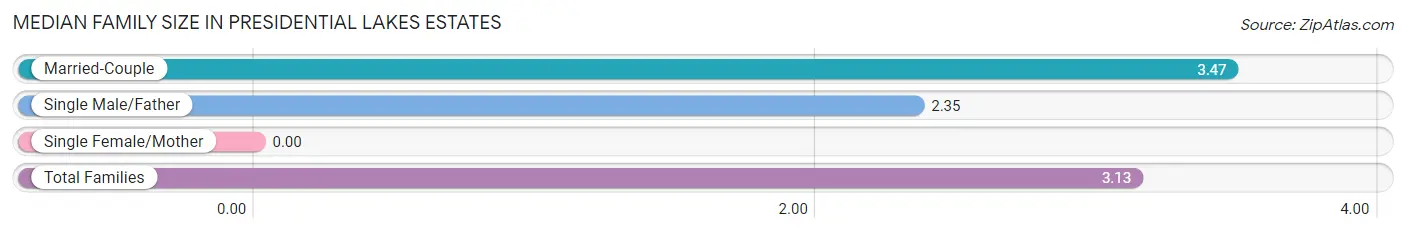
| Family Type | # Families | Family Size |
| Married-Couple | 467 (69.5%) | 3.47 |
| Single Male/Father | 205 (30.5%) | 2.35 |
| Single Female/Mother | 0 (0.0%) | - |
| Total Families | 672 (100.0%) | 3.13 |
Median Household Size in Presidential Lakes Estates
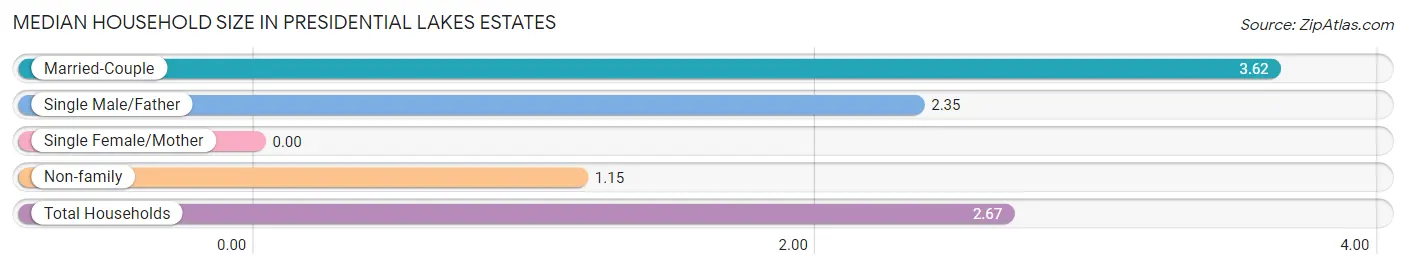
| Household Type | # Households | Household Size |
| Married-Couple | 467 (50.6%) | 3.62 |
| Single Male/Father | 205 (22.2%) | 2.35 |
| Single Female/Mother | 0 (0.0%) | - |
| Non-family | 250 (27.1%) | 1.15 |
| Total Households | 922 (100.0%) | 2.67 |
Household Size by Marriage Status in Presidential Lakes Estates
Out of a total of 922 households in Presidential Lakes Estates, 672 (72.9%) are family households, while 250 (27.1%) are nonfamily households. The most numerous type of family households are 2-person households, comprising 369, and the most common type of nonfamily households are 1-person households, comprising 212.
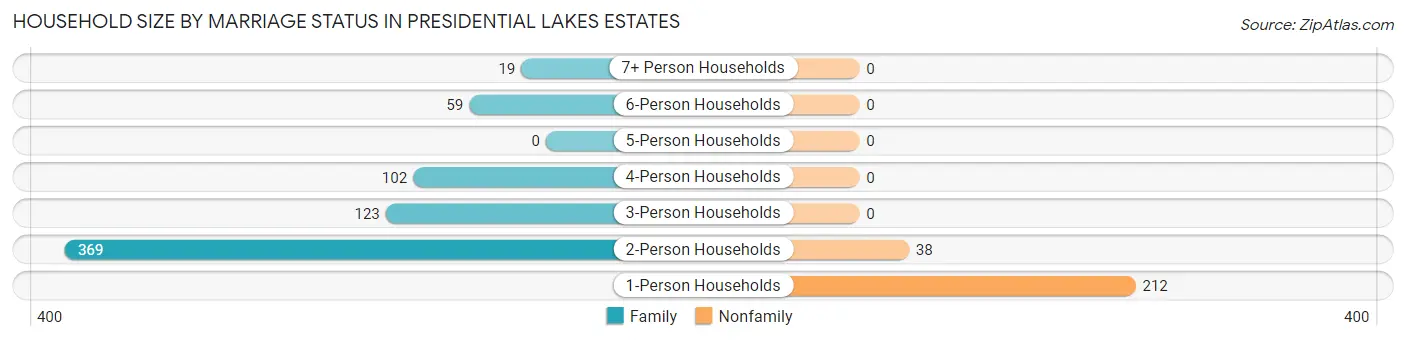
| Household Size | Family Households | Nonfamily Households |
| 1-Person Households | - | 212 (23.0%) |
| 2-Person Households | 369 (40.0%) | 38 (4.1%) |
| 3-Person Households | 123 (13.3%) | 0 (0.0%) |
| 4-Person Households | 102 (11.1%) | 0 (0.0%) |
| 5-Person Households | 0 (0.0%) | 0 (0.0%) |
| 6-Person Households | 59 (6.4%) | 0 (0.0%) |
| 7+ Person Households | 19 (2.1%) | 0 (0.0%) |
| Total | 672 (72.9%) | 250 (27.1%) |
Female Fertility in Presidential Lakes Estates
Fertility by Age in Presidential Lakes Estates
| Age Bracket | Women with Births | Births / 1,000 Women |
| 15 to 19 years | 0 (0.0%) | 0.0 |
| 20 to 34 years | 0 (0.0%) | 0.0 |
| 35 to 50 years | 0 (0.0%) | 0.0 |
| Total | 0 (0.0%) | 0.0 |
Fertility by Age by Marriage Status in Presidential Lakes Estates
| Age Bracket | Married | Unmarried |
| 15 to 19 years | 0 (0.0%) | 0 (0.0%) |
| 20 to 34 years | 0 (0.0%) | 0 (0.0%) |
| 35 to 50 years | 0 (0.0%) | 0 (0.0%) |
| Total | 0 (0.0%) | 0 (0.0%) |
Fertility by Education in Presidential Lakes Estates
| Educational Attainment | Women with Births | Births / 1,000 Women |
| Less than High School | 0 (0.0%) | 0.0 |
| High School Diploma | 0 (0.0%) | 0.0 |
| College or Associate's Degree | 0 (0.0%) | 0.0 |
| Bachelor's Degree | 0 (0.0%) | 0.0 |
| Graduate Degree | 0 (0.0%) | 0.0 |
| Total | 0 (0.0%) | 0.0 |
Fertility by Education by Marriage Status in Presidential Lakes Estates
| Educational Attainment | Married | Unmarried |
| Less than High School | 0 (0.0%) | 0 (0.0%) |
| High School Diploma | 0 (0.0%) | 0 (0.0%) |
| College or Associate's Degree | 0 (0.0%) | 0 (0.0%) |
| Bachelor's Degree | 0 (0.0%) | 0 (0.0%) |
| Graduate Degree | 0 (0.0%) | 0 (0.0%) |
| Total | 0 (0.0%) | 0 (0.0%) |
Employment Characteristics in Presidential Lakes Estates
Employment by Class of Employer in Presidential Lakes Estates
Among the 1,294 employed individuals in Presidential Lakes Estates, private company employees (585 | 45.2%), local government employees (253 | 19.6%), and federal government employees (222 | 17.2%) make up the most common classes of employment.
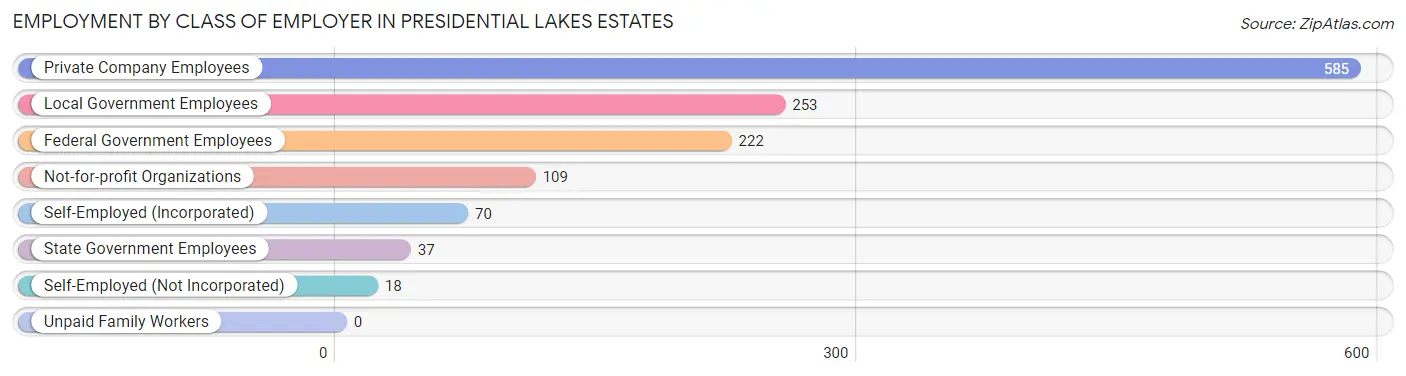
| Employer Class | # Employees | % Employees |
| Private Company Employees | 585 | 45.2% |
| Self-Employed (Incorporated) | 70 | 5.4% |
| Self-Employed (Not Incorporated) | 18 | 1.4% |
| Not-for-profit Organizations | 109 | 8.4% |
| Local Government Employees | 253 | 19.6% |
| State Government Employees | 37 | 2.9% |
| Federal Government Employees | 222 | 17.2% |
| Unpaid Family Workers | 0 | 0.0% |
| Total | 1,294 | 100.0% |
Employment Status by Age in Presidential Lakes Estates
According to the labor force statistics for Presidential Lakes Estates, out of the total population over 16 years of age (2,056), 70.7% or 1,454 individuals are in the labor force, with 12.6% or 183 of them unemployed. The age group with the highest labor force participation rate is 16 to 19 years, with 100.0% or 20 individuals in the labor force. Within the labor force, the 20 to 24 years age range has the highest percentage of unemployed individuals, with 63.0% or 98 of them being unemployed.
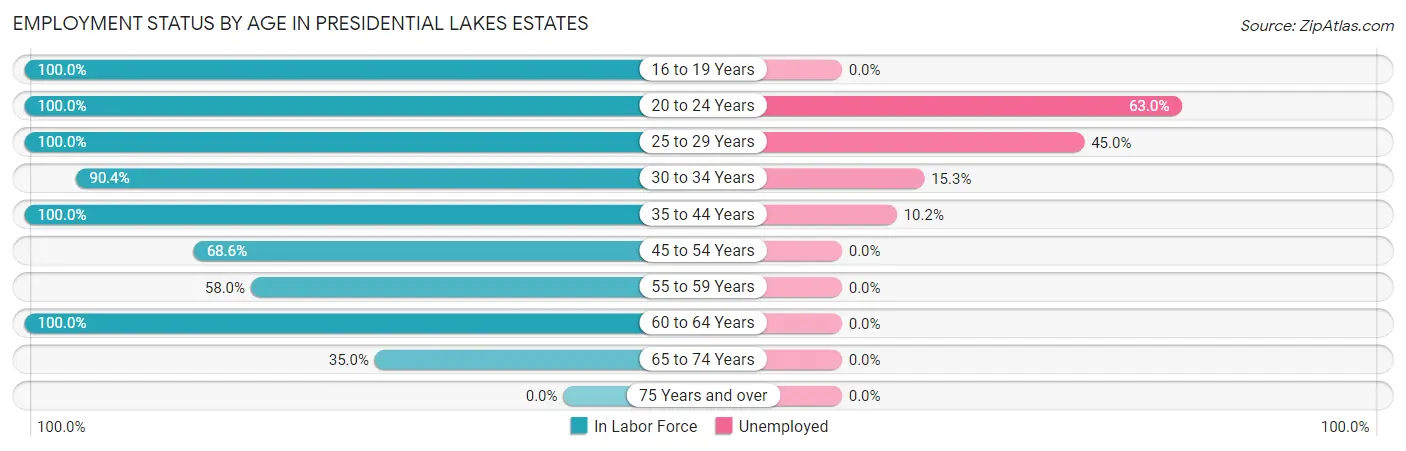
| Age Bracket | In Labor Force | Unemployed |
| 16 to 19 Years | 20 (100.0%) | 0 (0.0%) |
| 20 to 24 Years | 156 (100.0%) | 98 (63.0%) |
| 25 to 29 Years | 185 (100.0%) | 83 (45.0%) |
| 30 to 34 Years | 179 (90.4%) | 27 (15.3%) |
| 35 to 44 Years | 315 (100.0%) | 32 (10.2%) |
| 45 to 54 Years | 162 (68.6%) | 0 (0.0%) |
| 55 to 59 Years | 145 (58.0%) | 0 (0.0%) |
| 60 to 64 Years | 188 (100.0%) | 0 (0.0%) |
| 65 to 74 Years | 104 (35.0%) | 0 (0.0%) |
| 75 Years and over | 0 (0.0%) | 0 (0.0%) |
| Total | 1,454 (70.7%) | 183 (12.6%) |
Employment Status by Educational Attainment in Presidential Lakes Estates
According to labor force statistics for Presidential Lakes Estates, 85.6% of individuals (1,174) out of the total population between 25 and 64 years of age (1,372) are in the labor force, with 9.7% or 114 of them being unemployed. The group with the highest labor force participation rate are those with the educational attainment of bachelor's degree or higher, with 100.0% or 178 individuals in the labor force. Within the labor force, individuals with bachelor's degree or higher education have the highest percentage of unemployment, with 11.8% or 21 of them being unemployed.
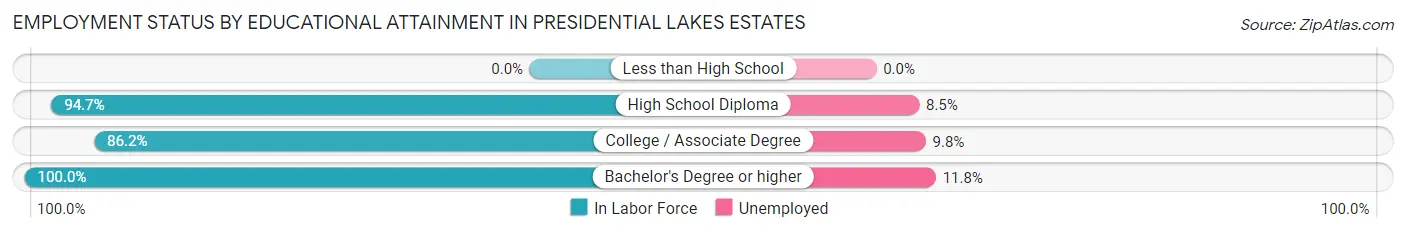
| Educational Attainment | In Labor Force | Unemployed |
| Less than High School | 0 (0.0%) | 0 (0.0%) |
| High School Diploma | 377 (94.7%) | 34 (8.5%) |
| College / Associate Degree | 619 (86.2%) | 70 (9.8%) |
| Bachelor's Degree or higher | 178 (100.0%) | 21 (11.8%) |
| Total | 1,174 (85.6%) | 133 (9.7%) |
Employment Occupations by Sex in Presidential Lakes Estates
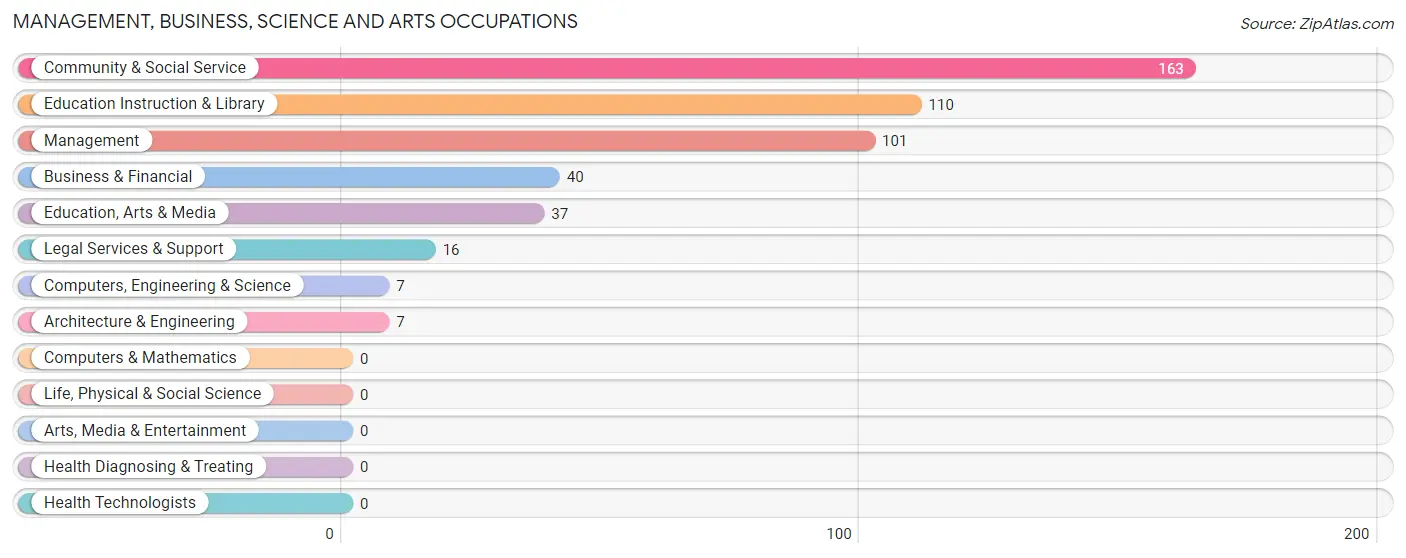
Management, Business, Science and Arts Occupations
The most common Management, Business, Science and Arts occupations in Presidential Lakes Estates are Community & Social Service (163 | 14.7%), Education Instruction & Library (110 | 9.9%), Management (101 | 9.1%), Business & Financial (40 | 3.6%), and Education, Arts & Media (37 | 3.3%).
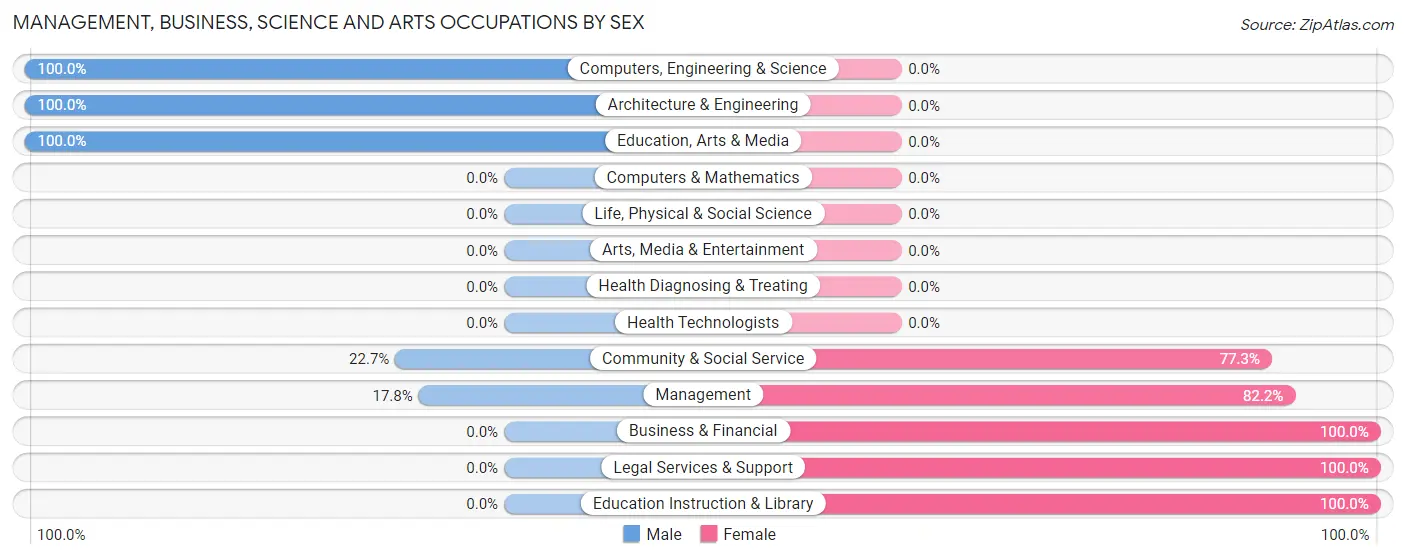
Management, Business, Science and Arts Occupations by Sex
Within the Management, Business, Science and Arts occupations in Presidential Lakes Estates, the most male-oriented occupations are Computers, Engineering & Science (100.0%), Architecture & Engineering (100.0%), and Education, Arts & Media (100.0%), while the most female-oriented occupations are Business & Financial (100.0%), Legal Services & Support (100.0%), and Education Instruction & Library (100.0%).
| Occupation | Male | Female |
| Management | 18 (17.8%) | 83 (82.2%) |
| Business & Financial | 0 (0.0%) | 40 (100.0%) |
| Computers, Engineering & Science | 7 (100.0%) | 0 (0.0%) |
| Computers & Mathematics | 0 (0.0%) | 0 (0.0%) |
| Architecture & Engineering | 7 (100.0%) | 0 (0.0%) |
| Life, Physical & Social Science | 0 (0.0%) | 0 (0.0%) |
| Community & Social Service | 37 (22.7%) | 126 (77.3%) |
| Education, Arts & Media | 37 (100.0%) | 0 (0.0%) |
| Legal Services & Support | 0 (0.0%) | 16 (100.0%) |
| Education Instruction & Library | 0 (0.0%) | 110 (100.0%) |
| Arts, Media & Entertainment | 0 (0.0%) | 0 (0.0%) |
| Health Diagnosing & Treating | 0 (0.0%) | 0 (0.0%) |
| Health Technologists | 0 (0.0%) | 0 (0.0%) |
| Total (Category) | 62 (19.9%) | 249 (80.1%) |
| Total (Overall) | 775 (69.7%) | 337 (30.3%) |
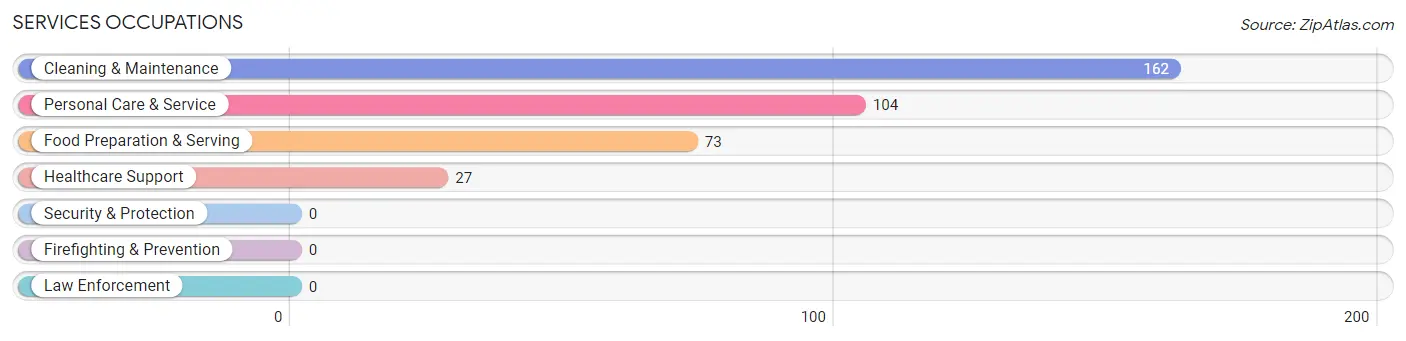
Services Occupations
The most common Services occupations in Presidential Lakes Estates are Cleaning & Maintenance (162 | 14.6%), Personal Care & Service (104 | 9.3%), Food Preparation & Serving (73 | 6.6%), and Healthcare Support (27 | 2.4%).
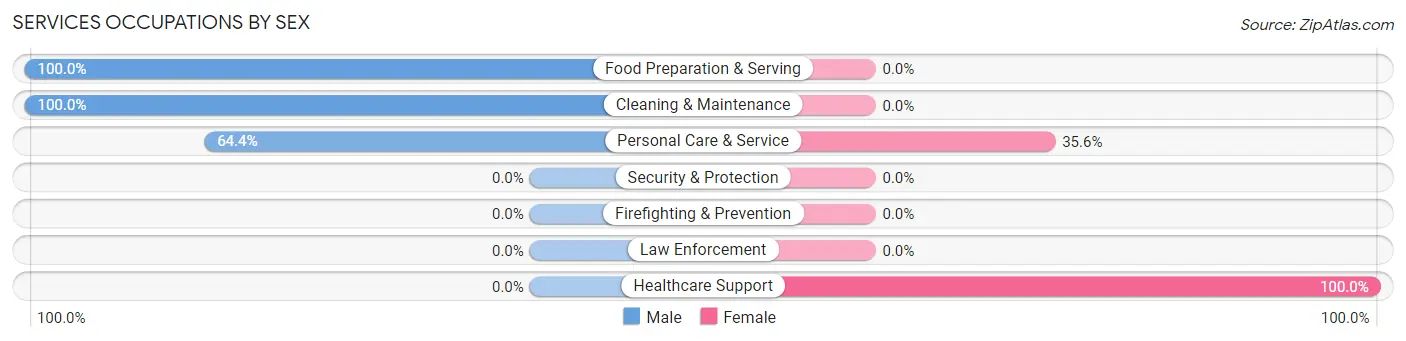
Services Occupations by Sex
Within the Services occupations in Presidential Lakes Estates, the most male-oriented occupations are Food Preparation & Serving (100.0%), Cleaning & Maintenance (100.0%), and Personal Care & Service (64.4%), while the most female-oriented occupations are Healthcare Support (100.0%), and Personal Care & Service (35.6%).
| Occupation | Male | Female |
| Healthcare Support | 0 (0.0%) | 27 (100.0%) |
| Security & Protection | 0 (0.0%) | 0 (0.0%) |
| Firefighting & Prevention | 0 (0.0%) | 0 (0.0%) |
| Law Enforcement | 0 (0.0%) | 0 (0.0%) |
| Food Preparation & Serving | 73 (100.0%) | 0 (0.0%) |
| Cleaning & Maintenance | 162 (100.0%) | 0 (0.0%) |
| Personal Care & Service | 67 (64.4%) | 37 (35.6%) |
| Total (Category) | 302 (82.5%) | 64 (17.5%) |
| Total (Overall) | 775 (69.7%) | 337 (30.3%) |
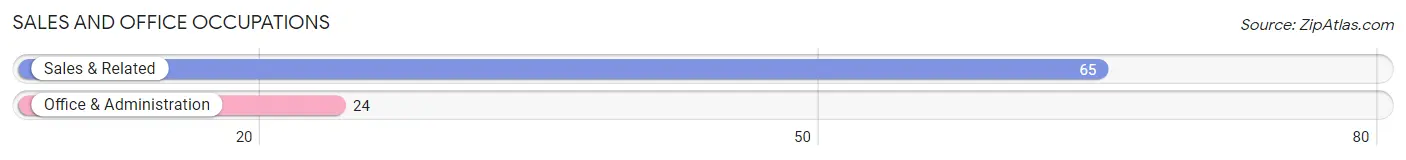
Sales and Office Occupations
The most common Sales and Office occupations in Presidential Lakes Estates are Sales & Related (65 | 5.9%), and Office & Administration (24 | 2.2%).
Sales and Office Occupations by Sex
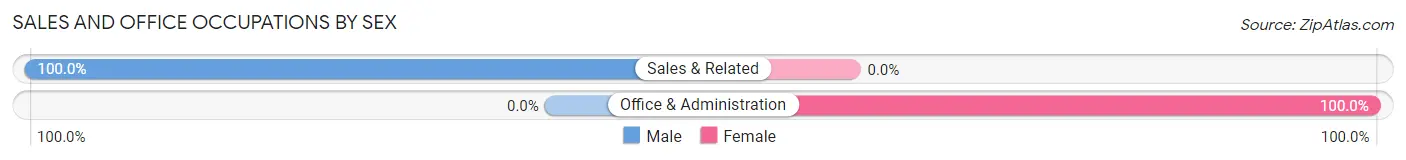
| Occupation | Male | Female |
| Sales & Related | 65 (100.0%) | 0 (0.0%) |
| Office & Administration | 0 (0.0%) | 24 (100.0%) |
| Total (Category) | 65 (73.0%) | 24 (27.0%) |
| Total (Overall) | 775 (69.7%) | 337 (30.3%) |
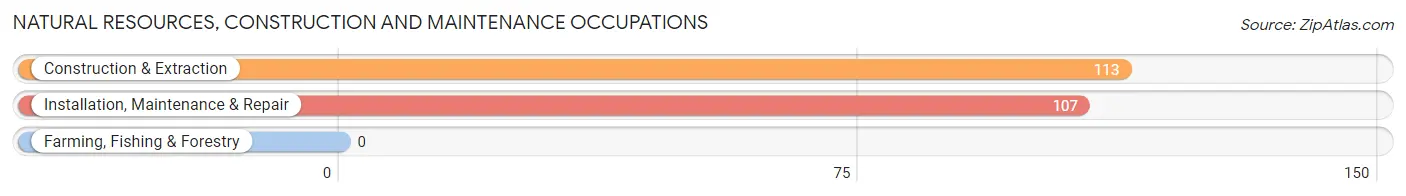
Natural Resources, Construction and Maintenance Occupations
The most common Natural Resources, Construction and Maintenance occupations in Presidential Lakes Estates are Construction & Extraction (113 | 10.2%), and Installation, Maintenance & Repair (107 | 9.6%).
Natural Resources, Construction and Maintenance Occupations by Sex
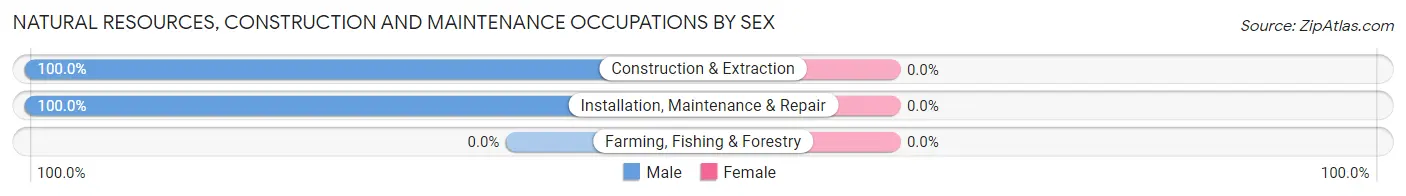
| Occupation | Male | Female |
| Farming, Fishing & Forestry | 0 (0.0%) | 0 (0.0%) |
| Construction & Extraction | 113 (100.0%) | 0 (0.0%) |
| Installation, Maintenance & Repair | 107 (100.0%) | 0 (0.0%) |
| Total (Category) | 220 (100.0%) | 0 (0.0%) |
| Total (Overall) | 775 (69.7%) | 337 (30.3%) |
Production, Transportation and Moving Occupations
The most common Production, Transportation and Moving occupations in Presidential Lakes Estates are Transportation (101 | 9.1%), and Production (25 | 2.2%).
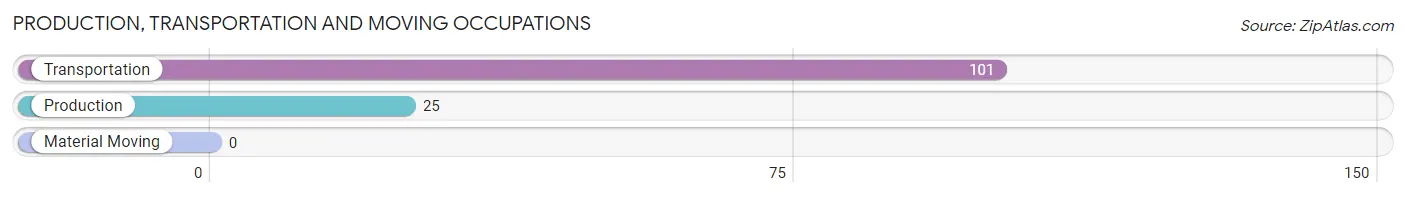
Production, Transportation and Moving Occupations by Sex
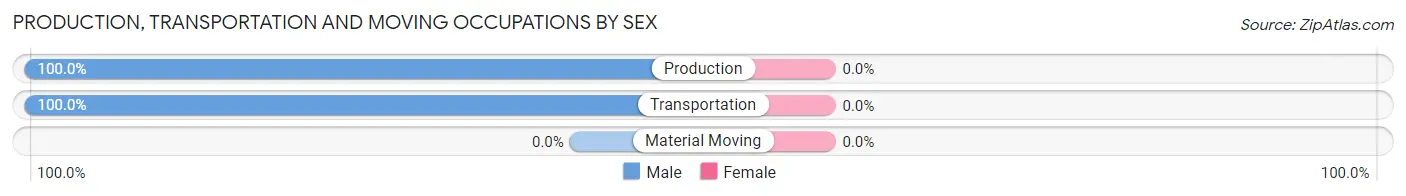
| Occupation | Male | Female |
| Production | 25 (100.0%) | 0 (0.0%) |
| Transportation | 101 (100.0%) | 0 (0.0%) |
| Material Moving | 0 (0.0%) | 0 (0.0%) |
| Total (Category) | 126 (100.0%) | 0 (0.0%) |
| Total (Overall) | 775 (69.7%) | 337 (30.3%) |
Employment Industries by Sex in Presidential Lakes Estates
Employment Industries in Presidential Lakes Estates
The major employment industries in Presidential Lakes Estates include Health Care & Social Assistance (223 | 20.1%), Arts, Entertainment & Recreation (169 | 15.2%), Construction (131 | 11.8%), Educational Services (131 | 11.8%), and Transportation & Warehousing (101 | 9.1%).
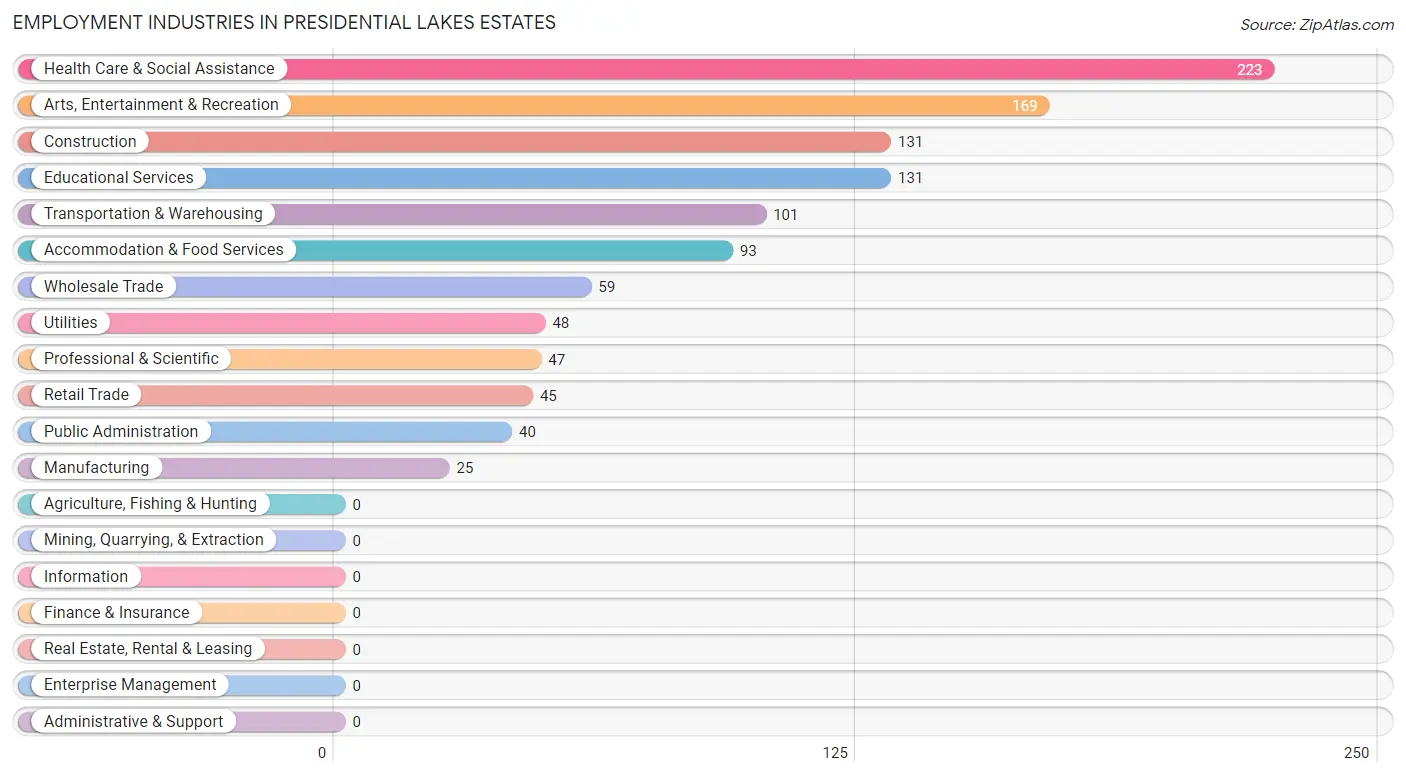
Employment Industries by Sex in Presidential Lakes Estates
The Presidential Lakes Estates industries that see more men than women are Construction (100.0%), Manufacturing (100.0%), and Wholesale Trade (100.0%), whereas the industries that tend to have a higher number of women are Educational Services (100.0%), Public Administration (100.0%), and Professional & Scientific (85.1%).
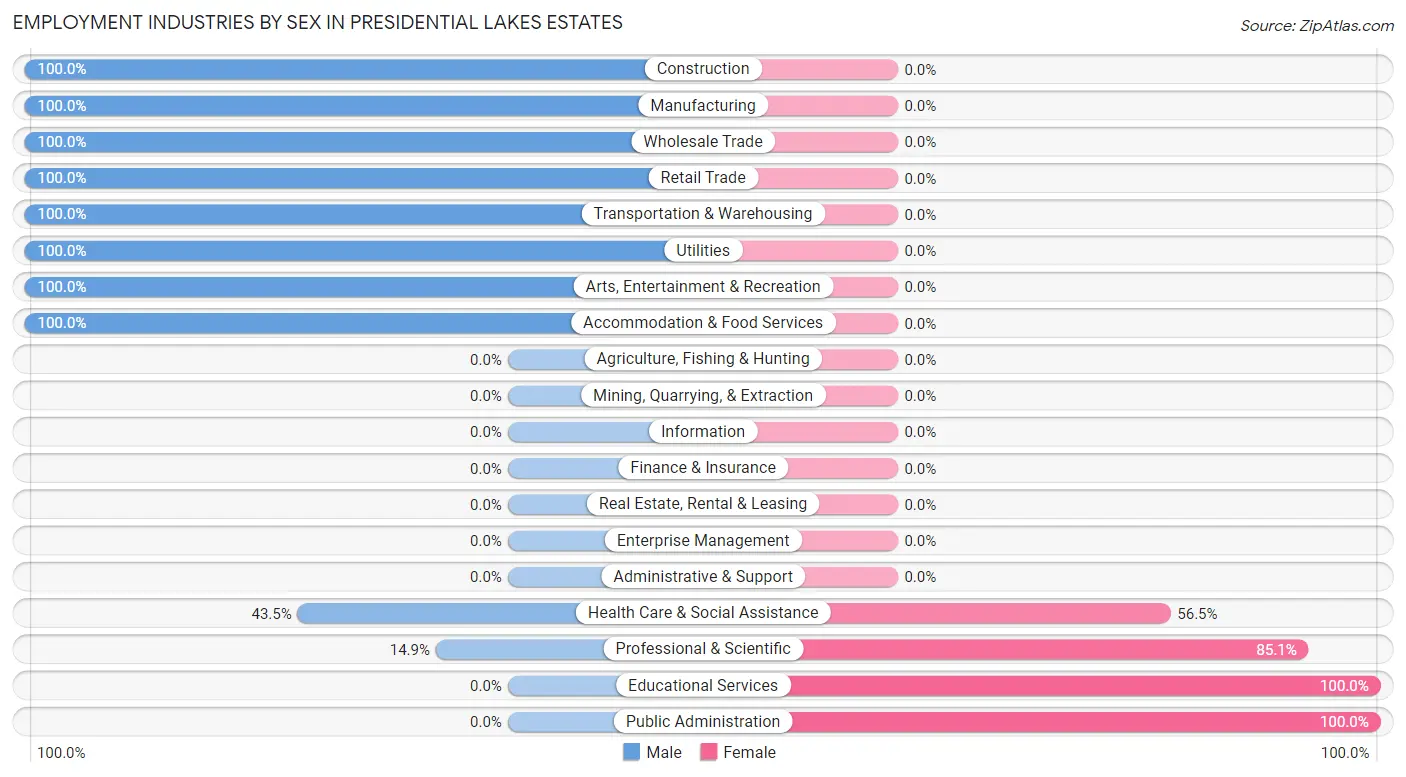
| Industry | Male | Female |
| Agriculture, Fishing & Hunting | 0 (0.0%) | 0 (0.0%) |
| Mining, Quarrying, & Extraction | 0 (0.0%) | 0 (0.0%) |
| Construction | 131 (100.0%) | 0 (0.0%) |
| Manufacturing | 25 (100.0%) | 0 (0.0%) |
| Wholesale Trade | 59 (100.0%) | 0 (0.0%) |
| Retail Trade | 45 (100.0%) | 0 (0.0%) |
| Transportation & Warehousing | 101 (100.0%) | 0 (0.0%) |
| Utilities | 48 (100.0%) | 0 (0.0%) |
| Information | 0 (0.0%) | 0 (0.0%) |
| Finance & Insurance | 0 (0.0%) | 0 (0.0%) |
| Real Estate, Rental & Leasing | 0 (0.0%) | 0 (0.0%) |
| Professional & Scientific | 7 (14.9%) | 40 (85.1%) |
| Enterprise Management | 0 (0.0%) | 0 (0.0%) |
| Administrative & Support | 0 (0.0%) | 0 (0.0%) |
| Educational Services | 0 (0.0%) | 131 (100.0%) |
| Health Care & Social Assistance | 97 (43.5%) | 126 (56.5%) |
| Arts, Entertainment & Recreation | 169 (100.0%) | 0 (0.0%) |
| Accommodation & Food Services | 93 (100.0%) | 0 (0.0%) |
| Public Administration | 0 (0.0%) | 40 (100.0%) |
| Total | 775 (69.7%) | 337 (30.3%) |
Education in Presidential Lakes Estates
School Enrollment in Presidential Lakes Estates
The most common levels of schooling among the 579 students in Presidential Lakes Estates are college / undergraduate (174 | 30.0%), middle school (163 | 28.1%), and elementary school (159 | 27.5%).
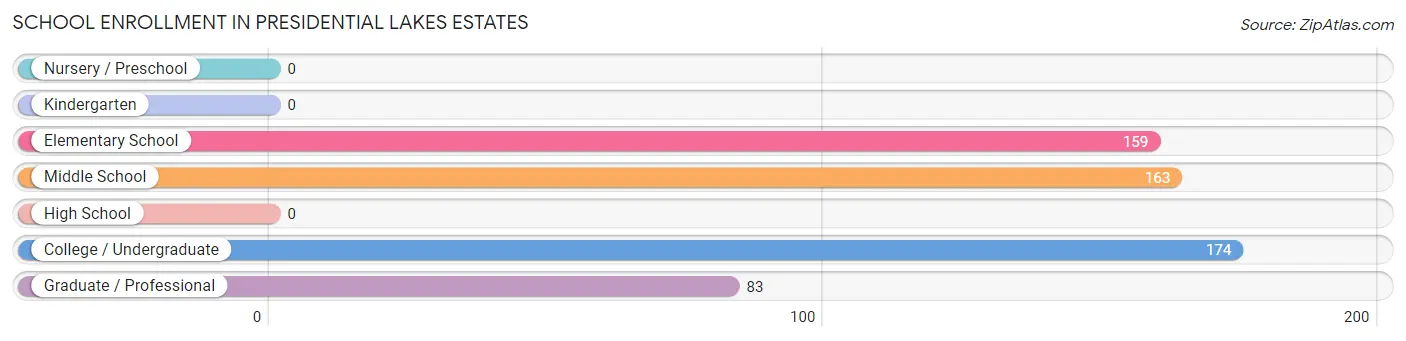
| School Level | # Students | % Students |
| Nursery / Preschool | 0 | 0.0% |
| Kindergarten | 0 | 0.0% |
| Elementary School | 159 | 27.5% |
| Middle School | 163 | 28.1% |
| High School | 0 | 0.0% |
| College / Undergraduate | 174 | 30.0% |
| Graduate / Professional | 83 | 14.3% |
| Total | 579 | 100.0% |
School Enrollment by Age by Funding Source in Presidential Lakes Estates
Out of a total of 579 students who are enrolled in schools in Presidential Lakes Estates, 83 (14.3%) attend a private institution, while the remaining 496 (85.7%) are enrolled in public schools. The age group of 35 years and over has the highest likelihood of being enrolled in private schools, with 83 (45.1% in the age bracket) enrolled. Conversely, the age group of 5 to 9 year old has the lowest likelihood of being enrolled in a private school, with 159 (100.0% in the age bracket) attending a public institution.
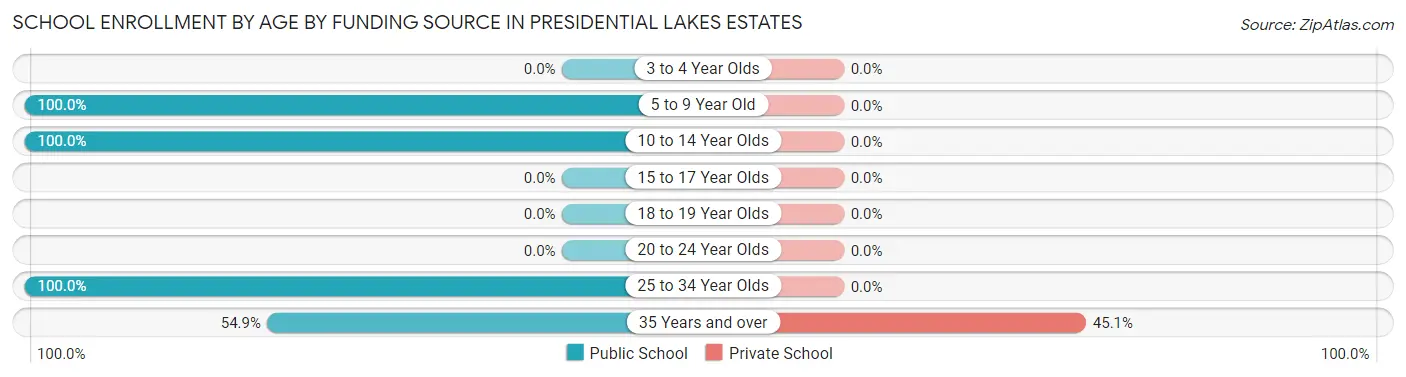
| Age Bracket | Public School | Private School |
| 3 to 4 Year Olds | 0 (0.0%) | 0 (0.0%) |
| 5 to 9 Year Old | 159 (100.0%) | 0 (0.0%) |
| 10 to 14 Year Olds | 163 (100.0%) | 0 (0.0%) |
| 15 to 17 Year Olds | 0 (0.0%) | 0 (0.0%) |
| 18 to 19 Year Olds | 0 (0.0%) | 0 (0.0%) |
| 20 to 24 Year Olds | 0 (0.0%) | 0 (0.0%) |
| 25 to 34 Year Olds | 73 (100.0%) | 0 (0.0%) |
| 35 Years and over | 101 (54.9%) | 83 (45.1%) |
| Total | 496 (85.7%) | 83 (14.3%) |
Educational Attainment by Field of Study in Presidential Lakes Estates
Science & technology (113 | 35.9%), psychology (58 | 18.4%), business (42 | 13.3%), social sciences (37 | 11.7%), and communications (32 | 10.2%) are the most common fields of study among 315 individuals in Presidential Lakes Estates who have obtained a bachelor's degree or higher.
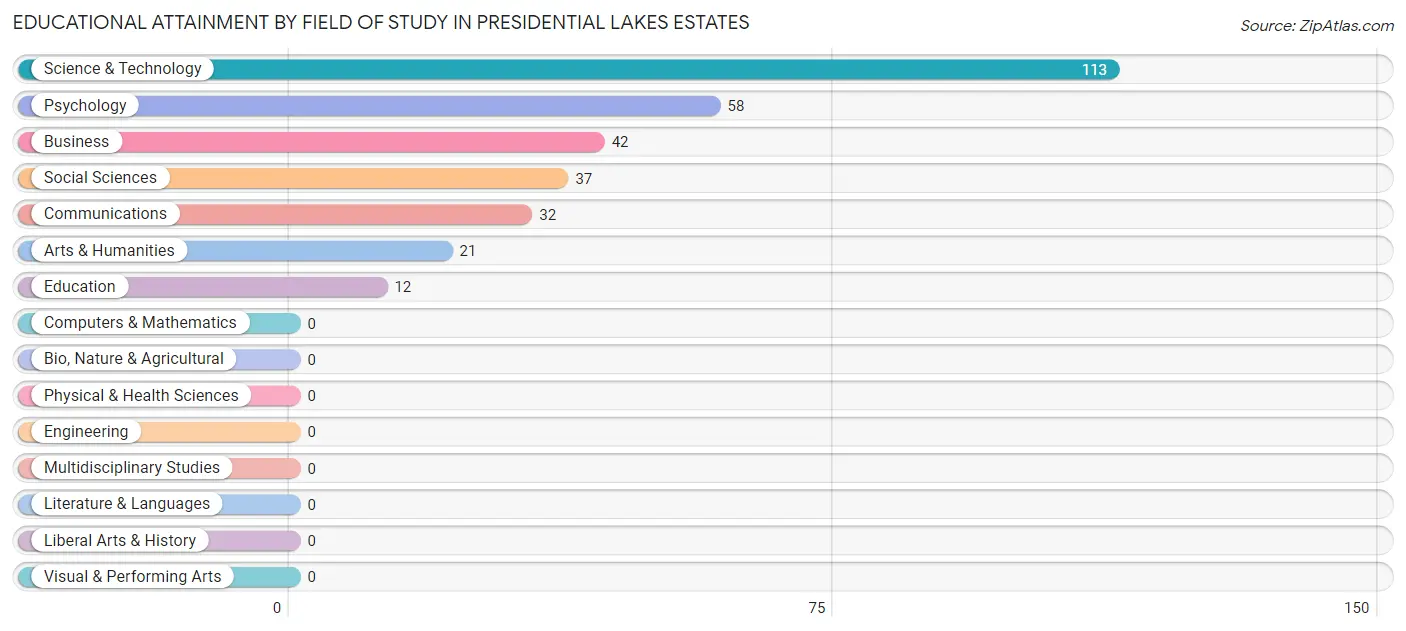
| Field of Study | # Graduates | % Graduates |
| Computers & Mathematics | 0 | 0.0% |
| Bio, Nature & Agricultural | 0 | 0.0% |
| Physical & Health Sciences | 0 | 0.0% |
| Psychology | 58 | 18.4% |
| Social Sciences | 37 | 11.7% |
| Engineering | 0 | 0.0% |
| Multidisciplinary Studies | 0 | 0.0% |
| Science & Technology | 113 | 35.9% |
| Business | 42 | 13.3% |
| Education | 12 | 3.8% |
| Literature & Languages | 0 | 0.0% |
| Liberal Arts & History | 0 | 0.0% |
| Visual & Performing Arts | 0 | 0.0% |
| Communications | 32 | 10.2% |
| Arts & Humanities | 21 | 6.7% |
| Total | 315 | 100.0% |
Transportation & Commute in Presidential Lakes Estates
Vehicle Availability by Sex in Presidential Lakes Estates
The most prevalent vehicle ownership categories in Presidential Lakes Estates are males with 4 vehicles (487, accounting for 53.1%) and females with 4 vehicles (97, making up 129.2%).
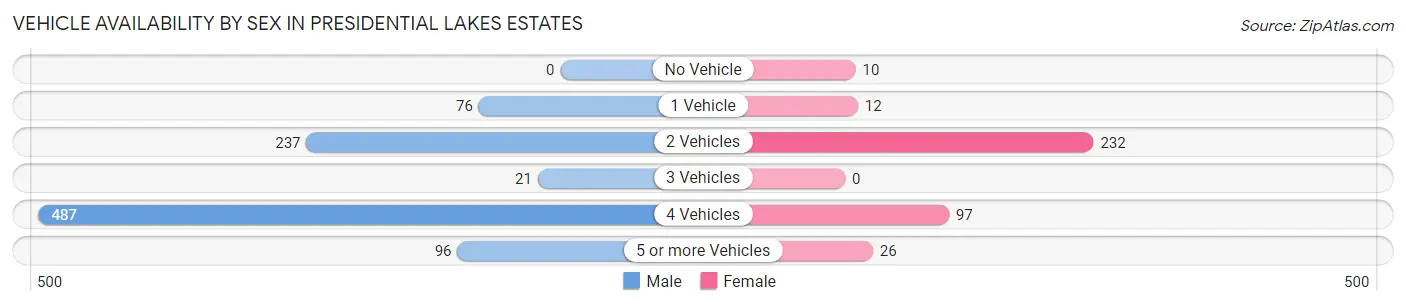
| Vehicles Available | Male | Female |
| No Vehicle | 0 (0.0%) | 10 (2.6%) |
| 1 Vehicle | 76 (8.3%) | 12 (3.2%) |
| 2 Vehicles | 237 (25.9%) | 232 (61.5%) |
| 3 Vehicles | 21 (2.3%) | 0 (0.0%) |
| 4 Vehicles | 487 (53.1%) | 97 (25.7%) |
| 5 or more Vehicles | 96 (10.5%) | 26 (6.9%) |
| Total | 917 (100.0%) | 377 (100.0%) |
Commute Time in Presidential Lakes Estates
The most frequently occuring commute durations in Presidential Lakes Estates are 30 to 34 minutes (313 commuters, 24.9%), 25 to 29 minutes (235 commuters, 18.7%), and 15 to 19 minutes (149 commuters, 11.8%).
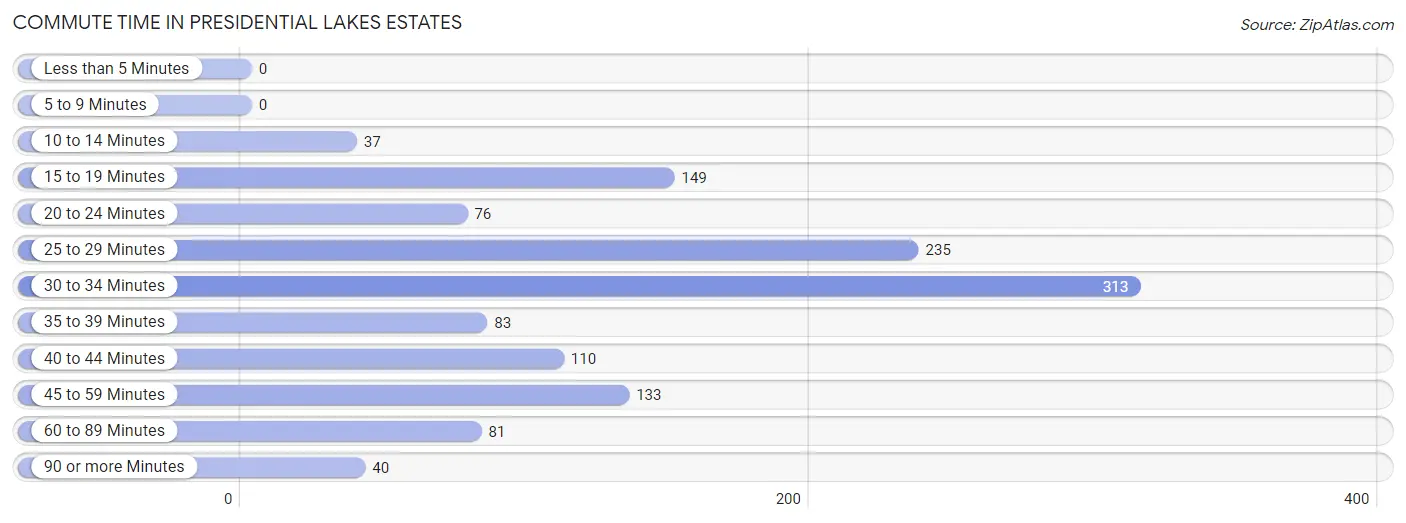
| Commute Time | # Commuters | % Commuters |
| Less than 5 Minutes | 0 | 0.0% |
| 5 to 9 Minutes | 0 | 0.0% |
| 10 to 14 Minutes | 37 | 2.9% |
| 15 to 19 Minutes | 149 | 11.8% |
| 20 to 24 Minutes | 76 | 6.0% |
| 25 to 29 Minutes | 235 | 18.7% |
| 30 to 34 Minutes | 313 | 24.9% |
| 35 to 39 Minutes | 83 | 6.6% |
| 40 to 44 Minutes | 110 | 8.7% |
| 45 to 59 Minutes | 133 | 10.6% |
| 60 to 89 Minutes | 81 | 6.4% |
| 90 or more Minutes | 40 | 3.2% |
Commute Time by Sex in Presidential Lakes Estates
The most common commute times in Presidential Lakes Estates are 30 to 34 minutes (287 commuters, 32.6%) for males and 15 to 19 minutes (99 commuters, 26.3%) for females.
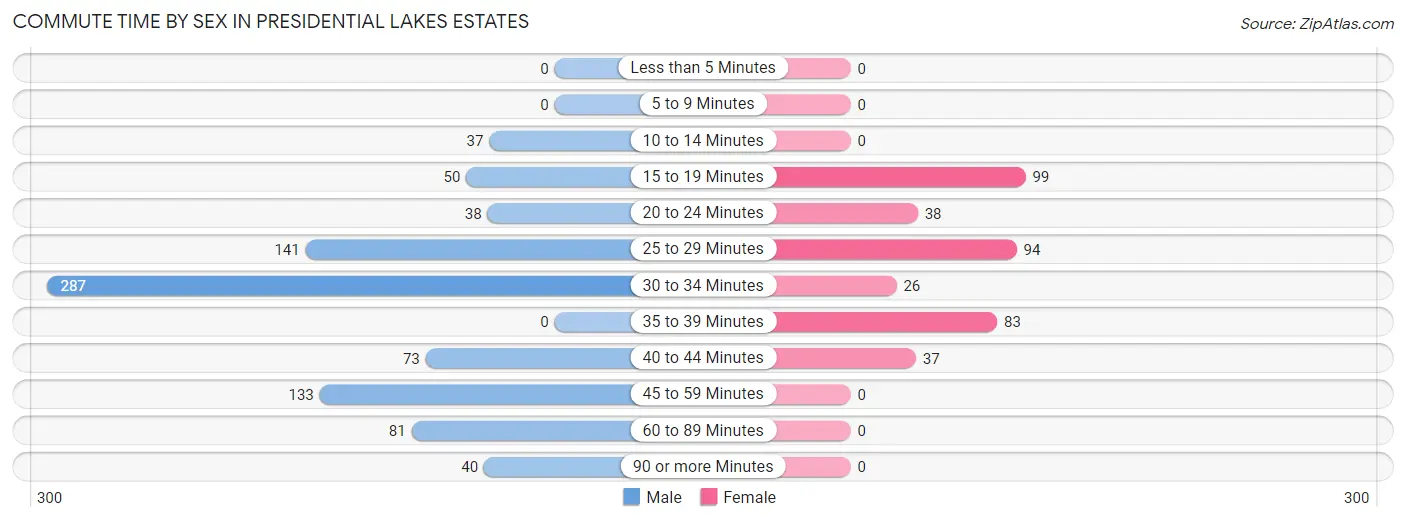
| Commute Time | Male | Female |
| Less than 5 Minutes | 0 (0.0%) | 0 (0.0%) |
| 5 to 9 Minutes | 0 (0.0%) | 0 (0.0%) |
| 10 to 14 Minutes | 37 (4.2%) | 0 (0.0%) |
| 15 to 19 Minutes | 50 (5.7%) | 99 (26.3%) |
| 20 to 24 Minutes | 38 (4.3%) | 38 (10.1%) |
| 25 to 29 Minutes | 141 (16.0%) | 94 (24.9%) |
| 30 to 34 Minutes | 287 (32.6%) | 26 (6.9%) |
| 35 to 39 Minutes | 0 (0.0%) | 83 (22.0%) |
| 40 to 44 Minutes | 73 (8.3%) | 37 (9.8%) |
| 45 to 59 Minutes | 133 (15.1%) | 0 (0.0%) |
| 60 to 89 Minutes | 81 (9.2%) | 0 (0.0%) |
| 90 or more Minutes | 40 (4.5%) | 0 (0.0%) |
Time of Departure to Work by Sex in Presidential Lakes Estates
The most frequent times of departure to work in Presidential Lakes Estates are 4:00 PM to 11:59 PM (218, 24.8%) for males and 8:00 AM to 8:29 AM (112, 29.7%) for females.
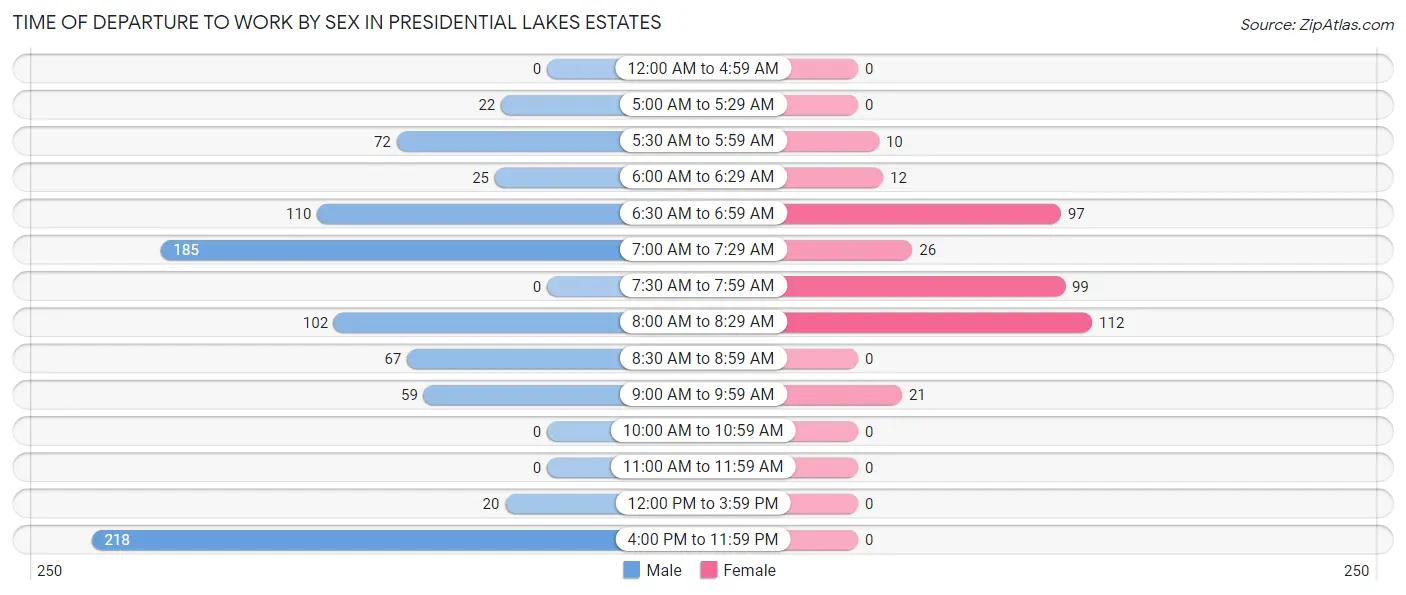
| Time of Departure | Male | Female |
| 12:00 AM to 4:59 AM | 0 (0.0%) | 0 (0.0%) |
| 5:00 AM to 5:29 AM | 22 (2.5%) | 0 (0.0%) |
| 5:30 AM to 5:59 AM | 72 (8.2%) | 10 (2.6%) |
| 6:00 AM to 6:29 AM | 25 (2.8%) | 12 (3.2%) |
| 6:30 AM to 6:59 AM | 110 (12.5%) | 97 (25.7%) |
| 7:00 AM to 7:29 AM | 185 (21.0%) | 26 (6.9%) |
| 7:30 AM to 7:59 AM | 0 (0.0%) | 99 (26.3%) |
| 8:00 AM to 8:29 AM | 102 (11.6%) | 112 (29.7%) |
| 8:30 AM to 8:59 AM | 67 (7.6%) | 0 (0.0%) |
| 9:00 AM to 9:59 AM | 59 (6.7%) | 21 (5.6%) |
| 10:00 AM to 10:59 AM | 0 (0.0%) | 0 (0.0%) |
| 11:00 AM to 11:59 AM | 0 (0.0%) | 0 (0.0%) |
| 12:00 PM to 3:59 PM | 20 (2.3%) | 0 (0.0%) |
| 4:00 PM to 11:59 PM | 218 (24.8%) | 0 (0.0%) |
| Total | 880 (100.0%) | 377 (100.0%) |
Housing Occupancy in Presidential Lakes Estates
Occupancy by Ownership in Presidential Lakes Estates
Of the total 922 dwellings in Presidential Lakes Estates, owner-occupied units account for 855 (92.7%), while renter-occupied units make up 67 (7.3%).
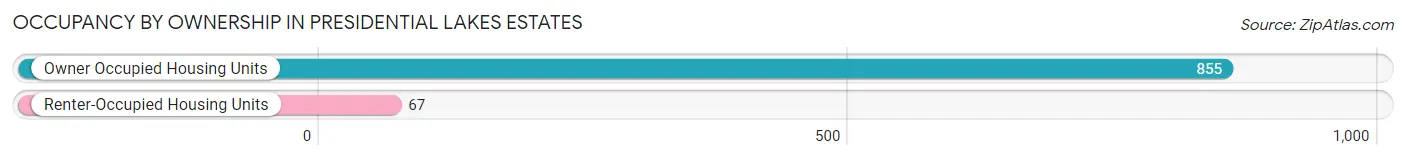
| Occupancy | # Housing Units | % Housing Units |
| Owner Occupied Housing Units | 855 | 92.7% |
| Renter-Occupied Housing Units | 67 | 7.3% |
| Total Occupied Housing Units | 922 | 100.0% |
Occupancy by Household Size in Presidential Lakes Estates
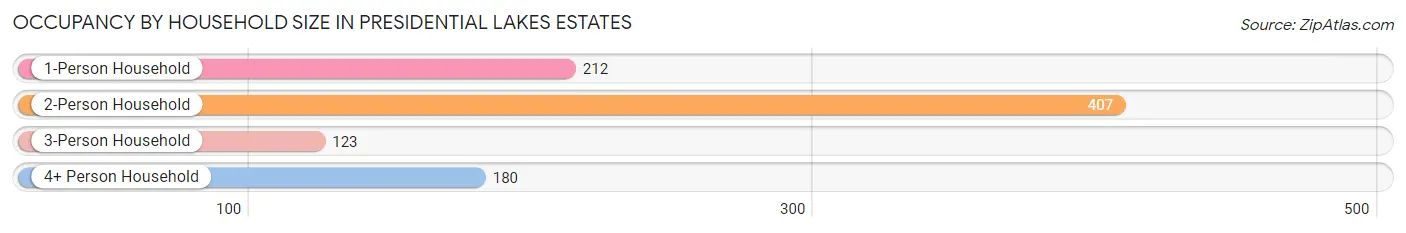
| Household Size | # Housing Units | % Housing Units |
| 1-Person Household | 212 | 23.0% |
| 2-Person Household | 407 | 44.1% |
| 3-Person Household | 123 | 13.3% |
| 4+ Person Household | 180 | 19.5% |
| Total Housing Units | 922 | 100.0% |
Occupancy by Ownership by Household Size in Presidential Lakes Estates
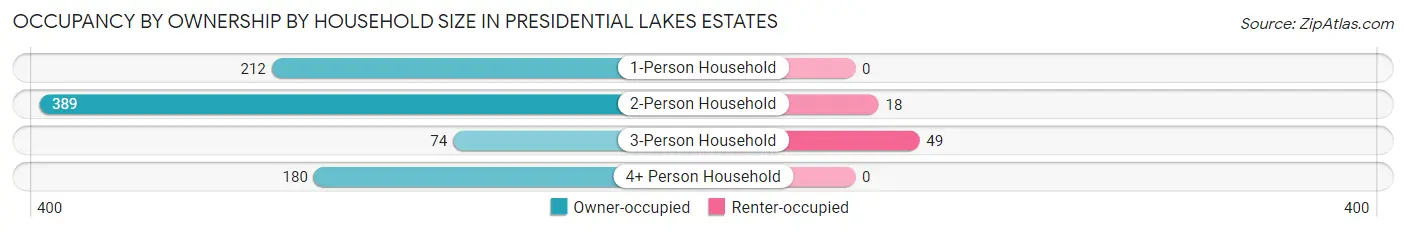
| Household Size | Owner-occupied | Renter-occupied |
| 1-Person Household | 212 (100.0%) | 0 (0.0%) |
| 2-Person Household | 389 (95.6%) | 18 (4.4%) |
| 3-Person Household | 74 (60.2%) | 49 (39.8%) |
| 4+ Person Household | 180 (100.0%) | 0 (0.0%) |
| Total Housing Units | 855 (92.7%) | 67 (7.3%) |
Occupancy by Educational Attainment in Presidential Lakes Estates
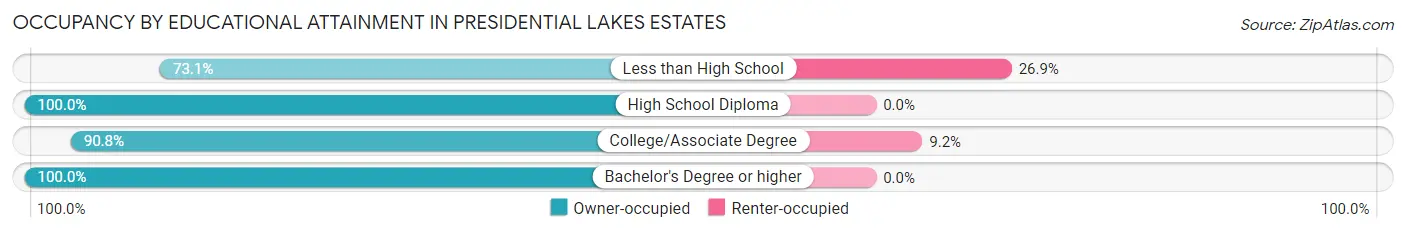
| Household Size | Owner-occupied | Renter-occupied |
| Less than High School | 49 (73.1%) | 18 (26.9%) |
| High School Diploma | 213 (100.0%) | 0 (0.0%) |
| College/Associate Degree | 486 (90.8%) | 49 (9.2%) |
| Bachelor's Degree or higher | 107 (100.0%) | 0 (0.0%) |
Occupancy by Age of Householder in Presidential Lakes Estates
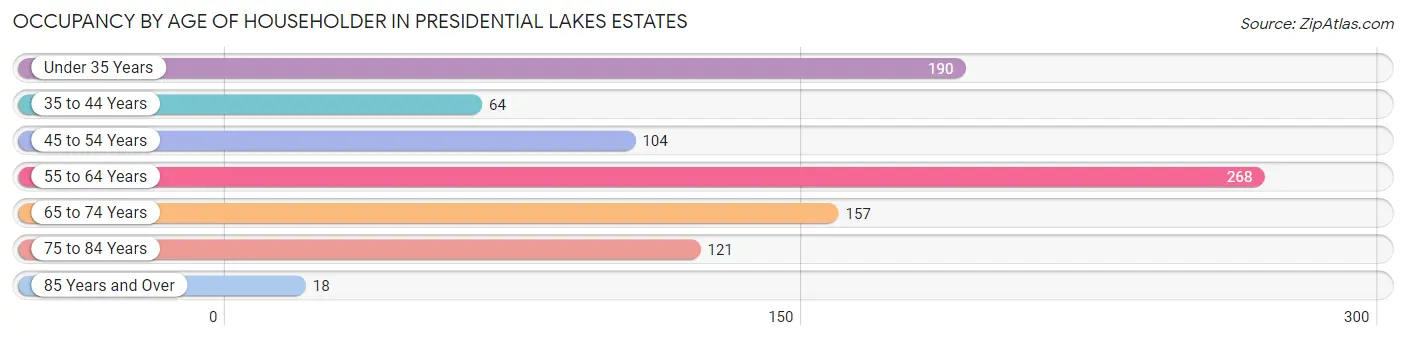
| Age Bracket | # Households | % Households |
| Under 35 Years | 190 | 20.6% |
| 35 to 44 Years | 64 | 6.9% |
| 45 to 54 Years | 104 | 11.3% |
| 55 to 64 Years | 268 | 29.1% |
| 65 to 74 Years | 157 | 17.0% |
| 75 to 84 Years | 121 | 13.1% |
| 85 Years and Over | 18 | 1.9% |
| Total | 922 | 100.0% |
Housing Finances in Presidential Lakes Estates
Median Income by Occupancy in Presidential Lakes Estates
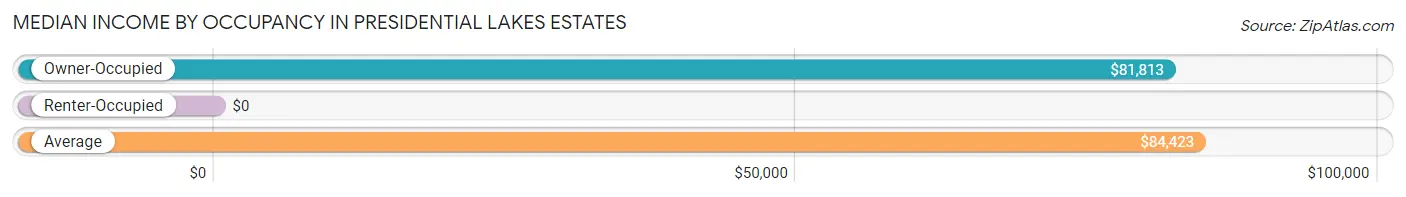
| Occupancy Type | # Households | Median Income |
| Owner-Occupied | 855 (92.7%) | $81,813 |
| Renter-Occupied | 67 (7.3%) | $0 |
| Average | 922 (100.0%) | $84,423 |
Occupancy by Householder Income Bracket in Presidential Lakes Estates
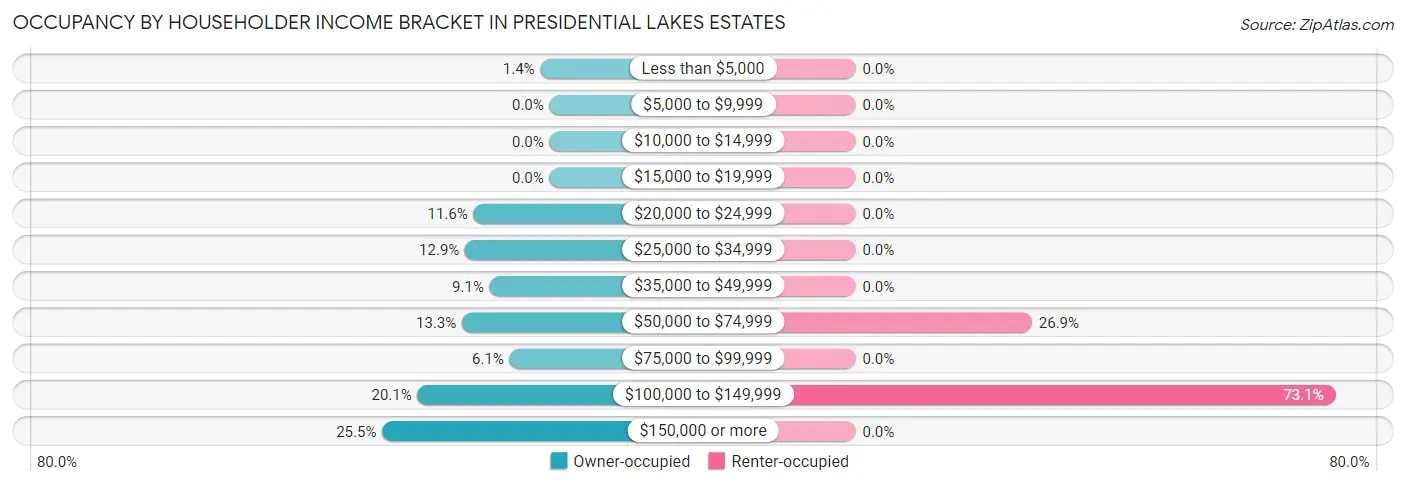
| Income Bracket | Owner-occupied | Renter-occupied |
| Less than $5,000 | 12 (1.4%) | 0 (0.0%) |
| $5,000 to $9,999 | 0 (0.0%) | 0 (0.0%) |
| $10,000 to $14,999 | 0 (0.0%) | 0 (0.0%) |
| $15,000 to $19,999 | 0 (0.0%) | 0 (0.0%) |
| $20,000 to $24,999 | 99 (11.6%) | 0 (0.0%) |
| $25,000 to $34,999 | 110 (12.9%) | 0 (0.0%) |
| $35,000 to $49,999 | 78 (9.1%) | 0 (0.0%) |
| $50,000 to $74,999 | 114 (13.3%) | 18 (26.9%) |
| $75,000 to $99,999 | 52 (6.1%) | 0 (0.0%) |
| $100,000 to $149,999 | 172 (20.1%) | 49 (73.1%) |
| $150,000 or more | 218 (25.5%) | 0 (0.0%) |
| Total | 855 (100.0%) | 67 (100.0%) |
Monthly Housing Cost Tiers in Presidential Lakes Estates
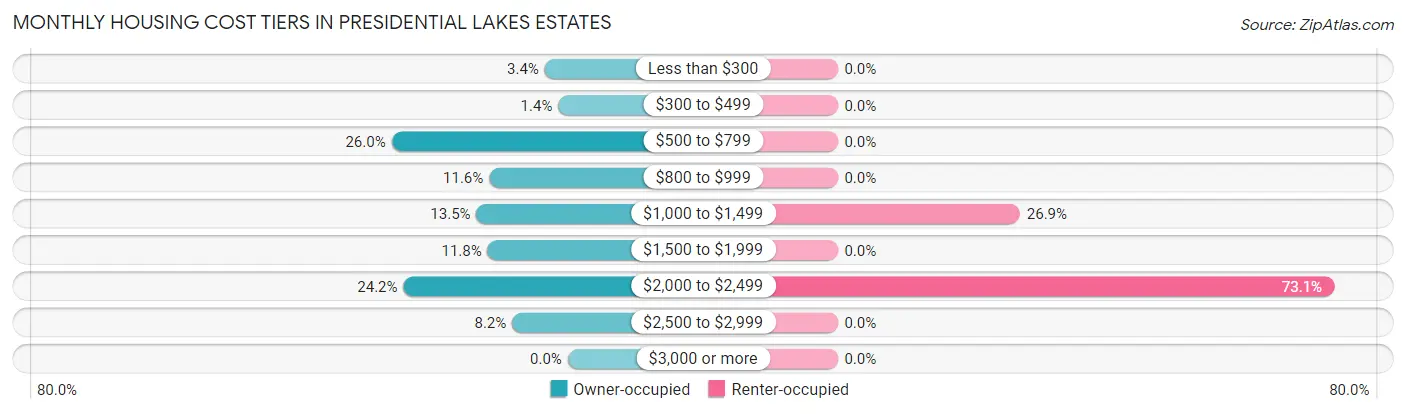
| Monthly Cost | Owner-occupied | Renter-occupied |
| Less than $300 | 29 (3.4%) | 0 (0.0%) |
| $300 to $499 | 12 (1.4%) | 0 (0.0%) |
| $500 to $799 | 222 (26.0%) | 0 (0.0%) |
| $800 to $999 | 99 (11.6%) | 0 (0.0%) |
| $1,000 to $1,499 | 115 (13.5%) | 18 (26.9%) |
| $1,500 to $1,999 | 101 (11.8%) | 0 (0.0%) |
| $2,000 to $2,499 | 207 (24.2%) | 49 (73.1%) |
| $2,500 to $2,999 | 70 (8.2%) | 0 (0.0%) |
| $3,000 or more | 0 (0.0%) | 0 (0.0%) |
| Total | 855 (100.0%) | 67 (100.0%) |
Physical Housing Characteristics in Presidential Lakes Estates
Housing Structures in Presidential Lakes Estates
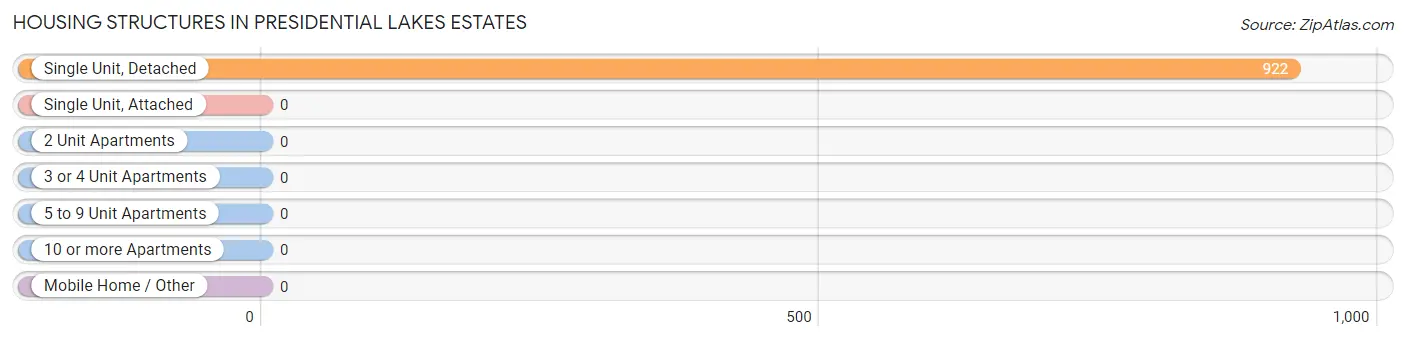
| Structure Type | # Housing Units | % Housing Units |
| Single Unit, Detached | 922 | 100.0% |
| Single Unit, Attached | 0 | 0.0% |
| 2 Unit Apartments | 0 | 0.0% |
| 3 or 4 Unit Apartments | 0 | 0.0% |
| 5 to 9 Unit Apartments | 0 | 0.0% |
| 10 or more Apartments | 0 | 0.0% |
| Mobile Home / Other | 0 | 0.0% |
| Total | 922 | 100.0% |
Housing Structures by Occupancy in Presidential Lakes Estates
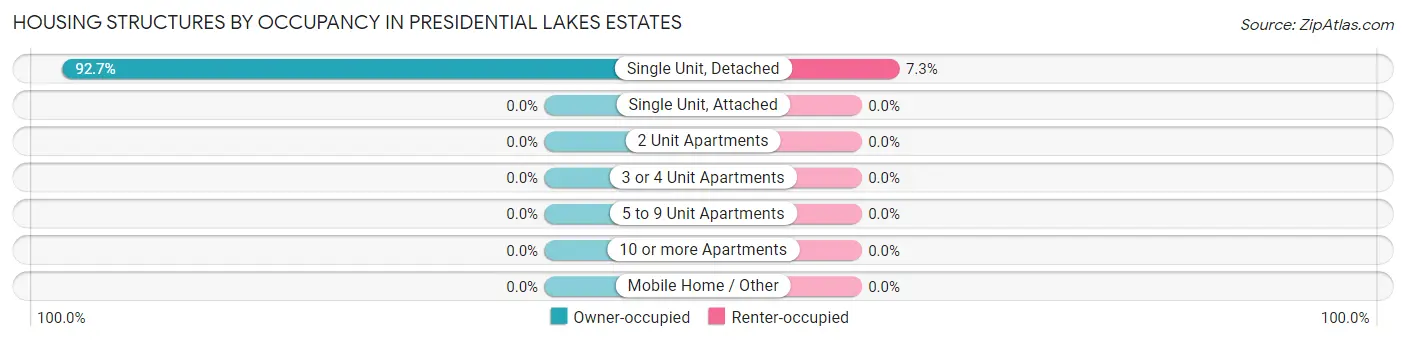
| Structure Type | Owner-occupied | Renter-occupied |
| Single Unit, Detached | 855 (92.7%) | 67 (7.3%) |
| Single Unit, Attached | 0 (0.0%) | 0 (0.0%) |
| 2 Unit Apartments | 0 (0.0%) | 0 (0.0%) |
| 3 or 4 Unit Apartments | 0 (0.0%) | 0 (0.0%) |
| 5 to 9 Unit Apartments | 0 (0.0%) | 0 (0.0%) |
| 10 or more Apartments | 0 (0.0%) | 0 (0.0%) |
| Mobile Home / Other | 0 (0.0%) | 0 (0.0%) |
| Total | 855 (92.7%) | 67 (7.3%) |
Housing Structures by Number of Rooms in Presidential Lakes Estates
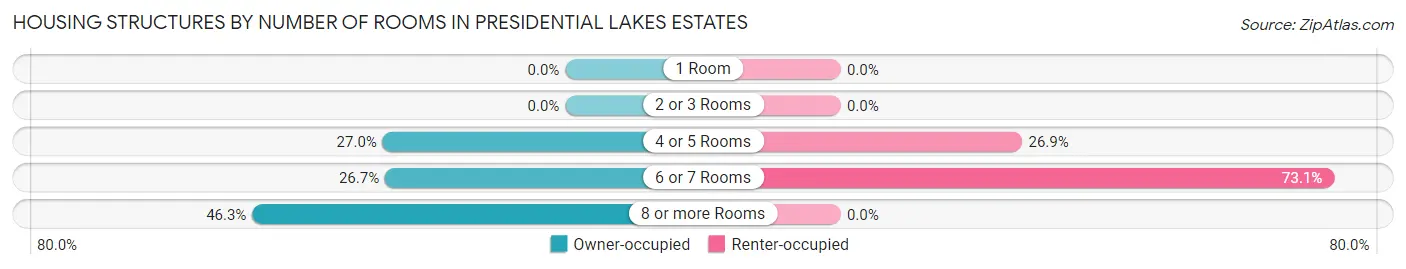
| Number of Rooms | Owner-occupied | Renter-occupied |
| 1 Room | 0 (0.0%) | 0 (0.0%) |
| 2 or 3 Rooms | 0 (0.0%) | 0 (0.0%) |
| 4 or 5 Rooms | 231 (27.0%) | 18 (26.9%) |
| 6 or 7 Rooms | 228 (26.7%) | 49 (73.1%) |
| 8 or more Rooms | 396 (46.3%) | 0 (0.0%) |
| Total | 855 (100.0%) | 67 (100.0%) |
Housing Structure by Heating Type in Presidential Lakes Estates
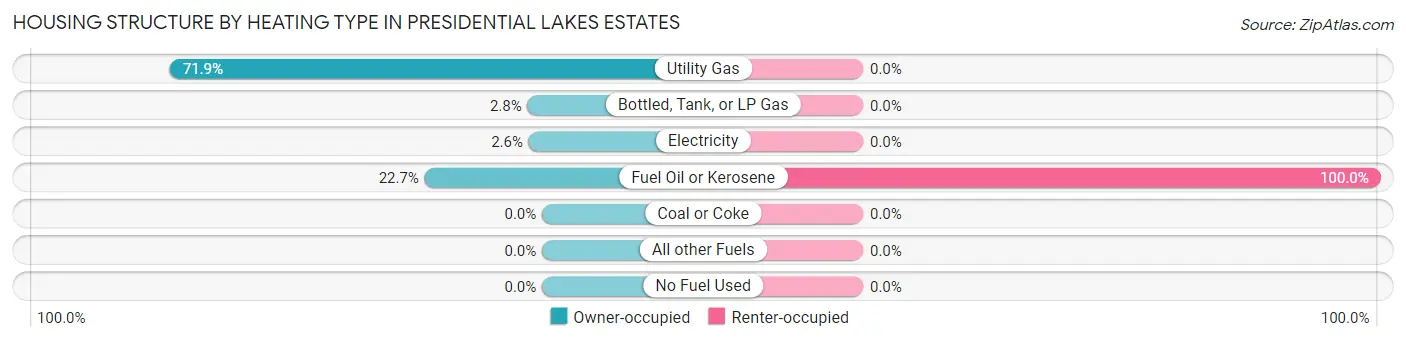
| Heating Type | Owner-occupied | Renter-occupied |
| Utility Gas | 615 (71.9%) | 0 (0.0%) |
| Bottled, Tank, or LP Gas | 24 (2.8%) | 0 (0.0%) |
| Electricity | 22 (2.6%) | 0 (0.0%) |
| Fuel Oil or Kerosene | 194 (22.7%) | 67 (100.0%) |
| Coal or Coke | 0 (0.0%) | 0 (0.0%) |
| All other Fuels | 0 (0.0%) | 0 (0.0%) |
| No Fuel Used | 0 (0.0%) | 0 (0.0%) |
| Total | 855 (100.0%) | 67 (100.0%) |
Household Vehicle Usage in Presidential Lakes Estates
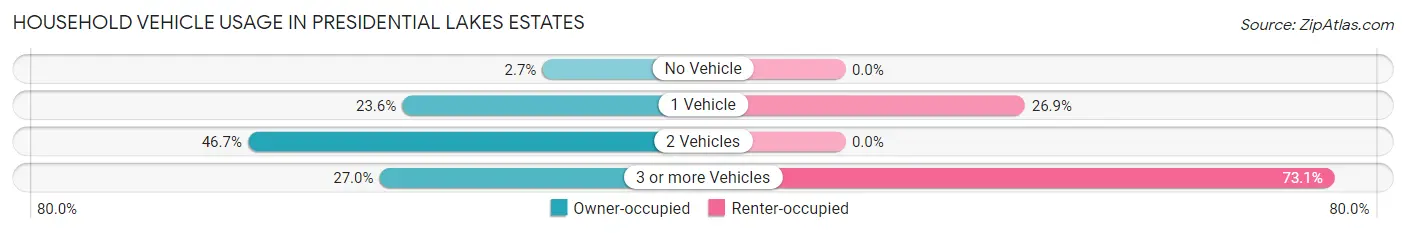
| Vehicles per Household | Owner-occupied | Renter-occupied |
| No Vehicle | 23 (2.7%) | 0 (0.0%) |
| 1 Vehicle | 202 (23.6%) | 18 (26.9%) |
| 2 Vehicles | 399 (46.7%) | 0 (0.0%) |
| 3 or more Vehicles | 231 (27.0%) | 49 (73.1%) |
| Total | 855 (100.0%) | 67 (100.0%) |
Real Estate & Mortgages in Presidential Lakes Estates
Real Estate and Mortgage Overview in Presidential Lakes Estates
| Characteristic | Without Mortgage | With Mortgage |
| Housing Units | 347 | 508 |
| Median Property Value | $206,200 | $233,000 |
| Median Household Income | - | - |
| Monthly Housing Costs | $740 | $0 |
| Real Estate Taxes | $5,622 | $0 |
Property Value by Mortgage Status in Presidential Lakes Estates
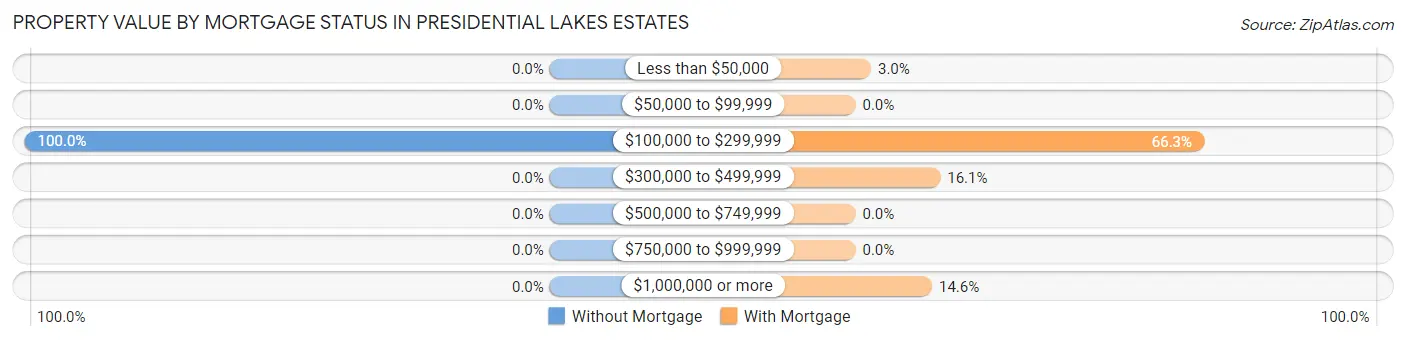
| Property Value | Without Mortgage | With Mortgage |
| Less than $50,000 | 0 (0.0%) | 15 (2.9%) |
| $50,000 to $99,999 | 0 (0.0%) | 0 (0.0%) |
| $100,000 to $299,999 | 347 (100.0%) | 337 (66.3%) |
| $300,000 to $499,999 | 0 (0.0%) | 82 (16.1%) |
| $500,000 to $749,999 | 0 (0.0%) | 0 (0.0%) |
| $750,000 to $999,999 | 0 (0.0%) | 0 (0.0%) |
| $1,000,000 or more | 0 (0.0%) | 74 (14.6%) |
| Total | 347 (100.0%) | 508 (100.0%) |
Household Income by Mortgage Status in Presidential Lakes Estates
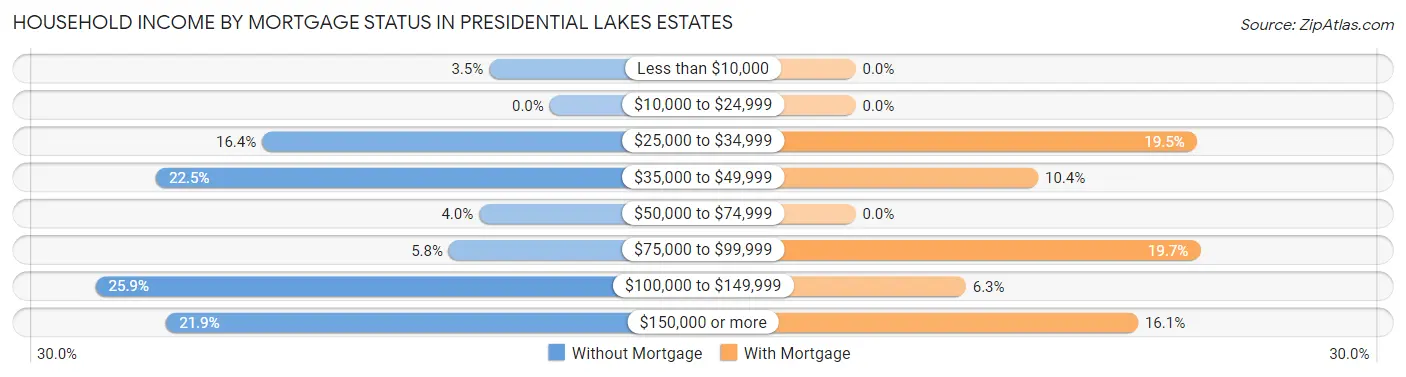
| Household Income | Without Mortgage | With Mortgage |
| Less than $10,000 | 12 (3.5%) | 0 (0.0%) |
| $10,000 to $24,999 | 0 (0.0%) | 0 (0.0%) |
| $25,000 to $34,999 | 57 (16.4%) | 99 (19.5%) |
| $35,000 to $49,999 | 78 (22.5%) | 53 (10.4%) |
| $50,000 to $74,999 | 14 (4.0%) | 0 (0.0%) |
| $75,000 to $99,999 | 20 (5.8%) | 100 (19.7%) |
| $100,000 to $149,999 | 90 (25.9%) | 32 (6.3%) |
| $150,000 or more | 76 (21.9%) | 82 (16.1%) |
| Total | 347 (100.0%) | 508 (100.0%) |
Property Value to Household Income Ratio in Presidential Lakes Estates
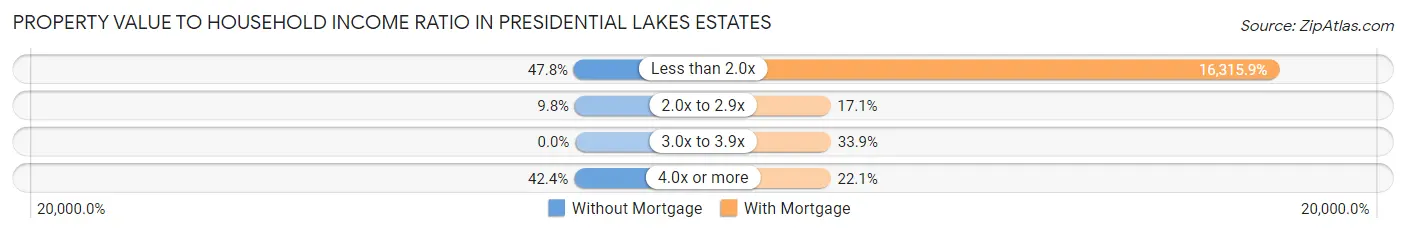
| Value-to-Income Ratio | Without Mortgage | With Mortgage |
| Less than 2.0x | 166 (47.8%) | 82,885 (16,315.9%) |
| 2.0x to 2.9x | 34 (9.8%) | 87 (17.1%) |
| 3.0x to 3.9x | 0 (0.0%) | 172 (33.9%) |
| 4.0x or more | 147 (42.4%) | 112 (22.1%) |
| Total | 347 (100.0%) | 508 (100.0%) |
Real Estate Taxes by Mortgage Status in Presidential Lakes Estates
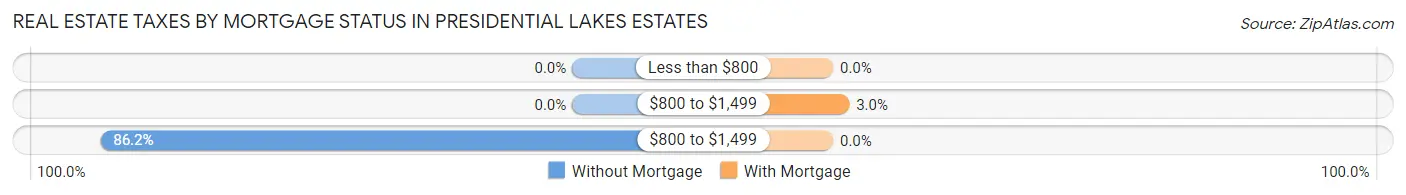
| Property Taxes | Without Mortgage | With Mortgage |
| Less than $800 | 0 (0.0%) | 0 (0.0%) |
| $800 to $1,499 | 0 (0.0%) | 15 (2.9%) |
| $800 to $1,499 | 299 (86.2%) | 0 (0.0%) |
| Total | 347 (100.0%) | 508 (100.0%) |
Health & Disability in Presidential Lakes Estates
Health Insurance Coverage by Age in Presidential Lakes Estates
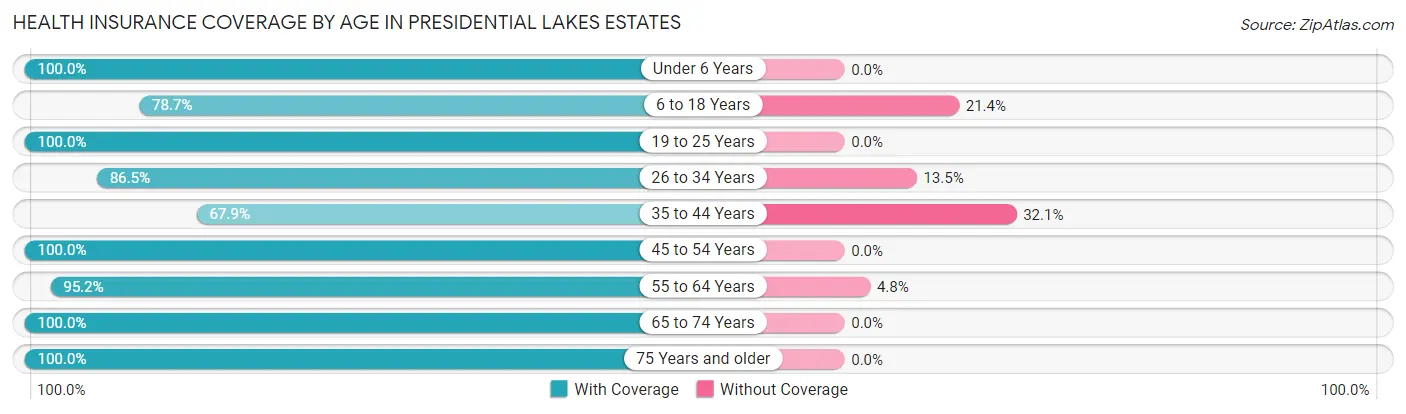
| Age Bracket | With Coverage | Without Coverage |
| Under 6 Years | 82 (100.0%) | 0 (0.0%) |
| 6 to 18 Years | 269 (78.6%) | 73 (21.3%) |
| 19 to 25 Years | 201 (100.0%) | 0 (0.0%) |
| 26 to 34 Years | 135 (86.5%) | 21 (13.5%) |
| 35 to 44 Years | 214 (67.9%) | 101 (32.1%) |
| 45 to 54 Years | 236 (100.0%) | 0 (0.0%) |
| 55 to 64 Years | 417 (95.2%) | 21 (4.8%) |
| 65 to 74 Years | 297 (100.0%) | 0 (0.0%) |
| 75 Years and older | 211 (100.0%) | 0 (0.0%) |
| Total | 2,062 (90.5%) | 216 (9.5%) |
Health Insurance Coverage by Citizenship Status in Presidential Lakes Estates
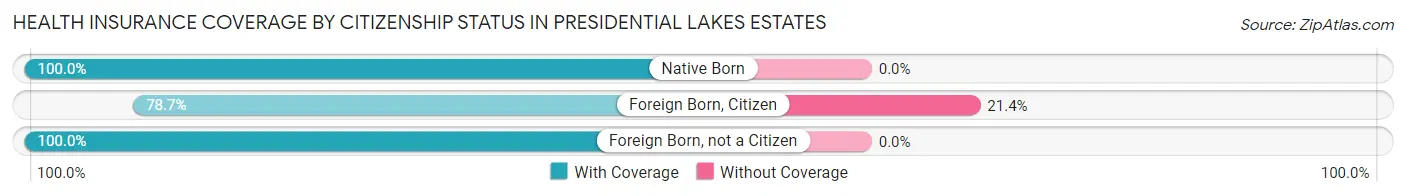
| Citizenship Status | With Coverage | Without Coverage |
| Native Born | 82 (100.0%) | 0 (0.0%) |
| Foreign Born, Citizen | 269 (78.6%) | 73 (21.3%) |
| Foreign Born, not a Citizen | 201 (100.0%) | 0 (0.0%) |
Health Insurance Coverage by Household Income in Presidential Lakes Estates
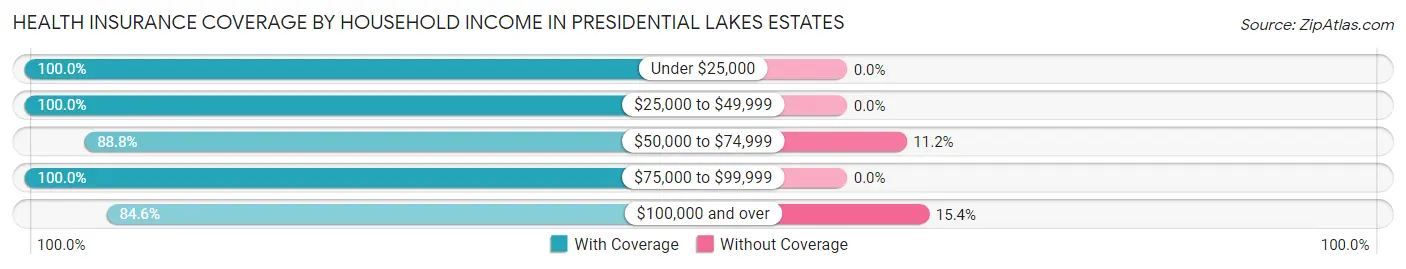
| Household Income | With Coverage | Without Coverage |
| Under $25,000 | 247 (100.0%) | 0 (0.0%) |
| $25,000 to $49,999 | 370 (100.0%) | 0 (0.0%) |
| $50,000 to $74,999 | 167 (88.8%) | 21 (11.2%) |
| $75,000 to $99,999 | 204 (100.0%) | 0 (0.0%) |
| $100,000 and over | 1,074 (84.6%) | 195 (15.4%) |
Public vs Private Health Insurance Coverage by Age in Presidential Lakes Estates
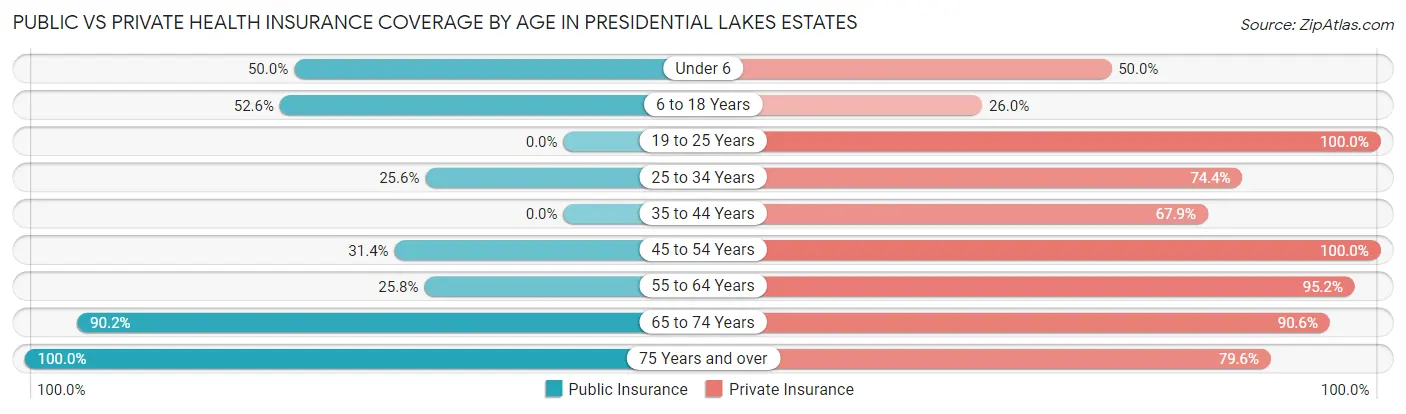
| Age Bracket | Public Insurance | Private Insurance |
| Under 6 | 41 (50.0%) | 41 (50.0%) |
| 6 to 18 Years | 180 (52.6%) | 89 (26.0%) |
| 19 to 25 Years | 0 (0.0%) | 201 (100.0%) |
| 25 to 34 Years | 40 (25.6%) | 116 (74.4%) |
| 35 to 44 Years | 0 (0.0%) | 214 (67.9%) |
| 45 to 54 Years | 74 (31.4%) | 236 (100.0%) |
| 55 to 64 Years | 113 (25.8%) | 417 (95.2%) |
| 65 to 74 Years | 268 (90.2%) | 269 (90.6%) |
| 75 Years and over | 211 (100.0%) | 168 (79.6%) |
| Total | 927 (40.7%) | 1,751 (76.9%) |
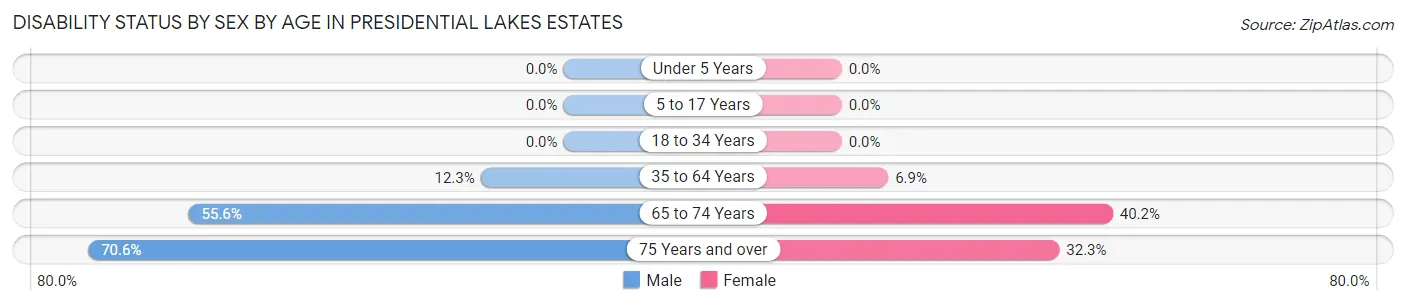
Disability Status by Sex by Age in Presidential Lakes Estates
| Age Bracket | Male | Female |
| Under 5 Years | 0 (0.0%) | 0 (0.0%) |
| 5 to 17 Years | 0 (0.0%) | 0 (0.0%) |
| 18 to 34 Years | 0 (0.0%) | 0 (0.0%) |
| 35 to 64 Years | 77 (12.3%) | 25 (6.9%) |
| 65 to 74 Years | 74 (55.6%) | 66 (40.2%) |
| 75 Years and over | 103 (70.6%) | 21 (32.3%) |
Disability Class by Sex by Age in Presidential Lakes Estates
Disability Class: Hearing Difficulty
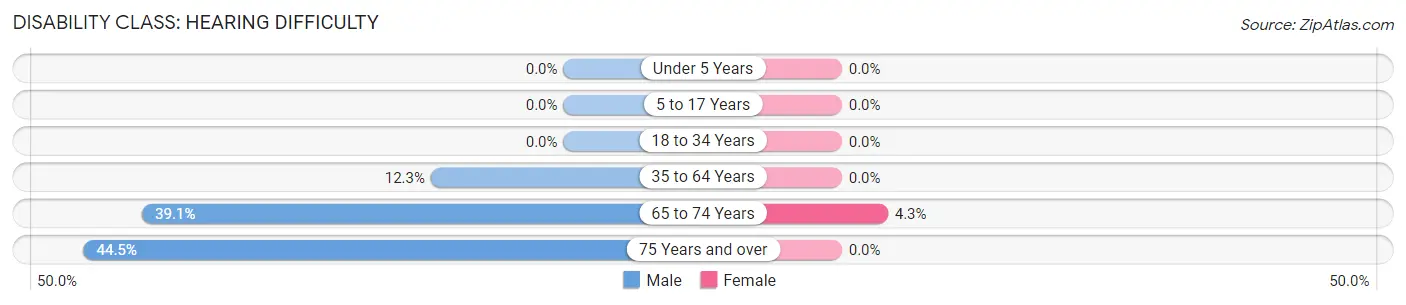
| Age Bracket | Male | Female |
| Under 5 Years | 0 (0.0%) | 0 (0.0%) |
| 5 to 17 Years | 0 (0.0%) | 0 (0.0%) |
| 18 to 34 Years | 0 (0.0%) | 0 (0.0%) |
| 35 to 64 Years | 77 (12.3%) | 0 (0.0%) |
| 65 to 74 Years | 52 (39.1%) | 7 (4.3%) |
| 75 Years and over | 65 (44.5%) | 0 (0.0%) |
Disability Class: Vision Difficulty
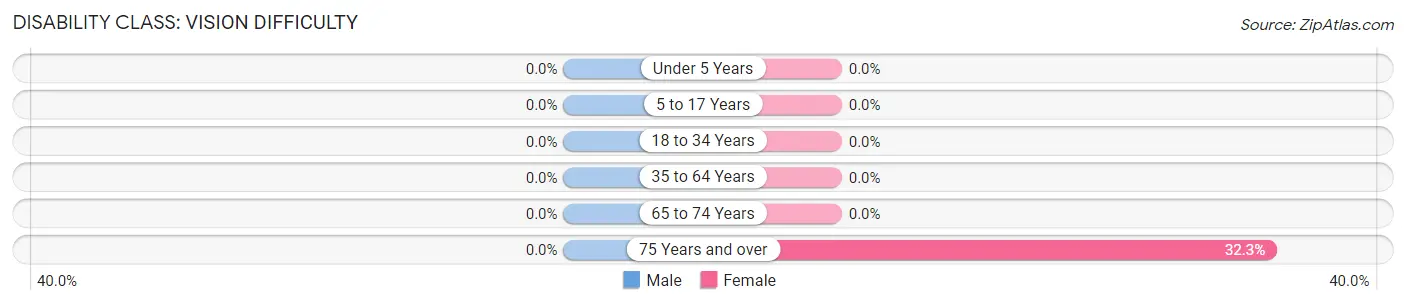
| Age Bracket | Male | Female |
| Under 5 Years | 0 (0.0%) | 0 (0.0%) |
| 5 to 17 Years | 0 (0.0%) | 0 (0.0%) |
| 18 to 34 Years | 0 (0.0%) | 0 (0.0%) |
| 35 to 64 Years | 0 (0.0%) | 0 (0.0%) |
| 65 to 74 Years | 0 (0.0%) | 0 (0.0%) |
| 75 Years and over | 0 (0.0%) | 21 (32.3%) |
Disability Class: Cognitive Difficulty
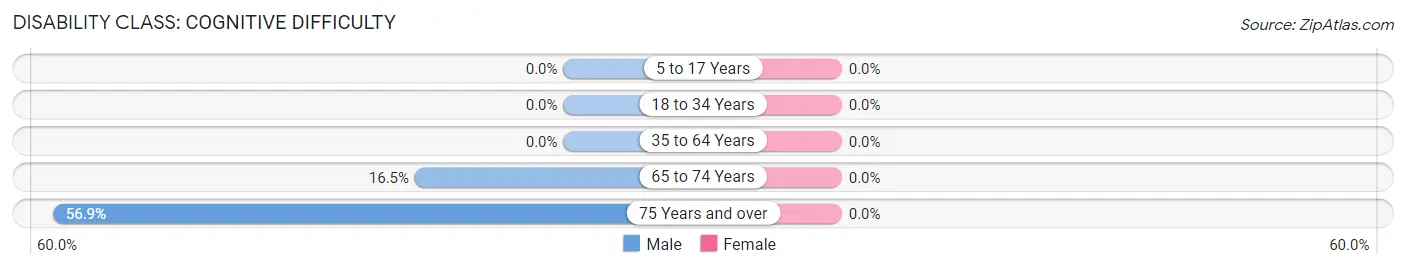
| Age Bracket | Male | Female |
| 5 to 17 Years | 0 (0.0%) | 0 (0.0%) |
| 18 to 34 Years | 0 (0.0%) | 0 (0.0%) |
| 35 to 64 Years | 0 (0.0%) | 0 (0.0%) |
| 65 to 74 Years | 22 (16.5%) | 0 (0.0%) |
| 75 Years and over | 83 (56.9%) | 0 (0.0%) |
Disability Class: Ambulatory Difficulty
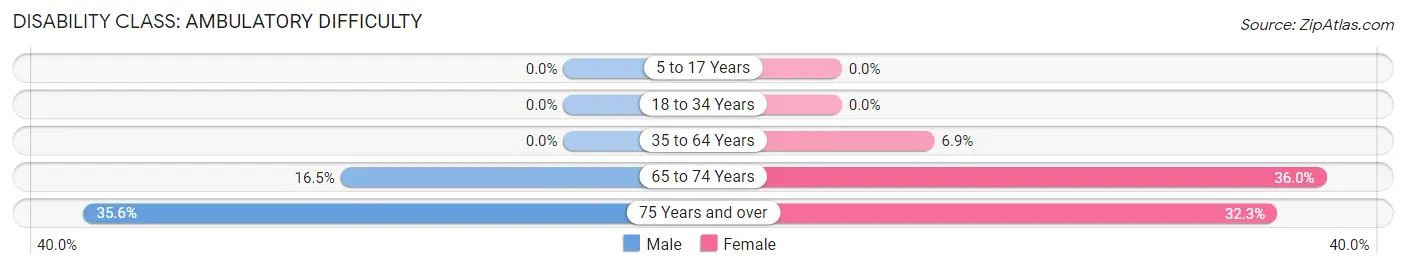
| Age Bracket | Male | Female |
| 5 to 17 Years | 0 (0.0%) | 0 (0.0%) |
| 18 to 34 Years | 0 (0.0%) | 0 (0.0%) |
| 35 to 64 Years | 0 (0.0%) | 25 (6.9%) |
| 65 to 74 Years | 22 (16.5%) | 59 (36.0%) |
| 75 Years and over | 52 (35.6%) | 21 (32.3%) |
Disability Class: Self-Care Difficulty
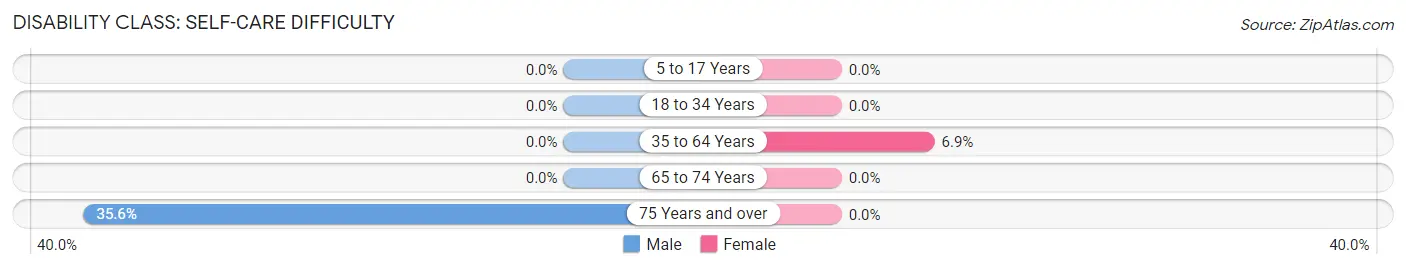
| Age Bracket | Male | Female |
| 5 to 17 Years | 0 (0.0%) | 0 (0.0%) |
| 18 to 34 Years | 0 (0.0%) | 0 (0.0%) |
| 35 to 64 Years | 0 (0.0%) | 25 (6.9%) |
| 65 to 74 Years | 0 (0.0%) | 0 (0.0%) |
| 75 Years and over | 52 (35.6%) | 0 (0.0%) |
Technology Access in Presidential Lakes Estates
Computing Device Access in Presidential Lakes Estates
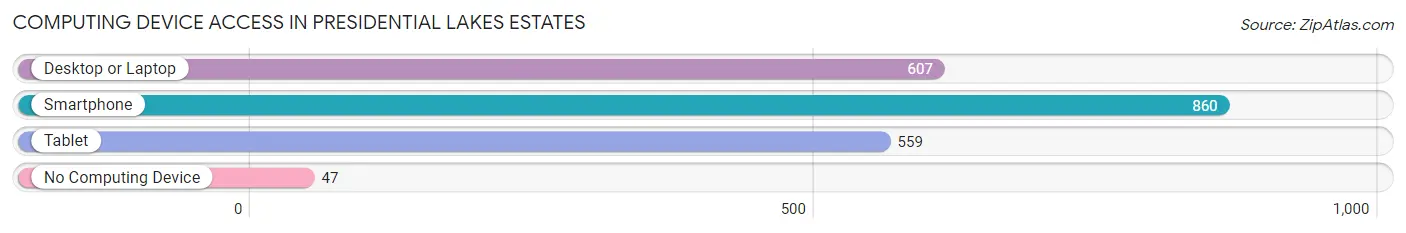
| Device Type | # Households | % Households |
| Desktop or Laptop | 607 | 65.8% |
| Smartphone | 860 | 93.3% |
| Tablet | 559 | 60.6% |
| No Computing Device | 47 | 5.1% |
| Total | 922 | 100.0% |
Internet Access in Presidential Lakes Estates
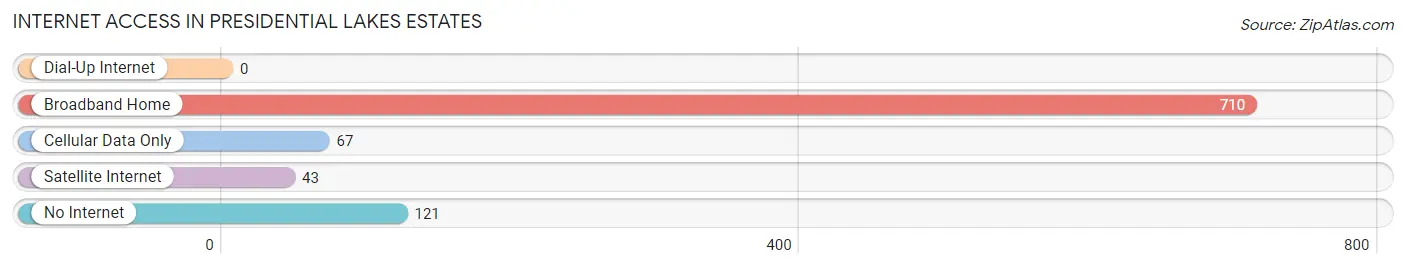
| Internet Type | # Households | % Households |
| Dial-Up Internet | 0 | 0.0% |
| Broadband Home | 710 | 77.0% |
| Cellular Data Only | 67 | 7.3% |
| Satellite Internet | 43 | 4.7% |
| No Internet | 121 | 13.1% |
| Total | 922 | 100.0% |
Presidential Lakes Estates Summary
Presidential Lakes Estates is a census-designated place located in Ocean County, New Jersey. It is situated within the township of Little Egg Harbor and is part of the Ocean County-Long Beach Island Combined Statistical Area. The population of Presidential Lakes Estates was 1,845 as of the 2010 census.
History
Presidential Lakes Estates was established in the late 1960s as a planned community. The development was built on land that was formerly part of the Great Bay Wildlife Management Area. The area was originally part of the Township of Little Egg Harbor, but was annexed by the Township of Tuckerton in the late 1970s. The development was named after the nearby Presidential Lakes, which are a series of small lakes located in the area.
Geography
Presidential Lakes Estates is located at 39°37'45"N 74°20'45"W (39.62917, -74.34583). It is situated in the northern part of Ocean County, approximately 10 miles south of the city of Toms River. The area is bordered by the Great Bay Wildlife Management Area to the north and the Tuckerton Borough to the south.
The area is mostly flat, with an elevation of approximately 10 feet above sea level. The climate is humid subtropical, with hot, humid summers and mild winters.
Economy
The economy of Presidential Lakes Estates is largely based on tourism and recreation. The area is home to several marinas, which provide access to the nearby Great Bay and Barnegat Bay. There are also several restaurants and bars in the area, as well as a few small retail stores.
Demographics
As of the 2010 census, the population of Presidential Lakes Estates was 1,845. The racial makeup of the area was 94.3% White, 2.2% African American, 0.7% Asian, 0.3% Native American, and 2.5% from other races. Hispanic or Latino of any race were 5.2% of the population.
The median household income in Presidential Lakes Estates was $60,938, and the median family income was $68,750. The per capita income was $27,945. About 4.3% of families and 5.7% of the population were below the poverty line, including 8.2% of those under age 18 and 3.2% of those age 65 or over.
Common Questions
What is Per Capita Income in Presidential Lakes Estates?
Per Capita income in Presidential Lakes Estates is $37,971.
What is the Median Family Income in Presidential Lakes Estates?
Median Family Income in Presidential Lakes Estates is $74,745.
What is the Median Household income in Presidential Lakes Estates?
Median Household Income in Presidential Lakes Estates is $84,423.
What is Inequality or Gini Index in Presidential Lakes Estates?
Inequality or Gini Index in Presidential Lakes Estates is 0.37.
What is the Total Population of Presidential Lakes Estates?
Total Population of Presidential Lakes Estates is 2,460.
What is the Total Male Population of Presidential Lakes Estates?
Total Male Population of Presidential Lakes Estates is 1,388.
What is the Total Female Population of Presidential Lakes Estates?
Total Female Population of Presidential Lakes Estates is 1,072.
What is the Ratio of Males per 100 Females in Presidential Lakes Estates?
There are 129.48 Males per 100 Females in Presidential Lakes Estates.
What is the Ratio of Females per 100 Males in Presidential Lakes Estates?
There are 77.23 Females per 100 Males in Presidential Lakes Estates.
What is the Median Population Age in Presidential Lakes Estates?
Median Population Age in Presidential Lakes Estates is 42.0 Years.
What is the Average Family Size in Presidential Lakes Estates
Average Family Size in Presidential Lakes Estates is 3.1 People.
What is the Average Household Size in Presidential Lakes Estates
Average Household Size in Presidential Lakes Estates is 2.7 People.
How Large is the Labor Force in Presidential Lakes Estates?
There are 1,454 People in the Labor Forcein in Presidential Lakes Estates.
What is the Percentage of People in the Labor Force in Presidential Lakes Estates?
70.7% of People are in the Labor Force in Presidential Lakes Estates.
What is the Unemployment Rate in Presidential Lakes Estates?
Unemployment Rate in Presidential Lakes Estates is 12.6%.