Alpine borough, NJ Map & Demographics
Alpine borough Overview
$124,312
PER CAPITA INCOME
$242,969
AVG FAMILY INCOME
$228,194
AVG HOUSEHOLD INCOME
57.6%
WAGE / INCOME GAP [ % ]
42.4¢/ $1
WAGE / INCOME GAP [ $ ]
0.51
INEQUALITY / GINI INDEX
1,449
TOTAL POPULATION
773
MALE POPULATION
676
FEMALE POPULATION
114.35
MALES / 100 FEMALES
87.45
FEMALES / 100 MALES
49.2
MEDIAN AGE
3.1
AVG FAMILY SIZE
2.8
AVG HOUSEHOLD SIZE
637
LABOR FORCE [ PEOPLE ]
55.3%
PERCENT IN LABOR FORCE
8.9%
UNEMPLOYMENT RATE
Income in Alpine borough
Income Overview in Alpine borough
Per Capita Income in Alpine borough is $124,312, while median incomes of families and households are $242,969 and $228,194 respectively.
| Characteristic | Number | Measure |
| Per Capita Income | 1,449 | $124,312 |
| Median Family Income | 425 | $242,969 |
| Mean Family Income | 425 | $384,804 |
| Median Household Income | 515 | $228,194 |
| Mean Household Income | 515 | $352,198 |
| Income Deficit | 425 | $0 |
| Wage / Income Gap (%) | 1,449 | 57.58% |
| Wage / Income Gap ($) | 1,449 | 42.42¢ per $1 |
| Gini / Inequality Index | 1,449 | 0.51 |
Earnings by Sex in Alpine borough
Average Earnings in Alpine borough are $108,750, $164,583 for men and $69,821 for women, a difference of 57.6%.
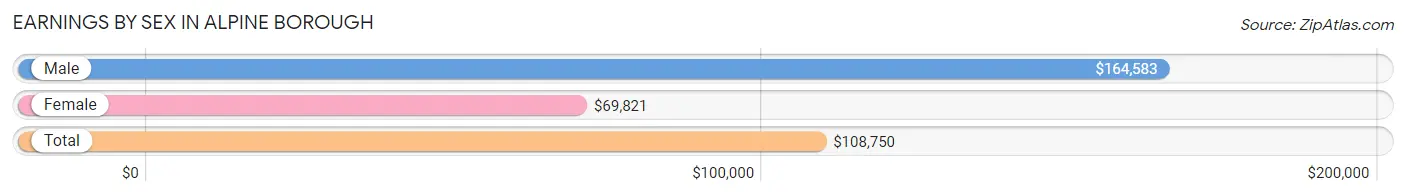
| Sex | Number | Average Earnings |
| Male | 381 (58.3%) | $164,583 |
| Female | 273 (41.7%) | $69,821 |
| Total | 654 (100.0%) | $108,750 |
Earnings by Sex by Income Bracket in Alpine borough
The most common earnings brackets in Alpine borough are $100,000+ for men (260 | 68.2%) and $100,000+ for women (77 | 28.2%).
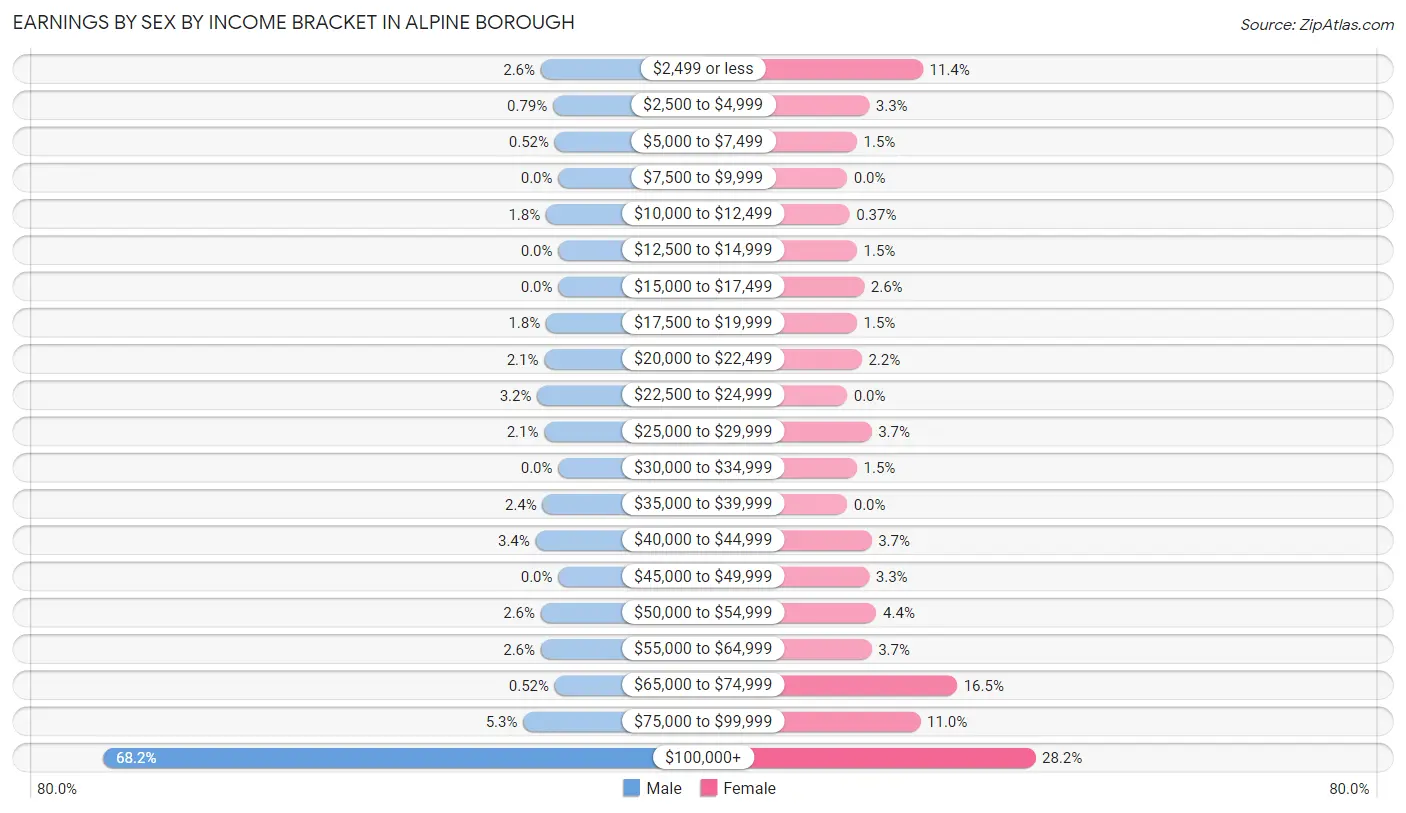
| Income | Male | Female |
| $2,499 or less | 10 (2.6%) | 31 (11.4%) |
| $2,500 to $4,999 | 3 (0.8%) | 9 (3.3%) |
| $5,000 to $7,499 | 2 (0.5%) | 4 (1.5%) |
| $7,500 to $9,999 | 0 (0.0%) | 0 (0.0%) |
| $10,000 to $12,499 | 7 (1.8%) | 1 (0.4%) |
| $12,500 to $14,999 | 0 (0.0%) | 4 (1.5%) |
| $15,000 to $17,499 | 0 (0.0%) | 7 (2.6%) |
| $17,500 to $19,999 | 7 (1.8%) | 4 (1.5%) |
| $20,000 to $22,499 | 8 (2.1%) | 6 (2.2%) |
| $22,500 to $24,999 | 12 (3.2%) | 0 (0.0%) |
| $25,000 to $29,999 | 8 (2.1%) | 10 (3.7%) |
| $30,000 to $34,999 | 0 (0.0%) | 4 (1.5%) |
| $35,000 to $39,999 | 9 (2.4%) | 0 (0.0%) |
| $40,000 to $44,999 | 13 (3.4%) | 10 (3.7%) |
| $45,000 to $49,999 | 0 (0.0%) | 9 (3.3%) |
| $50,000 to $54,999 | 10 (2.6%) | 12 (4.4%) |
| $55,000 to $64,999 | 10 (2.6%) | 10 (3.7%) |
| $65,000 to $74,999 | 2 (0.5%) | 45 (16.5%) |
| $75,000 to $99,999 | 20 (5.2%) | 30 (11.0%) |
| $100,000+ | 260 (68.2%) | 77 (28.2%) |
| Total | 381 (100.0%) | 273 (100.0%) |
Earnings by Sex by Educational Attainment in Alpine borough
Average earnings in Alpine borough are $175,104 for men and $72,174 for women, a difference of 58.8%. Men with an educational attainment of graduate degree enjoy the highest average annual earnings of $233,750, while those with high school diploma education earn the least with $113,958. Women with an educational attainment of graduate degree earn the most with the average annual earnings of $111,250, while those with college or associate's degree education have the smallest earnings of $67,361.
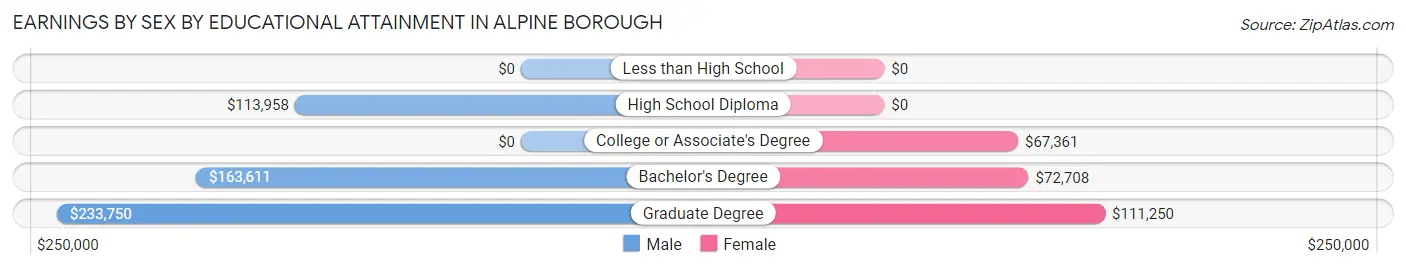
| Educational Attainment | Male Income | Female Income |
| Less than High School | - | - |
| High School Diploma | $113,958 | $0 |
| College or Associate's Degree | - | - |
| Bachelor's Degree | $163,611 | $72,708 |
| Graduate Degree | $233,750 | $111,250 |
| Total | $175,104 | $72,174 |
Family Income in Alpine borough
Family Income Brackets in Alpine borough
According to the Alpine borough family income data, there are 243 families falling into the $200,000+ income range, which is the most common income bracket and makes up 57.2% of all families.
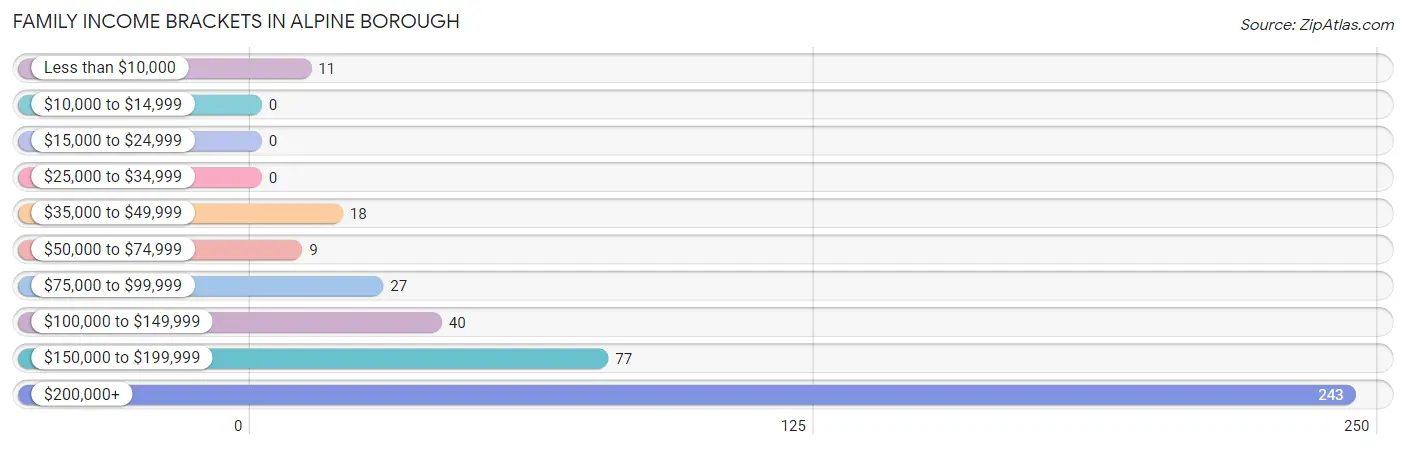
| Income Bracket | # Families | % Families |
| Less than $10,000 | 11 | 2.6% |
| $10,000 to $14,999 | 0 | 0.0% |
| $15,000 to $24,999 | 0 | 0.0% |
| $25,000 to $34,999 | 0 | 0.0% |
| $35,000 to $49,999 | 18 | 4.2% |
| $50,000 to $74,999 | 9 | 2.1% |
| $75,000 to $99,999 | 27 | 6.4% |
| $100,000 to $149,999 | 40 | 9.4% |
| $150,000 to $199,999 | 77 | 18.1% |
| $200,000+ | 243 | 57.2% |
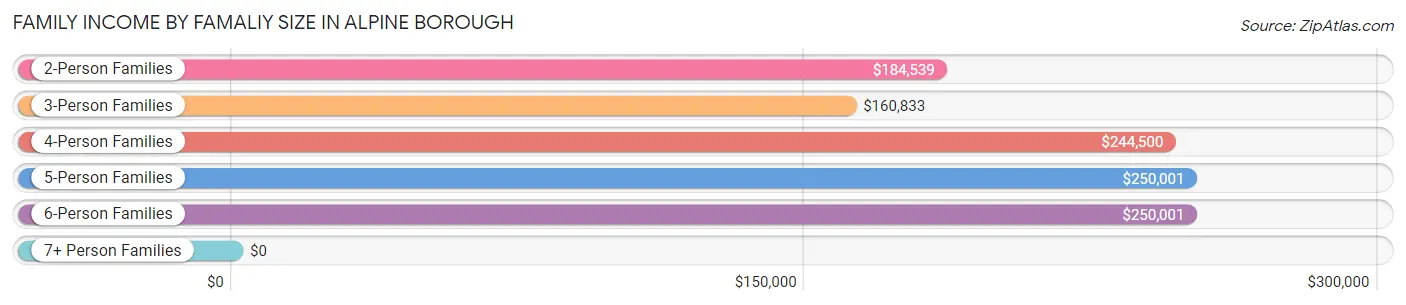
Family Income by Famaliy Size in Alpine borough
5-person families (37 | 8.7%) account for the highest median family income in Alpine borough with $250,001 per family, while 2-person families (185 | 43.5%) have the highest median income of $92,270 per family member.
| Income Bracket | # Families | Median Income |
| 2-Person Families | 185 (43.5%) | $184,539 |
| 3-Person Families | 68 (16.0%) | $160,833 |
| 4-Person Families | 118 (27.8%) | $244,500 |
| 5-Person Families | 37 (8.7%) | $250,001 |
| 6-Person Families | 17 (4.0%) | $250,001 |
| 7+ Person Families | 0 (0.0%) | $0 |
| Total | 425 (100.0%) | $242,969 |
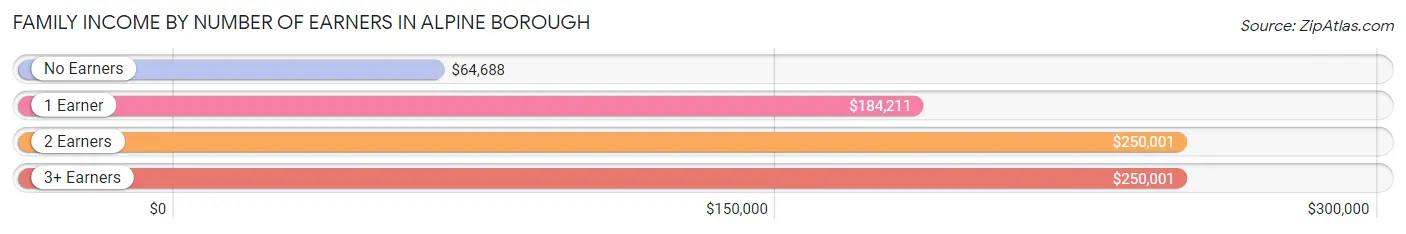
Family Income by Number of Earners in Alpine borough
The median family income in Alpine borough is $242,969, with families comprising 2 earners (166) having the highest median family income of $250,001, while families with no earners (63) have the lowest median family income of $64,688, accounting for 39.1% and 14.8% of families, respectively.
| Number of Earners | # Families | Median Income |
| No Earners | 63 (14.8%) | $64,688 |
| 1 Earner | 152 (35.8%) | $184,211 |
| 2 Earners | 166 (39.1%) | $250,001 |
| 3+ Earners | 44 (10.3%) | $250,001 |
| Total | 425 (100.0%) | $242,969 |
Household Income in Alpine borough
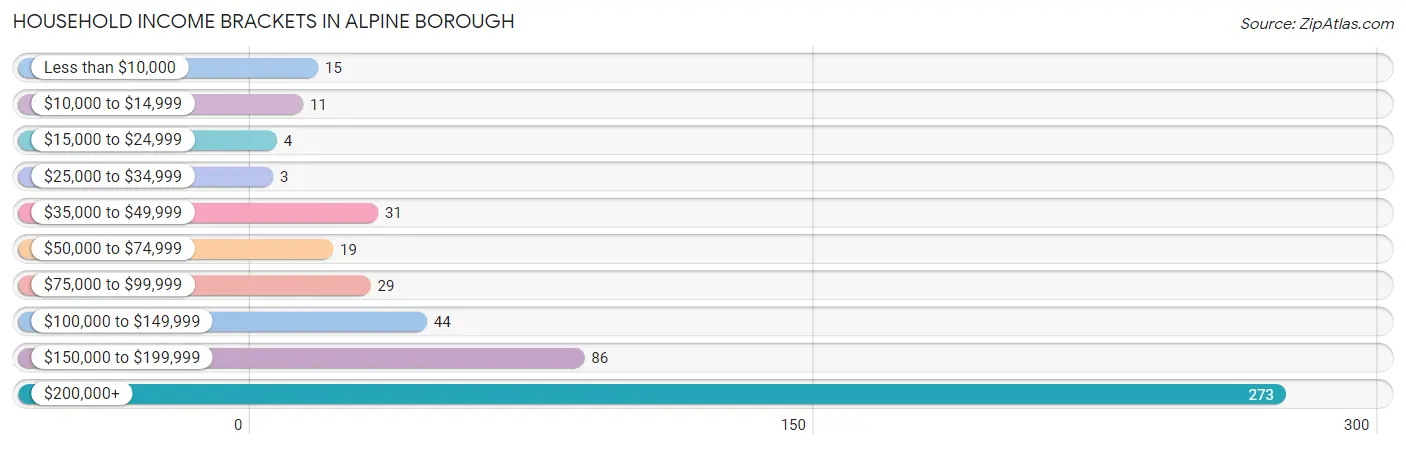
Household Income Brackets in Alpine borough
With 273 households falling in the category, the $200,000+ income range is the most frequent in Alpine borough, accounting for 53.0% of all households. In contrast, only 3 households (0.6%) fall into the $25,000 to $34,999 income bracket, making it the least populous group.
| Income Bracket | # Households | % Households |
| Less than $10,000 | 15 | 2.9% |
| $10,000 to $14,999 | 11 | 2.1% |
| $15,000 to $24,999 | 4 | 0.8% |
| $25,000 to $34,999 | 3 | 0.6% |
| $35,000 to $49,999 | 31 | 6.0% |
| $50,000 to $74,999 | 19 | 3.7% |
| $75,000 to $99,999 | 29 | 5.6% |
| $100,000 to $149,999 | 44 | 8.5% |
| $150,000 to $199,999 | 86 | 16.7% |
| $200,000+ | 273 | 53.0% |
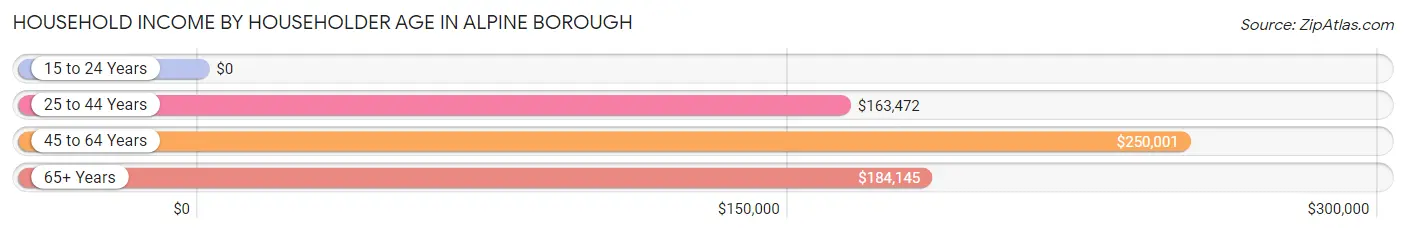
Household Income by Householder Age in Alpine borough
The median household income in Alpine borough is $228,194, with the highest median household income of $250,001 found in the 45 to 64 years age bracket for the primary householder. A total of 181 households (35.1%) fall into this category.
| Income Bracket | # Households | Median Income |
| 15 to 24 Years | 0 (0.0%) | $0 |
| 25 to 44 Years | 77 (14.9%) | $163,472 |
| 45 to 64 Years | 181 (35.1%) | $250,001 |
| 65+ Years | 257 (49.9%) | $184,145 |
| Total | 515 (100.0%) | $228,194 |
Poverty in Alpine borough
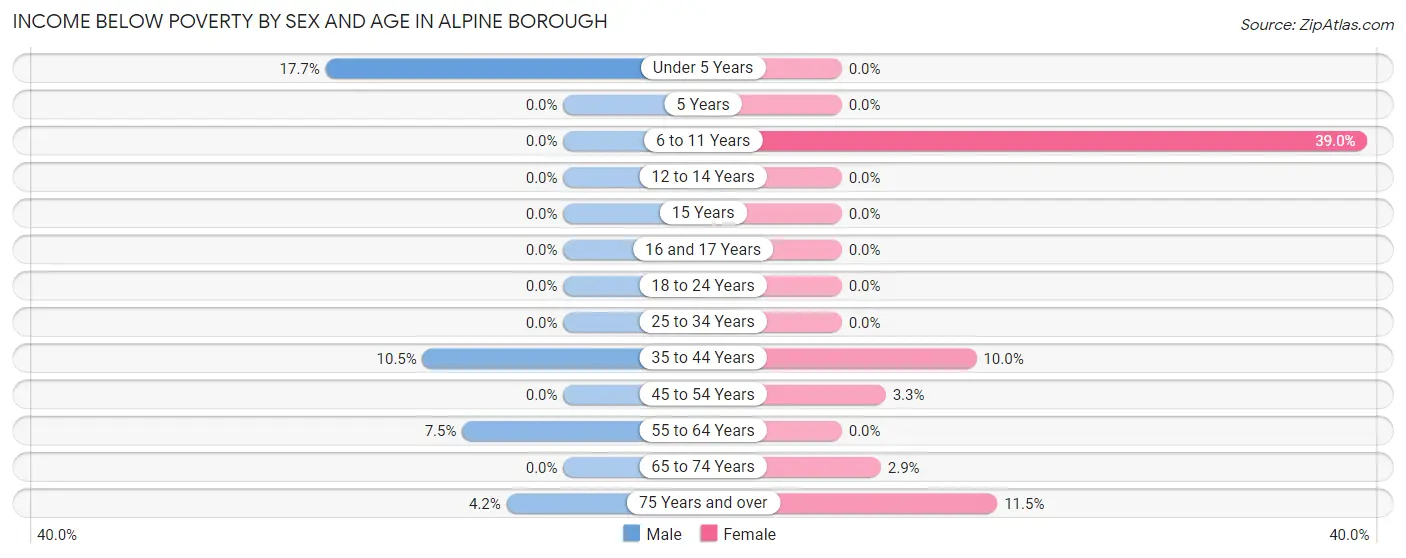
Income Below Poverty by Sex and Age in Alpine borough
With 3.4% poverty level for males and 5.9% for females among the residents of Alpine borough, under 5 year old males and 6 to 11 year old females are the most vulnerable to poverty, with 9 males (17.6%) and 16 females (39.0%) in their respective age groups living below the poverty level.
| Age Bracket | Male | Female |
| Under 5 Years | 9 (17.6%) | 0 (0.0%) |
| 5 Years | 0 (0.0%) | 0 (0.0%) |
| 6 to 11 Years | 0 (0.0%) | 16 (39.0%) |
| 12 to 14 Years | 0 (0.0%) | 0 (0.0%) |
| 15 Years | 0 (0.0%) | 0 (0.0%) |
| 16 and 17 Years | 0 (0.0%) | 0 (0.0%) |
| 18 to 24 Years | 0 (0.0%) | 0 (0.0%) |
| 25 to 34 Years | 0 (0.0%) | 0 (0.0%) |
| 35 to 44 Years | 7 (10.4%) | 8 (10.0%) |
| 45 to 54 Years | 0 (0.0%) | 3 (3.3%) |
| 55 to 64 Years | 6 (7.5%) | 0 (0.0%) |
| 65 to 74 Years | 0 (0.0%) | 4 (2.9%) |
| 75 Years and over | 4 (4.2%) | 9 (11.5%) |
| Total | 26 (3.4%) | 40 (5.9%) |
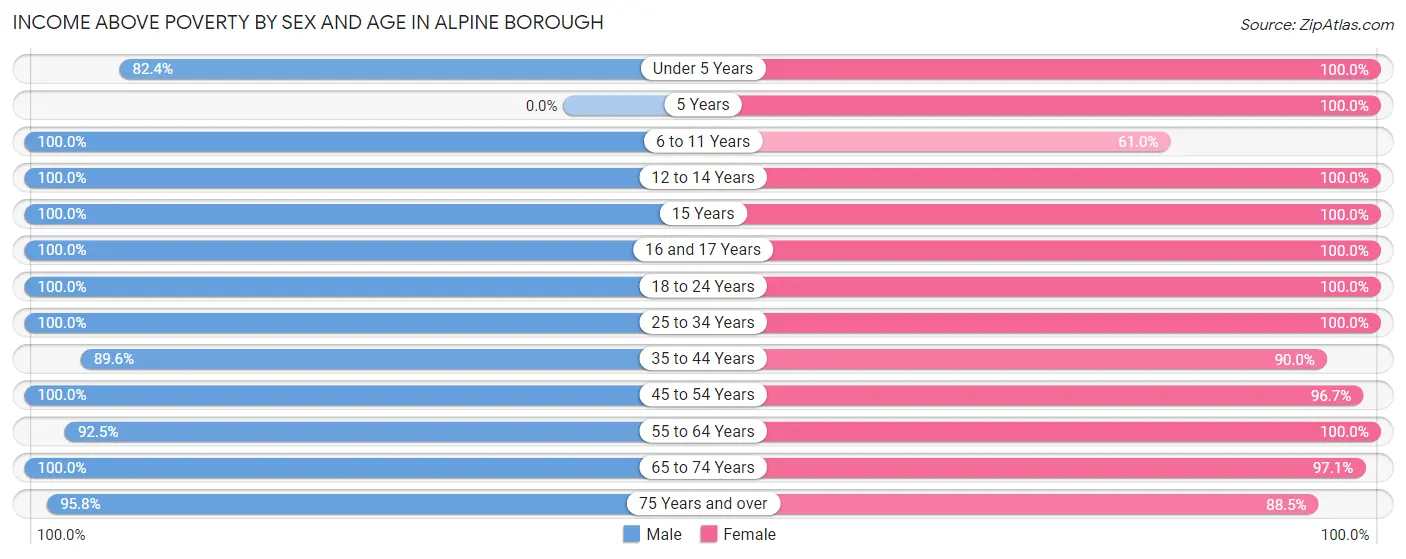
Income Above Poverty by Sex and Age in Alpine borough
According to the poverty statistics in Alpine borough, males aged 6 to 11 years and females aged under 5 years are the age groups that are most secure financially, with 100.0% of males and 100.0% of females in these age groups living above the poverty line.
| Age Bracket | Male | Female |
| Under 5 Years | 42 (82.4%) | 17 (100.0%) |
| 5 Years | 0 (0.0%) | 5 (100.0%) |
| 6 to 11 Years | 29 (100.0%) | 25 (61.0%) |
| 12 to 14 Years | 79 (100.0%) | 24 (100.0%) |
| 15 Years | 35 (100.0%) | 16 (100.0%) |
| 16 and 17 Years | 25 (100.0%) | 17 (100.0%) |
| 18 to 24 Years | 37 (100.0%) | 55 (100.0%) |
| 25 to 34 Years | 40 (100.0%) | 36 (100.0%) |
| 35 to 44 Years | 60 (89.5%) | 72 (90.0%) |
| 45 to 54 Years | 84 (100.0%) | 89 (96.7%) |
| 55 to 64 Years | 74 (92.5%) | 77 (100.0%) |
| 65 to 74 Years | 151 (100.0%) | 134 (97.1%) |
| 75 Years and over | 91 (95.8%) | 69 (88.5%) |
| Total | 747 (96.6%) | 636 (94.1%) |
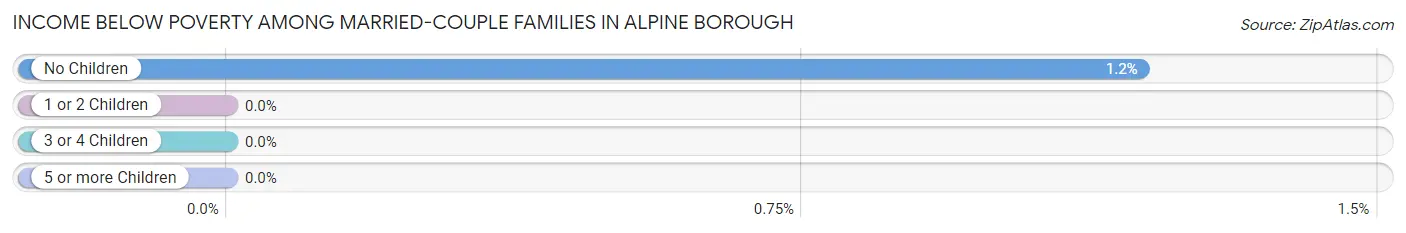
Income Below Poverty Among Married-Couple Families in Alpine borough
The poverty statistics for married-couple families in Alpine borough show that 0.8% or 3 of the total 391 families live below the poverty line. Families with no children have the highest poverty rate of 1.2%, comprising of 3 families. On the other hand, families with 1 or 2 children have the lowest poverty rate of 0.0%, which includes 0 families.
| Children | Above Poverty | Below Poverty |
| No Children | 250 (98.8%) | 3 (1.2%) |
| 1 or 2 Children | 118 (100.0%) | 0 (0.0%) |
| 3 or 4 Children | 20 (100.0%) | 0 (0.0%) |
| 5 or more Children | 0 (0.0%) | 0 (0.0%) |
| Total | 388 (99.2%) | 3 (0.8%) |
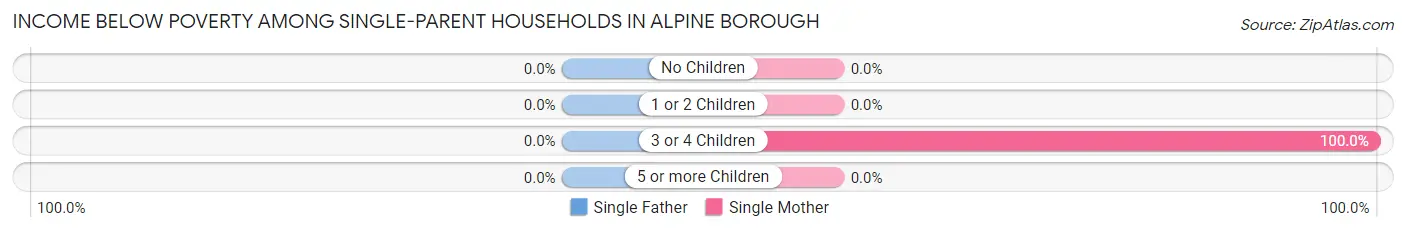
Income Below Poverty Among Single-Parent Households in Alpine borough
| Children | Single Father | Single Mother |
| No Children | 0 (0.0%) | 0 (0.0%) |
| 1 or 2 Children | 0 (0.0%) | 0 (0.0%) |
| 3 or 4 Children | 0 (0.0%) | 8 (100.0%) |
| 5 or more Children | 0 (0.0%) | 0 (0.0%) |
| Total | 0 (0.0%) | 8 (26.7%) |
Income Below Poverty Among Married-Couple vs Single-Parent Households in Alpine borough
The poverty data for Alpine borough shows that 3 of the married-couple family households (0.8%) and 8 of the single-parent households (23.5%) are living below the poverty level. Within the married-couple family households, those with no children have the highest poverty rate, with 3 households (1.2%) falling below the poverty line. Among the single-parent households, those with 3 or 4 children have the highest poverty rate, with 8 household (100.0%) living below poverty.
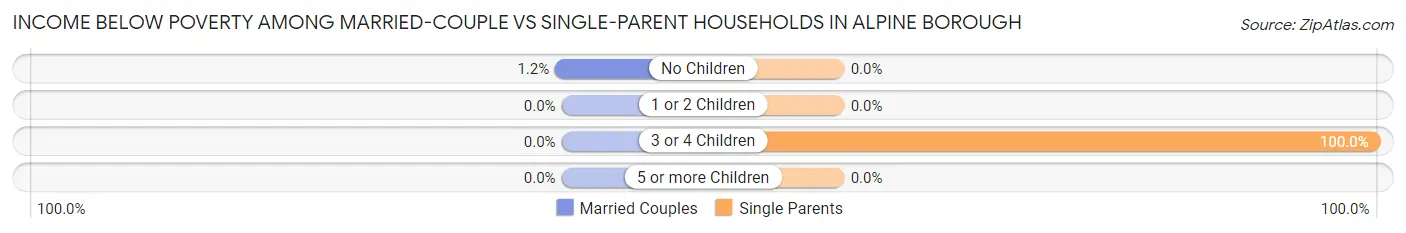
| Children | Married-Couple Families | Single-Parent Households |
| No Children | 3 (1.2%) | 0 (0.0%) |
| 1 or 2 Children | 0 (0.0%) | 0 (0.0%) |
| 3 or 4 Children | 0 (0.0%) | 8 (100.0%) |
| 5 or more Children | 0 (0.0%) | 0 (0.0%) |
| Total | 3 (0.8%) | 8 (23.5%) |
Race in Alpine borough
The most populous races in Alpine borough are White / Caucasian (913 | 63.0%), Asian (451 | 31.1%), and Hispanic or Latino (94 | 6.5%).
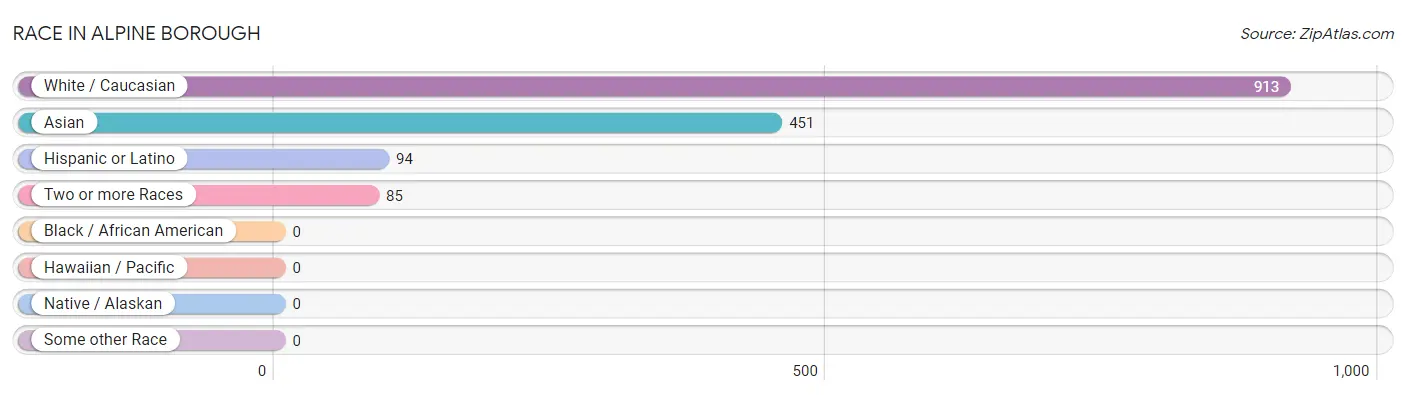
| Race | # Population | % Population |
| Asian | 451 | 31.1% |
| Black / African American | 0 | 0.0% |
| Hawaiian / Pacific | 0 | 0.0% |
| Hispanic or Latino | 94 | 6.5% |
| Native / Alaskan | 0 | 0.0% |
| White / Caucasian | 913 | 63.0% |
| Two or more Races | 85 | 5.9% |
| Some other Race | 0 | 0.0% |
| Total | 1,449 | 100.0% |
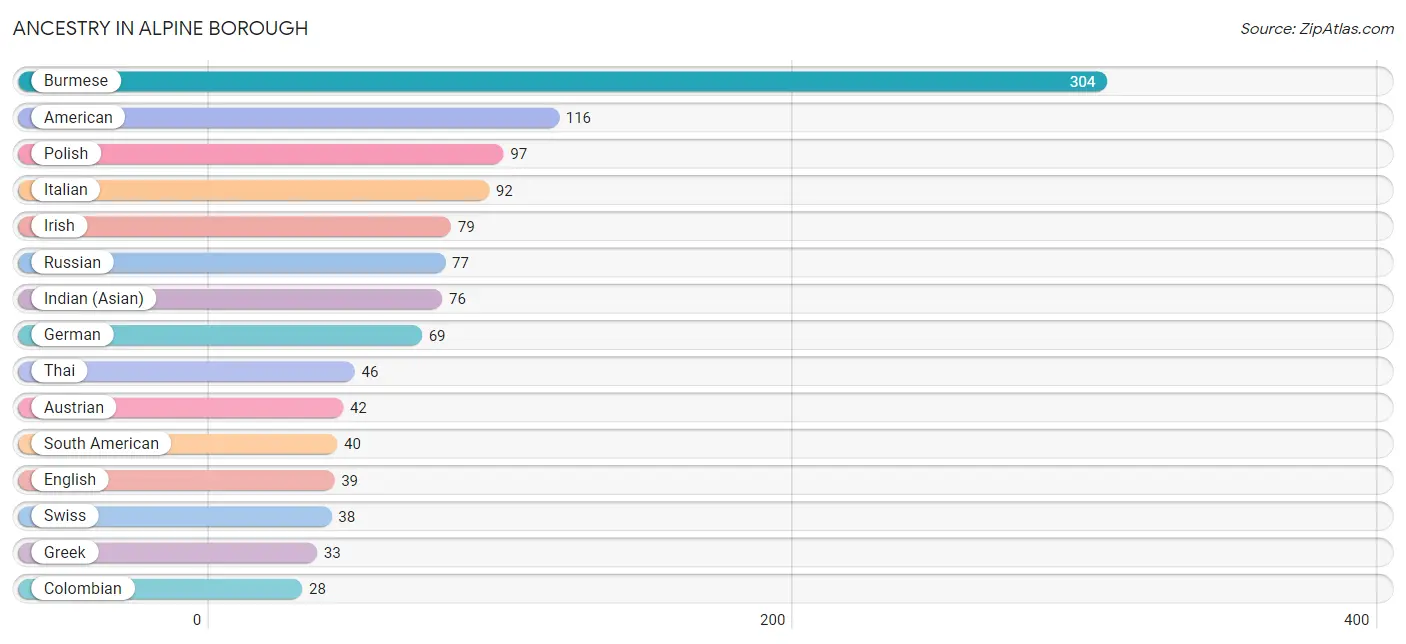
Ancestry in Alpine borough
The most populous ancestries reported in Alpine borough are Burmese (304 | 21.0%), American (116 | 8.0%), Polish (97 | 6.7%), Italian (92 | 6.4%), and Irish (79 | 5.4%), together accounting for 47.5% of all Alpine borough residents.
| Ancestry | # Population | % Population |
| American | 116 | 8.0% |
| Arab | 10 | 0.7% |
| Armenian | 23 | 1.6% |
| Austrian | 42 | 2.9% |
| Bhutanese | 12 | 0.8% |
| British | 21 | 1.5% |
| Burmese | 304 | 21.0% |
| Choctaw | 3 | 0.2% |
| Colombian | 28 | 1.9% |
| Dutch | 3 | 0.2% |
| Eastern European | 27 | 1.9% |
| English | 39 | 2.7% |
| German | 69 | 4.8% |
| Greek | 33 | 2.3% |
| Hungarian | 3 | 0.2% |
| Indian (Asian) | 76 | 5.2% |
| Iranian | 7 | 0.5% |
| Irish | 79 | 5.4% |
| Italian | 92 | 6.4% |
| Jamaican | 9 | 0.6% |
| Korean | 20 | 1.4% |
| Mexican | 14 | 1.0% |
| Moroccan | 3 | 0.2% |
| Norwegian | 11 | 0.8% |
| Polish | 97 | 6.7% |
| Portuguese | 5 | 0.4% |
| Puerto Rican | 9 | 0.6% |
| Romanian | 4 | 0.3% |
| Russian | 77 | 5.3% |
| Scotch-Irish | 1 | 0.1% |
| Scottish | 6 | 0.4% |
| Slavic | 3 | 0.2% |
| South American | 40 | 2.8% |
| Spaniard | 9 | 0.6% |
| Spanish | 22 | 1.5% |
| Swedish | 3 | 0.2% |
| Swiss | 38 | 2.6% |
| Syrian | 4 | 0.3% |
| Thai | 46 | 3.2% |
| Ukrainian | 18 | 1.2% |
| Venezuelan | 12 | 0.8% | View All 41 Rows |
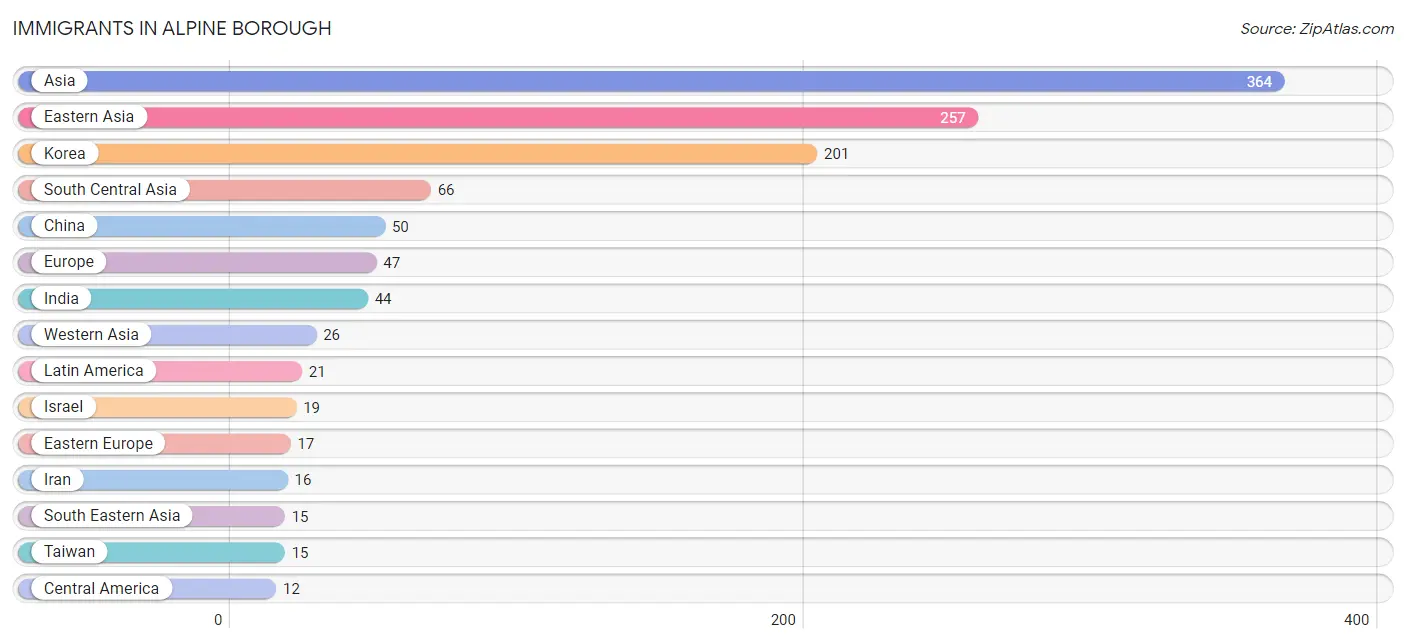
Immigrants in Alpine borough
The most numerous immigrant groups reported in Alpine borough came from Asia (364 | 25.1%), Eastern Asia (257 | 17.7%), Korea (201 | 13.9%), South Central Asia (66 | 4.5%), and China (50 | 3.5%), together accounting for 64.7% of all Alpine borough residents.
| Immigration Origin | # Population | % Population |
| Africa | 6 | 0.4% |
| Asia | 364 | 25.1% |
| Caribbean | 9 | 0.6% |
| Central America | 12 | 0.8% |
| China | 50 | 3.5% |
| Eastern Africa | 2 | 0.1% |
| Eastern Asia | 257 | 17.7% |
| Eastern Europe | 17 | 1.2% |
| Europe | 47 | 3.2% |
| Germany | 10 | 0.7% |
| Greece | 6 | 0.4% |
| Honduras | 12 | 0.8% |
| Hong Kong | 2 | 0.1% |
| India | 44 | 3.0% |
| Indonesia | 2 | 0.1% |
| Iran | 16 | 1.1% |
| Israel | 19 | 1.3% |
| Jamaica | 9 | 0.6% |
| Japan | 6 | 0.4% |
| Kazakhstan | 4 | 0.3% |
| Kenya | 2 | 0.1% |
| Korea | 201 | 13.9% |
| Latin America | 21 | 1.5% |
| Lebanon | 5 | 0.4% |
| Morocco | 4 | 0.3% |
| Northern Africa | 4 | 0.3% |
| Northern Europe | 11 | 0.8% |
| Pakistan | 2 | 0.1% |
| Philippines | 10 | 0.7% |
| Poland | 10 | 0.7% |
| Portugal | 3 | 0.2% |
| Russia | 7 | 0.5% |
| South Central Asia | 66 | 4.5% |
| South Eastern Asia | 15 | 1.0% |
| Southern Europe | 9 | 0.6% |
| Syria | 2 | 0.1% |
| Taiwan | 15 | 1.0% |
| Vietnam | 3 | 0.2% |
| Western Asia | 26 | 1.8% |
| Western Europe | 10 | 0.7% | View All 40 Rows |
Sex and Age in Alpine borough
Sex and Age in Alpine borough
The most populous age groups in Alpine borough are 70 to 74 Years (102 | 13.2%) for men and 65 to 69 Years (69 | 10.2%) for women.
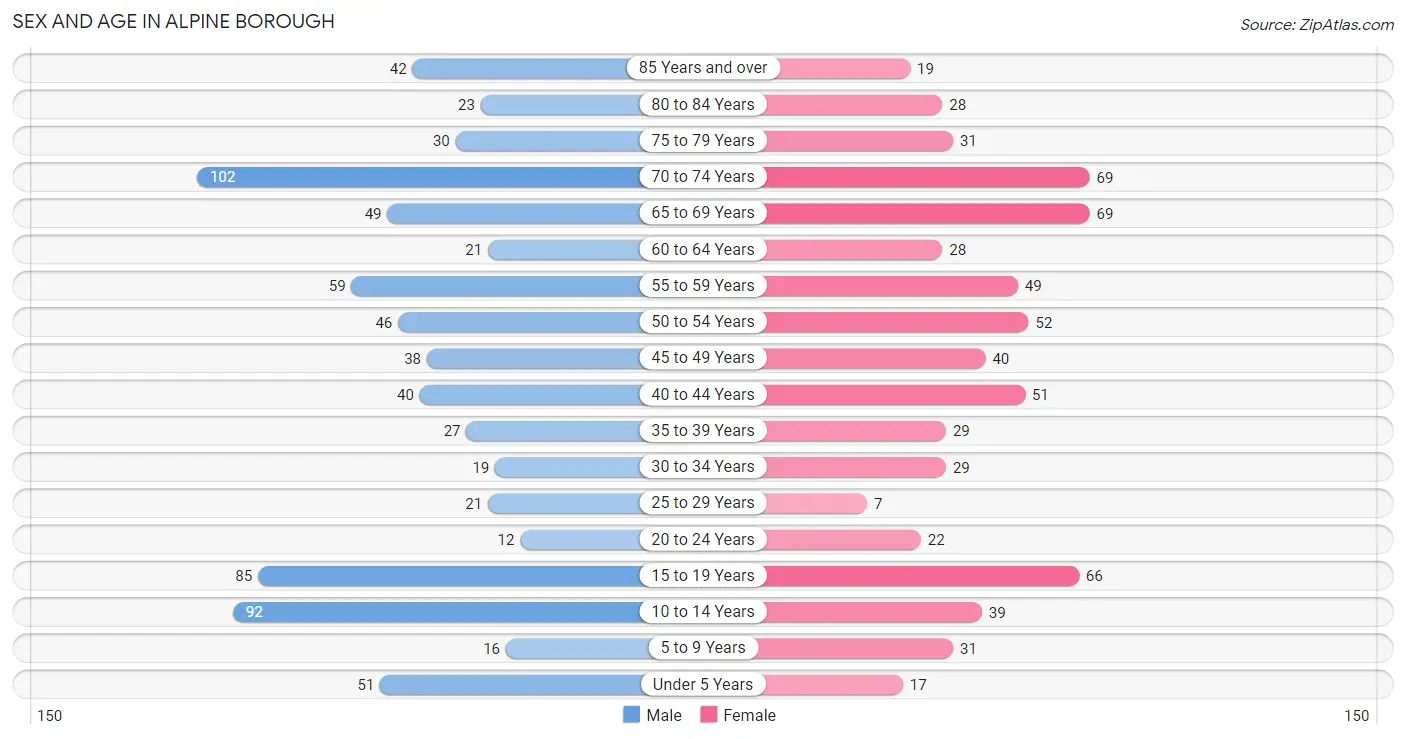
| Age Bracket | Male | Female |
| Under 5 Years | 51 (6.6%) | 17 (2.5%) |
| 5 to 9 Years | 16 (2.1%) | 31 (4.6%) |
| 10 to 14 Years | 92 (11.9%) | 39 (5.8%) |
| 15 to 19 Years | 85 (11.0%) | 66 (9.8%) |
| 20 to 24 Years | 12 (1.5%) | 22 (3.3%) |
| 25 to 29 Years | 21 (2.7%) | 7 (1.0%) |
| 30 to 34 Years | 19 (2.5%) | 29 (4.3%) |
| 35 to 39 Years | 27 (3.5%) | 29 (4.3%) |
| 40 to 44 Years | 40 (5.2%) | 51 (7.5%) |
| 45 to 49 Years | 38 (4.9%) | 40 (5.9%) |
| 50 to 54 Years | 46 (5.9%) | 52 (7.7%) |
| 55 to 59 Years | 59 (7.6%) | 49 (7.2%) |
| 60 to 64 Years | 21 (2.7%) | 28 (4.1%) |
| 65 to 69 Years | 49 (6.3%) | 69 (10.2%) |
| 70 to 74 Years | 102 (13.2%) | 69 (10.2%) |
| 75 to 79 Years | 30 (3.9%) | 31 (4.6%) |
| 80 to 84 Years | 23 (3.0%) | 28 (4.1%) |
| 85 Years and over | 42 (5.4%) | 19 (2.8%) |
| Total | 773 (100.0%) | 676 (100.0%) |
Families and Households in Alpine borough
Median Family Size in Alpine borough
The median family size in Alpine borough is 3.15 persons per family, with single female/mother families (30 | 7.1%) accounting for the largest median family size of 3.33 persons per family. On the other hand, single male/father families (4 | 0.9%) represent the smallest median family size with 2.00 persons per family.
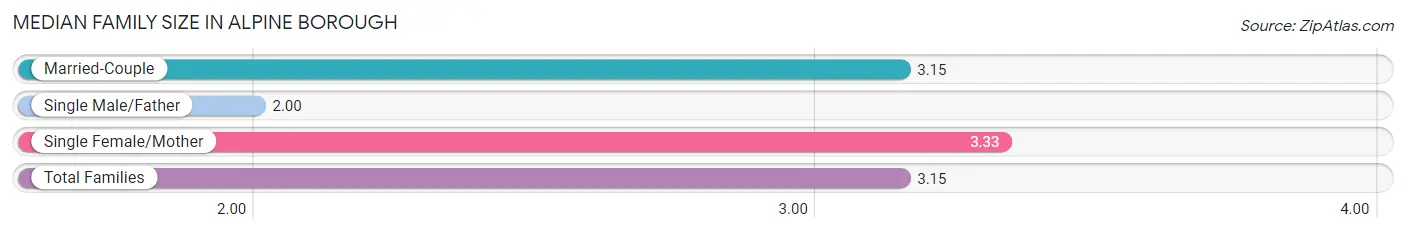
| Family Type | # Families | Family Size |
| Married-Couple | 391 (92.0%) | 3.15 |
| Single Male/Father | 4 (0.9%) | 2.00 |
| Single Female/Mother | 30 (7.1%) | 3.33 |
| Total Families | 425 (100.0%) | 3.15 |
Median Household Size in Alpine borough
The median household size in Alpine borough is 2.81 persons per household, with single female/mother households (30 | 5.8%) accounting for the largest median household size of 3.33 persons per household. non-family households (90 | 17.5%) represent the smallest median household size with 1.08 persons per household.
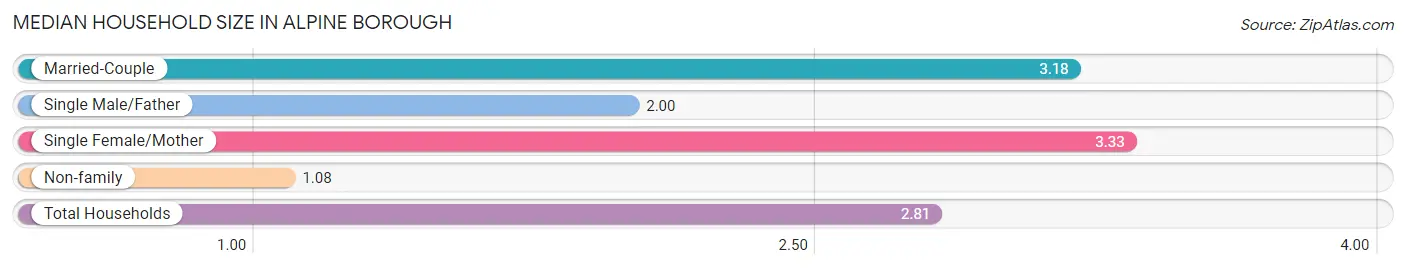
| Household Type | # Households | Household Size |
| Married-Couple | 391 (75.9%) | 3.18 |
| Single Male/Father | 4 (0.8%) | 2.00 |
| Single Female/Mother | 30 (5.8%) | 3.33 |
| Non-family | 90 (17.5%) | 1.08 |
| Total Households | 515 (100.0%) | 2.81 |
Household Size by Marriage Status in Alpine borough
Out of a total of 515 households in Alpine borough, 425 (82.5%) are family households, while 90 (17.5%) are nonfamily households. The most numerous type of family households are 2-person households, comprising 178, and the most common type of nonfamily households are 1-person households, comprising 85.
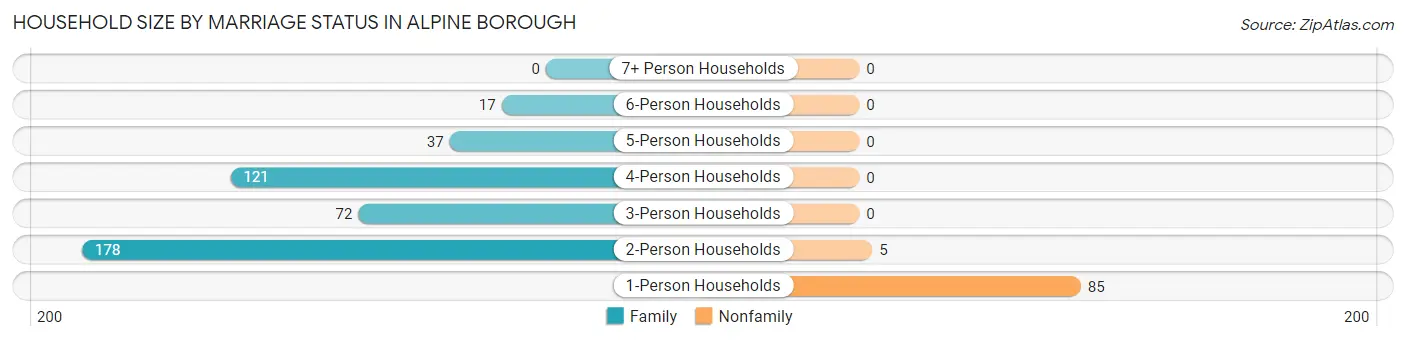
| Household Size | Family Households | Nonfamily Households |
| 1-Person Households | - | 85 (16.5%) |
| 2-Person Households | 178 (34.6%) | 5 (1.0%) |
| 3-Person Households | 72 (14.0%) | 0 (0.0%) |
| 4-Person Households | 121 (23.5%) | 0 (0.0%) |
| 5-Person Households | 37 (7.2%) | 0 (0.0%) |
| 6-Person Households | 17 (3.3%) | 0 (0.0%) |
| 7+ Person Households | 0 (0.0%) | 0 (0.0%) |
| Total | 425 (82.5%) | 90 (17.5%) |
Female Fertility in Alpine borough
Fertility by Age in Alpine borough
Average fertility rate in Alpine borough is 24.0 births per 1,000 women. Women in the age bracket of 20 to 34 years have the highest fertility rate with 103.0 births per 1,000 women. Women in the age bracket of 20 to 34 years acount for 100.0% of all women with births.
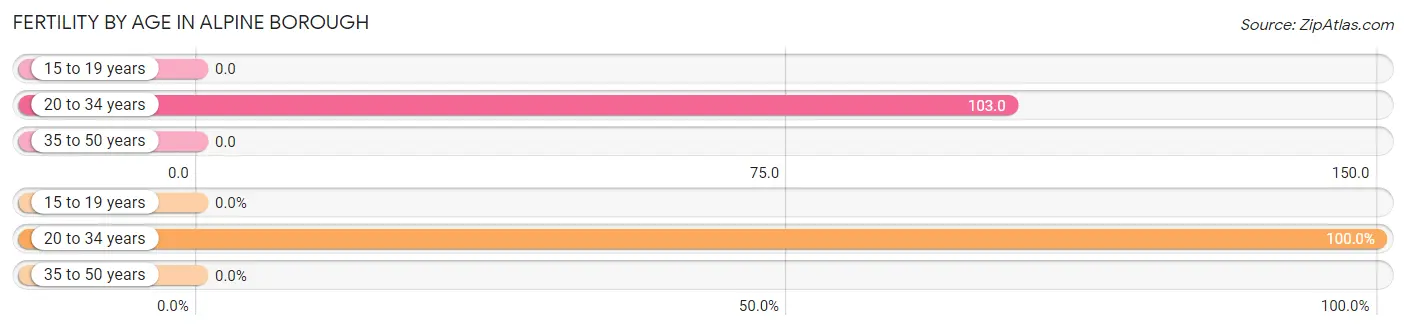
| Age Bracket | Women with Births | Births / 1,000 Women |
| 15 to 19 years | 0 (0.0%) | 0.0 |
| 20 to 34 years | 6 (100.0%) | 103.0 |
| 35 to 50 years | 0 (0.0%) | 0.0 |
| Total | 6 (100.0%) | 24.0 |
Fertility by Age by Marriage Status in Alpine borough
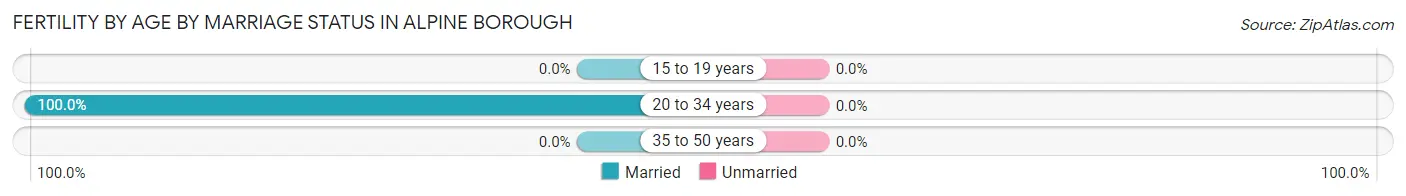
| Age Bracket | Married | Unmarried |
| 15 to 19 years | 0 (0.0%) | 0 (0.0%) |
| 20 to 34 years | 6 (100.0%) | 0 (0.0%) |
| 35 to 50 years | 0 (0.0%) | 0 (0.0%) |
| Total | 6 (100.0%) | 0 (0.0%) |
Fertility by Education in Alpine borough
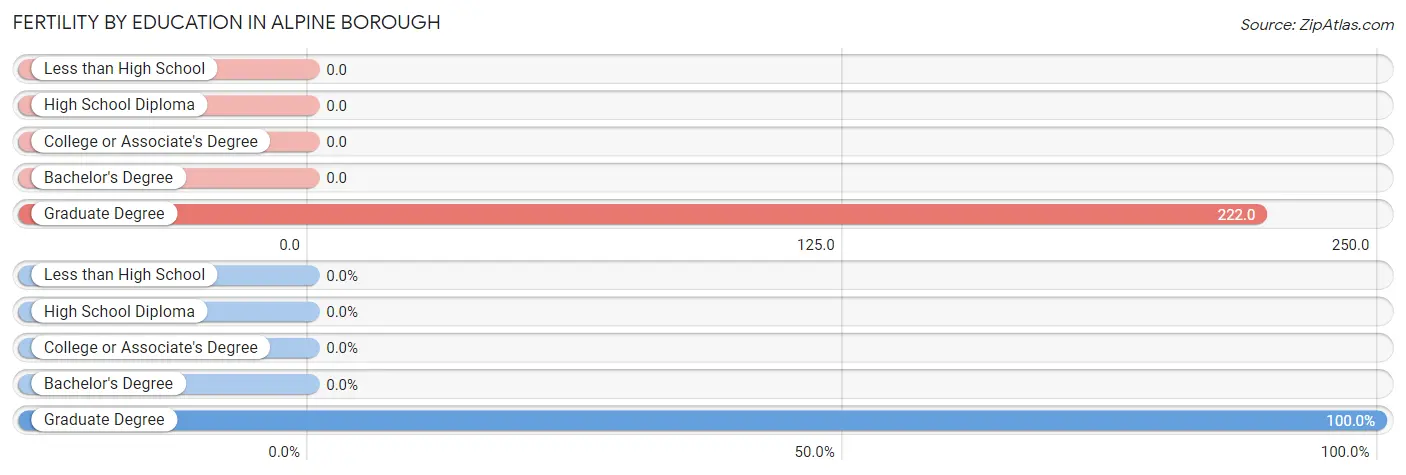
| Educational Attainment | Women with Births | Births / 1,000 Women |
| Less than High School | 0 (0.0%) | 0.0 |
| High School Diploma | 0 (0.0%) | 0.0 |
| College or Associate's Degree | 0 (0.0%) | 0.0 |
| Bachelor's Degree | 0 (0.0%) | 0.0 |
| Graduate Degree | 6 (100.0%) | 222.0 |
| Total | 6 (100.0%) | 24.0 |
Fertility by Education by Marriage Status in Alpine borough
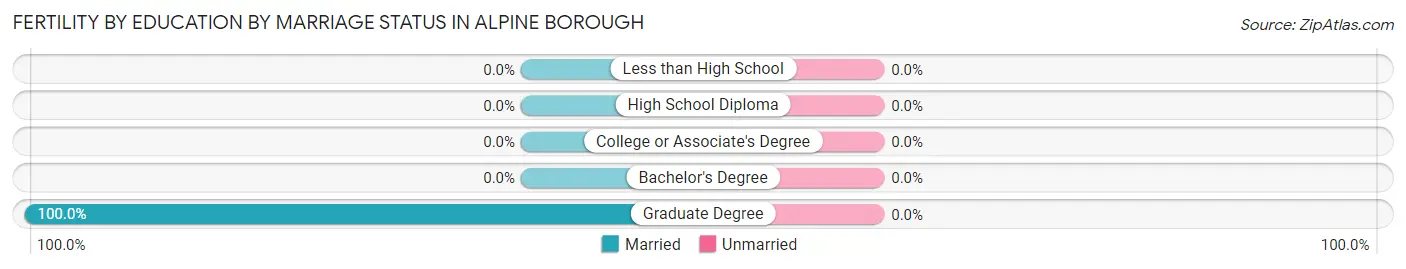
| Educational Attainment | Married | Unmarried |
| Less than High School | 0 (0.0%) | 0 (0.0%) |
| High School Diploma | 0 (0.0%) | 0 (0.0%) |
| College or Associate's Degree | 0 (0.0%) | 0 (0.0%) |
| Bachelor's Degree | 0 (0.0%) | 0 (0.0%) |
| Graduate Degree | 6 (100.0%) | 0 (0.0%) |
| Total | 6 (100.0%) | 0 (0.0%) |
Employment Characteristics in Alpine borough
Employment by Class of Employer in Alpine borough
Among the 571 employed individuals in Alpine borough, private company employees (340 | 59.5%), self-employed (incorporated) (124 | 21.7%), and not-for-profit organizations (66 | 11.6%) make up the most common classes of employment.
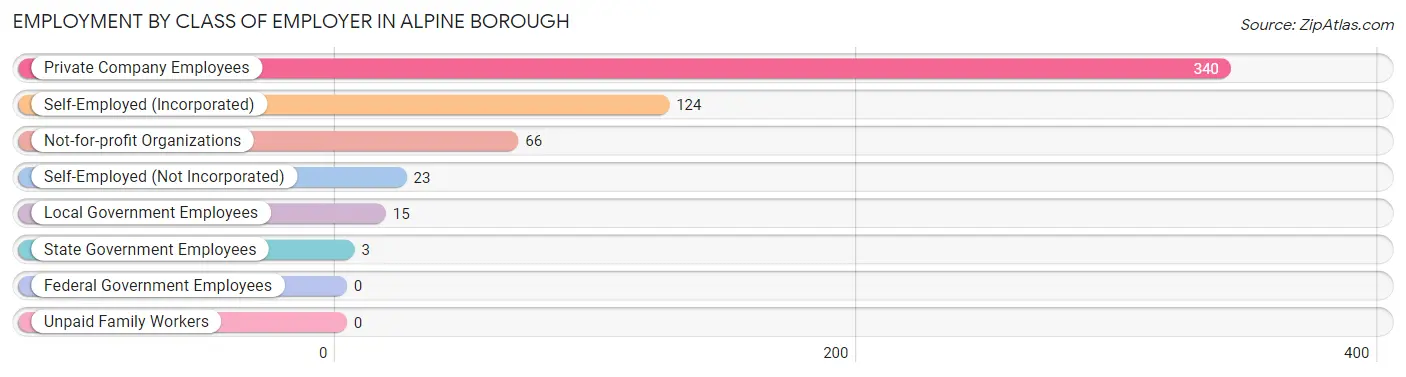
| Employer Class | # Employees | % Employees |
| Private Company Employees | 340 | 59.5% |
| Self-Employed (Incorporated) | 124 | 21.7% |
| Self-Employed (Not Incorporated) | 23 | 4.0% |
| Not-for-profit Organizations | 66 | 11.6% |
| Local Government Employees | 15 | 2.6% |
| State Government Employees | 3 | 0.5% |
| Federal Government Employees | 0 | 0.0% |
| Unpaid Family Workers | 0 | 0.0% |
| Total | 571 | 100.0% |
Employment Status by Age in Alpine borough
According to the labor force statistics for Alpine borough, out of the total population over 16 years of age (1,152), 55.3% or 637 individuals are in the labor force, with 8.9% or 57 of them unemployed. The age group with the highest labor force participation rate is 35 to 44 years, with 87.1% or 128 individuals in the labor force. Within the labor force, the 16 to 19 years age range has the highest percentage of unemployed individuals, with 100.0% or 17 of them being unemployed.
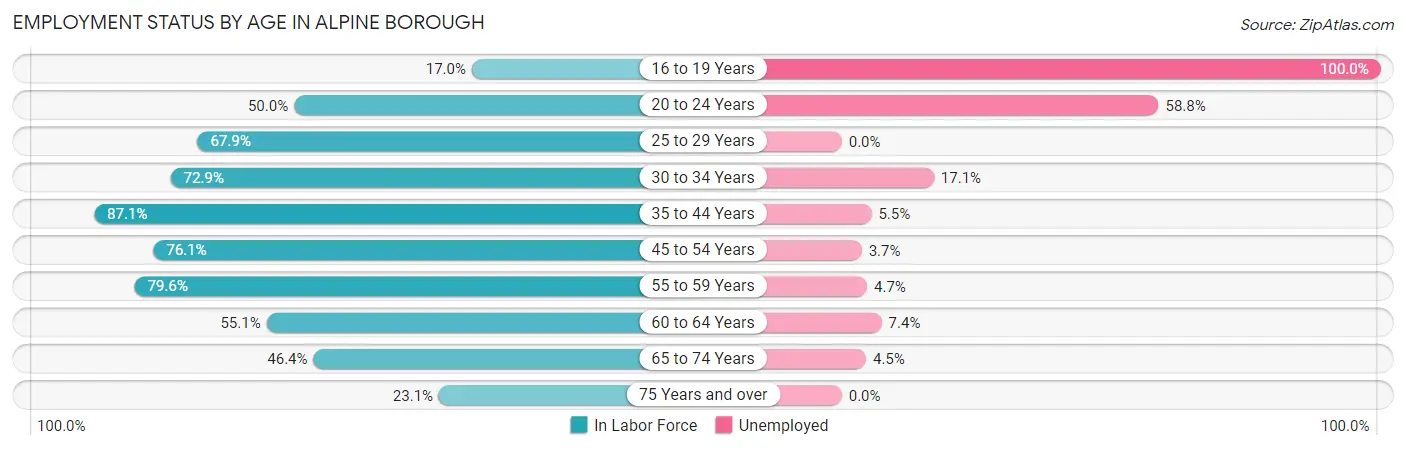
| Age Bracket | In Labor Force | Unemployed |
| 16 to 19 Years | 17 (17.0%) | 17 (100.0%) |
| 20 to 24 Years | 17 (50.0%) | 10 (58.8%) |
| 25 to 29 Years | 19 (67.9%) | 0 (0.0%) |
| 30 to 34 Years | 35 (72.9%) | 6 (17.1%) |
| 35 to 44 Years | 128 (87.1%) | 7 (5.5%) |
| 45 to 54 Years | 134 (76.1%) | 5 (3.7%) |
| 55 to 59 Years | 86 (79.6%) | 4 (4.7%) |
| 60 to 64 Years | 27 (55.1%) | 2 (7.4%) |
| 65 to 74 Years | 134 (46.4%) | 6 (4.5%) |
| 75 Years and over | 40 (23.1%) | 0 (0.0%) |
| Total | 637 (55.3%) | 57 (8.9%) |
Employment Status by Educational Attainment in Alpine borough
According to labor force statistics for Alpine borough, 77.2% of individuals (429) out of the total population between 25 and 64 years of age (556) are in the labor force, with 5.6% or 24 of them being unemployed. The group with the highest labor force participation rate are those with the educational attainment of high school diploma, with 87.2% or 34 individuals in the labor force. Within the labor force, individuals with college / associate degree education have the highest percentage of unemployment, with 18.8% or 6 of them being unemployed.
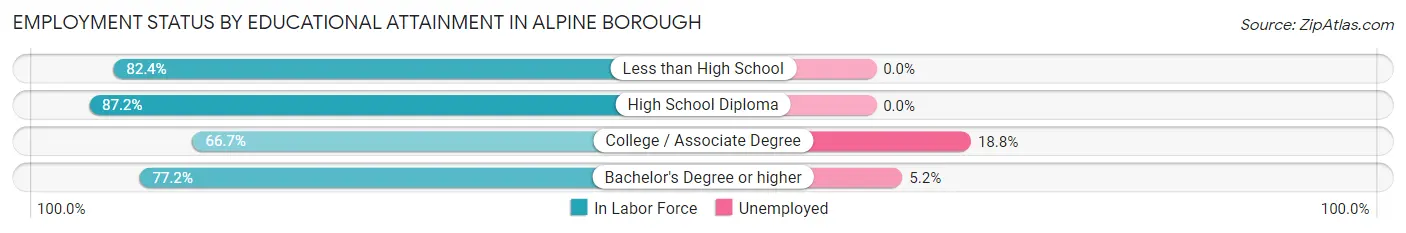
| Educational Attainment | In Labor Force | Unemployed |
| Less than High School | 14 (82.4%) | 0 (0.0%) |
| High School Diploma | 34 (87.2%) | 0 (0.0%) |
| College / Associate Degree | 32 (66.7%) | 9 (18.8%) |
| Bachelor's Degree or higher | 349 (77.2%) | 24 (5.2%) |
| Total | 429 (77.2%) | 31 (5.6%) |
Employment Occupations by Sex in Alpine borough
Management, Business, Science and Arts Occupations
The most common Management, Business, Science and Arts occupations in Alpine borough are Management (193 | 33.3%), Health Diagnosing & Treating (87 | 15.0%), Health Technologists (73 | 12.6%), Community & Social Service (50 | 8.6%), and Business & Financial (30 | 5.2%).
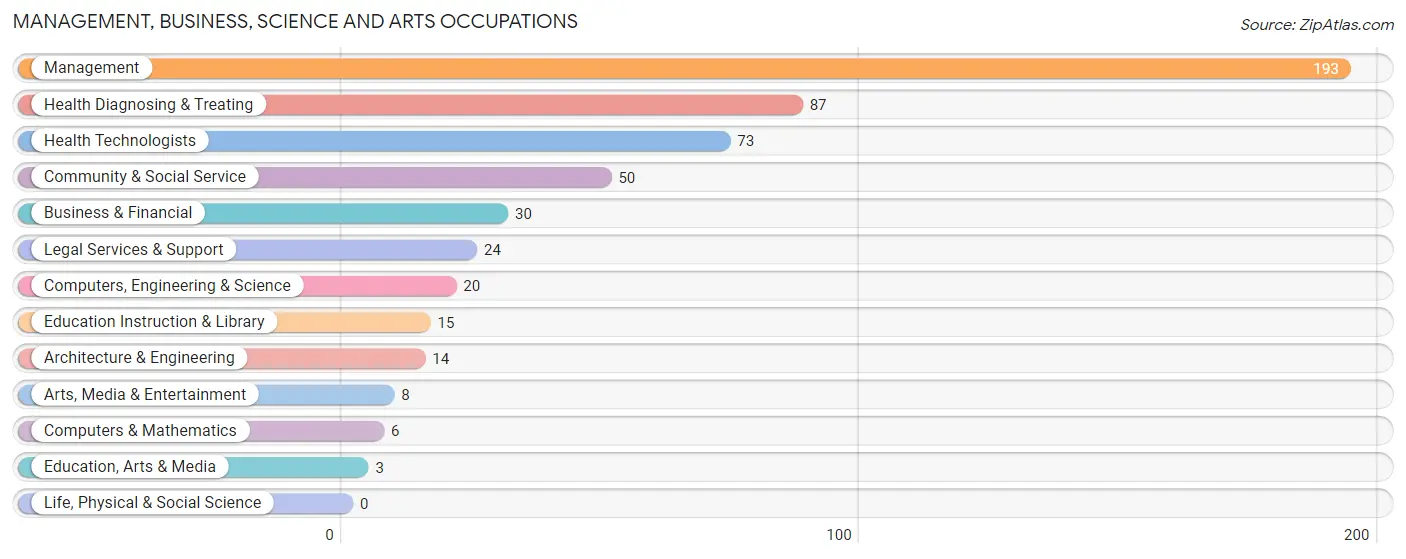
Management, Business, Science and Arts Occupations by Sex
Within the Management, Business, Science and Arts occupations in Alpine borough, the most male-oriented occupations are Computers, Engineering & Science (100.0%), Computers & Mathematics (100.0%), and Architecture & Engineering (100.0%), while the most female-oriented occupations are Education, Arts & Media (100.0%), Arts, Media & Entertainment (100.0%), and Education Instruction & Library (80.0%).
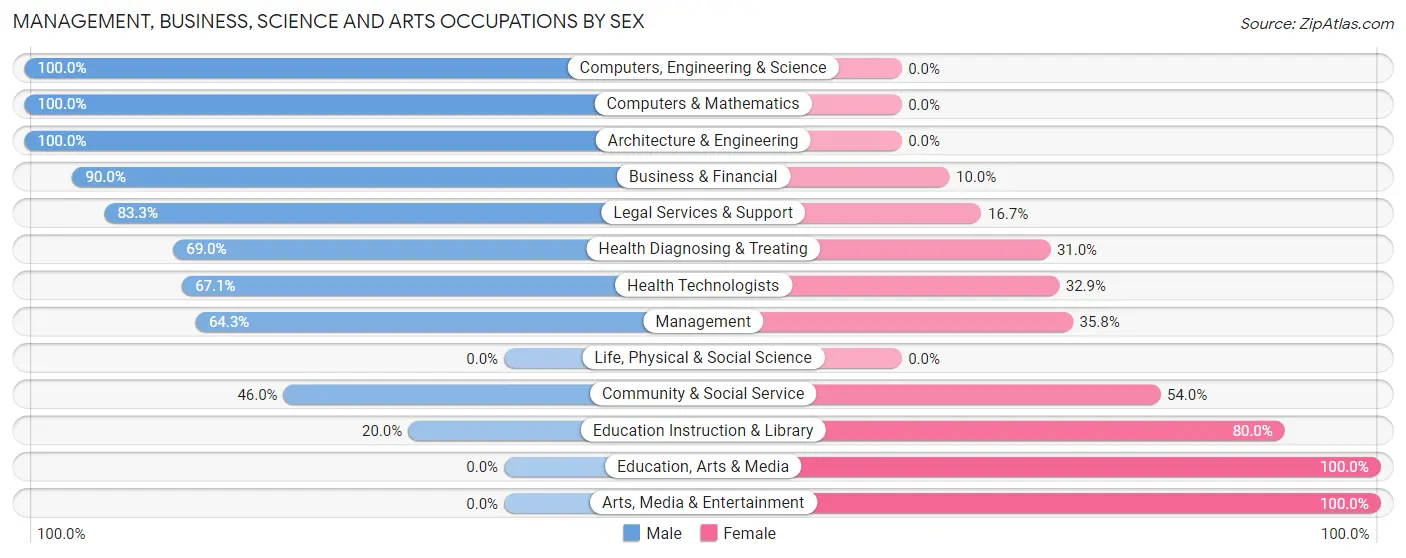
| Occupation | Male | Female |
| Management | 124 (64.2%) | 69 (35.7%) |
| Business & Financial | 27 (90.0%) | 3 (10.0%) |
| Computers, Engineering & Science | 20 (100.0%) | 0 (0.0%) |
| Computers & Mathematics | 6 (100.0%) | 0 (0.0%) |
| Architecture & Engineering | 14 (100.0%) | 0 (0.0%) |
| Life, Physical & Social Science | 0 (0.0%) | 0 (0.0%) |
| Community & Social Service | 23 (46.0%) | 27 (54.0%) |
| Education, Arts & Media | 0 (0.0%) | 3 (100.0%) |
| Legal Services & Support | 20 (83.3%) | 4 (16.7%) |
| Education Instruction & Library | 3 (20.0%) | 12 (80.0%) |
| Arts, Media & Entertainment | 0 (0.0%) | 8 (100.0%) |
| Health Diagnosing & Treating | 60 (69.0%) | 27 (31.0%) |
| Health Technologists | 49 (67.1%) | 24 (32.9%) |
| Total (Category) | 254 (66.8%) | 126 (33.2%) |
| Total (Overall) | 362 (62.4%) | 218 (37.6%) |
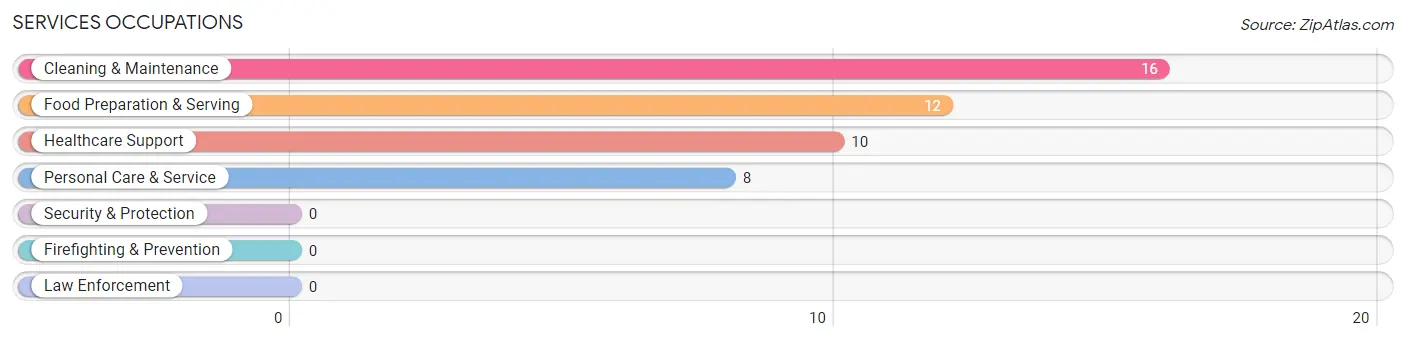
Services Occupations
The most common Services occupations in Alpine borough are Cleaning & Maintenance (16 | 2.8%), Food Preparation & Serving (12 | 2.1%), Healthcare Support (10 | 1.7%), and Personal Care & Service (8 | 1.4%).
Services Occupations by Sex
Within the Services occupations in Alpine borough, the most male-oriented occupations are Cleaning & Maintenance (81.2%), Food Preparation & Serving (66.7%), and Personal Care & Service (62.5%), while the most female-oriented occupations are Healthcare Support (100.0%), Personal Care & Service (37.5%), and Food Preparation & Serving (33.3%).
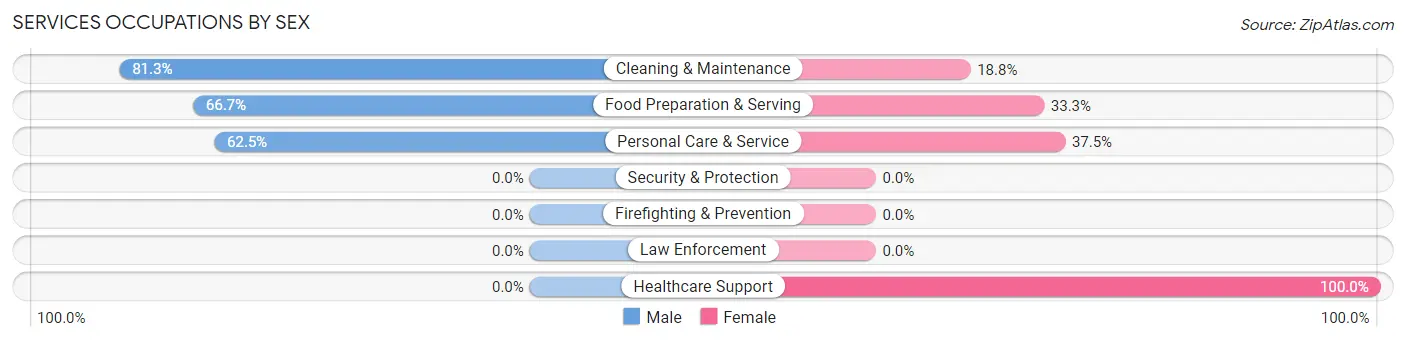
| Occupation | Male | Female |
| Healthcare Support | 0 (0.0%) | 10 (100.0%) |
| Security & Protection | 0 (0.0%) | 0 (0.0%) |
| Firefighting & Prevention | 0 (0.0%) | 0 (0.0%) |
| Law Enforcement | 0 (0.0%) | 0 (0.0%) |
| Food Preparation & Serving | 8 (66.7%) | 4 (33.3%) |
| Cleaning & Maintenance | 13 (81.2%) | 3 (18.8%) |
| Personal Care & Service | 5 (62.5%) | 3 (37.5%) |
| Total (Category) | 26 (56.5%) | 20 (43.5%) |
| Total (Overall) | 362 (62.4%) | 218 (37.6%) |
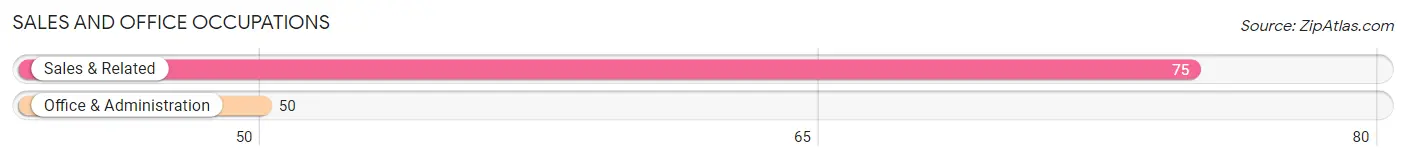
Sales and Office Occupations
The most common Sales and Office occupations in Alpine borough are Sales & Related (75 | 12.9%), and Office & Administration (50 | 8.6%).
Sales and Office Occupations by Sex
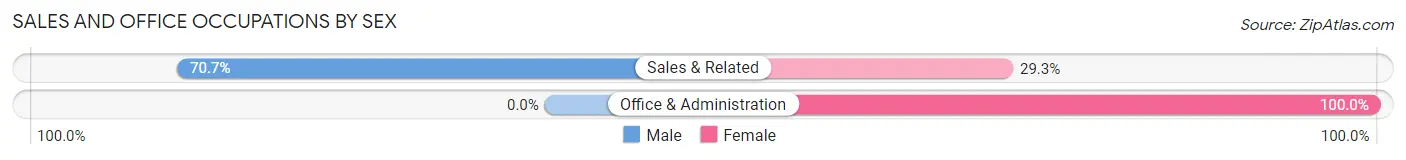
| Occupation | Male | Female |
| Sales & Related | 53 (70.7%) | 22 (29.3%) |
| Office & Administration | 0 (0.0%) | 50 (100.0%) |
| Total (Category) | 53 (42.4%) | 72 (57.6%) |
| Total (Overall) | 362 (62.4%) | 218 (37.6%) |
Natural Resources, Construction and Maintenance Occupations
The most common Natural Resources, Construction and Maintenance occupations in Alpine borough are , and Construction & Extraction (14 | 2.4%).
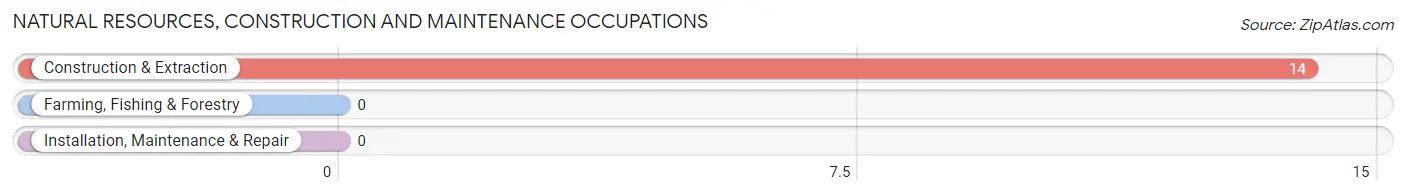
Natural Resources, Construction and Maintenance Occupations by Sex
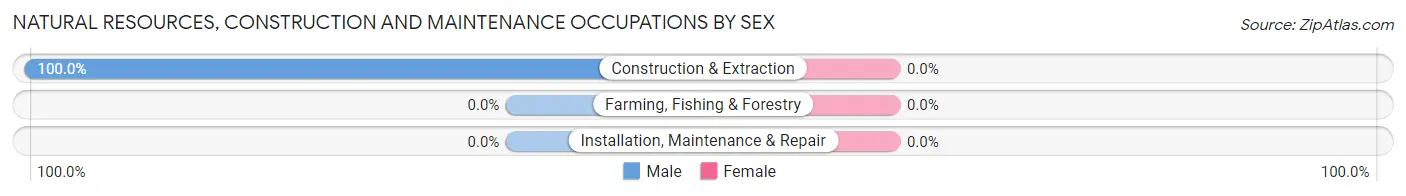
| Occupation | Male | Female |
| Farming, Fishing & Forestry | 0 (0.0%) | 0 (0.0%) |
| Construction & Extraction | 14 (100.0%) | 0 (0.0%) |
| Installation, Maintenance & Repair | 0 (0.0%) | 0 (0.0%) |
| Total (Category) | 14 (100.0%) | 0 (0.0%) |
| Total (Overall) | 362 (62.4%) | 218 (37.6%) |
Production, Transportation and Moving Occupations
The most common Production, Transportation and Moving occupations in Alpine borough are Transportation (12 | 2.1%), and Production (3 | 0.5%).
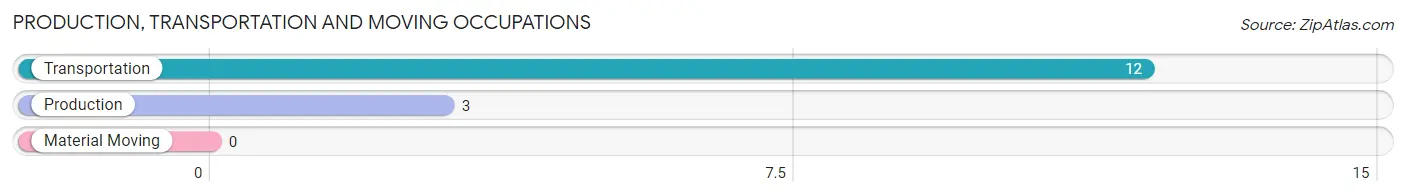
Production, Transportation and Moving Occupations by Sex
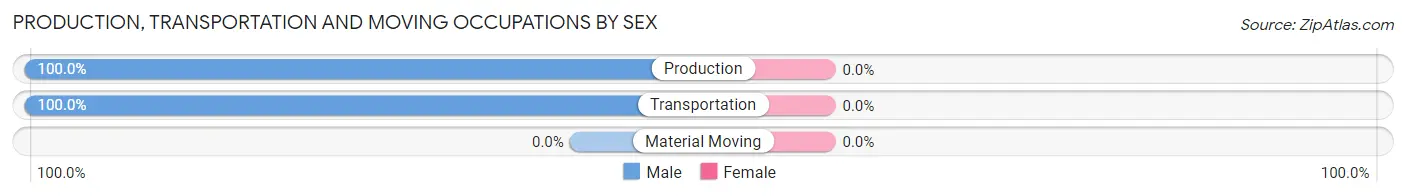
| Occupation | Male | Female |
| Production | 3 (100.0%) | 0 (0.0%) |
| Transportation | 12 (100.0%) | 0 (0.0%) |
| Material Moving | 0 (0.0%) | 0 (0.0%) |
| Total (Category) | 15 (100.0%) | 0 (0.0%) |
| Total (Overall) | 362 (62.4%) | 218 (37.6%) |
Employment Industries by Sex in Alpine borough
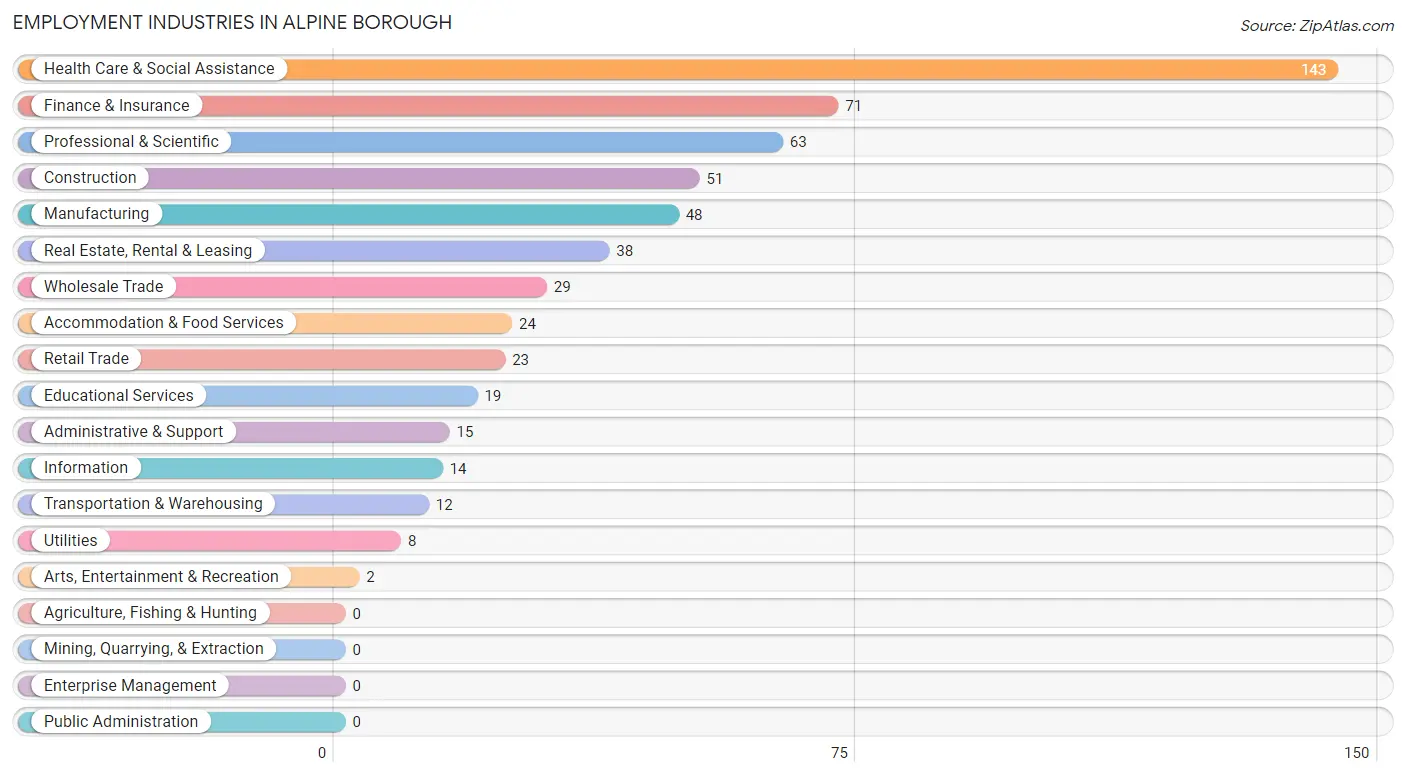
Employment Industries in Alpine borough
The major employment industries in Alpine borough include Health Care & Social Assistance (143 | 24.7%), Finance & Insurance (71 | 12.2%), Professional & Scientific (63 | 10.9%), Construction (51 | 8.8%), and Manufacturing (48 | 8.3%).
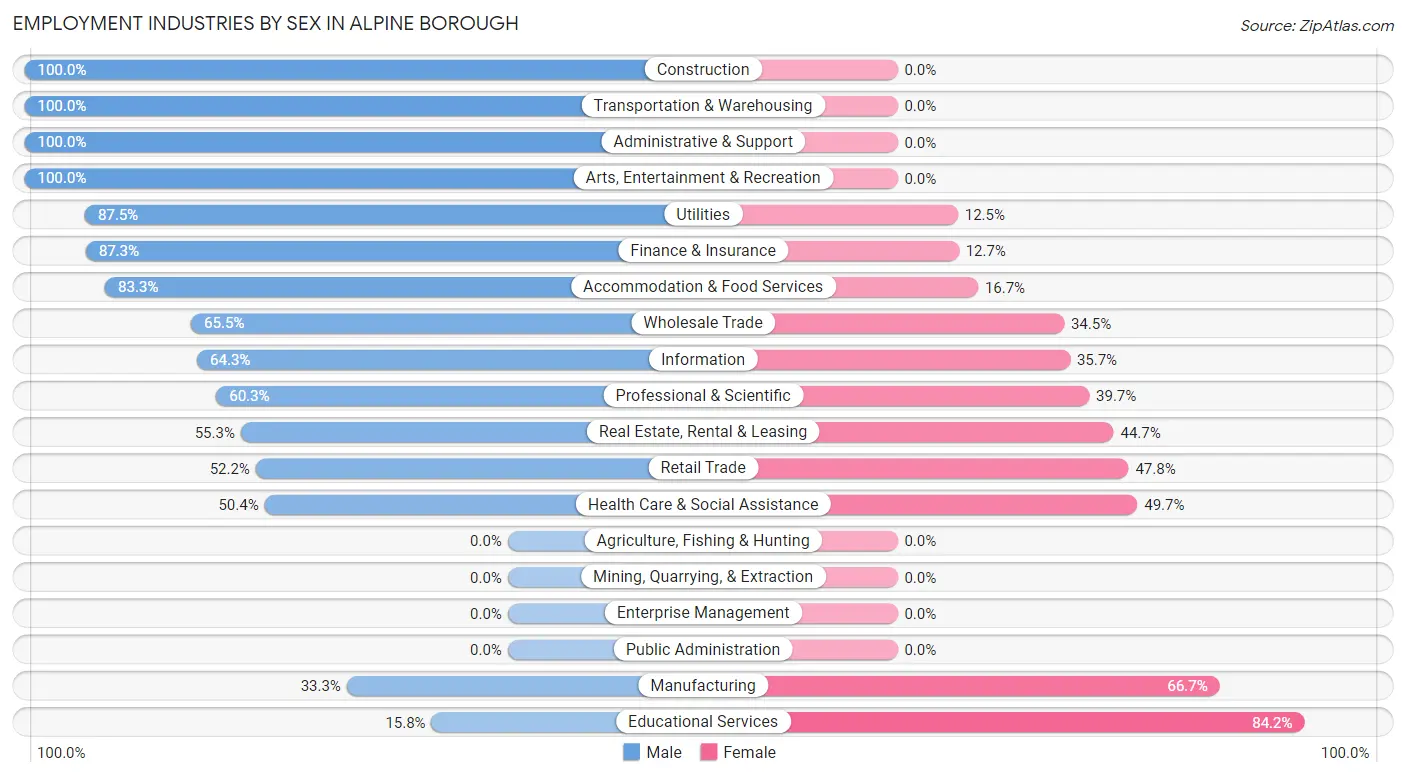
Employment Industries by Sex in Alpine borough
The Alpine borough industries that see more men than women are Construction (100.0%), Transportation & Warehousing (100.0%), and Administrative & Support (100.0%), whereas the industries that tend to have a higher number of women are Educational Services (84.2%), Manufacturing (66.7%), and Health Care & Social Assistance (49.6%).
| Industry | Male | Female |
| Agriculture, Fishing & Hunting | 0 (0.0%) | 0 (0.0%) |
| Mining, Quarrying, & Extraction | 0 (0.0%) | 0 (0.0%) |
| Construction | 51 (100.0%) | 0 (0.0%) |
| Manufacturing | 16 (33.3%) | 32 (66.7%) |
| Wholesale Trade | 19 (65.5%) | 10 (34.5%) |
| Retail Trade | 12 (52.2%) | 11 (47.8%) |
| Transportation & Warehousing | 12 (100.0%) | 0 (0.0%) |
| Utilities | 7 (87.5%) | 1 (12.5%) |
| Information | 9 (64.3%) | 5 (35.7%) |
| Finance & Insurance | 62 (87.3%) | 9 (12.7%) |
| Real Estate, Rental & Leasing | 21 (55.3%) | 17 (44.7%) |
| Professional & Scientific | 38 (60.3%) | 25 (39.7%) |
| Enterprise Management | 0 (0.0%) | 0 (0.0%) |
| Administrative & Support | 15 (100.0%) | 0 (0.0%) |
| Educational Services | 3 (15.8%) | 16 (84.2%) |
| Health Care & Social Assistance | 72 (50.3%) | 71 (49.6%) |
| Arts, Entertainment & Recreation | 2 (100.0%) | 0 (0.0%) |
| Accommodation & Food Services | 20 (83.3%) | 4 (16.7%) |
| Public Administration | 0 (0.0%) | 0 (0.0%) |
| Total | 362 (62.4%) | 218 (37.6%) |
Education in Alpine borough
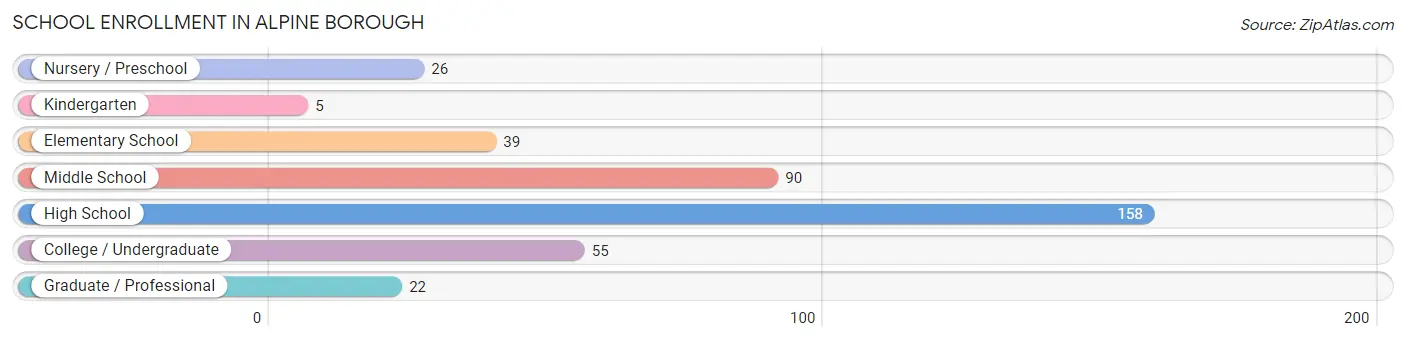
School Enrollment in Alpine borough
The most common levels of schooling among the 395 students in Alpine borough are high school (158 | 40.0%), middle school (90 | 22.8%), and college / undergraduate (55 | 13.9%).
| School Level | # Students | % Students |
| Nursery / Preschool | 26 | 6.6% |
| Kindergarten | 5 | 1.3% |
| Elementary School | 39 | 9.9% |
| Middle School | 90 | 22.8% |
| High School | 158 | 40.0% |
| College / Undergraduate | 55 | 13.9% |
| Graduate / Professional | 22 | 5.6% |
| Total | 395 | 100.0% |
School Enrollment by Age by Funding Source in Alpine borough
Out of a total of 395 students who are enrolled in schools in Alpine borough, 163 (41.3%) attend a private institution, while the remaining 232 (58.7%) are enrolled in public schools. The age group of 3 to 4 year olds has the highest likelihood of being enrolled in private schools, with 23 (100.0% in the age bracket) enrolled. Conversely, the age group of 5 to 9 year old has the lowest likelihood of being enrolled in a private school, with 44 (93.6% in the age bracket) attending a public institution.
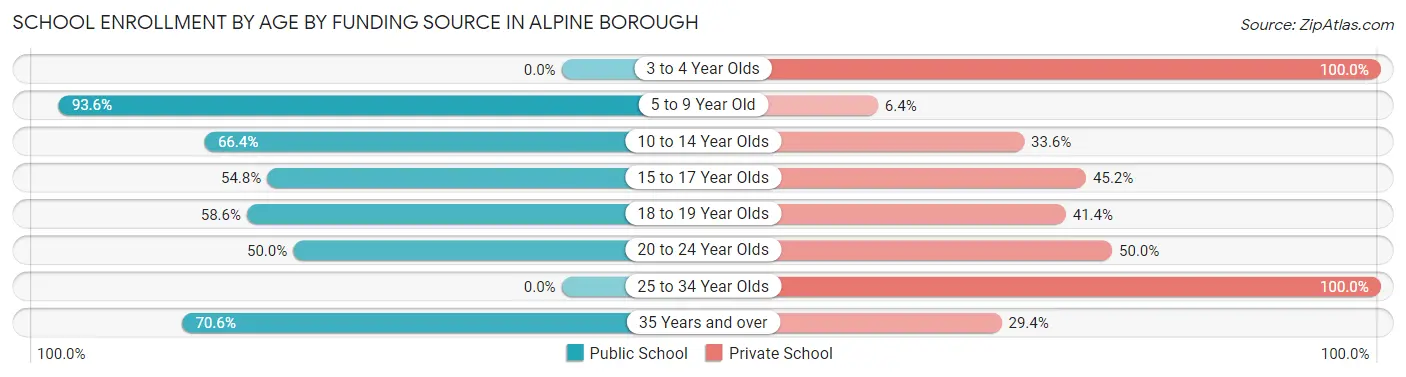
| Age Bracket | Public School | Private School |
| 3 to 4 Year Olds | 0 (0.0%) | 23 (100.0%) |
| 5 to 9 Year Old | 44 (93.6%) | 3 (6.4%) |
| 10 to 14 Year Olds | 81 (66.4%) | 41 (33.6%) |
| 15 to 17 Year Olds | 51 (54.8%) | 42 (45.2%) |
| 18 to 19 Year Olds | 34 (58.6%) | 24 (41.4%) |
| 20 to 24 Year Olds | 10 (50.0%) | 10 (50.0%) |
| 25 to 34 Year Olds | 0 (0.0%) | 15 (100.0%) |
| 35 Years and over | 12 (70.6%) | 5 (29.4%) |
| Total | 232 (58.7%) | 163 (41.3%) |
Educational Attainment by Field of Study in Alpine borough
Business (175 | 20.7%), social sciences (132 | 15.6%), education (74 | 8.8%), visual & performing arts (68 | 8.1%), and liberal arts & history (60 | 7.1%) are the most common fields of study among 844 individuals in Alpine borough who have obtained a bachelor's degree or higher.
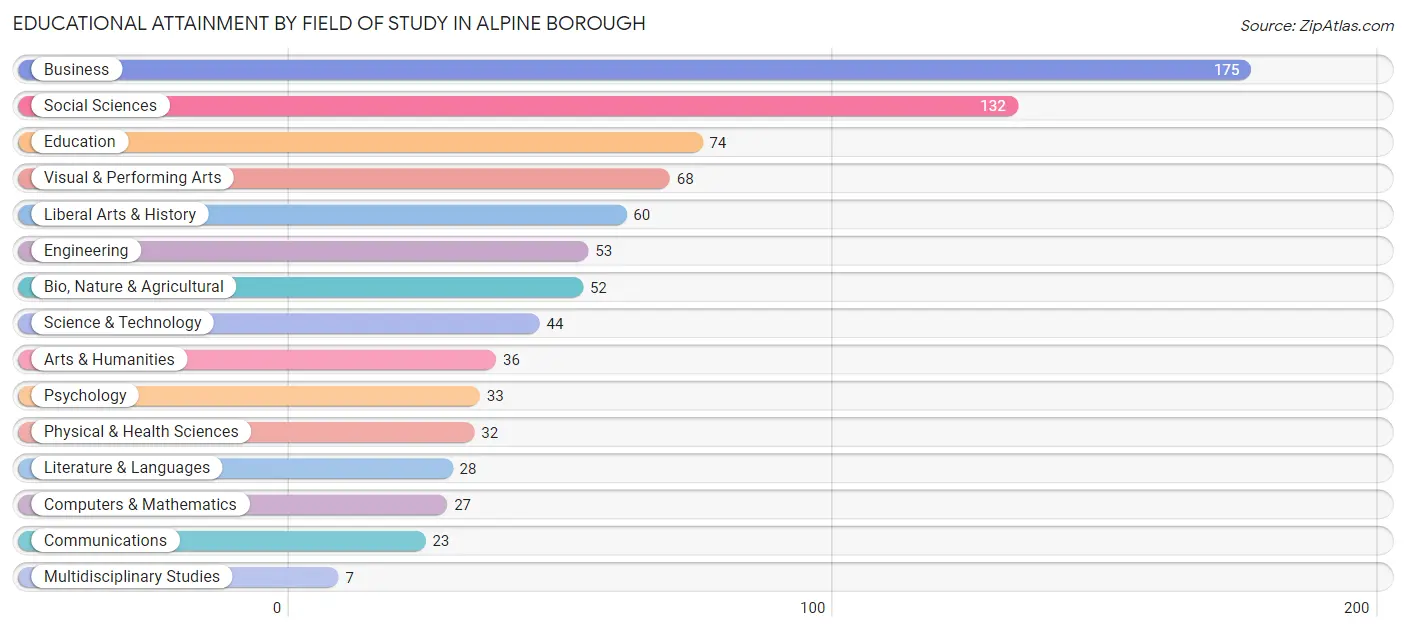
| Field of Study | # Graduates | % Graduates |
| Computers & Mathematics | 27 | 3.2% |
| Bio, Nature & Agricultural | 52 | 6.2% |
| Physical & Health Sciences | 32 | 3.8% |
| Psychology | 33 | 3.9% |
| Social Sciences | 132 | 15.6% |
| Engineering | 53 | 6.3% |
| Multidisciplinary Studies | 7 | 0.8% |
| Science & Technology | 44 | 5.2% |
| Business | 175 | 20.7% |
| Education | 74 | 8.8% |
| Literature & Languages | 28 | 3.3% |
| Liberal Arts & History | 60 | 7.1% |
| Visual & Performing Arts | 68 | 8.1% |
| Communications | 23 | 2.7% |
| Arts & Humanities | 36 | 4.3% |
| Total | 844 | 100.0% |
Transportation & Commute in Alpine borough
Vehicle Availability by Sex in Alpine borough
The most prevalent vehicle ownership categories in Alpine borough are males with 2 vehicles (163, accounting for 45.4%) and females with 2 vehicles (85, making up 76.9%).
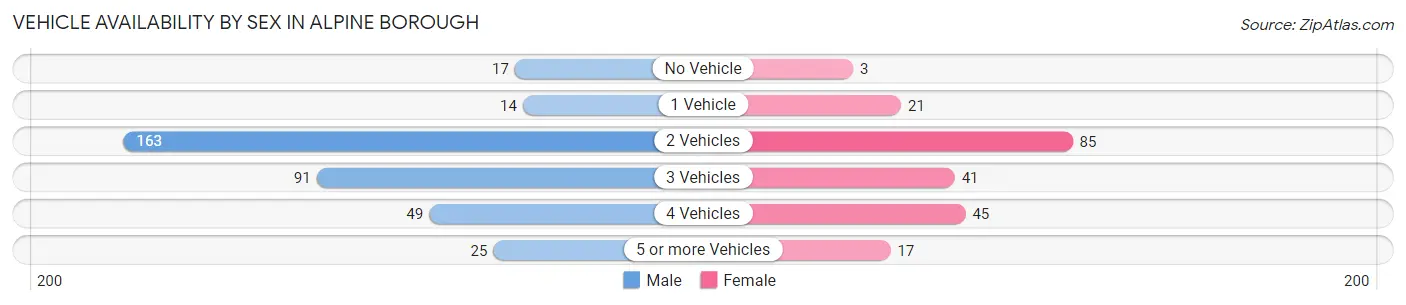
| Vehicles Available | Male | Female |
| No Vehicle | 17 (4.7%) | 3 (1.4%) |
| 1 Vehicle | 14 (3.9%) | 21 (9.9%) |
| 2 Vehicles | 163 (45.4%) | 85 (40.1%) |
| 3 Vehicles | 91 (25.4%) | 41 (19.3%) |
| 4 Vehicles | 49 (13.7%) | 45 (21.2%) |
| 5 or more Vehicles | 25 (7.0%) | 17 (8.0%) |
| Total | 359 (100.0%) | 212 (100.0%) |
Commute Time in Alpine borough
The most frequently occuring commute durations in Alpine borough are 5 to 9 minutes (68 commuters, 13.4%), 15 to 19 minutes (65 commuters, 12.8%), and 45 to 59 minutes (60 commuters, 11.8%).
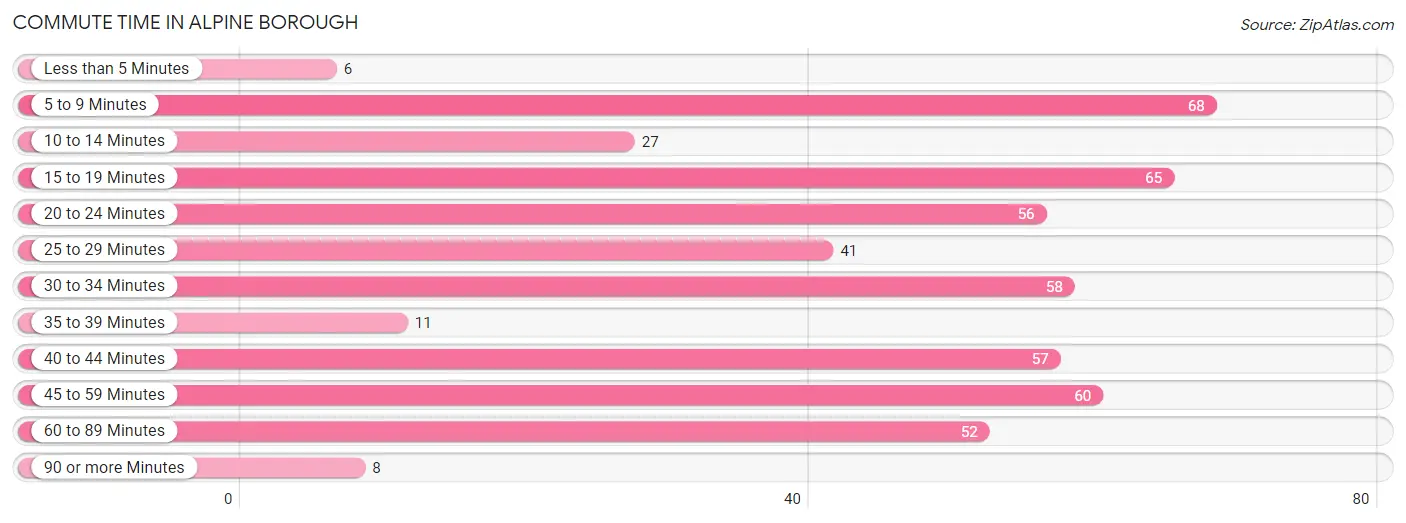
| Commute Time | # Commuters | % Commuters |
| Less than 5 Minutes | 6 | 1.2% |
| 5 to 9 Minutes | 68 | 13.4% |
| 10 to 14 Minutes | 27 | 5.3% |
| 15 to 19 Minutes | 65 | 12.8% |
| 20 to 24 Minutes | 56 | 11.0% |
| 25 to 29 Minutes | 41 | 8.1% |
| 30 to 34 Minutes | 58 | 11.4% |
| 35 to 39 Minutes | 11 | 2.2% |
| 40 to 44 Minutes | 57 | 11.2% |
| 45 to 59 Minutes | 60 | 11.8% |
| 60 to 89 Minutes | 52 | 10.2% |
| 90 or more Minutes | 8 | 1.6% |
Commute Time by Sex in Alpine borough
The most common commute times in Alpine borough are 20 to 24 minutes (53 commuters, 16.2%) for males and 5 to 9 minutes (42 commuters, 23.1%) for females.
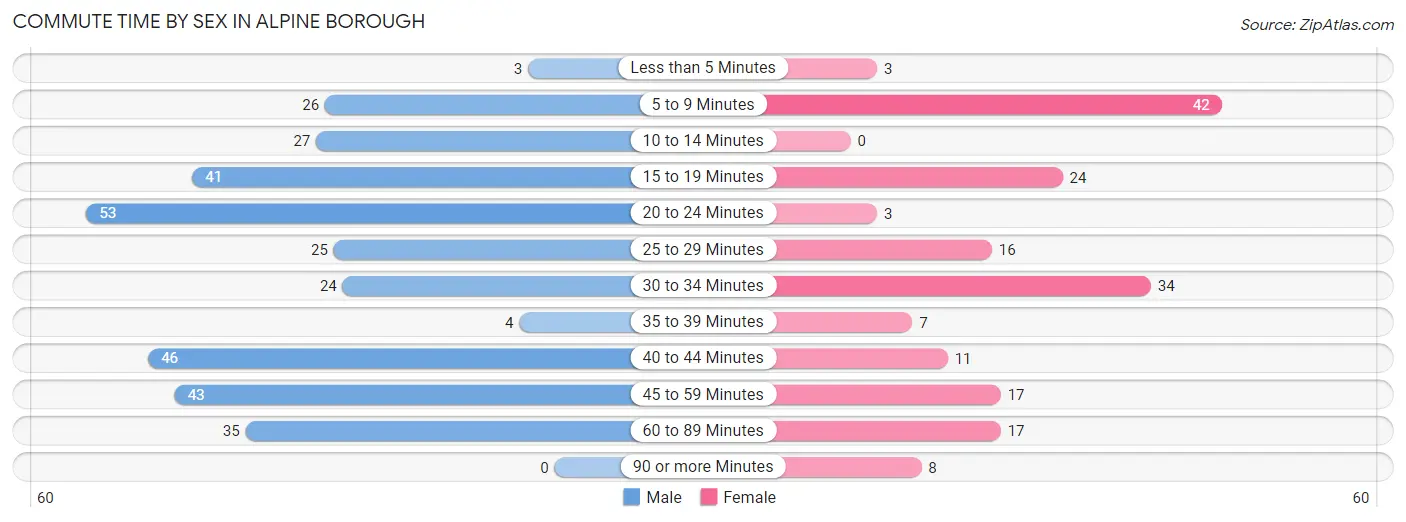
| Commute Time | Male | Female |
| Less than 5 Minutes | 3 (0.9%) | 3 (1.7%) |
| 5 to 9 Minutes | 26 (8.0%) | 42 (23.1%) |
| 10 to 14 Minutes | 27 (8.3%) | 0 (0.0%) |
| 15 to 19 Minutes | 41 (12.5%) | 24 (13.2%) |
| 20 to 24 Minutes | 53 (16.2%) | 3 (1.7%) |
| 25 to 29 Minutes | 25 (7.6%) | 16 (8.8%) |
| 30 to 34 Minutes | 24 (7.3%) | 34 (18.7%) |
| 35 to 39 Minutes | 4 (1.2%) | 7 (3.8%) |
| 40 to 44 Minutes | 46 (14.1%) | 11 (6.0%) |
| 45 to 59 Minutes | 43 (13.2%) | 17 (9.3%) |
| 60 to 89 Minutes | 35 (10.7%) | 17 (9.3%) |
| 90 or more Minutes | 0 (0.0%) | 8 (4.4%) |
Time of Departure to Work by Sex in Alpine borough
The most frequent times of departure to work in Alpine borough are 8:30 AM to 8:59 AM (79, 24.2%) for males and 9:00 AM to 9:59 AM (74, 40.7%) for females.
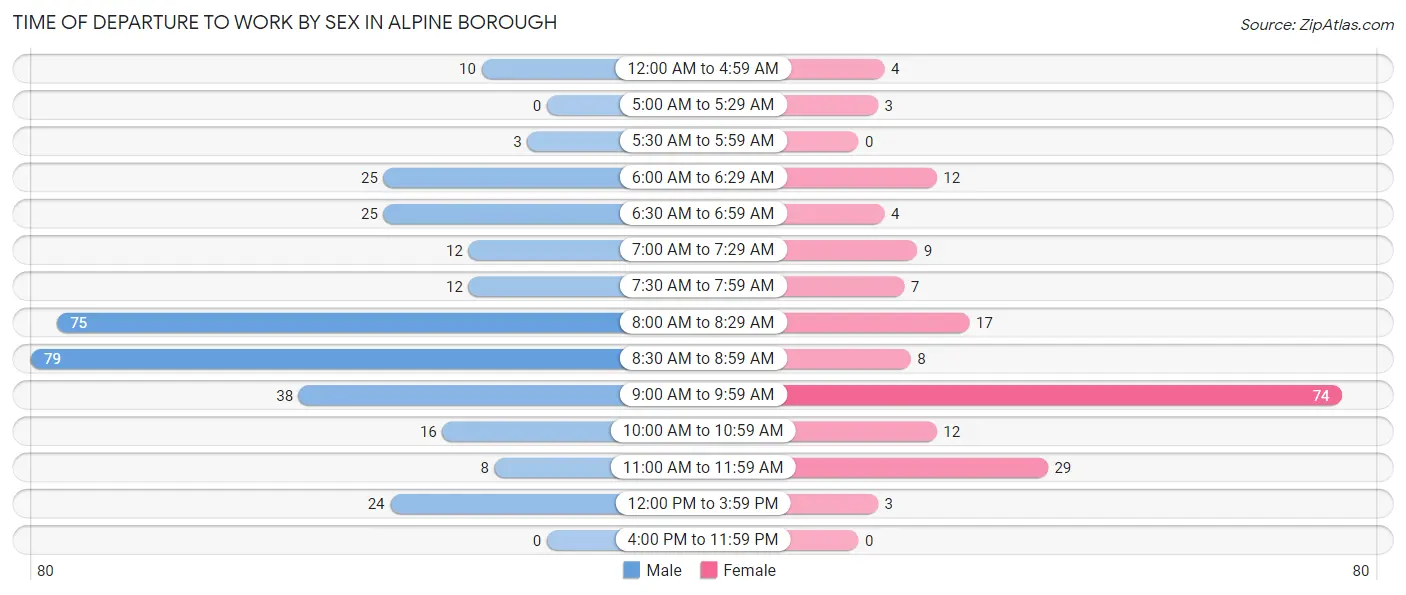
| Time of Departure | Male | Female |
| 12:00 AM to 4:59 AM | 10 (3.1%) | 4 (2.2%) |
| 5:00 AM to 5:29 AM | 0 (0.0%) | 3 (1.7%) |
| 5:30 AM to 5:59 AM | 3 (0.9%) | 0 (0.0%) |
| 6:00 AM to 6:29 AM | 25 (7.6%) | 12 (6.6%) |
| 6:30 AM to 6:59 AM | 25 (7.6%) | 4 (2.2%) |
| 7:00 AM to 7:29 AM | 12 (3.7%) | 9 (5.0%) |
| 7:30 AM to 7:59 AM | 12 (3.7%) | 7 (3.8%) |
| 8:00 AM to 8:29 AM | 75 (22.9%) | 17 (9.3%) |
| 8:30 AM to 8:59 AM | 79 (24.2%) | 8 (4.4%) |
| 9:00 AM to 9:59 AM | 38 (11.6%) | 74 (40.7%) |
| 10:00 AM to 10:59 AM | 16 (4.9%) | 12 (6.6%) |
| 11:00 AM to 11:59 AM | 8 (2.5%) | 29 (15.9%) |
| 12:00 PM to 3:59 PM | 24 (7.3%) | 3 (1.7%) |
| 4:00 PM to 11:59 PM | 0 (0.0%) | 0 (0.0%) |
| Total | 327 (100.0%) | 182 (100.0%) |
Housing Occupancy in Alpine borough
Occupancy by Ownership in Alpine borough
Of the total 515 dwellings in Alpine borough, owner-occupied units account for 480 (93.2%), while renter-occupied units make up 35 (6.8%).
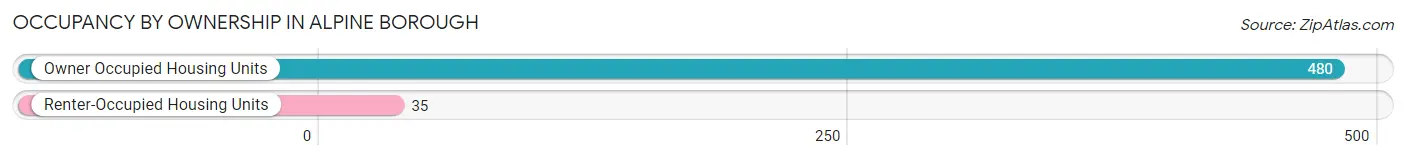
| Occupancy | # Housing Units | % Housing Units |
| Owner Occupied Housing Units | 480 | 93.2% |
| Renter-Occupied Housing Units | 35 | 6.8% |
| Total Occupied Housing Units | 515 | 100.0% |
Occupancy by Household Size in Alpine borough
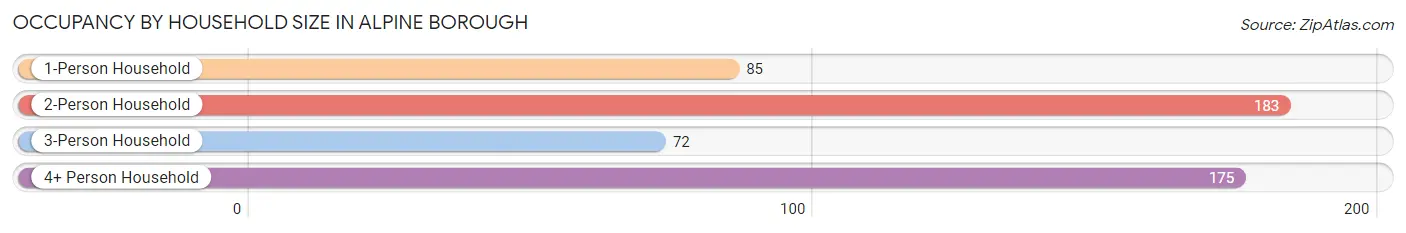
| Household Size | # Housing Units | % Housing Units |
| 1-Person Household | 85 | 16.5% |
| 2-Person Household | 183 | 35.5% |
| 3-Person Household | 72 | 14.0% |
| 4+ Person Household | 175 | 34.0% |
| Total Housing Units | 515 | 100.0% |
Occupancy by Ownership by Household Size in Alpine borough
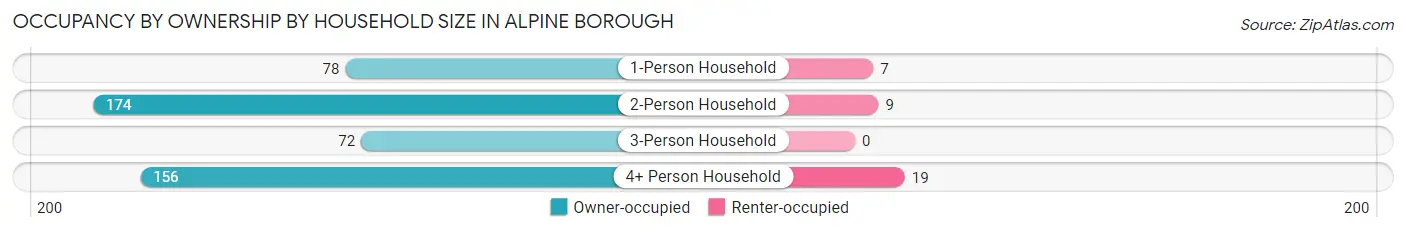
| Household Size | Owner-occupied | Renter-occupied |
| 1-Person Household | 78 (91.8%) | 7 (8.2%) |
| 2-Person Household | 174 (95.1%) | 9 (4.9%) |
| 3-Person Household | 72 (100.0%) | 0 (0.0%) |
| 4+ Person Household | 156 (89.1%) | 19 (10.9%) |
| Total Housing Units | 480 (93.2%) | 35 (6.8%) |
Occupancy by Educational Attainment in Alpine borough
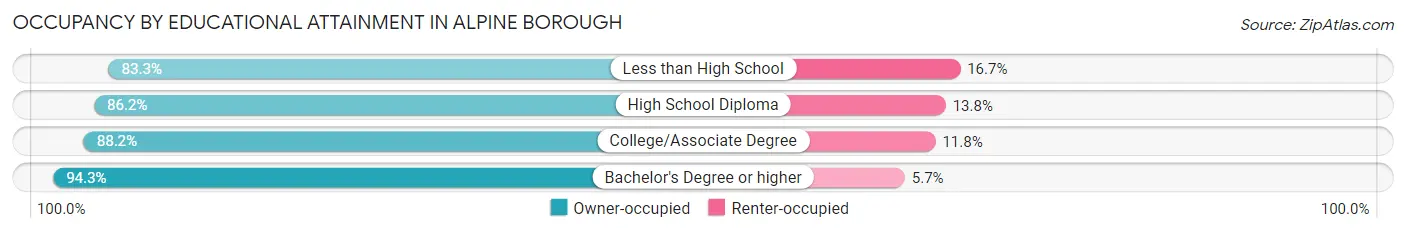
| Household Size | Owner-occupied | Renter-occupied |
| Less than High School | 10 (83.3%) | 2 (16.7%) |
| High School Diploma | 25 (86.2%) | 4 (13.8%) |
| College/Associate Degree | 30 (88.2%) | 4 (11.8%) |
| Bachelor's Degree or higher | 415 (94.3%) | 25 (5.7%) |
Occupancy by Age of Householder in Alpine borough
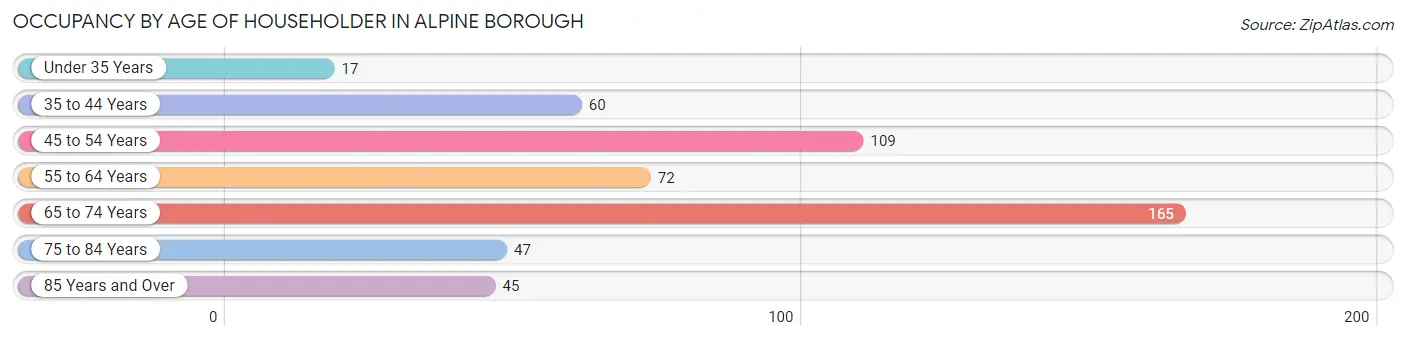
| Age Bracket | # Households | % Households |
| Under 35 Years | 17 | 3.3% |
| 35 to 44 Years | 60 | 11.7% |
| 45 to 54 Years | 109 | 21.2% |
| 55 to 64 Years | 72 | 14.0% |
| 65 to 74 Years | 165 | 32.0% |
| 75 to 84 Years | 47 | 9.1% |
| 85 Years and Over | 45 | 8.7% |
| Total | 515 | 100.0% |
Housing Finances in Alpine borough
Median Income by Occupancy in Alpine borough
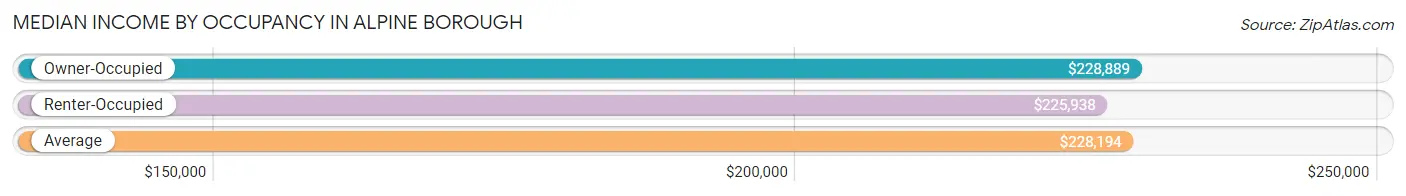
| Occupancy Type | # Households | Median Income |
| Owner-Occupied | 480 (93.2%) | $228,889 |
| Renter-Occupied | 35 (6.8%) | $225,938 |
| Average | 515 (100.0%) | $228,194 |
Occupancy by Householder Income Bracket in Alpine borough
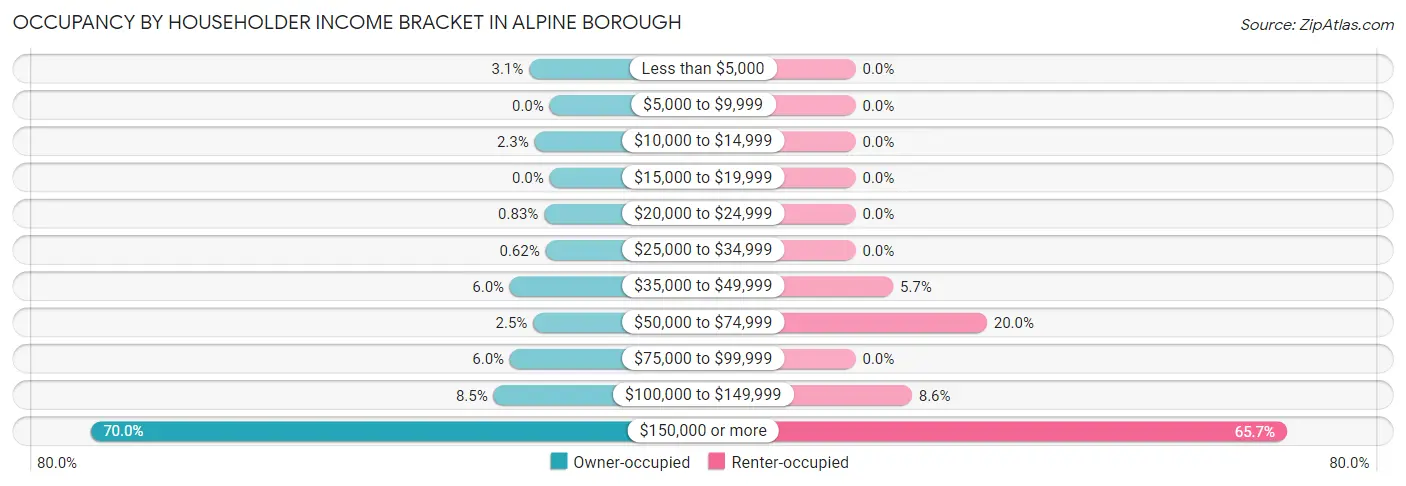
| Income Bracket | Owner-occupied | Renter-occupied |
| Less than $5,000 | 15 (3.1%) | 0 (0.0%) |
| $5,000 to $9,999 | 0 (0.0%) | 0 (0.0%) |
| $10,000 to $14,999 | 11 (2.3%) | 0 (0.0%) |
| $15,000 to $19,999 | 0 (0.0%) | 0 (0.0%) |
| $20,000 to $24,999 | 4 (0.8%) | 0 (0.0%) |
| $25,000 to $34,999 | 3 (0.6%) | 0 (0.0%) |
| $35,000 to $49,999 | 29 (6.0%) | 2 (5.7%) |
| $50,000 to $74,999 | 12 (2.5%) | 7 (20.0%) |
| $75,000 to $99,999 | 29 (6.0%) | 0 (0.0%) |
| $100,000 to $149,999 | 41 (8.5%) | 3 (8.6%) |
| $150,000 or more | 336 (70.0%) | 23 (65.7%) |
| Total | 480 (100.0%) | 35 (100.0%) |
Monthly Housing Cost Tiers in Alpine borough
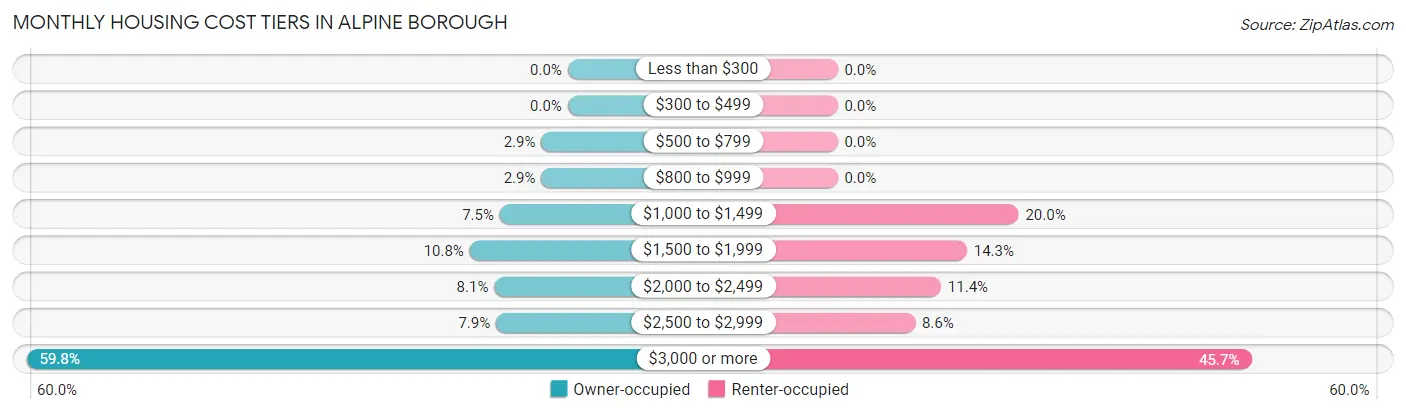
| Monthly Cost | Owner-occupied | Renter-occupied |
| Less than $300 | 0 (0.0%) | 0 (0.0%) |
| $300 to $499 | 0 (0.0%) | 0 (0.0%) |
| $500 to $799 | 14 (2.9%) | 0 (0.0%) |
| $800 to $999 | 14 (2.9%) | 0 (0.0%) |
| $1,000 to $1,499 | 36 (7.5%) | 7 (20.0%) |
| $1,500 to $1,999 | 52 (10.8%) | 5 (14.3%) |
| $2,000 to $2,499 | 39 (8.1%) | 4 (11.4%) |
| $2,500 to $2,999 | 38 (7.9%) | 3 (8.6%) |
| $3,000 or more | 287 (59.8%) | 16 (45.7%) |
| Total | 480 (100.0%) | 35 (100.0%) |
Physical Housing Characteristics in Alpine borough
Housing Structures in Alpine borough
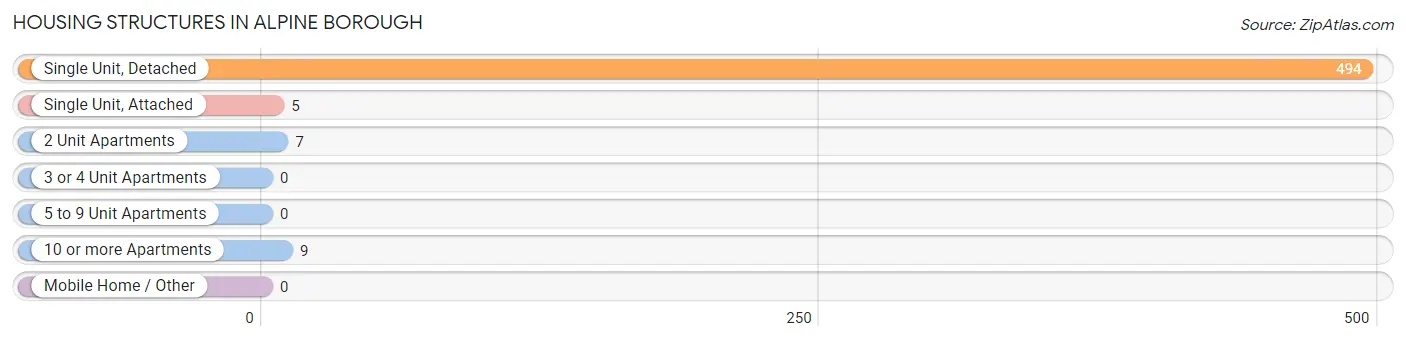
| Structure Type | # Housing Units | % Housing Units |
| Single Unit, Detached | 494 | 95.9% |
| Single Unit, Attached | 5 | 1.0% |
| 2 Unit Apartments | 7 | 1.4% |
| 3 or 4 Unit Apartments | 0 | 0.0% |
| 5 to 9 Unit Apartments | 0 | 0.0% |
| 10 or more Apartments | 9 | 1.8% |
| Mobile Home / Other | 0 | 0.0% |
| Total | 515 | 100.0% |
Housing Structures by Occupancy in Alpine borough
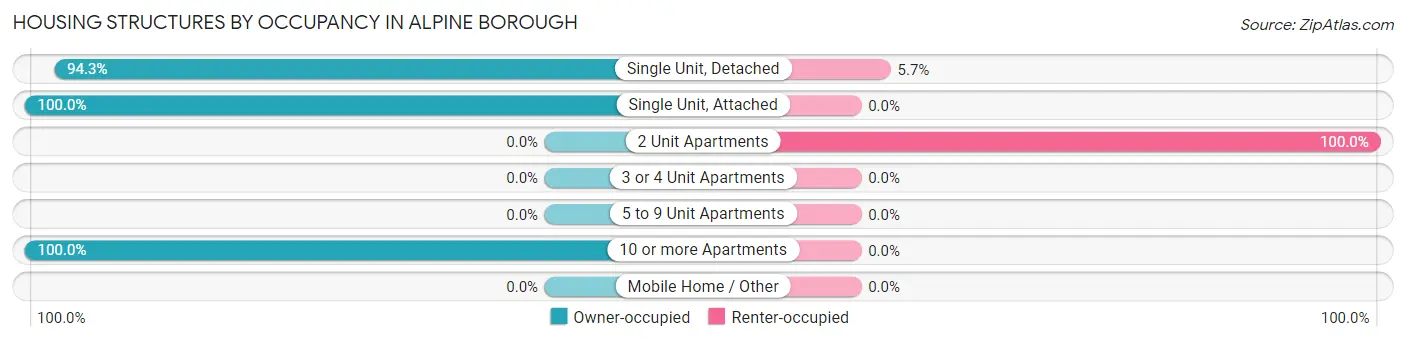
| Structure Type | Owner-occupied | Renter-occupied |
| Single Unit, Detached | 466 (94.3%) | 28 (5.7%) |
| Single Unit, Attached | 5 (100.0%) | 0 (0.0%) |
| 2 Unit Apartments | 0 (0.0%) | 7 (100.0%) |
| 3 or 4 Unit Apartments | 0 (0.0%) | 0 (0.0%) |
| 5 to 9 Unit Apartments | 0 (0.0%) | 0 (0.0%) |
| 10 or more Apartments | 9 (100.0%) | 0 (0.0%) |
| Mobile Home / Other | 0 (0.0%) | 0 (0.0%) |
| Total | 480 (93.2%) | 35 (6.8%) |
Housing Structures by Number of Rooms in Alpine borough
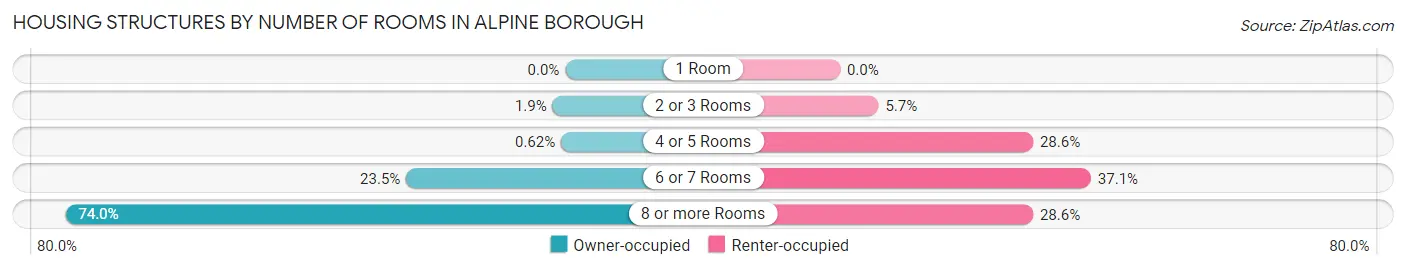
| Number of Rooms | Owner-occupied | Renter-occupied |
| 1 Room | 0 (0.0%) | 0 (0.0%) |
| 2 or 3 Rooms | 9 (1.9%) | 2 (5.7%) |
| 4 or 5 Rooms | 3 (0.6%) | 10 (28.6%) |
| 6 or 7 Rooms | 113 (23.5%) | 13 (37.1%) |
| 8 or more Rooms | 355 (74.0%) | 10 (28.6%) |
| Total | 480 (100.0%) | 35 (100.0%) |
Housing Structure by Heating Type in Alpine borough
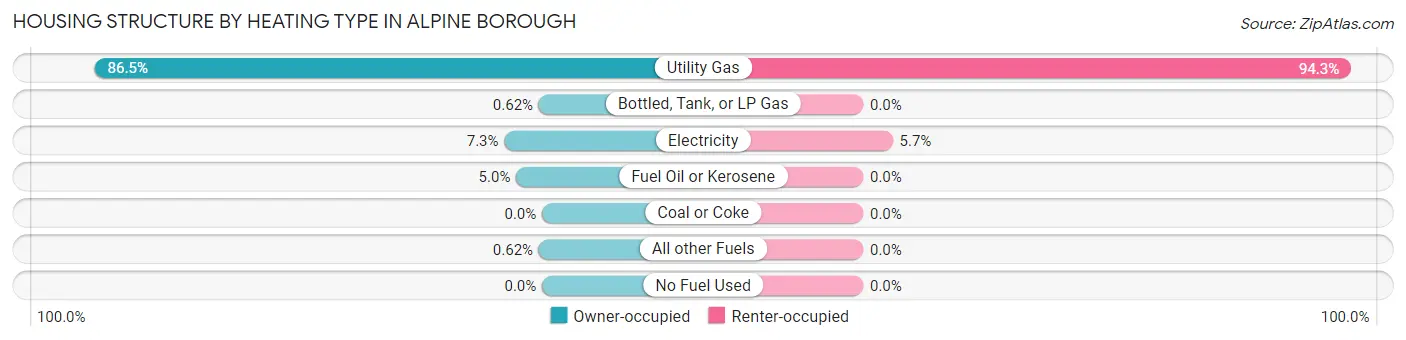
| Heating Type | Owner-occupied | Renter-occupied |
| Utility Gas | 415 (86.5%) | 33 (94.3%) |
| Bottled, Tank, or LP Gas | 3 (0.6%) | 0 (0.0%) |
| Electricity | 35 (7.3%) | 2 (5.7%) |
| Fuel Oil or Kerosene | 24 (5.0%) | 0 (0.0%) |
| Coal or Coke | 0 (0.0%) | 0 (0.0%) |
| All other Fuels | 3 (0.6%) | 0 (0.0%) |
| No Fuel Used | 0 (0.0%) | 0 (0.0%) |
| Total | 480 (100.0%) | 35 (100.0%) |
Household Vehicle Usage in Alpine borough
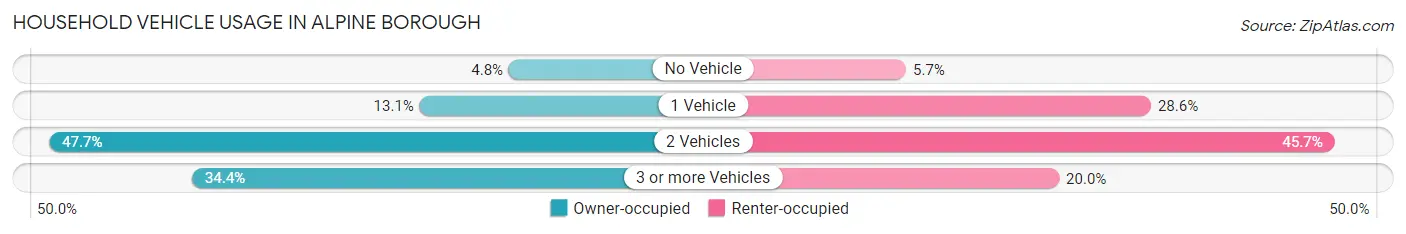
| Vehicles per Household | Owner-occupied | Renter-occupied |
| No Vehicle | 23 (4.8%) | 2 (5.7%) |
| 1 Vehicle | 63 (13.1%) | 10 (28.6%) |
| 2 Vehicles | 229 (47.7%) | 16 (45.7%) |
| 3 or more Vehicles | 165 (34.4%) | 7 (20.0%) |
| Total | 480 (100.0%) | 35 (100.0%) |
Real Estate & Mortgages in Alpine borough
Real Estate and Mortgage Overview in Alpine borough
| Characteristic | Without Mortgage | With Mortgage |
| Housing Units | 237 | 243 |
| Median Property Value | $2,000,001 | $2,000,001 |
| Median Household Income | $243,527 | $176 |
| Monthly Housing Costs | $1,501 | $201 |
| Real Estate Taxes | $10,001 | $0 |
Property Value by Mortgage Status in Alpine borough
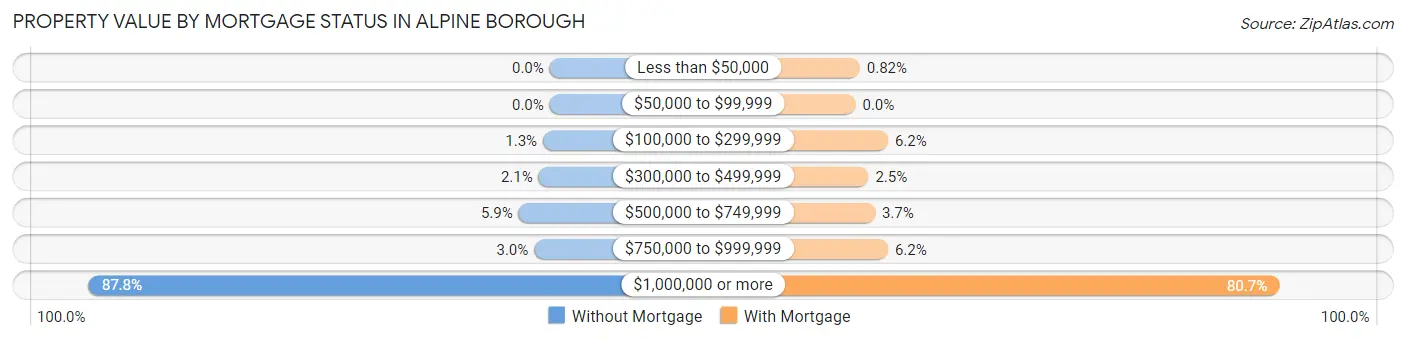
| Property Value | Without Mortgage | With Mortgage |
| Less than $50,000 | 0 (0.0%) | 2 (0.8%) |
| $50,000 to $99,999 | 0 (0.0%) | 0 (0.0%) |
| $100,000 to $299,999 | 3 (1.3%) | 15 (6.2%) |
| $300,000 to $499,999 | 5 (2.1%) | 6 (2.5%) |
| $500,000 to $749,999 | 14 (5.9%) | 9 (3.7%) |
| $750,000 to $999,999 | 7 (2.9%) | 15 (6.2%) |
| $1,000,000 or more | 208 (87.8%) | 196 (80.7%) |
| Total | 237 (100.0%) | 243 (100.0%) |
Household Income by Mortgage Status in Alpine borough
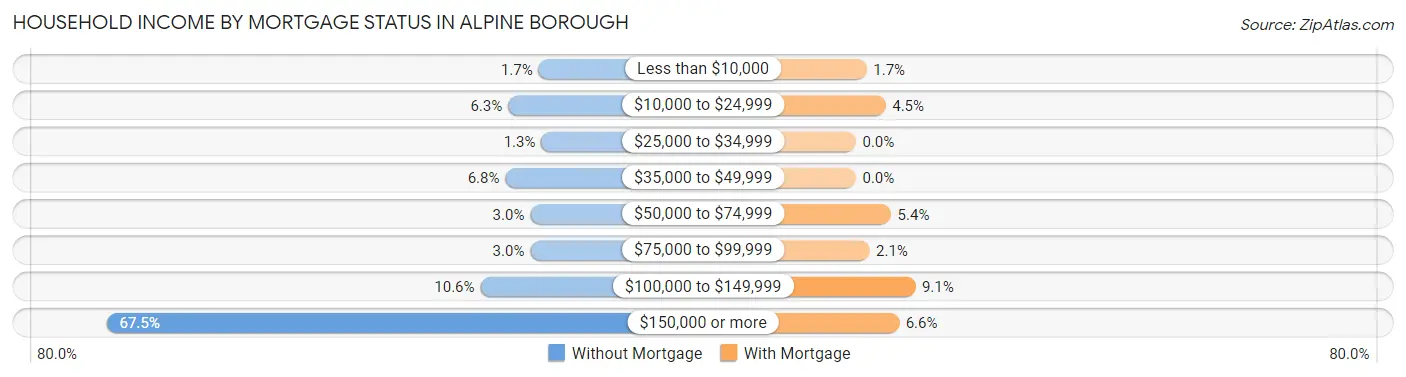
| Household Income | Without Mortgage | With Mortgage |
| Less than $10,000 | 4 (1.7%) | 4 (1.7%) |
| $10,000 to $24,999 | 15 (6.3%) | 11 (4.5%) |
| $25,000 to $34,999 | 3 (1.3%) | 0 (0.0%) |
| $35,000 to $49,999 | 16 (6.8%) | 0 (0.0%) |
| $50,000 to $74,999 | 7 (2.9%) | 13 (5.3%) |
| $75,000 to $99,999 | 7 (2.9%) | 5 (2.1%) |
| $100,000 to $149,999 | 25 (10.5%) | 22 (9.0%) |
| $150,000 or more | 160 (67.5%) | 16 (6.6%) |
| Total | 237 (100.0%) | 243 (100.0%) |
Property Value to Household Income Ratio in Alpine borough
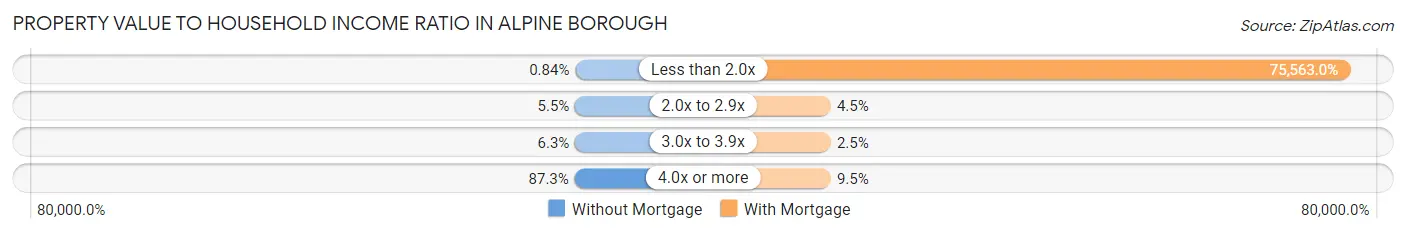
| Value-to-Income Ratio | Without Mortgage | With Mortgage |
| Less than 2.0x | 2 (0.8%) | 183,618 (75,563.0%) |
| 2.0x to 2.9x | 13 (5.5%) | 11 (4.5%) |
| 3.0x to 3.9x | 15 (6.3%) | 6 (2.5%) |
| 4.0x or more | 207 (87.3%) | 23 (9.5%) |
| Total | 237 (100.0%) | 243 (100.0%) |
Real Estate Taxes by Mortgage Status in Alpine borough
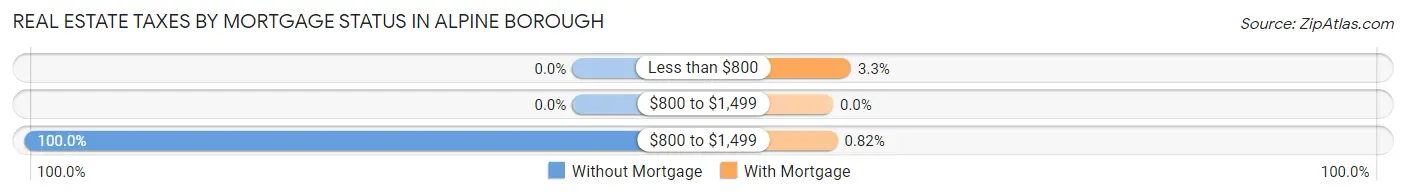
| Property Taxes | Without Mortgage | With Mortgage |
| Less than $800 | 0 (0.0%) | 8 (3.3%) |
| $800 to $1,499 | 0 (0.0%) | 0 (0.0%) |
| $800 to $1,499 | 237 (100.0%) | 2 (0.8%) |
| Total | 237 (100.0%) | 243 (100.0%) |
Health & Disability in Alpine borough
Health Insurance Coverage by Age in Alpine borough
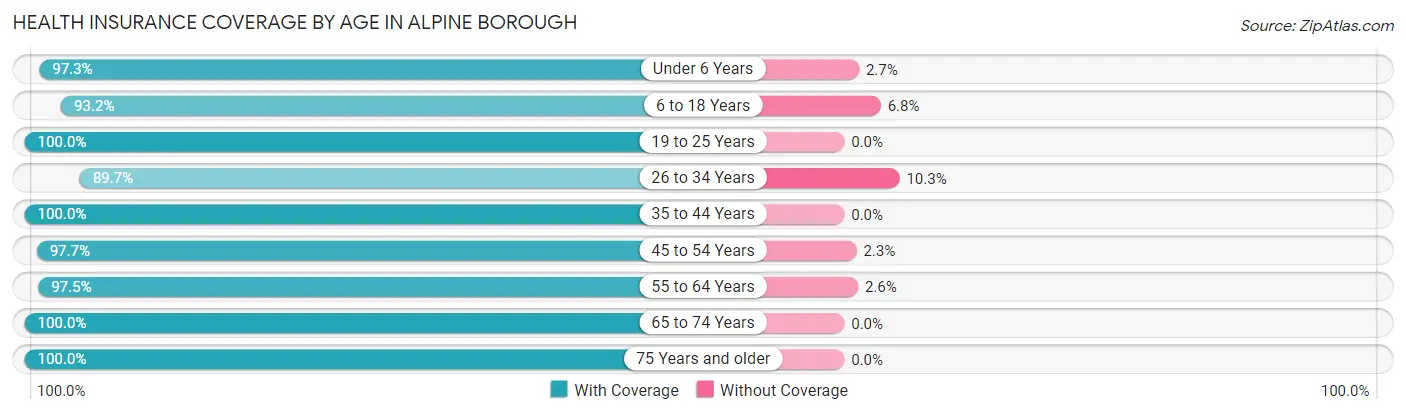
| Age Bracket | With Coverage | Without Coverage |
| Under 6 Years | 71 (97.3%) | 2 (2.7%) |
| 6 to 18 Years | 302 (93.2%) | 22 (6.8%) |
| 19 to 25 Years | 42 (100.0%) | 0 (0.0%) |
| 26 to 34 Years | 61 (89.7%) | 7 (10.3%) |
| 35 to 44 Years | 147 (100.0%) | 0 (0.0%) |
| 45 to 54 Years | 172 (97.7%) | 4 (2.3%) |
| 55 to 64 Years | 153 (97.5%) | 4 (2.5%) |
| 65 to 74 Years | 289 (100.0%) | 0 (0.0%) |
| 75 Years and older | 173 (100.0%) | 0 (0.0%) |
| Total | 1,410 (97.3%) | 39 (2.7%) |
Health Insurance Coverage by Citizenship Status in Alpine borough
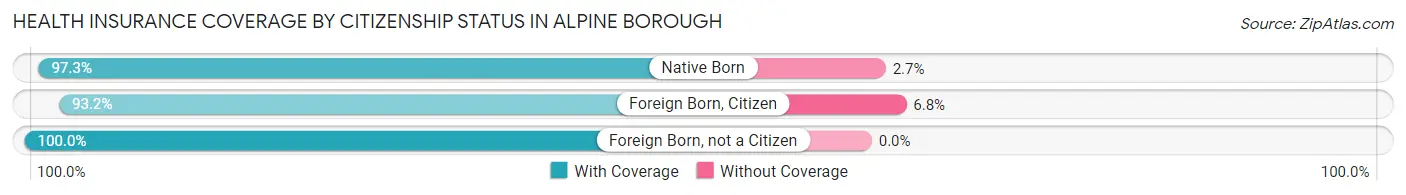
| Citizenship Status | With Coverage | Without Coverage |
| Native Born | 71 (97.3%) | 2 (2.7%) |
| Foreign Born, Citizen | 302 (93.2%) | 22 (6.8%) |
| Foreign Born, not a Citizen | 42 (100.0%) | 0 (0.0%) |
Health Insurance Coverage by Household Income in Alpine borough
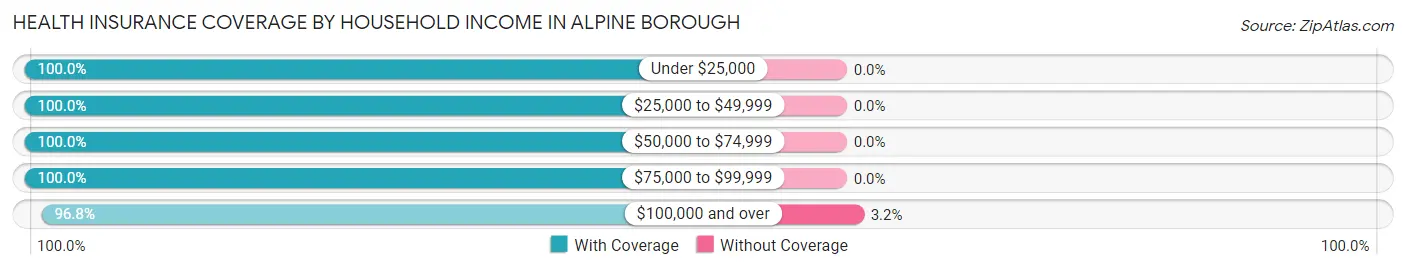
| Household Income | With Coverage | Without Coverage |
| Under $25,000 | 58 (100.0%) | 0 (0.0%) |
| $25,000 to $49,999 | 62 (100.0%) | 0 (0.0%) |
| $50,000 to $74,999 | 27 (100.0%) | 0 (0.0%) |
| $75,000 to $99,999 | 70 (100.0%) | 0 (0.0%) |
| $100,000 and over | 1,193 (96.8%) | 39 (3.2%) |
Public vs Private Health Insurance Coverage by Age in Alpine borough
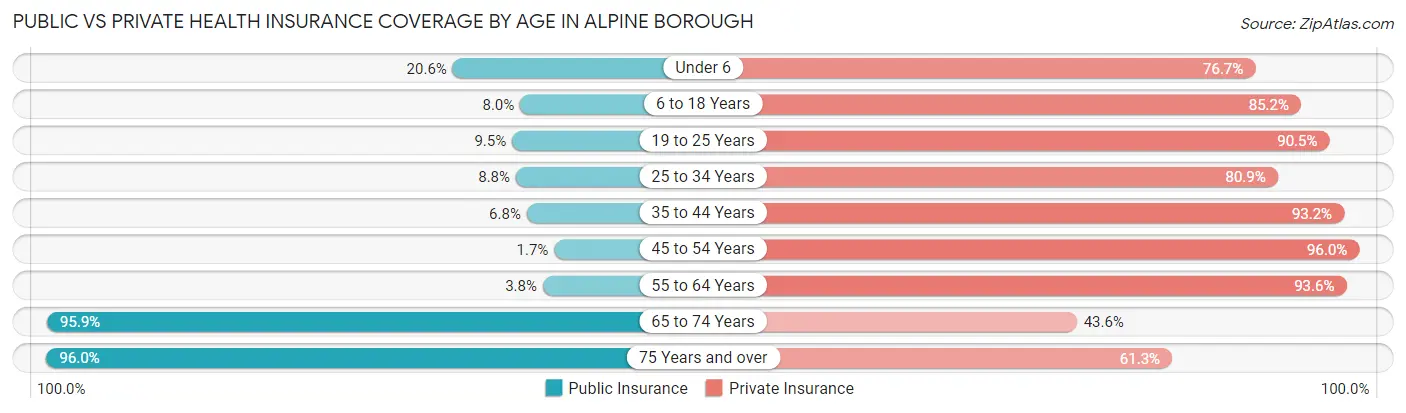
| Age Bracket | Public Insurance | Private Insurance |
| Under 6 | 15 (20.5%) | 56 (76.7%) |
| 6 to 18 Years | 26 (8.0%) | 276 (85.2%) |
| 19 to 25 Years | 4 (9.5%) | 38 (90.5%) |
| 25 to 34 Years | 6 (8.8%) | 55 (80.9%) |
| 35 to 44 Years | 10 (6.8%) | 137 (93.2%) |
| 45 to 54 Years | 3 (1.7%) | 169 (96.0%) |
| 55 to 64 Years | 6 (3.8%) | 147 (93.6%) |
| 65 to 74 Years | 277 (95.9%) | 126 (43.6%) |
| 75 Years and over | 166 (96.0%) | 106 (61.3%) |
| Total | 513 (35.4%) | 1,110 (76.6%) |
Disability Status by Sex by Age in Alpine borough
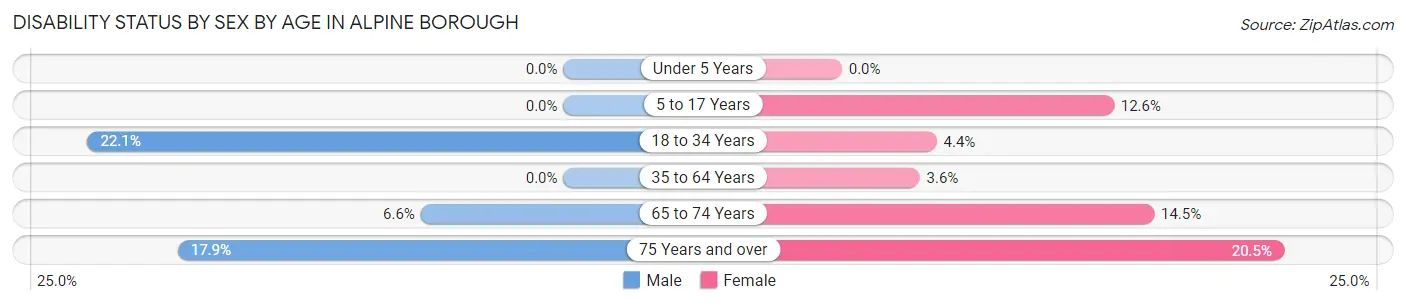
| Age Bracket | Male | Female |
| Under 5 Years | 0 (0.0%) | 0 (0.0%) |
| 5 to 17 Years | 0 (0.0%) | 13 (12.6%) |
| 18 to 34 Years | 17 (22.1%) | 4 (4.4%) |
| 35 to 64 Years | 0 (0.0%) | 9 (3.6%) |
| 65 to 74 Years | 10 (6.6%) | 20 (14.5%) |
| 75 Years and over | 17 (17.9%) | 16 (20.5%) |
Disability Class by Sex by Age in Alpine borough
Disability Class: Hearing Difficulty
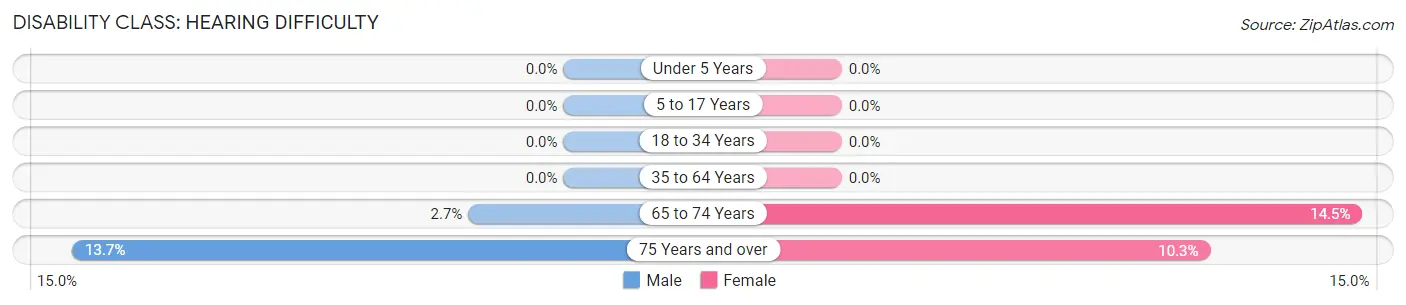
| Age Bracket | Male | Female |
| Under 5 Years | 0 (0.0%) | 0 (0.0%) |
| 5 to 17 Years | 0 (0.0%) | 0 (0.0%) |
| 18 to 34 Years | 0 (0.0%) | 0 (0.0%) |
| 35 to 64 Years | 0 (0.0%) | 0 (0.0%) |
| 65 to 74 Years | 4 (2.6%) | 20 (14.5%) |
| 75 Years and over | 13 (13.7%) | 8 (10.3%) |
Disability Class: Vision Difficulty
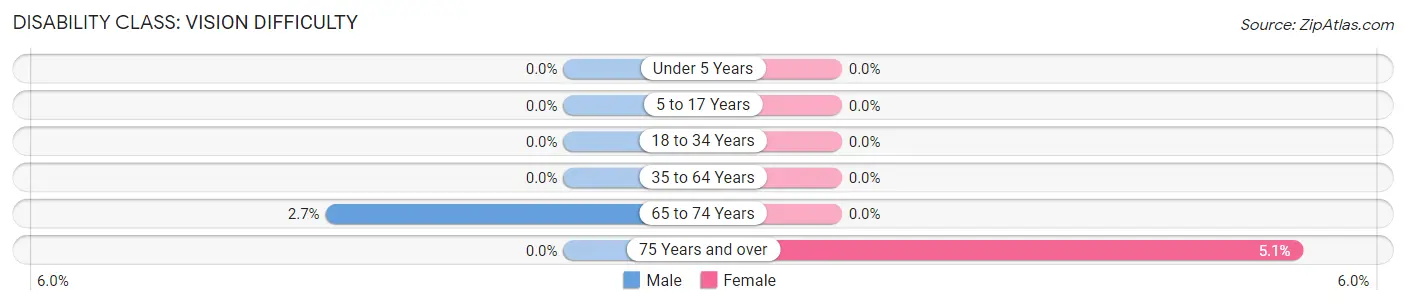
| Age Bracket | Male | Female |
| Under 5 Years | 0 (0.0%) | 0 (0.0%) |
| 5 to 17 Years | 0 (0.0%) | 0 (0.0%) |
| 18 to 34 Years | 0 (0.0%) | 0 (0.0%) |
| 35 to 64 Years | 0 (0.0%) | 0 (0.0%) |
| 65 to 74 Years | 4 (2.6%) | 0 (0.0%) |
| 75 Years and over | 0 (0.0%) | 4 (5.1%) |
Disability Class: Cognitive Difficulty
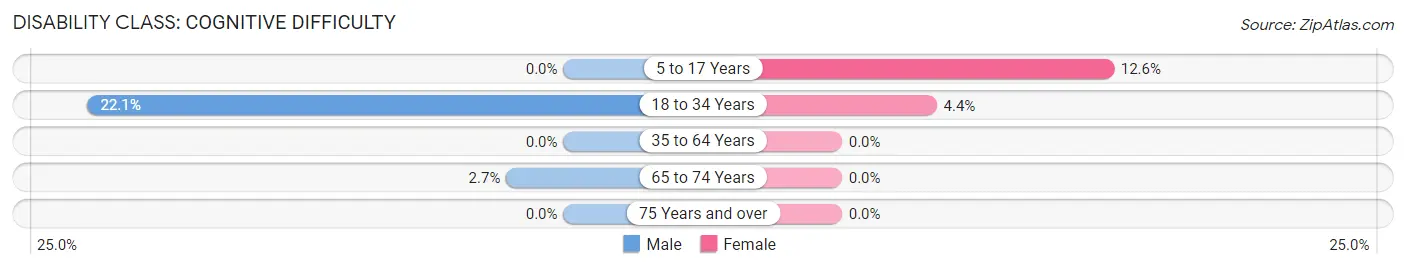
| Age Bracket | Male | Female |
| 5 to 17 Years | 0 (0.0%) | 13 (12.6%) |
| 18 to 34 Years | 17 (22.1%) | 4 (4.4%) |
| 35 to 64 Years | 0 (0.0%) | 0 (0.0%) |
| 65 to 74 Years | 4 (2.6%) | 0 (0.0%) |
| 75 Years and over | 0 (0.0%) | 0 (0.0%) |
Disability Class: Ambulatory Difficulty
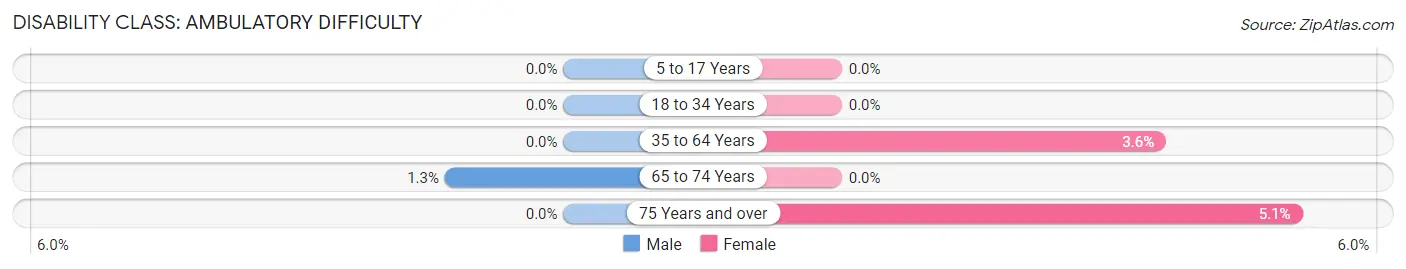
| Age Bracket | Male | Female |
| 5 to 17 Years | 0 (0.0%) | 0 (0.0%) |
| 18 to 34 Years | 0 (0.0%) | 0 (0.0%) |
| 35 to 64 Years | 0 (0.0%) | 9 (3.6%) |
| 65 to 74 Years | 2 (1.3%) | 0 (0.0%) |
| 75 Years and over | 0 (0.0%) | 4 (5.1%) |
Disability Class: Self-Care Difficulty
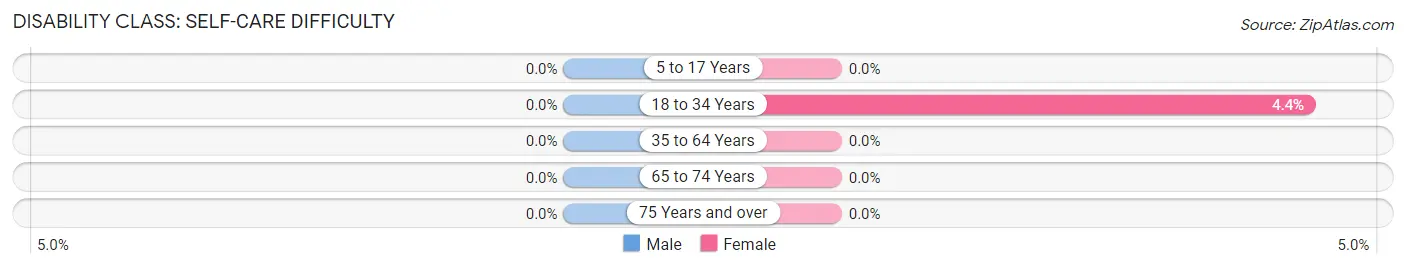
| Age Bracket | Male | Female |
| 5 to 17 Years | 0 (0.0%) | 0 (0.0%) |
| 18 to 34 Years | 0 (0.0%) | 4 (4.4%) |
| 35 to 64 Years | 0 (0.0%) | 0 (0.0%) |
| 65 to 74 Years | 0 (0.0%) | 0 (0.0%) |
| 75 Years and over | 0 (0.0%) | 0 (0.0%) |
Technology Access in Alpine borough
Computing Device Access in Alpine borough
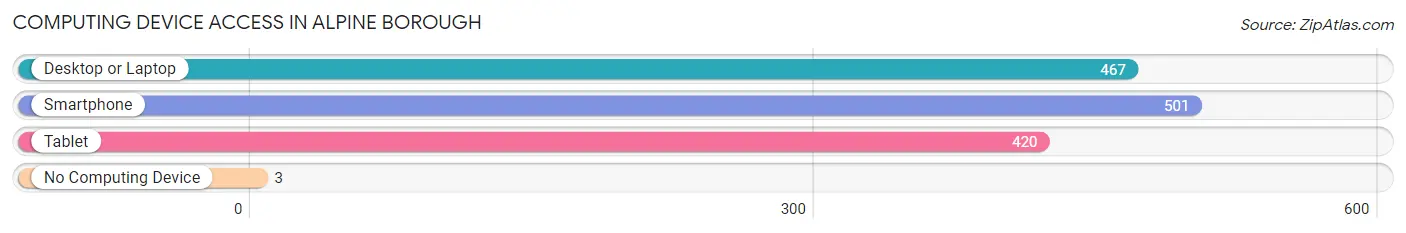
| Device Type | # Households | % Households |
| Desktop or Laptop | 467 | 90.7% |
| Smartphone | 501 | 97.3% |
| Tablet | 420 | 81.6% |
| No Computing Device | 3 | 0.6% |
| Total | 515 | 100.0% |
Internet Access in Alpine borough
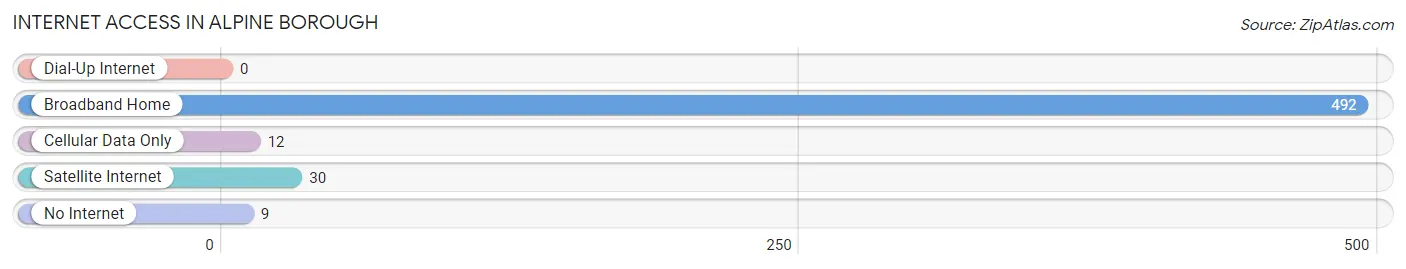
| Internet Type | # Households | % Households |
| Dial-Up Internet | 0 | 0.0% |
| Broadband Home | 492 | 95.5% |
| Cellular Data Only | 12 | 2.3% |
| Satellite Internet | 30 | 5.8% |
| No Internet | 9 | 1.8% |
| Total | 515 | 100.0% |
Alpine borough Summary
Alpine Borough is a small borough located in Bergen County, New Jersey. It is situated in the foothills of the Ramapo Mountains and is part of the New York metropolitan area. The borough is home to approximately 1,800 people and covers an area of 1.2 square miles.
History
Alpine Borough was originally part of Harrington Township, which was established in 1775. In 1894, the area was incorporated as the Borough of Alpine. The name was chosen to reflect the area’s mountainous terrain.
The borough was home to a number of prominent figures in the early 20th century, including the inventor of the modern zipper, Gideon Sundback, and the author of the novel The Great Gatsby, F. Scott Fitzgerald.
Geography
Alpine Borough is located in the foothills of the Ramapo Mountains in Bergen County, New Jersey. It is situated approximately 25 miles northwest of New York City and is part of the New York metropolitan area.
The borough covers an area of 1.2 square miles and is bordered by Harrington Township to the north, Closter to the east, and Rockleigh to the south. The borough is home to a number of parks, including the Alpine Park, which is located on the northern edge of the borough.
Economy
Alpine Borough has a small but diverse economy. The borough is home to a number of small businesses, including restaurants, retail stores, and professional services. The borough is also home to a number of corporate offices, including those of the pharmaceutical company Merck & Co. and the financial services firm UBS.
Demographics
As of the 2010 census, the population of Alpine Borough was 1,849. The racial makeup of the borough was 79.3% White, 8.2% Asian, 6.2% Hispanic or Latino, and 4.7% African American. The median household income was $150,000, and the median age was 44.
The borough is home to a number of religious institutions, including the Alpine Presbyterian Church, the Alpine Reformed Church, and the Alpine Jewish Center.
Conclusion
Alpine Borough is a small borough located in Bergen County, New Jersey. It is situated in the foothills of the Ramapo Mountains and is part of the New York metropolitan area. The borough is home to approximately 1,800 people and covers an area of 1.2 square miles. The borough has a small but diverse economy and is home to a number of small businesses, corporate offices, and religious institutions. The population of the borough is predominantly White, with a median household income of $150,000 and a median age of 44.
Common Questions
What is Per Capita Income in Alpine borough?
Per Capita income in Alpine borough is $124,312.
What is the Median Family Income in Alpine borough?
Median Family Income in Alpine borough is $242,969.
What is the Median Household income in Alpine borough?
Median Household Income in Alpine borough is $228,194.
What is Income or Wage Gap in Alpine borough?
Income or Wage Gap in Alpine borough is 57.6%.
Women in Alpine borough earn 42.4 cents for every dollar earned by a man.
What is Inequality or Gini Index in Alpine borough?
Inequality or Gini Index in Alpine borough is 0.51.
What is the Total Population of Alpine borough?
Total Population of Alpine borough is 1,449.
What is the Total Male Population of Alpine borough?
Total Male Population of Alpine borough is 773.
What is the Total Female Population of Alpine borough?
Total Female Population of Alpine borough is 676.
What is the Ratio of Males per 100 Females in Alpine borough?
There are 114.35 Males per 100 Females in Alpine borough.
What is the Ratio of Females per 100 Males in Alpine borough?
There are 87.45 Females per 100 Males in Alpine borough.
What is the Median Population Age in Alpine borough?
Median Population Age in Alpine borough is 49.2 Years.
What is the Average Family Size in Alpine borough
Average Family Size in Alpine borough is 3.1 People.
What is the Average Household Size in Alpine borough
Average Household Size in Alpine borough is 2.8 People.
How Large is the Labor Force in Alpine borough?
There are 637 People in the Labor Forcein in Alpine borough.
What is the Percentage of People in the Labor Force in Alpine borough?
55.3% of People are in the Labor Force in Alpine borough.
What is the Unemployment Rate in Alpine borough?
Unemployment Rate in Alpine borough is 8.9%.