Fanwood borough, NJ Map & Demographics
Fanwood borough Overview
$73,487
PER CAPITA INCOME
$203,447
AVG FAMILY INCOME
$177,727
AVG HOUSEHOLD INCOME
41.7%
WAGE / INCOME GAP [ % ]
58.3¢/ $1
WAGE / INCOME GAP [ $ ]
0.38
INEQUALITY / GINI INDEX
7,723
TOTAL POPULATION
3,660
MALE POPULATION
4,063
FEMALE POPULATION
90.08
MALES / 100 FEMALES
111.01
FEMALES / 100 MALES
43.6
MEDIAN AGE
3.0
AVG FAMILY SIZE
2.7
AVG HOUSEHOLD SIZE
4,309
LABOR FORCE [ PEOPLE ]
70.8%
PERCENT IN LABOR FORCE
4.7%
UNEMPLOYMENT RATE
Income in Fanwood borough
Income Overview in Fanwood borough
Per Capita Income in Fanwood borough is $73,487, while median incomes of families and households are $203,447 and $177,727 respectively.
| Characteristic | Number | Measure |
| Per Capita Income | 7,723 | $73,487 |
| Median Family Income | 2,281 | $203,447 |
| Mean Family Income | 2,281 | $227,770 |
| Median Household Income | 2,808 | $177,727 |
| Mean Household Income | 2,808 | $198,890 |
| Income Deficit | 2,281 | $0 |
| Wage / Income Gap (%) | 7,723 | 41.75% |
| Wage / Income Gap ($) | 7,723 | 58.25¢ per $1 |
| Gini / Inequality Index | 7,723 | 0.38 |
Earnings by Sex in Fanwood borough
Average Earnings in Fanwood borough are $98,371, $127,772 for men and $74,432 for women, a difference of 41.7%.
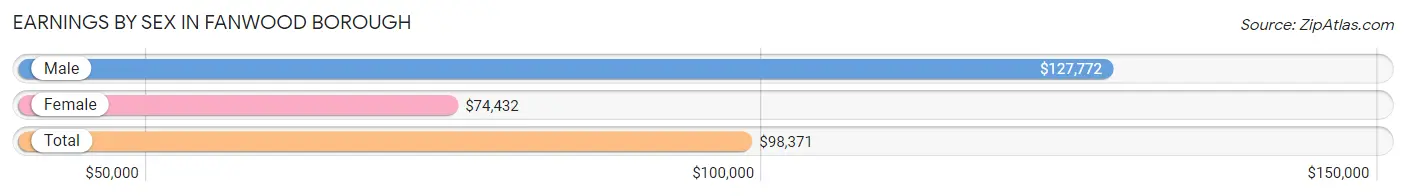
| Sex | Number | Average Earnings |
| Male | 2,277 (51.7%) | $127,772 |
| Female | 2,124 (48.3%) | $74,432 |
| Total | 4,401 (100.0%) | $98,371 |
Earnings by Sex by Income Bracket in Fanwood borough
The most common earnings brackets in Fanwood borough are $100,000+ for men (1,285 | 56.4%) and $100,000+ for women (879 | 41.4%).
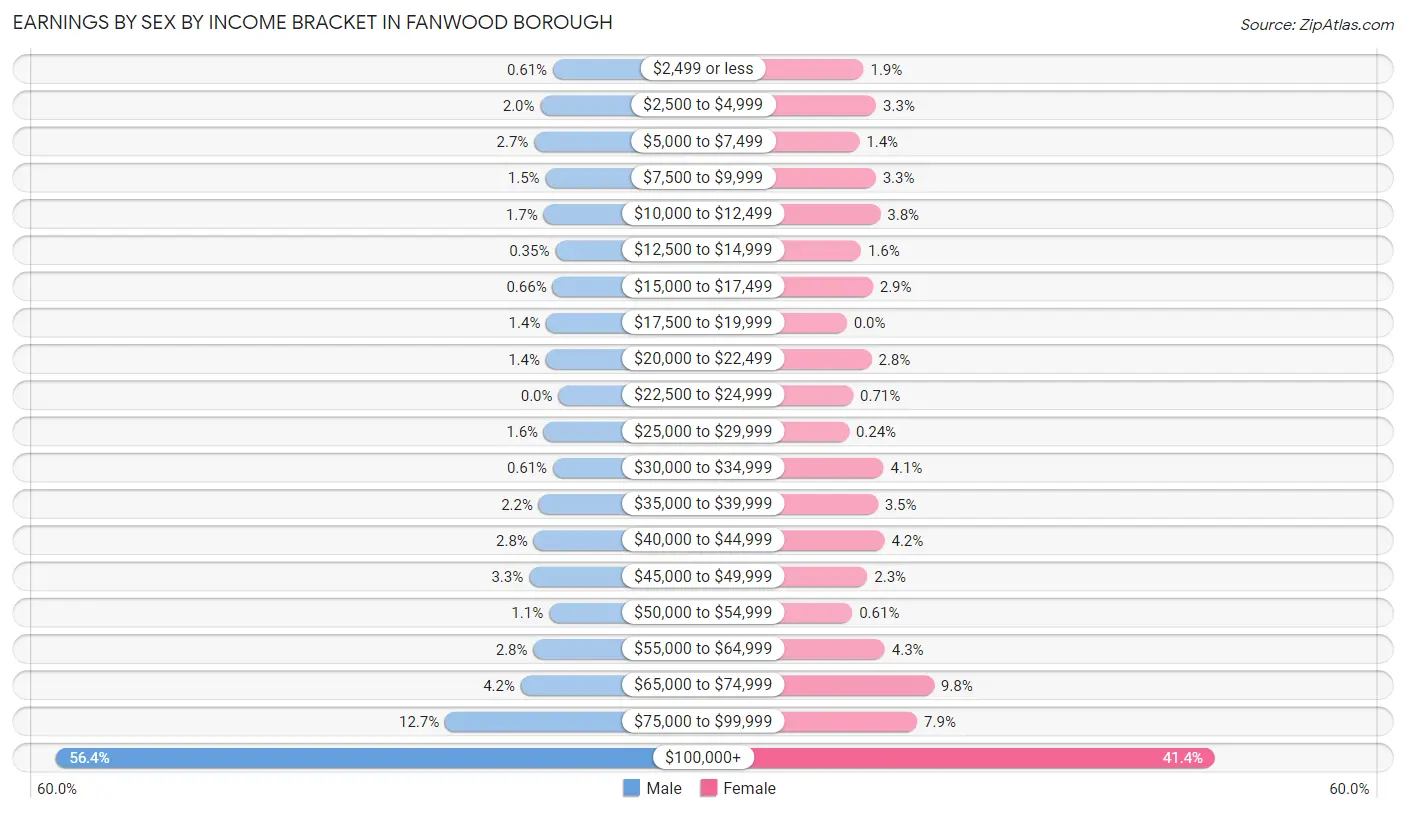
| Income | Male | Female |
| $2,499 or less | 14 (0.6%) | 40 (1.9%) |
| $2,500 to $4,999 | 46 (2.0%) | 70 (3.3%) |
| $5,000 to $7,499 | 62 (2.7%) | 30 (1.4%) |
| $7,500 to $9,999 | 33 (1.5%) | 69 (3.3%) |
| $10,000 to $12,499 | 38 (1.7%) | 80 (3.8%) |
| $12,500 to $14,999 | 8 (0.4%) | 34 (1.6%) |
| $15,000 to $17,499 | 15 (0.7%) | 62 (2.9%) |
| $17,500 to $19,999 | 31 (1.4%) | 0 (0.0%) |
| $20,000 to $22,499 | 32 (1.4%) | 59 (2.8%) |
| $22,500 to $24,999 | 0 (0.0%) | 15 (0.7%) |
| $25,000 to $29,999 | 37 (1.6%) | 5 (0.2%) |
| $30,000 to $34,999 | 14 (0.6%) | 88 (4.1%) |
| $35,000 to $39,999 | 50 (2.2%) | 74 (3.5%) |
| $40,000 to $44,999 | 63 (2.8%) | 90 (4.2%) |
| $45,000 to $49,999 | 75 (3.3%) | 49 (2.3%) |
| $50,000 to $54,999 | 24 (1.1%) | 13 (0.6%) |
| $55,000 to $64,999 | 64 (2.8%) | 91 (4.3%) |
| $65,000 to $74,999 | 96 (4.2%) | 208 (9.8%) |
| $75,000 to $99,999 | 290 (12.7%) | 168 (7.9%) |
| $100,000+ | 1,285 (56.4%) | 879 (41.4%) |
| Total | 2,277 (100.0%) | 2,124 (100.0%) |
Earnings by Sex by Educational Attainment in Fanwood borough
Average earnings in Fanwood borough are $143,789 for men and $90,172 for women, a difference of 37.3%. Men with an educational attainment of graduate degree enjoy the highest average annual earnings of $194,727, while those with high school diploma education earn the least with $42,171. Women with an educational attainment of graduate degree earn the most with the average annual earnings of $102,831, while those with college or associate's degree education have the smallest earnings of $45,234.
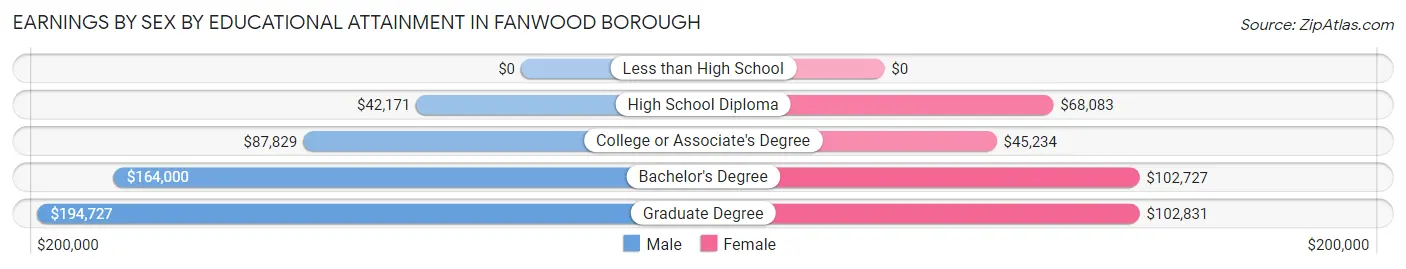
| Educational Attainment | Male Income | Female Income |
| Less than High School | - | - |
| High School Diploma | $42,171 | $68,083 |
| College or Associate's Degree | $87,829 | $45,234 |
| Bachelor's Degree | $164,000 | $102,727 |
| Graduate Degree | $194,727 | $102,831 |
| Total | $143,789 | $90,172 |
Family Income in Fanwood borough
Family Income Brackets in Fanwood borough
According to the Fanwood borough family income data, there are 1,152 families falling into the $200,000+ income range, which is the most common income bracket and makes up 50.5% of all families.
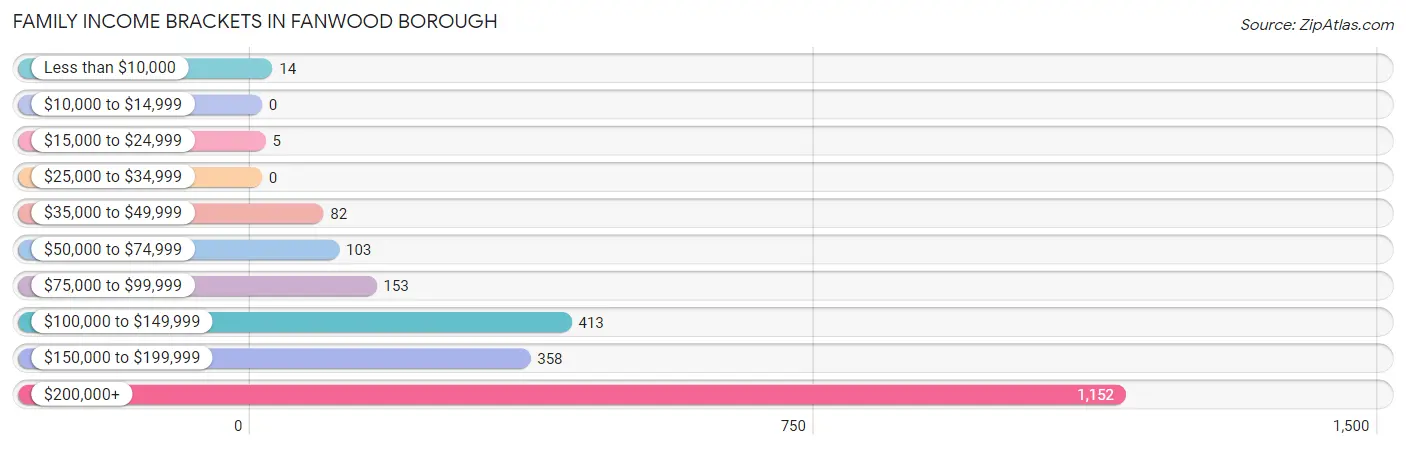
| Income Bracket | # Families | % Families |
| Less than $10,000 | 14 | 0.6% |
| $10,000 to $14,999 | 0 | 0.0% |
| $15,000 to $24,999 | 5 | 0.2% |
| $25,000 to $34,999 | 0 | 0.0% |
| $35,000 to $49,999 | 82 | 3.6% |
| $50,000 to $74,999 | 103 | 4.5% |
| $75,000 to $99,999 | 153 | 6.7% |
| $100,000 to $149,999 | 413 | 18.1% |
| $150,000 to $199,999 | 358 | 15.7% |
| $200,000+ | 1,152 | 50.5% |
Family Income by Famaliy Size in Fanwood borough
4-person families (597 | 26.2%) account for the highest median family income in Fanwood borough with $224,375 per family, while 2-person families (1,082 | 47.4%) have the highest median income of $101,478 per family member.
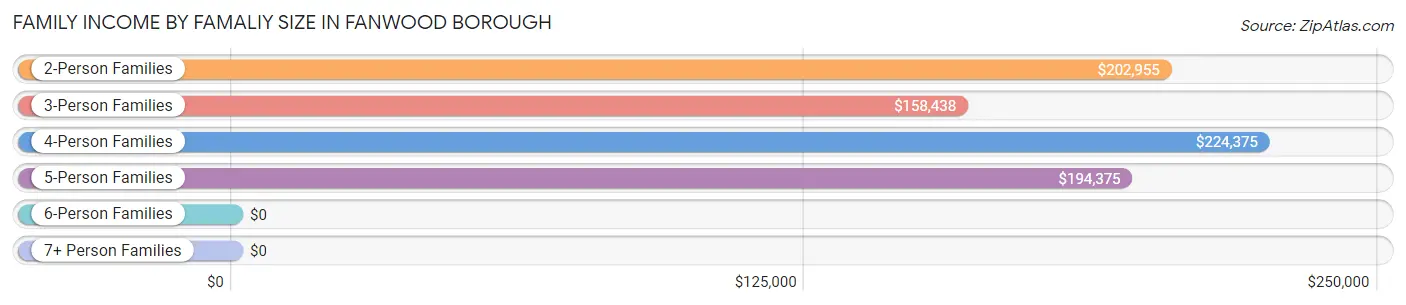
| Income Bracket | # Families | Median Income |
| 2-Person Families | 1,082 (47.4%) | $202,955 |
| 3-Person Families | 428 (18.8%) | $158,438 |
| 4-Person Families | 597 (26.2%) | $224,375 |
| 5-Person Families | 149 (6.5%) | $194,375 |
| 6-Person Families | 25 (1.1%) | $0 |
| 7+ Person Families | 0 (0.0%) | $0 |
| Total | 2,281 (100.0%) | $203,447 |
Family Income by Number of Earners in Fanwood borough
The median family income in Fanwood borough is $203,447, with families comprising 2 earners (1,419) having the highest median family income of $250,001, while families with no earners (218) have the lowest median family income of $100,000, accounting for 62.2% and 9.6% of families, respectively.
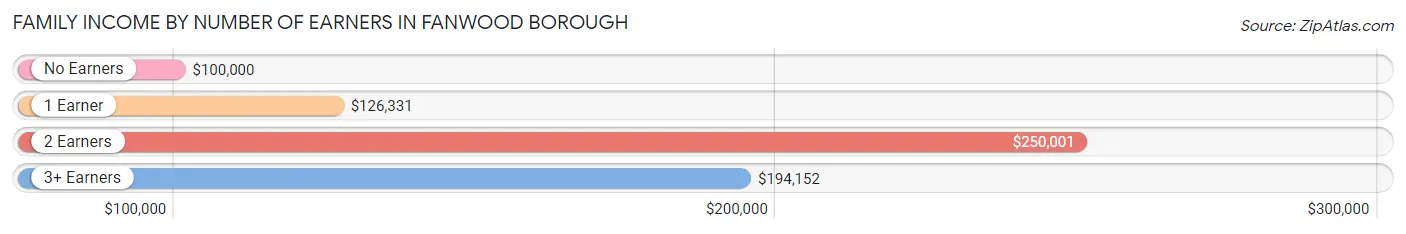
| Number of Earners | # Families | Median Income |
| No Earners | 218 (9.6%) | $100,000 |
| 1 Earner | 449 (19.7%) | $126,331 |
| 2 Earners | 1,419 (62.2%) | $250,001 |
| 3+ Earners | 195 (8.6%) | $194,152 |
| Total | 2,281 (100.0%) | $203,447 |
Household Income in Fanwood borough
Household Income Brackets in Fanwood borough
With 1,174 households falling in the category, the $200,000+ income range is the most frequent in Fanwood borough, accounting for 41.8% of all households. In contrast, only 17 households (0.6%) fall into the $10,000 to $14,999 income bracket, making it the least populous group.
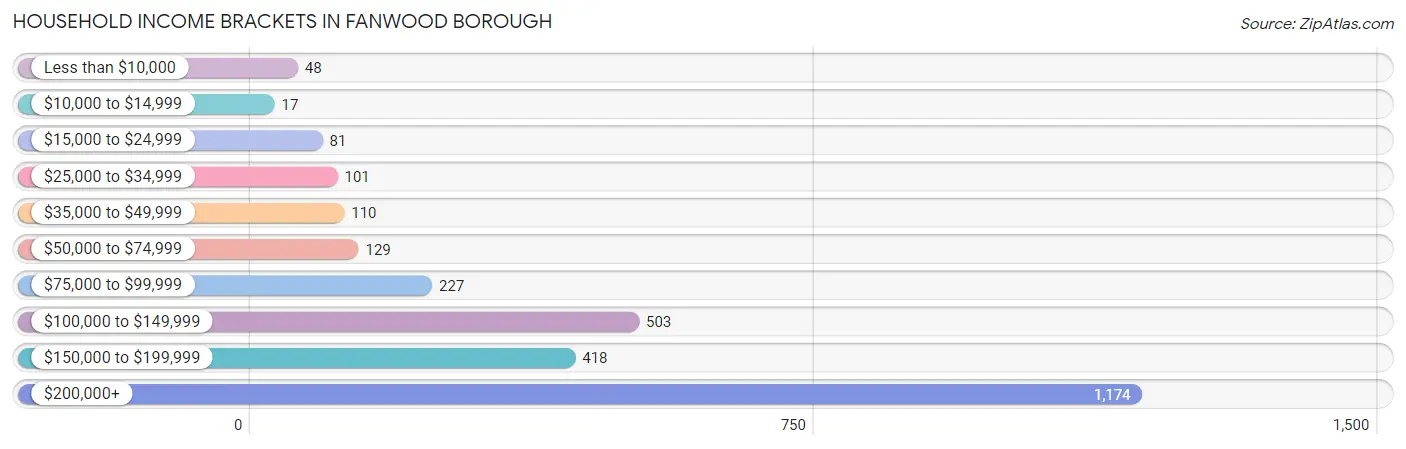
| Income Bracket | # Households | % Households |
| Less than $10,000 | 48 | 1.7% |
| $10,000 to $14,999 | 17 | 0.6% |
| $15,000 to $24,999 | 81 | 2.9% |
| $25,000 to $34,999 | 101 | 3.6% |
| $35,000 to $49,999 | 110 | 3.9% |
| $50,000 to $74,999 | 129 | 4.6% |
| $75,000 to $99,999 | 227 | 8.1% |
| $100,000 to $149,999 | 503 | 17.9% |
| $150,000 to $199,999 | 418 | 14.9% |
| $200,000+ | 1,174 | 41.8% |
Household Income by Householder Age in Fanwood borough
The median household income in Fanwood borough is $177,727, with the highest median household income of $233,661 found in the 25 to 44 years age bracket for the primary householder. A total of 765 households (27.2%) fall into this category. Meanwhile, the 15 to 24 years age bracket for the primary householder has the lowest median household income of $0, with 56 households (2.0%) in this group.
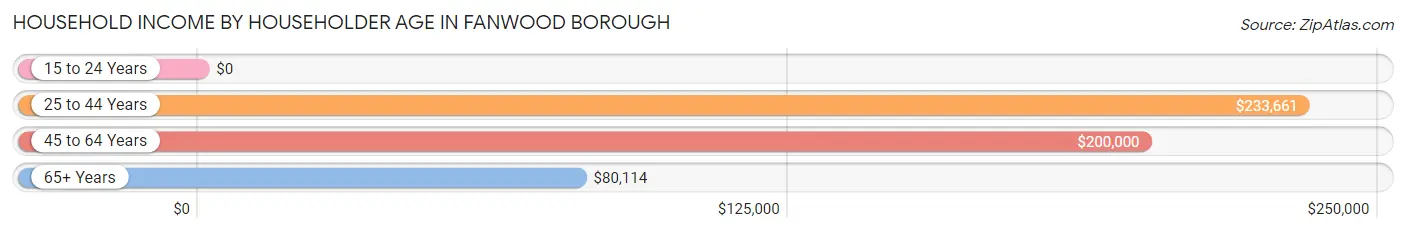
| Income Bracket | # Households | Median Income |
| 15 to 24 Years | 56 (2.0%) | $0 |
| 25 to 44 Years | 765 (27.2%) | $233,661 |
| 45 to 64 Years | 1,202 (42.8%) | $200,000 |
| 65+ Years | 785 (28.0%) | $80,114 |
| Total | 2,808 (100.0%) | $177,727 |
Poverty in Fanwood borough
Income Below Poverty by Sex and Age in Fanwood borough
With 1.3% poverty level for males and 1.3% for females among the residents of Fanwood borough, 75 year old and over males and under 5 year old females are the most vulnerable to poverty, with 34 males (12.6%) and 12 females (7.4%) in their respective age groups living below the poverty level.
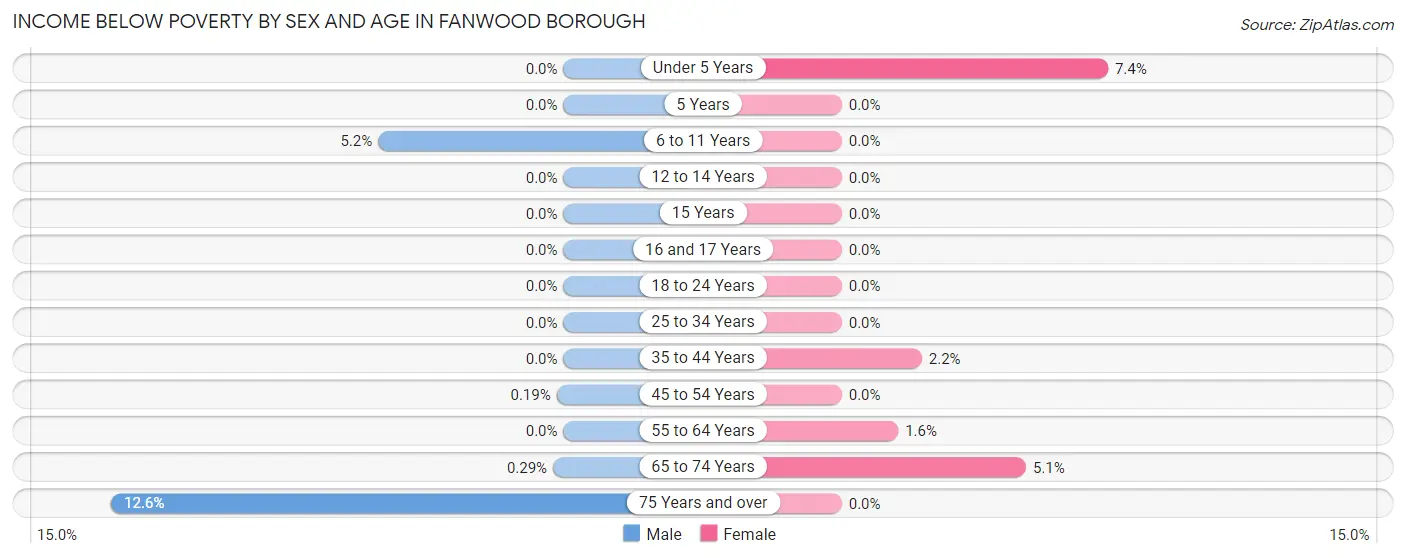
| Age Bracket | Male | Female |
| Under 5 Years | 0 (0.0%) | 12 (7.4%) |
| 5 Years | 0 (0.0%) | 0 (0.0%) |
| 6 to 11 Years | 13 (5.2%) | 0 (0.0%) |
| 12 to 14 Years | 0 (0.0%) | 0 (0.0%) |
| 15 Years | 0 (0.0%) | 0 (0.0%) |
| 16 and 17 Years | 0 (0.0%) | 0 (0.0%) |
| 18 to 24 Years | 0 (0.0%) | 0 (0.0%) |
| 25 to 34 Years | 0 (0.0%) | 0 (0.0%) |
| 35 to 44 Years | 0 (0.0%) | 13 (2.2%) |
| 45 to 54 Years | 1 (0.2%) | 0 (0.0%) |
| 55 to 64 Years | 0 (0.0%) | 11 (1.6%) |
| 65 to 74 Years | 1 (0.3%) | 16 (5.1%) |
| 75 Years and over | 34 (12.6%) | 0 (0.0%) |
| Total | 49 (1.3%) | 52 (1.3%) |
Income Above Poverty by Sex and Age in Fanwood borough
According to the poverty statistics in Fanwood borough, males aged under 5 years and females aged 5 years are the age groups that are most secure financially, with 100.0% of males and 100.0% of females in these age groups living above the poverty line.
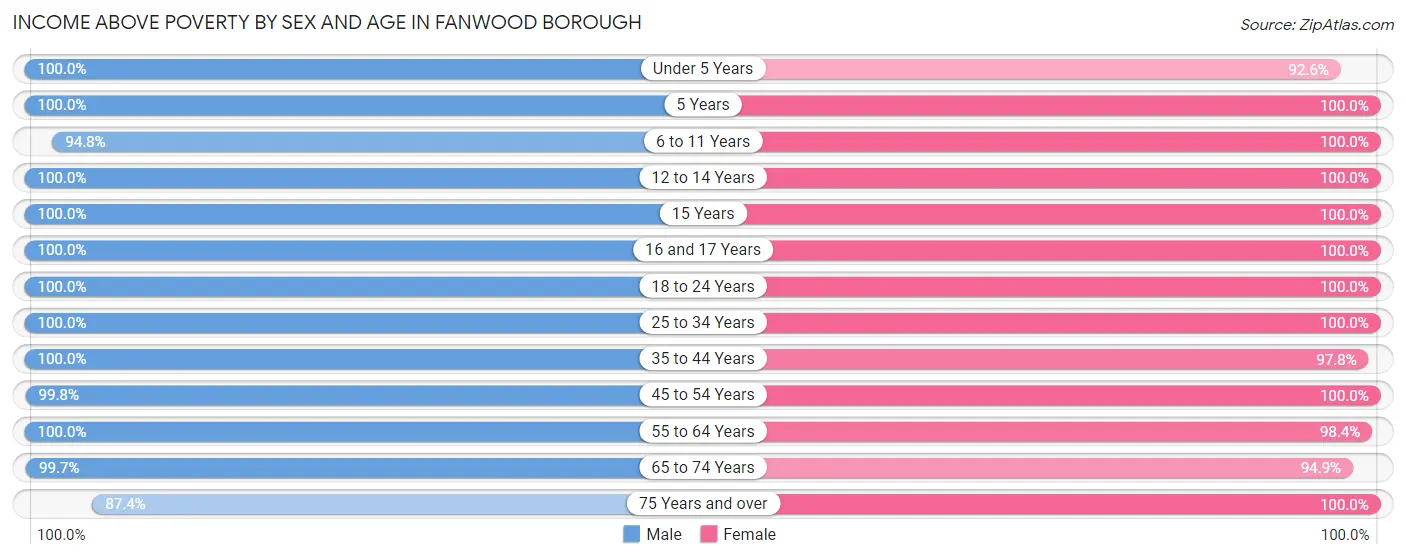
| Age Bracket | Male | Female |
| Under 5 Years | 182 (100.0%) | 150 (92.6%) |
| 5 Years | 34 (100.0%) | 57 (100.0%) |
| 6 to 11 Years | 239 (94.8%) | 426 (100.0%) |
| 12 to 14 Years | 140 (100.0%) | 213 (100.0%) |
| 15 Years | 128 (100.0%) | 24 (100.0%) |
| 16 and 17 Years | 97 (100.0%) | 66 (100.0%) |
| 18 to 24 Years | 210 (100.0%) | 276 (100.0%) |
| 25 to 34 Years | 263 (100.0%) | 382 (100.0%) |
| 35 to 44 Years | 520 (100.0%) | 569 (97.8%) |
| 45 to 54 Years | 534 (99.8%) | 482 (100.0%) |
| 55 to 64 Years | 671 (100.0%) | 689 (98.4%) |
| 65 to 74 Years | 342 (99.7%) | 296 (94.9%) |
| 75 Years and over | 236 (87.4%) | 301 (100.0%) |
| Total | 3,596 (98.7%) | 3,931 (98.7%) |
Income Below Poverty Among Married-Couple Families in Fanwood borough
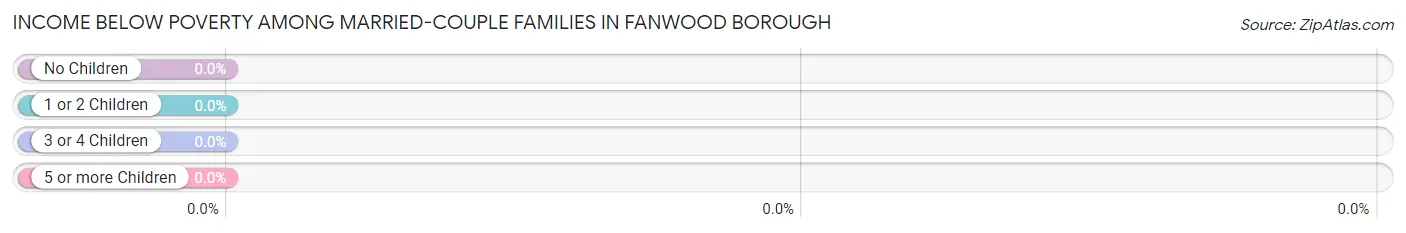
| Children | Above Poverty | Below Poverty |
| No Children | 1,200 (100.0%) | 0 (0.0%) |
| 1 or 2 Children | 784 (100.0%) | 0 (0.0%) |
| 3 or 4 Children | 76 (100.0%) | 0 (0.0%) |
| 5 or more Children | 0 (0.0%) | 0 (0.0%) |
| Total | 2,060 (100.0%) | 0 (0.0%) |
Income Below Poverty Among Single-Parent Households in Fanwood borough
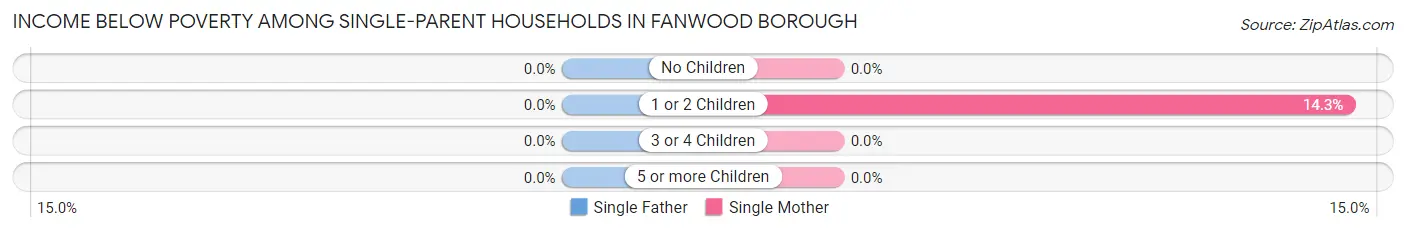
| Children | Single Father | Single Mother |
| No Children | 0 (0.0%) | 0 (0.0%) |
| 1 or 2 Children | 0 (0.0%) | 13 (14.3%) |
| 3 or 4 Children | 0 (0.0%) | 0 (0.0%) |
| 5 or more Children | 0 (0.0%) | 0 (0.0%) |
| Total | 0 (0.0%) | 13 (6.2%) |
Income Below Poverty Among Married-Couple vs Single-Parent Households in Fanwood borough
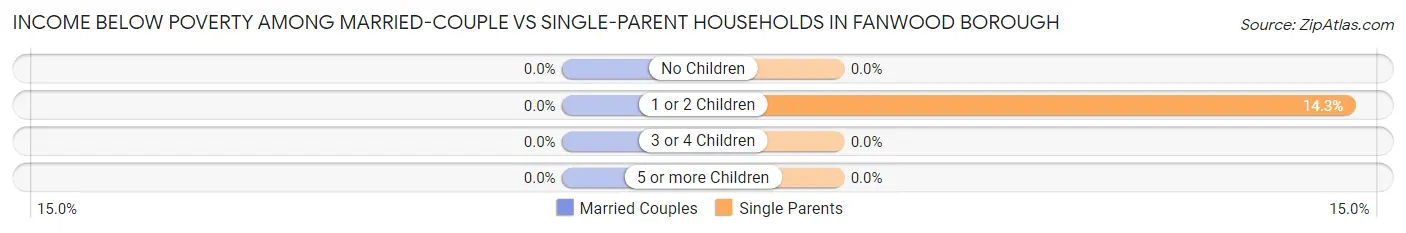
| Children | Married-Couple Families | Single-Parent Households |
| No Children | 0 (0.0%) | 0 (0.0%) |
| 1 or 2 Children | 0 (0.0%) | 13 (14.3%) |
| 3 or 4 Children | 0 (0.0%) | 0 (0.0%) |
| 5 or more Children | 0 (0.0%) | 0 (0.0%) |
| Total | 0 (0.0%) | 13 (5.9%) |
Race in Fanwood borough
The most populous races in Fanwood borough are White / Caucasian (5,861 | 75.9%), Two or more Races (848 | 11.0%), and Asian (610 | 7.9%).
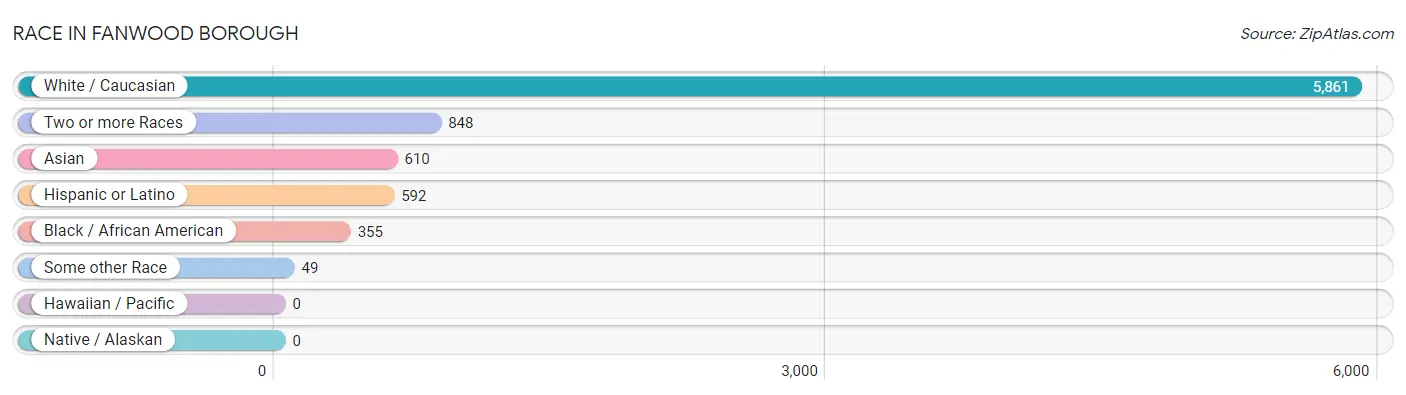
| Race | # Population | % Population |
| Asian | 610 | 7.9% |
| Black / African American | 355 | 4.6% |
| Hawaiian / Pacific | 0 | 0.0% |
| Hispanic or Latino | 592 | 7.7% |
| Native / Alaskan | 0 | 0.0% |
| White / Caucasian | 5,861 | 75.9% |
| Two or more Races | 848 | 11.0% |
| Some other Race | 49 | 0.6% |
| Total | 7,723 | 100.0% |
Ancestry in Fanwood borough
The most populous ancestries reported in Fanwood borough are Irish (1,774 | 23.0%), Italian (1,478 | 19.1%), German (1,075 | 13.9%), American (634 | 8.2%), and Polish (569 | 7.4%), together accounting for 71.6% of all Fanwood borough residents.
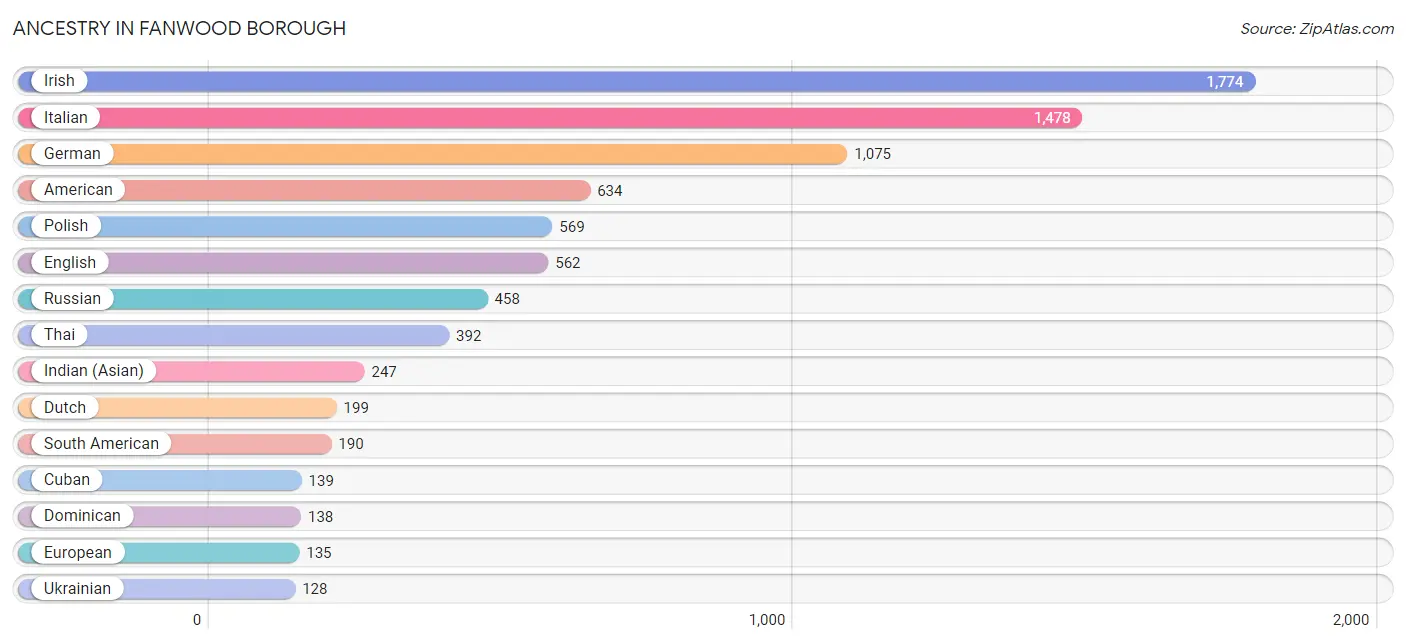
| Ancestry | # Population | % Population |
| American | 634 | 8.2% |
| Arab | 27 | 0.4% |
| Austrian | 11 | 0.1% |
| Bhutanese | 34 | 0.4% |
| Brazilian | 17 | 0.2% |
| British | 52 | 0.7% |
| Burmese | 116 | 1.5% |
| Carpatho Rusyn | 15 | 0.2% |
| Cherokee | 15 | 0.2% |
| Colombian | 77 | 1.0% |
| Croatian | 28 | 0.4% |
| Cuban | 139 | 1.8% |
| Danish | 34 | 0.4% |
| Dominican | 138 | 1.8% |
| Dutch | 199 | 2.6% |
| Eastern European | 80 | 1.0% |
| Ecuadorian | 17 | 0.2% |
| English | 562 | 7.3% |
| European | 135 | 1.8% |
| French | 49 | 0.6% |
| French Canadian | 13 | 0.2% |
| German | 1,075 | 13.9% |
| Greek | 56 | 0.7% |
| Guyanese | 9 | 0.1% |
| Hungarian | 74 | 1.0% |
| Indian (Asian) | 247 | 3.2% |
| Indonesian | 93 | 1.2% |
| Irish | 1,774 | 23.0% |
| Italian | 1,478 | 19.1% |
| Jamaican | 16 | 0.2% |
| Korean | 53 | 0.7% |
| Laotian | 41 | 0.5% |
| Lithuanian | 9 | 0.1% |
| Mexican | 10 | 0.1% |
| Nigerian | 19 | 0.3% |
| Norwegian | 26 | 0.3% |
| Palestinian | 11 | 0.1% |
| Paraguayan | 62 | 0.8% |
| Peruvian | 34 | 0.4% |
| Polish | 569 | 7.4% |
| Portuguese | 36 | 0.5% |
| Puerto Rican | 115 | 1.5% |
| Russian | 458 | 5.9% |
| Scotch-Irish | 71 | 0.9% |
| Scottish | 99 | 1.3% |
| South American | 190 | 2.5% |
| Sri Lankan | 13 | 0.2% |
| Subsaharan African | 19 | 0.3% |
| Thai | 392 | 5.1% |
| Trinidadian and Tobagonian | 37 | 0.5% |
| Ukrainian | 128 | 1.7% |
| Welsh | 42 | 0.5% |
| West Indian | 9 | 0.1% | View All 53 Rows |
Immigrants in Fanwood borough
The most numerous immigrant groups reported in Fanwood borough came from Asia (497 | 6.4%), Latin America (342 | 4.4%), India (268 | 3.5%), South Central Asia (268 | 3.5%), and Europe (249 | 3.2%), together accounting for 21.0% of all Fanwood borough residents.
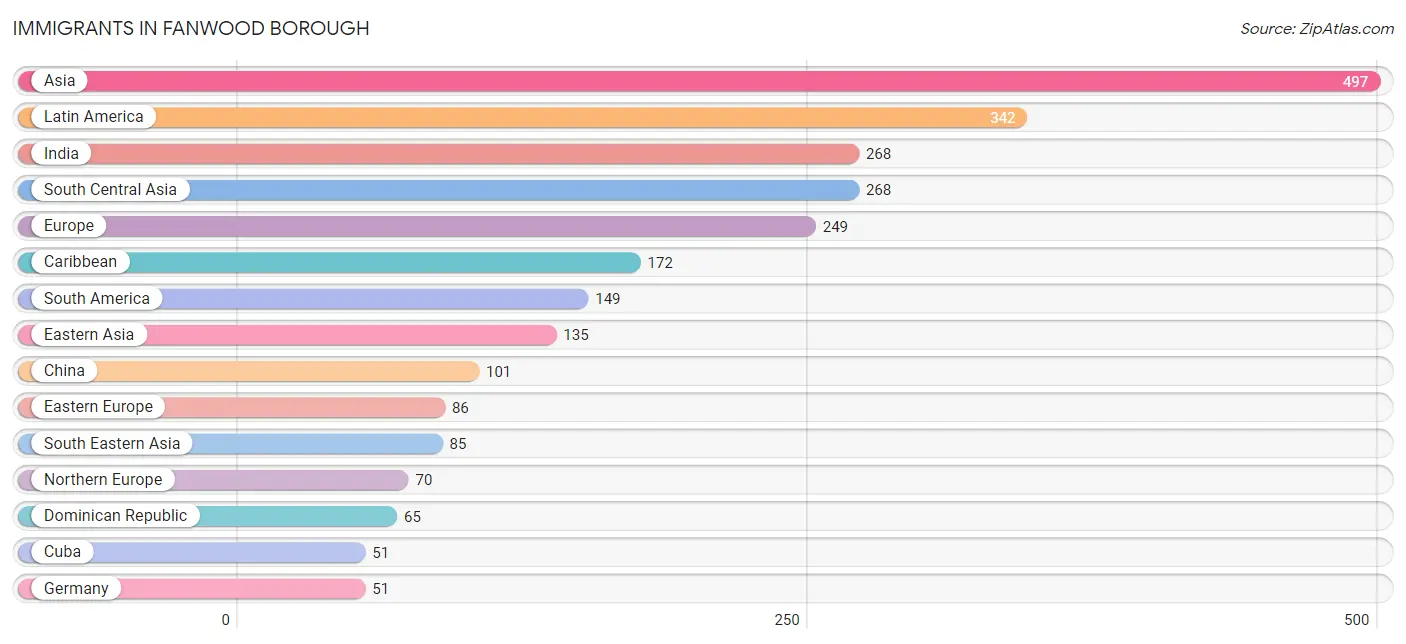
| Immigration Origin | # Population | % Population |
| Asia | 497 | 6.4% |
| Belarus | 15 | 0.2% |
| Brazil | 17 | 0.2% |
| Caribbean | 172 | 2.2% |
| Central America | 21 | 0.3% |
| China | 101 | 1.3% |
| Colombia | 44 | 0.6% |
| Croatia | 14 | 0.2% |
| Cuba | 51 | 0.7% |
| Dominican Republic | 65 | 0.8% |
| Eastern Asia | 135 | 1.8% |
| Eastern Europe | 86 | 1.1% |
| Ecuador | 17 | 0.2% |
| England | 50 | 0.6% |
| Europe | 249 | 3.2% |
| Germany | 51 | 0.7% |
| Guyana | 9 | 0.1% |
| Hong Kong | 49 | 0.6% |
| India | 268 | 3.5% |
| Indonesia | 41 | 0.5% |
| Italy | 36 | 0.5% |
| Jamaica | 47 | 0.6% |
| Korea | 34 | 0.4% |
| Latin America | 342 | 4.4% |
| Northern Europe | 70 | 0.9% |
| Panama | 21 | 0.3% |
| Philippines | 33 | 0.4% |
| Poland | 19 | 0.3% |
| Portugal | 6 | 0.1% |
| Singapore | 11 | 0.1% |
| South America | 149 | 1.9% |
| South Central Asia | 268 | 3.5% |
| South Eastern Asia | 85 | 1.1% |
| Southern Europe | 42 | 0.5% |
| St. Vincent and the Grenadines | 9 | 0.1% |
| Taiwan | 6 | 0.1% |
| Turkey | 9 | 0.1% |
| Ukraine | 16 | 0.2% |
| Western Asia | 9 | 0.1% |
| Western Europe | 51 | 0.7% | View All 40 Rows |
Sex and Age in Fanwood borough
Sex and Age in Fanwood borough
The most populous age groups in Fanwood borough are 55 to 59 Years (544 | 14.9%) for men and 55 to 59 Years (510 | 12.6%) for women.
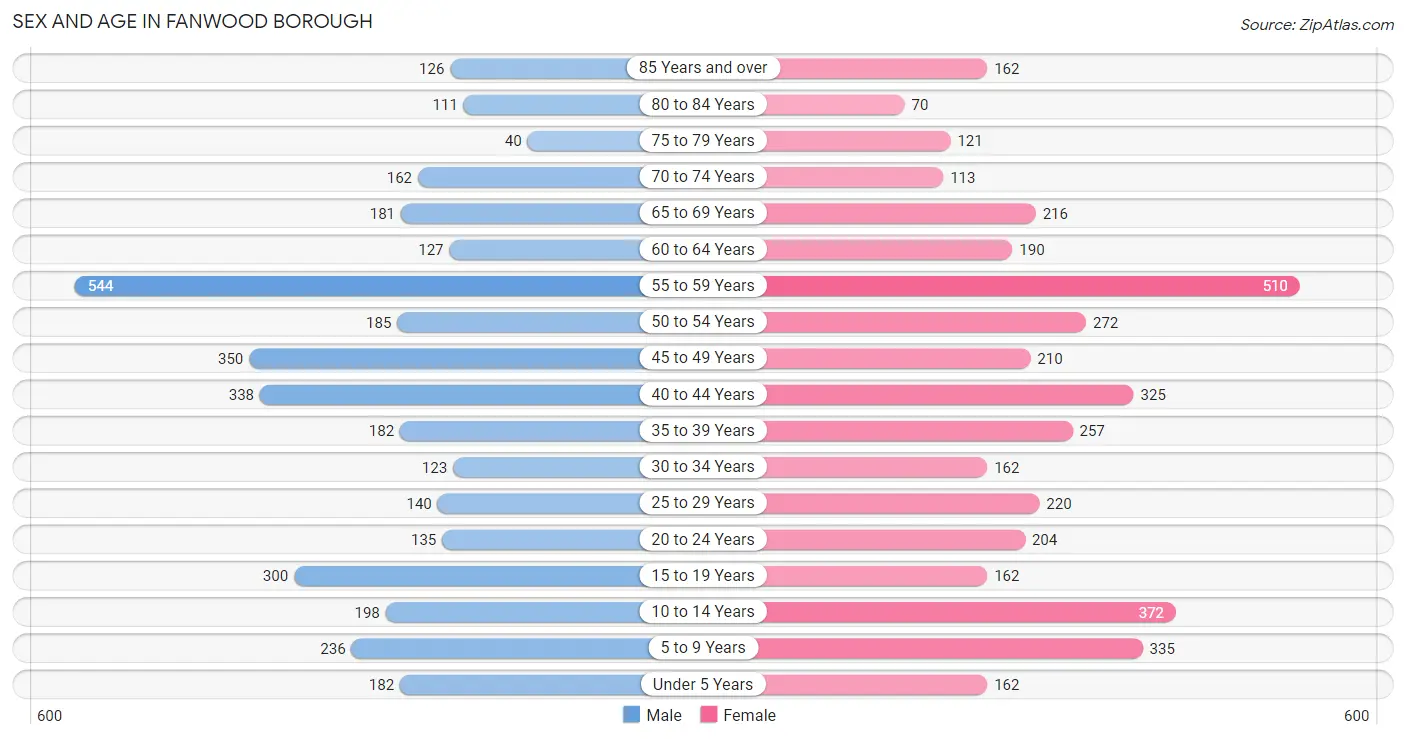
| Age Bracket | Male | Female |
| Under 5 Years | 182 (5.0%) | 162 (4.0%) |
| 5 to 9 Years | 236 (6.5%) | 335 (8.3%) |
| 10 to 14 Years | 198 (5.4%) | 372 (9.2%) |
| 15 to 19 Years | 300 (8.2%) | 162 (4.0%) |
| 20 to 24 Years | 135 (3.7%) | 204 (5.0%) |
| 25 to 29 Years | 140 (3.8%) | 220 (5.4%) |
| 30 to 34 Years | 123 (3.4%) | 162 (4.0%) |
| 35 to 39 Years | 182 (5.0%) | 257 (6.3%) |
| 40 to 44 Years | 338 (9.2%) | 325 (8.0%) |
| 45 to 49 Years | 350 (9.6%) | 210 (5.2%) |
| 50 to 54 Years | 185 (5.1%) | 272 (6.7%) |
| 55 to 59 Years | 544 (14.9%) | 510 (12.6%) |
| 60 to 64 Years | 127 (3.5%) | 190 (4.7%) |
| 65 to 69 Years | 181 (5.0%) | 216 (5.3%) |
| 70 to 74 Years | 162 (4.4%) | 113 (2.8%) |
| 75 to 79 Years | 40 (1.1%) | 121 (3.0%) |
| 80 to 84 Years | 111 (3.0%) | 70 (1.7%) |
| 85 Years and over | 126 (3.4%) | 162 (4.0%) |
| Total | 3,660 (100.0%) | 4,063 (100.0%) |
Families and Households in Fanwood borough
Median Family Size in Fanwood borough
The median family size in Fanwood borough is 3.05 persons per family, with married-couple families (2,060 | 90.3%) accounting for the largest median family size of 3.08 persons per family. On the other hand, single male/father families (11 | 0.5%) represent the smallest median family size with 2.18 persons per family.
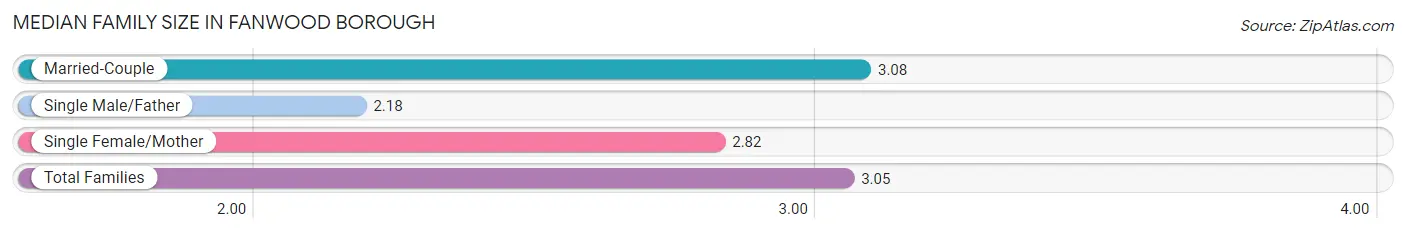
| Family Type | # Families | Family Size |
| Married-Couple | 2,060 (90.3%) | 3.08 |
| Single Male/Father | 11 (0.5%) | 2.18 |
| Single Female/Mother | 210 (9.2%) | 2.82 |
| Total Families | 2,281 (100.0%) | 3.05 |
Median Household Size in Fanwood borough
The median household size in Fanwood borough is 2.72 persons per household, with married-couple households (2,060 | 73.4%) accounting for the largest median household size of 3.08 persons per household. non-family households (527 | 18.8%) represent the smallest median household size with 1.25 persons per household.
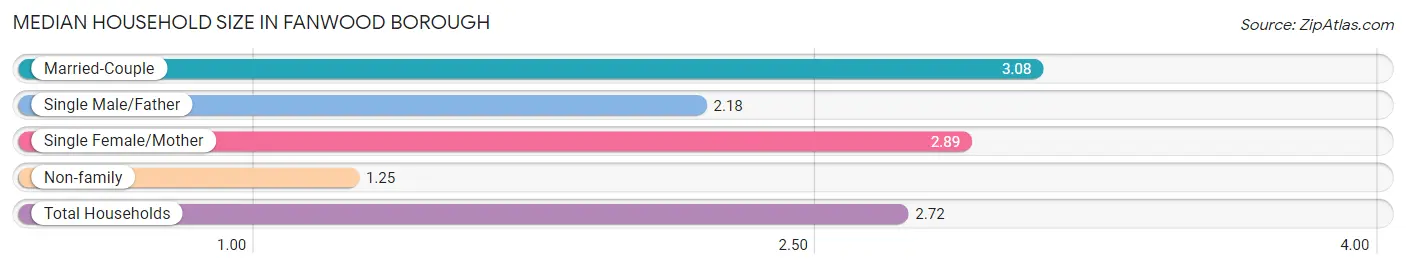
| Household Type | # Households | Household Size |
| Married-Couple | 2,060 (73.4%) | 3.08 |
| Single Male/Father | 11 (0.4%) | 2.18 |
| Single Female/Mother | 210 (7.5%) | 2.89 |
| Non-family | 527 (18.8%) | 1.25 |
| Total Households | 2,808 (100.0%) | 2.72 |
Household Size by Marriage Status in Fanwood borough
Out of a total of 2,808 households in Fanwood borough, 2,281 (81.2%) are family households, while 527 (18.8%) are nonfamily households. The most numerous type of family households are 2-person households, comprising 1,066, and the most common type of nonfamily households are 1-person households, comprising 437.
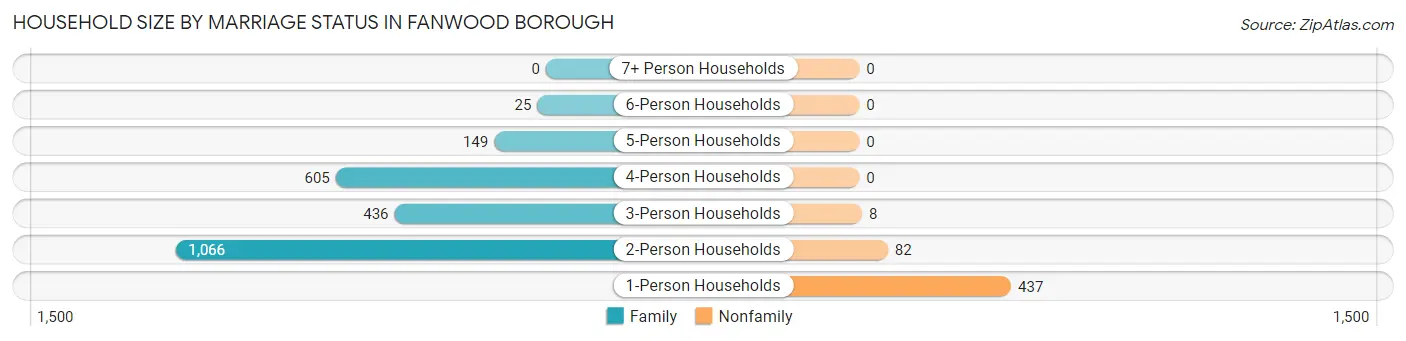
| Household Size | Family Households | Nonfamily Households |
| 1-Person Households | - | 437 (15.6%) |
| 2-Person Households | 1,066 (38.0%) | 82 (2.9%) |
| 3-Person Households | 436 (15.5%) | 8 (0.3%) |
| 4-Person Households | 605 (21.5%) | 0 (0.0%) |
| 5-Person Households | 149 (5.3%) | 0 (0.0%) |
| 6-Person Households | 25 (0.9%) | 0 (0.0%) |
| 7+ Person Households | 0 (0.0%) | 0 (0.0%) |
| Total | 2,281 (81.2%) | 527 (18.8%) |
Female Fertility in Fanwood borough
Fertility by Age in Fanwood borough
Average fertility rate in Fanwood borough is 50.0 births per 1,000 women. Women in the age bracket of 20 to 34 years have the highest fertility rate with 87.0 births per 1,000 women. Women in the age bracket of 20 to 34 years acount for 65.4% of all women with births.
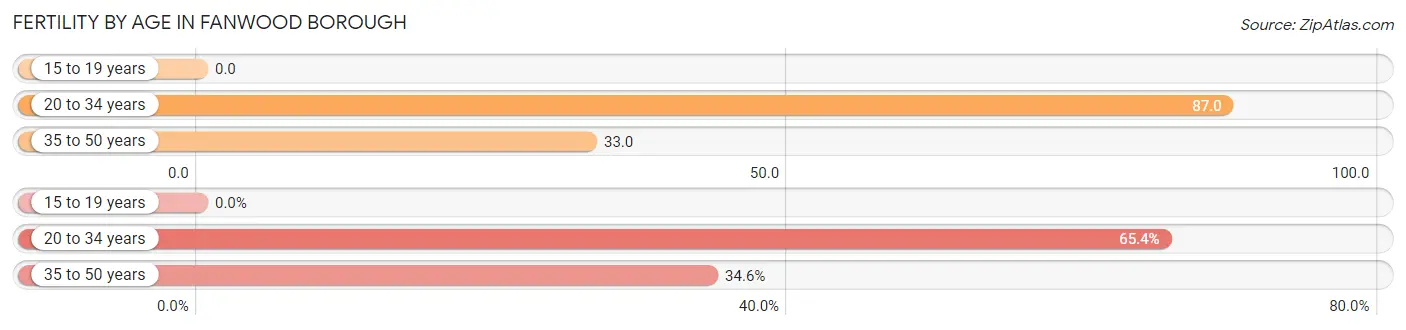
| Age Bracket | Women with Births | Births / 1,000 Women |
| 15 to 19 years | 0 (0.0%) | 0.0 |
| 20 to 34 years | 51 (65.4%) | 87.0 |
| 35 to 50 years | 27 (34.6%) | 33.0 |
| Total | 78 (100.0%) | 50.0 |
Fertility by Age by Marriage Status in Fanwood borough
79.5% of women with births (78) in Fanwood borough are married. The highest percentage of unmarried women with births falls into 20 to 34 years age bracket with 31.4% of them unmarried at the time of birth, while the lowest percentage of unmarried women with births belong to 35 to 50 years age bracket with 0.0% of them unmarried.
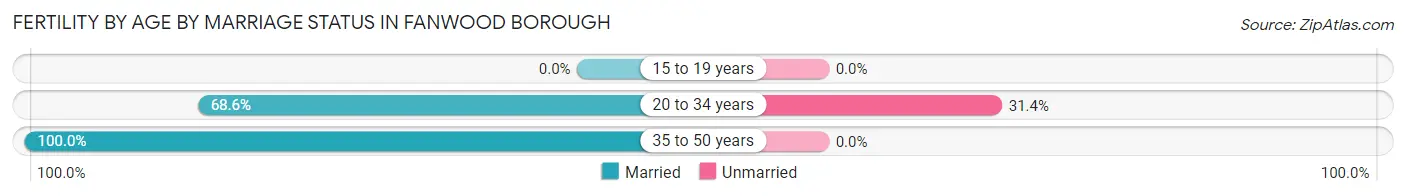
| Age Bracket | Married | Unmarried |
| 15 to 19 years | 0 (0.0%) | 0 (0.0%) |
| 20 to 34 years | 35 (68.6%) | 16 (31.4%) |
| 35 to 50 years | 27 (100.0%) | 0 (0.0%) |
| Total | 62 (79.5%) | 16 (20.5%) |
Fertility by Education in Fanwood borough
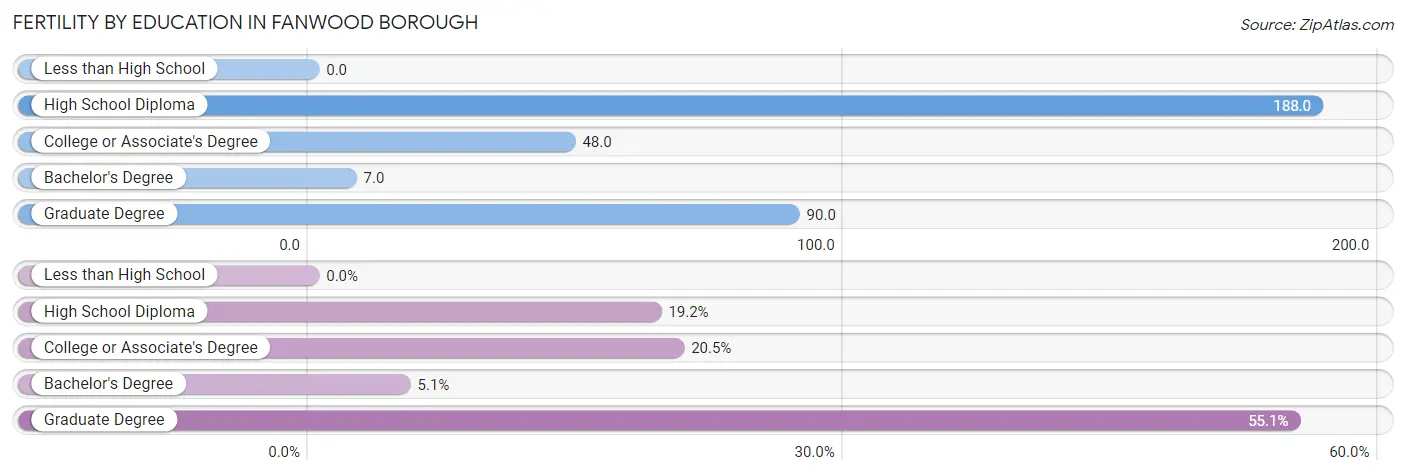
| Educational Attainment | Women with Births | Births / 1,000 Women |
| Less than High School | 0 (0.0%) | 0.0 |
| High School Diploma | 15 (19.2%) | 188.0 |
| College or Associate's Degree | 16 (20.5%) | 48.0 |
| Bachelor's Degree | 4 (5.1%) | 7.0 |
| Graduate Degree | 43 (55.1%) | 90.0 |
| Total | 78 (100.0%) | 50.0 |
Fertility by Education by Marriage Status in Fanwood borough
20.5% of women with births in Fanwood borough are unmarried. Women with the educational attainment of high school diploma are most likely to be married with 100.0% of them married at childbirth, while women with the educational attainment of college or associate's degree are least likely to be married with 100.0% of them unmarried at childbirth.
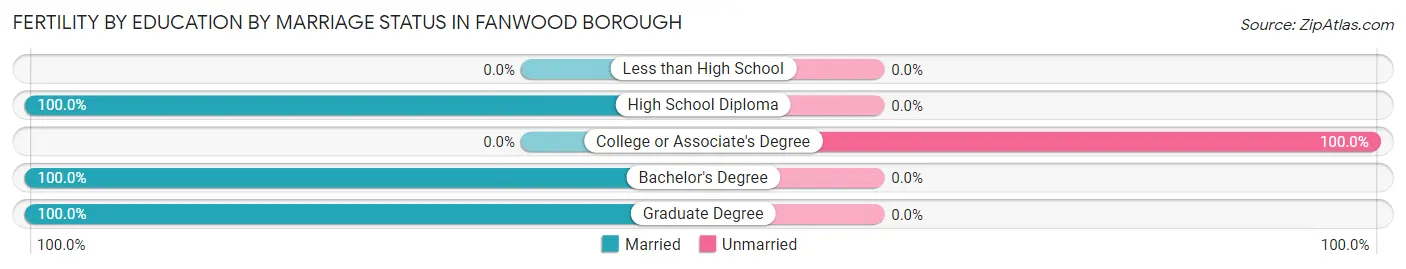
| Educational Attainment | Married | Unmarried |
| Less than High School | 0 (0.0%) | 0 (0.0%) |
| High School Diploma | 15 (100.0%) | 0 (0.0%) |
| College or Associate's Degree | 0 (0.0%) | 16 (100.0%) |
| Bachelor's Degree | 4 (100.0%) | 0 (0.0%) |
| Graduate Degree | 43 (100.0%) | 0 (0.0%) |
| Total | 62 (79.5%) | 16 (20.5%) |
Employment Characteristics in Fanwood borough
Employment by Class of Employer in Fanwood borough
Among the 4,083 employed individuals in Fanwood borough, private company employees (3,182 | 77.9%), local government employees (252 | 6.2%), and not-for-profit organizations (233 | 5.7%) make up the most common classes of employment.
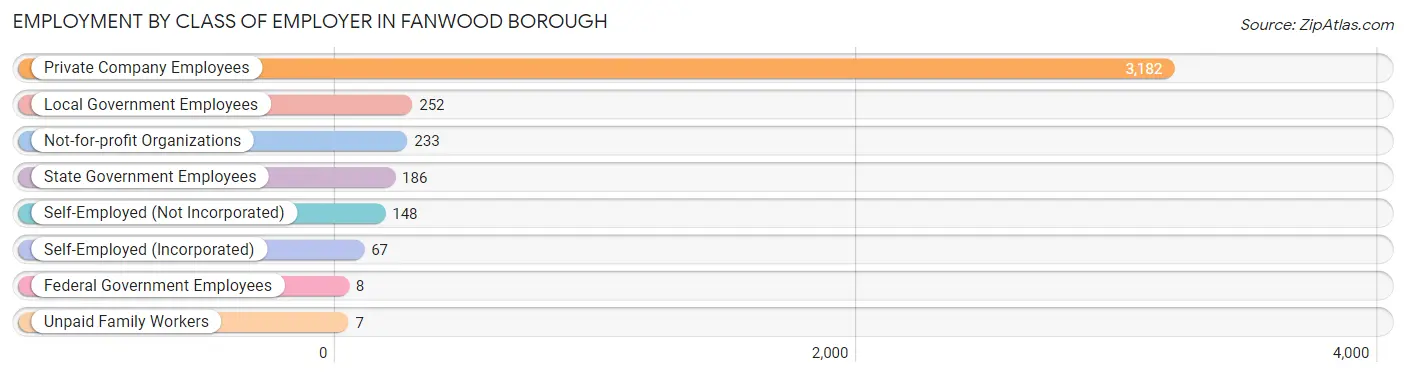
| Employer Class | # Employees | % Employees |
| Private Company Employees | 3,182 | 77.9% |
| Self-Employed (Incorporated) | 67 | 1.6% |
| Self-Employed (Not Incorporated) | 148 | 3.6% |
| Not-for-profit Organizations | 233 | 5.7% |
| Local Government Employees | 252 | 6.2% |
| State Government Employees | 186 | 4.6% |
| Federal Government Employees | 8 | 0.2% |
| Unpaid Family Workers | 7 | 0.2% |
| Total | 4,083 | 100.0% |
Employment Status by Age in Fanwood borough
According to the labor force statistics for Fanwood borough, out of the total population over 16 years of age (6,086), 70.8% or 4,309 individuals are in the labor force, with 4.7% or 203 of them unemployed. The age group with the highest labor force participation rate is 25 to 29 years, with 100.0% or 360 individuals in the labor force. Within the labor force, the 20 to 24 years age range has the highest percentage of unemployed individuals, with 29.8% or 87 of them being unemployed.
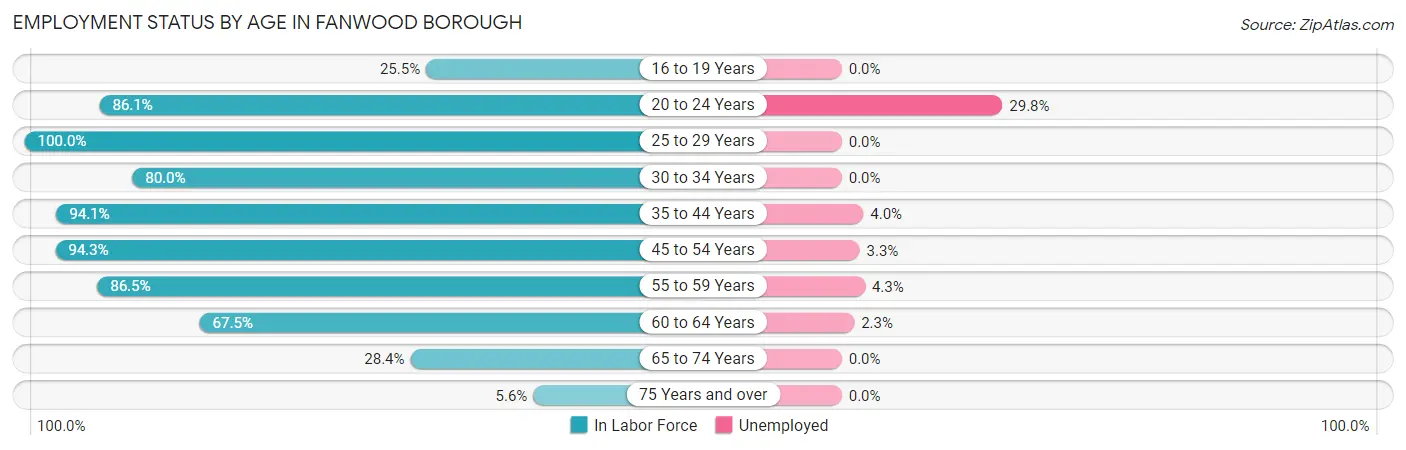
| Age Bracket | In Labor Force | Unemployed |
| 16 to 19 Years | 79 (25.5%) | 0 (0.0%) |
| 20 to 24 Years | 292 (86.1%) | 87 (29.8%) |
| 25 to 29 Years | 360 (100.0%) | 0 (0.0%) |
| 30 to 34 Years | 228 (80.0%) | 0 (0.0%) |
| 35 to 44 Years | 1,037 (94.1%) | 41 (4.0%) |
| 45 to 54 Years | 959 (94.3%) | 32 (3.3%) |
| 55 to 59 Years | 912 (86.5%) | 39 (4.3%) |
| 60 to 64 Years | 214 (67.5%) | 5 (2.3%) |
| 65 to 74 Years | 191 (28.4%) | 0 (0.0%) |
| 75 Years and over | 35 (5.6%) | 0 (0.0%) |
| Total | 4,309 (70.8%) | 203 (4.7%) |
Employment Status by Educational Attainment in Fanwood borough
According to labor force statistics for Fanwood borough, 89.7% of individuals (3,709) out of the total population between 25 and 64 years of age (4,135) are in the labor force, with 3.2% or 119 of them being unemployed. The group with the highest labor force participation rate are those with the educational attainment of bachelor's degree or higher, with 92.8% or 3,010 individuals in the labor force. Within the labor force, individuals with college / associate degree education have the highest percentage of unemployment, with 3.7% or 17 of them being unemployed.
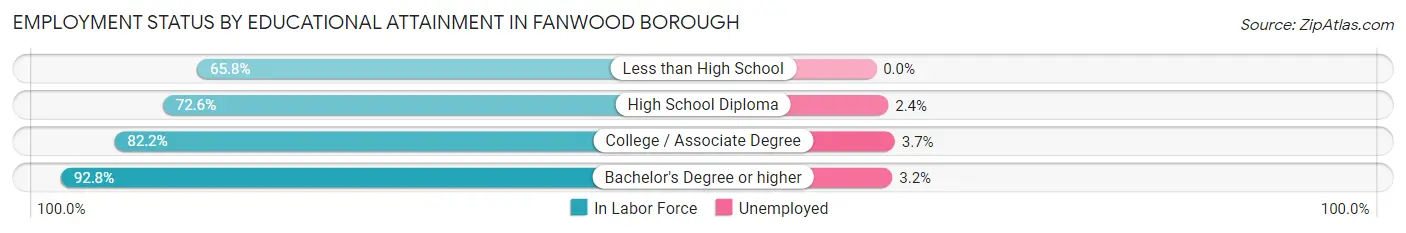
| Educational Attainment | In Labor Force | Unemployed |
| Less than High School | 25 (65.8%) | 0 (0.0%) |
| High School Diploma | 209 (72.6%) | 7 (2.4%) |
| College / Associate Degree | 465 (82.2%) | 21 (3.7%) |
| Bachelor's Degree or higher | 3,010 (92.8%) | 104 (3.2%) |
| Total | 3,709 (89.7%) | 132 (3.2%) |
Employment Occupations by Sex in Fanwood borough
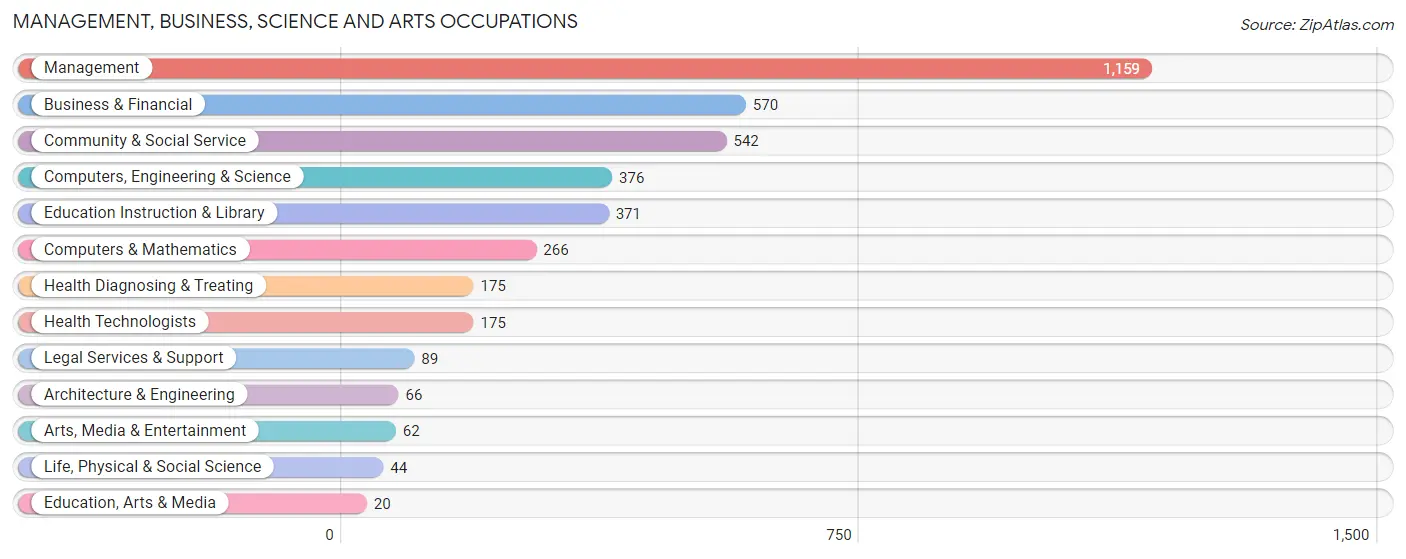
Management, Business, Science and Arts Occupations
The most common Management, Business, Science and Arts occupations in Fanwood borough are Management (1,159 | 28.2%), Business & Financial (570 | 13.9%), Community & Social Service (542 | 13.2%), Computers, Engineering & Science (376 | 9.2%), and Education Instruction & Library (371 | 9.0%).
Management, Business, Science and Arts Occupations by Sex
Within the Management, Business, Science and Arts occupations in Fanwood borough, the most male-oriented occupations are Architecture & Engineering (100.0%), Computers & Mathematics (92.5%), and Computers, Engineering & Science (92.3%), while the most female-oriented occupations are Education, Arts & Media (100.0%), Education Instruction & Library (69.5%), and Community & Social Service (65.3%).
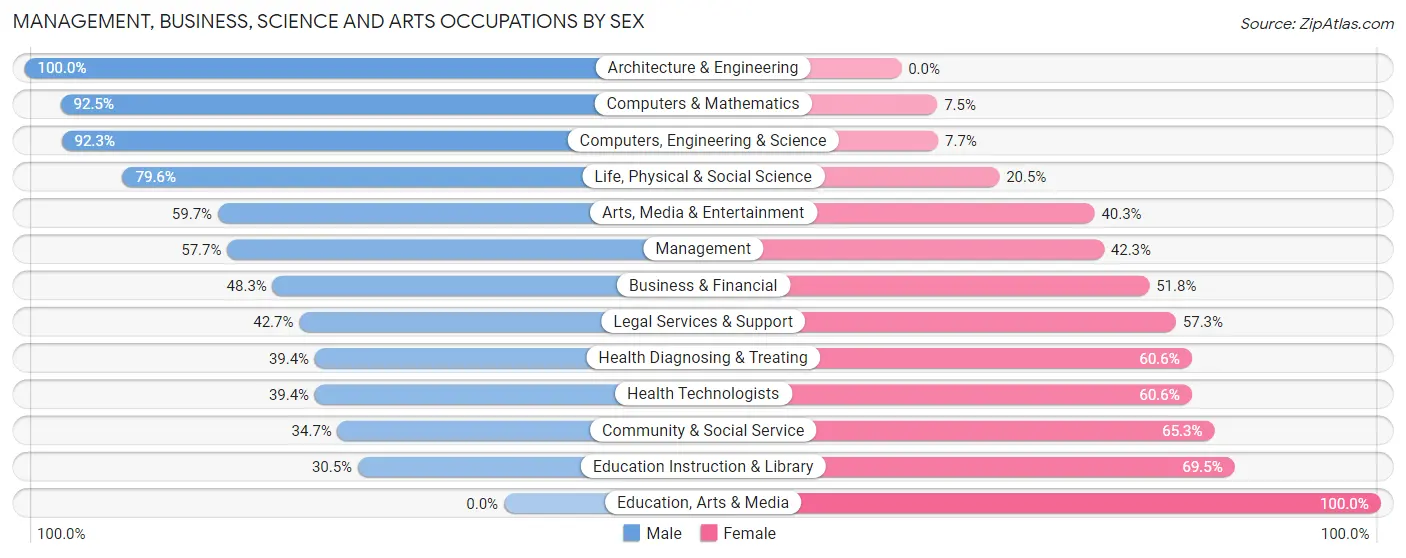
| Occupation | Male | Female |
| Management | 669 (57.7%) | 490 (42.3%) |
| Business & Financial | 275 (48.2%) | 295 (51.7%) |
| Computers, Engineering & Science | 347 (92.3%) | 29 (7.7%) |
| Computers & Mathematics | 246 (92.5%) | 20 (7.5%) |
| Architecture & Engineering | 66 (100.0%) | 0 (0.0%) |
| Life, Physical & Social Science | 35 (79.5%) | 9 (20.4%) |
| Community & Social Service | 188 (34.7%) | 354 (65.3%) |
| Education, Arts & Media | 0 (0.0%) | 20 (100.0%) |
| Legal Services & Support | 38 (42.7%) | 51 (57.3%) |
| Education Instruction & Library | 113 (30.5%) | 258 (69.5%) |
| Arts, Media & Entertainment | 37 (59.7%) | 25 (40.3%) |
| Health Diagnosing & Treating | 69 (39.4%) | 106 (60.6%) |
| Health Technologists | 69 (39.4%) | 106 (60.6%) |
| Total (Category) | 1,548 (54.8%) | 1,274 (45.2%) |
| Total (Overall) | 2,118 (51.6%) | 1,985 (48.4%) |
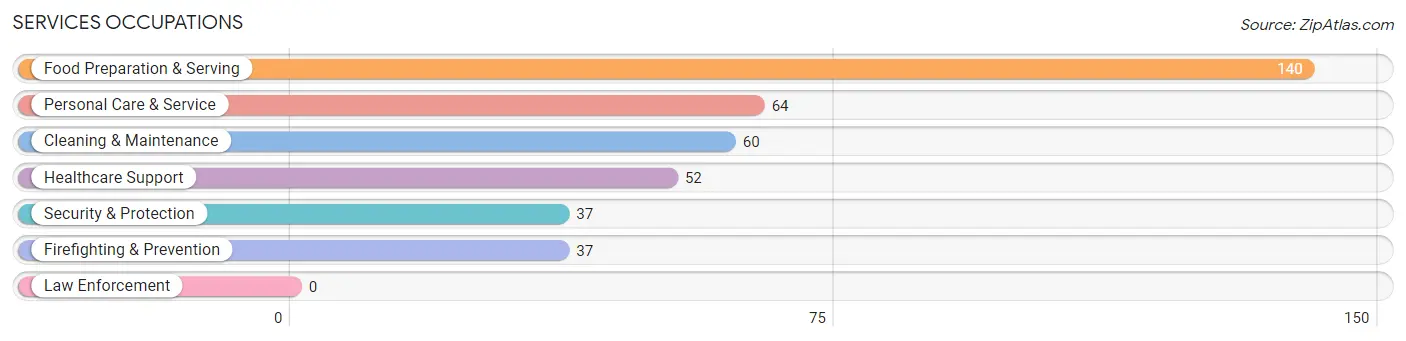
Services Occupations
The most common Services occupations in Fanwood borough are Food Preparation & Serving (140 | 3.4%), Personal Care & Service (64 | 1.6%), Cleaning & Maintenance (60 | 1.5%), Healthcare Support (52 | 1.3%), and Security & Protection (37 | 0.9%).
Services Occupations by Sex
Within the Services occupations in Fanwood borough, the most male-oriented occupations are Security & Protection (100.0%), Firefighting & Prevention (100.0%), and Cleaning & Maintenance (100.0%), while the most female-oriented occupations are Healthcare Support (76.9%), Food Preparation & Serving (68.6%), and Personal Care & Service (64.1%).
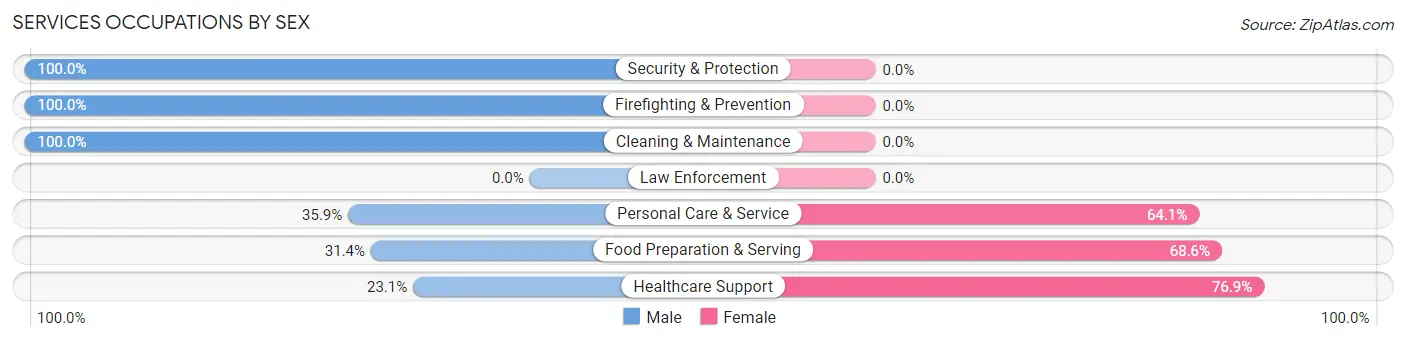
| Occupation | Male | Female |
| Healthcare Support | 12 (23.1%) | 40 (76.9%) |
| Security & Protection | 37 (100.0%) | 0 (0.0%) |
| Firefighting & Prevention | 37 (100.0%) | 0 (0.0%) |
| Law Enforcement | 0 (0.0%) | 0 (0.0%) |
| Food Preparation & Serving | 44 (31.4%) | 96 (68.6%) |
| Cleaning & Maintenance | 60 (100.0%) | 0 (0.0%) |
| Personal Care & Service | 23 (35.9%) | 41 (64.1%) |
| Total (Category) | 176 (49.9%) | 177 (50.1%) |
| Total (Overall) | 2,118 (51.6%) | 1,985 (48.4%) |
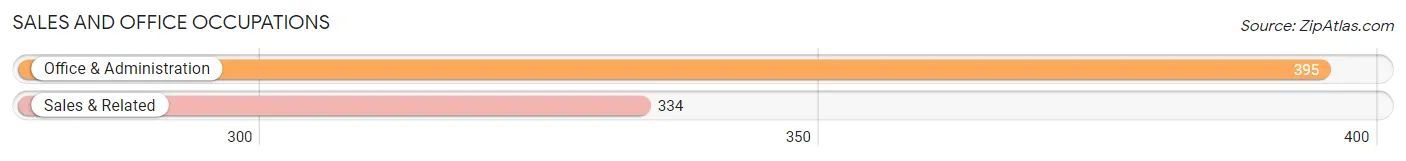
Sales and Office Occupations
The most common Sales and Office occupations in Fanwood borough are Office & Administration (395 | 9.6%), and Sales & Related (334 | 8.1%).
Sales and Office Occupations by Sex

| Occupation | Male | Female |
| Sales & Related | 126 (37.7%) | 208 (62.3%) |
| Office & Administration | 78 (19.8%) | 317 (80.2%) |
| Total (Category) | 204 (28.0%) | 525 (72.0%) |
| Total (Overall) | 2,118 (51.6%) | 1,985 (48.4%) |
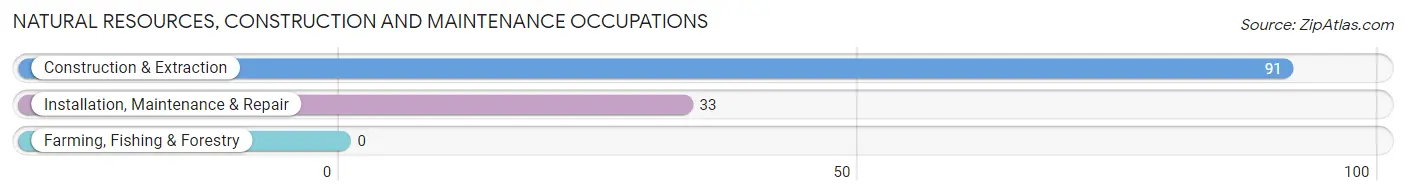
Natural Resources, Construction and Maintenance Occupations
The most common Natural Resources, Construction and Maintenance occupations in Fanwood borough are Construction & Extraction (91 | 2.2%), and Installation, Maintenance & Repair (33 | 0.8%).
Natural Resources, Construction and Maintenance Occupations by Sex
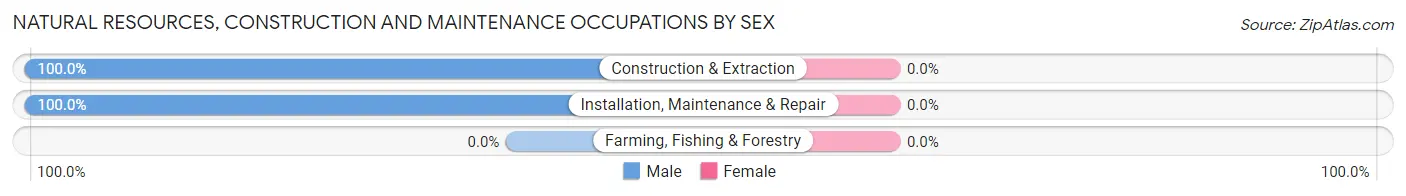
| Occupation | Male | Female |
| Farming, Fishing & Forestry | 0 (0.0%) | 0 (0.0%) |
| Construction & Extraction | 91 (100.0%) | 0 (0.0%) |
| Installation, Maintenance & Repair | 33 (100.0%) | 0 (0.0%) |
| Total (Category) | 124 (100.0%) | 0 (0.0%) |
| Total (Overall) | 2,118 (51.6%) | 1,985 (48.4%) |
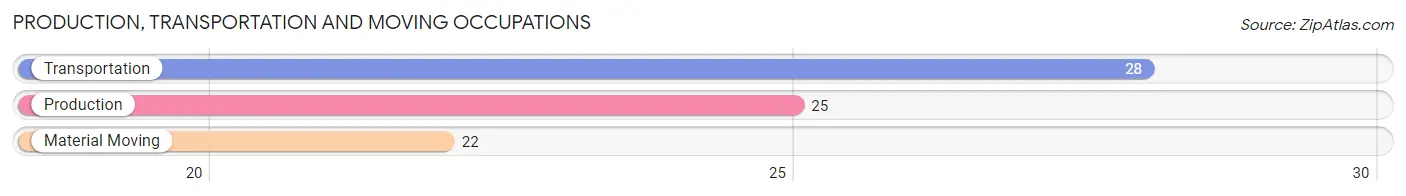
Production, Transportation and Moving Occupations
The most common Production, Transportation and Moving occupations in Fanwood borough are Transportation (28 | 0.7%), Production (25 | 0.6%), and Material Moving (22 | 0.5%).
Production, Transportation and Moving Occupations by Sex
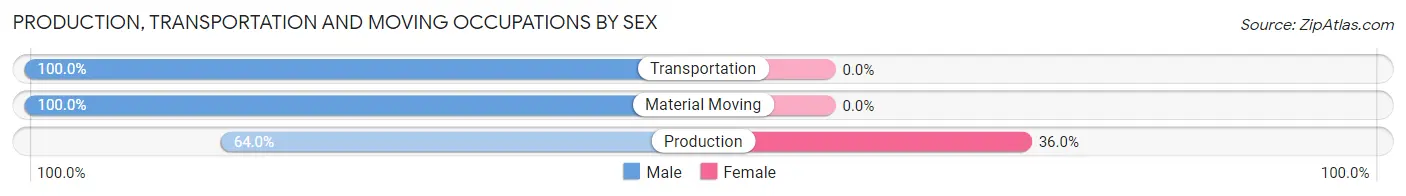
| Occupation | Male | Female |
| Production | 16 (64.0%) | 9 (36.0%) |
| Transportation | 28 (100.0%) | 0 (0.0%) |
| Material Moving | 22 (100.0%) | 0 (0.0%) |
| Total (Category) | 66 (88.0%) | 9 (12.0%) |
| Total (Overall) | 2,118 (51.6%) | 1,985 (48.4%) |
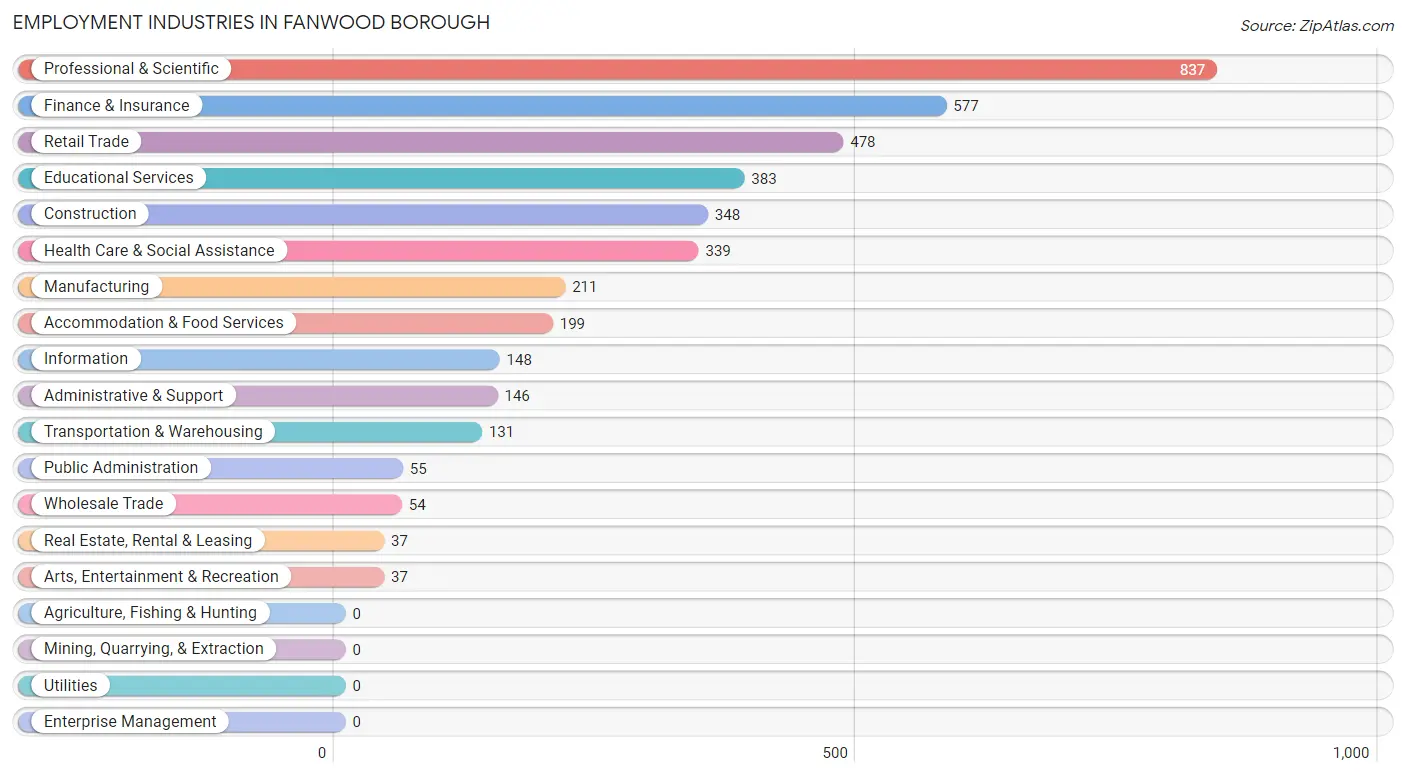
Employment Industries by Sex in Fanwood borough
Employment Industries in Fanwood borough
The major employment industries in Fanwood borough include Professional & Scientific (837 | 20.4%), Finance & Insurance (577 | 14.1%), Retail Trade (478 | 11.7%), Educational Services (383 | 9.3%), and Construction (348 | 8.5%).
Employment Industries by Sex in Fanwood borough
The Fanwood borough industries that see more men than women are Construction (100.0%), Transportation & Warehousing (84.0%), and Arts, Entertainment & Recreation (70.3%), whereas the industries that tend to have a higher number of women are Real Estate, Rental & Leasing (100.0%), Accommodation & Food Services (83.4%), and Health Care & Social Assistance (80.8%).
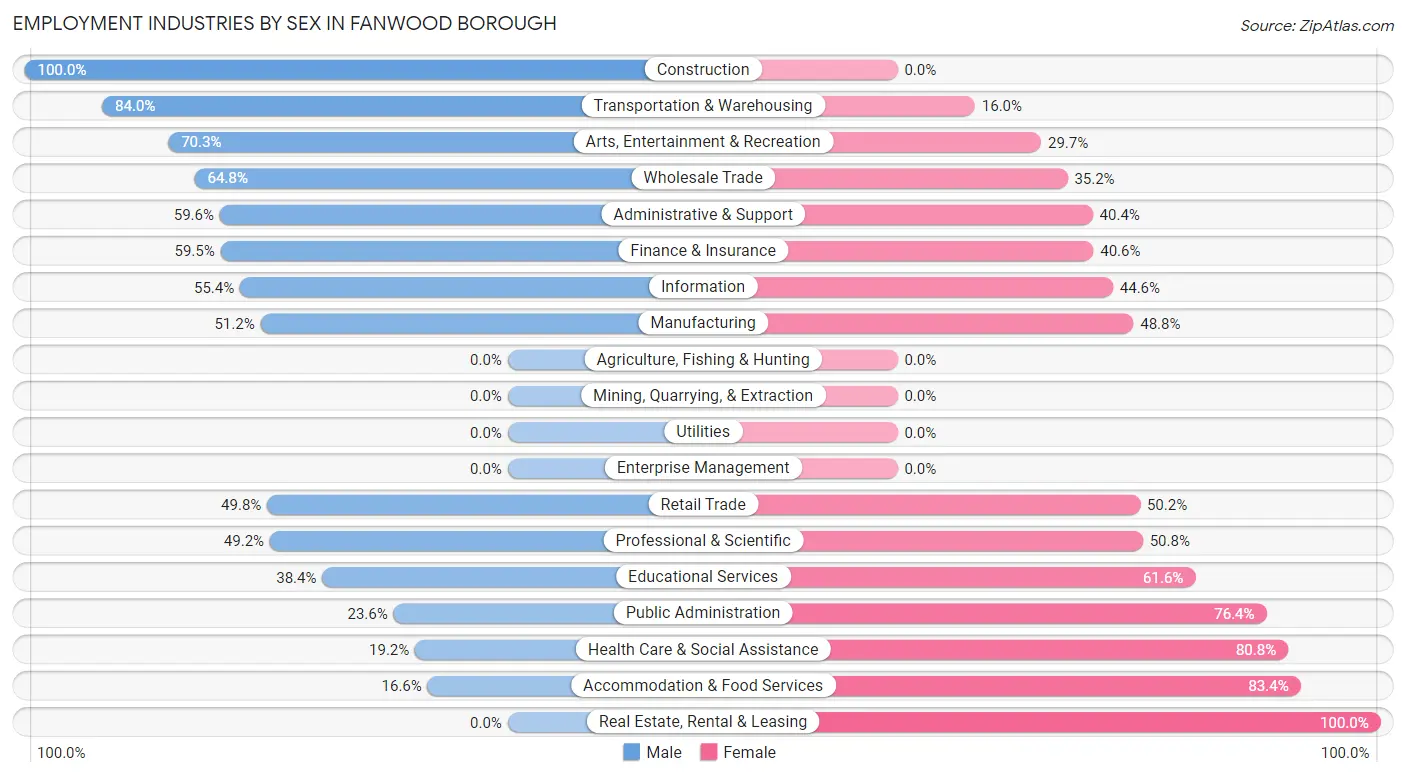
| Industry | Male | Female |
| Agriculture, Fishing & Hunting | 0 (0.0%) | 0 (0.0%) |
| Mining, Quarrying, & Extraction | 0 (0.0%) | 0 (0.0%) |
| Construction | 348 (100.0%) | 0 (0.0%) |
| Manufacturing | 108 (51.2%) | 103 (48.8%) |
| Wholesale Trade | 35 (64.8%) | 19 (35.2%) |
| Retail Trade | 238 (49.8%) | 240 (50.2%) |
| Transportation & Warehousing | 110 (84.0%) | 21 (16.0%) |
| Utilities | 0 (0.0%) | 0 (0.0%) |
| Information | 82 (55.4%) | 66 (44.6%) |
| Finance & Insurance | 343 (59.5%) | 234 (40.6%) |
| Real Estate, Rental & Leasing | 0 (0.0%) | 37 (100.0%) |
| Professional & Scientific | 412 (49.2%) | 425 (50.8%) |
| Enterprise Management | 0 (0.0%) | 0 (0.0%) |
| Administrative & Support | 87 (59.6%) | 59 (40.4%) |
| Educational Services | 147 (38.4%) | 236 (61.6%) |
| Health Care & Social Assistance | 65 (19.2%) | 274 (80.8%) |
| Arts, Entertainment & Recreation | 26 (70.3%) | 11 (29.7%) |
| Accommodation & Food Services | 33 (16.6%) | 166 (83.4%) |
| Public Administration | 13 (23.6%) | 42 (76.4%) |
| Total | 2,118 (51.6%) | 1,985 (48.4%) |
Education in Fanwood borough
School Enrollment in Fanwood borough
The most common levels of schooling among the 2,002 students in Fanwood borough are elementary school (514 | 25.7%), middle school (493 | 24.6%), and high school (410 | 20.5%).
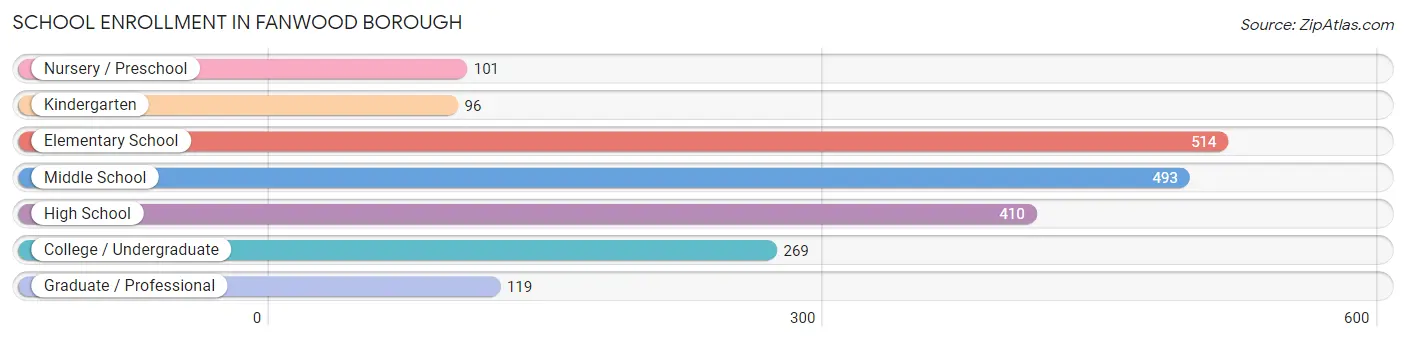
| School Level | # Students | % Students |
| Nursery / Preschool | 101 | 5.0% |
| Kindergarten | 96 | 4.8% |
| Elementary School | 514 | 25.7% |
| Middle School | 493 | 24.6% |
| High School | 410 | 20.5% |
| College / Undergraduate | 269 | 13.4% |
| Graduate / Professional | 119 | 5.9% |
| Total | 2,002 | 100.0% |
School Enrollment by Age by Funding Source in Fanwood borough
Out of a total of 2,002 students who are enrolled in schools in Fanwood borough, 160 (8.0%) attend a private institution, while the remaining 1,842 (92.0%) are enrolled in public schools. The age group of 3 to 4 year olds has the highest likelihood of being enrolled in private schools, with 33 (36.3% in the age bracket) enrolled. Conversely, the age group of 20 to 24 year olds has the lowest likelihood of being enrolled in a private school, with 172 (100.0% in the age bracket) attending a public institution.
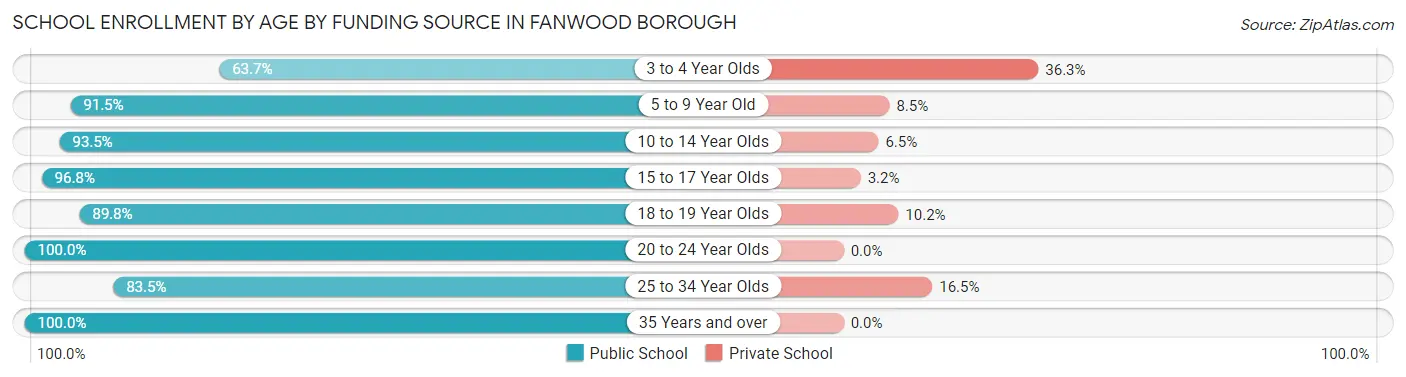
| Age Bracket | Public School | Private School |
| 3 to 4 Year Olds | 58 (63.7%) | 33 (36.3%) |
| 5 to 9 Year Old | 515 (91.5%) | 48 (8.5%) |
| 10 to 14 Year Olds | 533 (93.5%) | 37 (6.5%) |
| 15 to 17 Year Olds | 305 (96.8%) | 10 (3.2%) |
| 18 to 19 Year Olds | 132 (89.8%) | 15 (10.2%) |
| 20 to 24 Year Olds | 172 (100.0%) | 0 (0.0%) |
| 25 to 34 Year Olds | 91 (83.5%) | 18 (16.5%) |
| 35 Years and over | 35 (100.0%) | 0 (0.0%) |
| Total | 1,842 (92.0%) | 160 (8.0%) |
Educational Attainment by Field of Study in Fanwood borough
Business (948 | 22.2%), social sciences (682 | 16.0%), computers & mathematics (328 | 7.7%), psychology (300 | 7.0%), and engineering (269 | 6.3%) are the most common fields of study among 4,262 individuals in Fanwood borough who have obtained a bachelor's degree or higher.
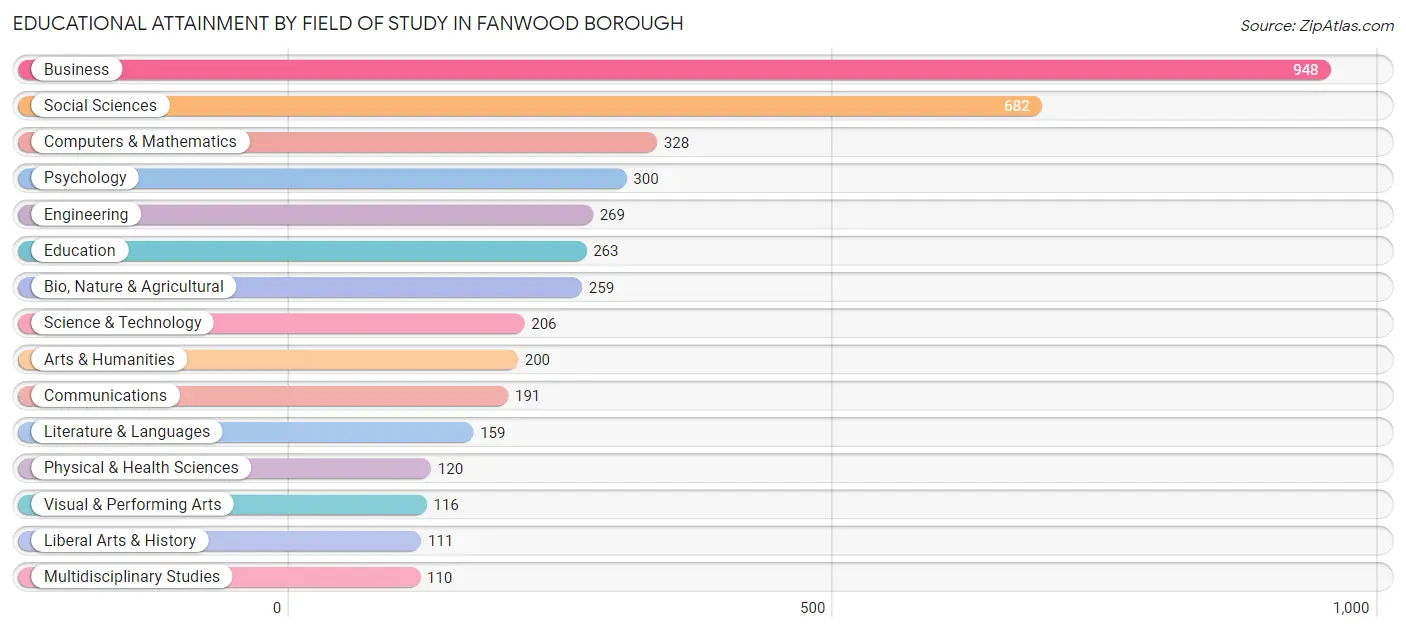
| Field of Study | # Graduates | % Graduates |
| Computers & Mathematics | 328 | 7.7% |
| Bio, Nature & Agricultural | 259 | 6.1% |
| Physical & Health Sciences | 120 | 2.8% |
| Psychology | 300 | 7.0% |
| Social Sciences | 682 | 16.0% |
| Engineering | 269 | 6.3% |
| Multidisciplinary Studies | 110 | 2.6% |
| Science & Technology | 206 | 4.8% |
| Business | 948 | 22.2% |
| Education | 263 | 6.2% |
| Literature & Languages | 159 | 3.7% |
| Liberal Arts & History | 111 | 2.6% |
| Visual & Performing Arts | 116 | 2.7% |
| Communications | 191 | 4.5% |
| Arts & Humanities | 200 | 4.7% |
| Total | 4,262 | 100.0% |
Transportation & Commute in Fanwood borough
Vehicle Availability by Sex in Fanwood borough
The most prevalent vehicle ownership categories in Fanwood borough are males with 2 vehicles (1,080, accounting for 51.0%) and females with 2 vehicles (1,020, making up 55.0%).
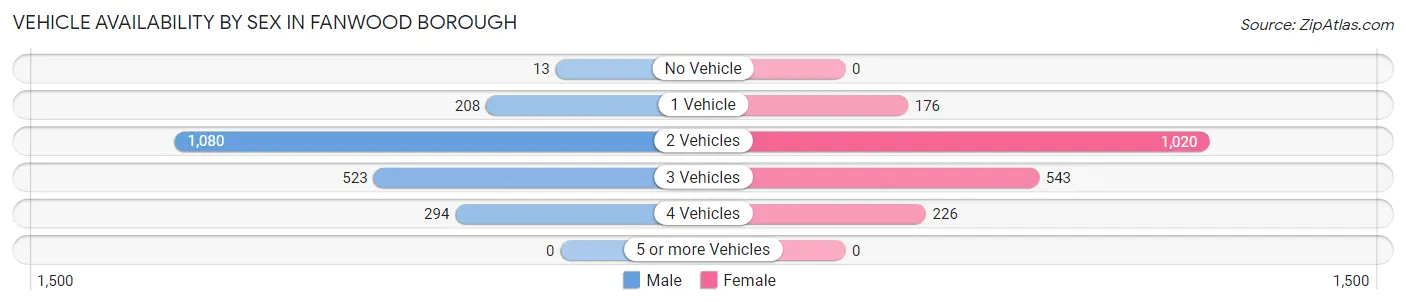
| Vehicles Available | Male | Female |
| No Vehicle | 13 (0.6%) | 0 (0.0%) |
| 1 Vehicle | 208 (9.8%) | 176 (9.0%) |
| 2 Vehicles | 1,080 (51.0%) | 1,020 (51.9%) |
| 3 Vehicles | 523 (24.7%) | 543 (27.6%) |
| 4 Vehicles | 294 (13.9%) | 226 (11.5%) |
| 5 or more Vehicles | 0 (0.0%) | 0 (0.0%) |
| Total | 2,118 (100.0%) | 1,965 (100.0%) |
Commute Time in Fanwood borough
The most frequently occuring commute durations in Fanwood borough are 90 or more minutes (469 commuters, 15.3%), 60 to 89 minutes (464 commuters, 15.1%), and 20 to 24 minutes (409 commuters, 13.3%).
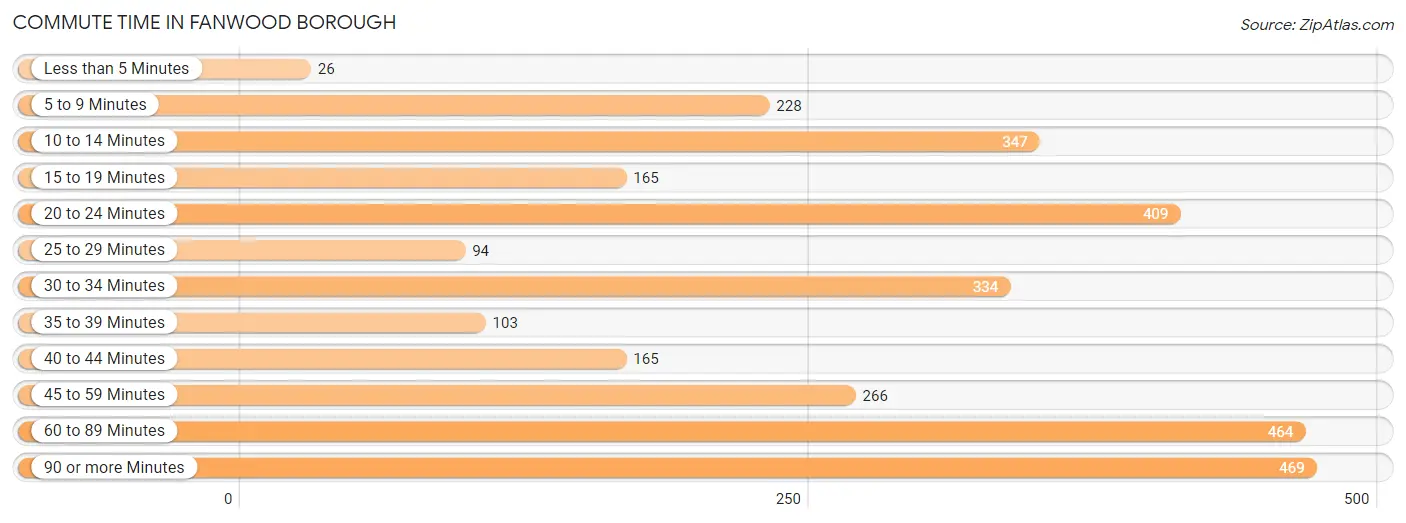
| Commute Time | # Commuters | % Commuters |
| Less than 5 Minutes | 26 | 0.9% |
| 5 to 9 Minutes | 228 | 7.4% |
| 10 to 14 Minutes | 347 | 11.3% |
| 15 to 19 Minutes | 165 | 5.4% |
| 20 to 24 Minutes | 409 | 13.3% |
| 25 to 29 Minutes | 94 | 3.1% |
| 30 to 34 Minutes | 334 | 10.9% |
| 35 to 39 Minutes | 103 | 3.4% |
| 40 to 44 Minutes | 165 | 5.4% |
| 45 to 59 Minutes | 266 | 8.7% |
| 60 to 89 Minutes | 464 | 15.1% |
| 90 or more Minutes | 469 | 15.3% |
Commute Time by Sex in Fanwood borough
The most common commute times in Fanwood borough are 90 or more minutes (379 commuters, 22.8%) for males and 20 to 24 minutes (260 commuters, 18.5%) for females.
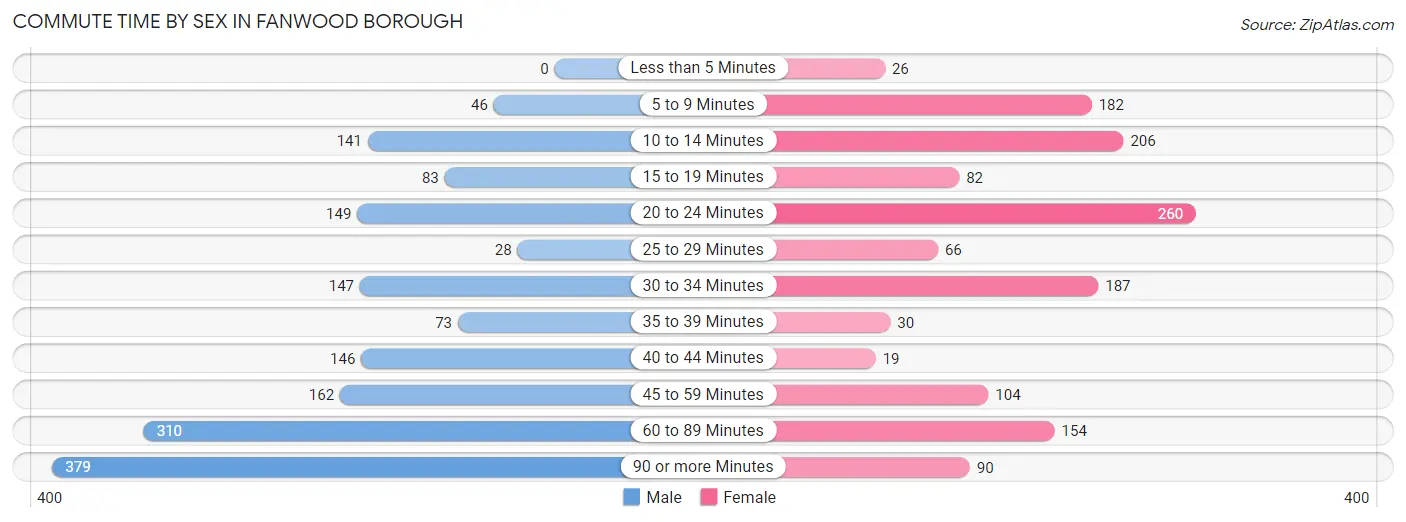
| Commute Time | Male | Female |
| Less than 5 Minutes | 0 (0.0%) | 26 (1.8%) |
| 5 to 9 Minutes | 46 (2.8%) | 182 (12.9%) |
| 10 to 14 Minutes | 141 (8.5%) | 206 (14.6%) |
| 15 to 19 Minutes | 83 (5.0%) | 82 (5.8%) |
| 20 to 24 Minutes | 149 (8.9%) | 260 (18.5%) |
| 25 to 29 Minutes | 28 (1.7%) | 66 (4.7%) |
| 30 to 34 Minutes | 147 (8.8%) | 187 (13.3%) |
| 35 to 39 Minutes | 73 (4.4%) | 30 (2.1%) |
| 40 to 44 Minutes | 146 (8.8%) | 19 (1.3%) |
| 45 to 59 Minutes | 162 (9.7%) | 104 (7.4%) |
| 60 to 89 Minutes | 310 (18.6%) | 154 (11.0%) |
| 90 or more Minutes | 379 (22.8%) | 90 (6.4%) |
Time of Departure to Work by Sex in Fanwood borough
The most frequent times of departure to work in Fanwood borough are 7:00 AM to 7:29 AM (694, 41.7%) for males and 8:00 AM to 8:29 AM (322, 22.9%) for females.
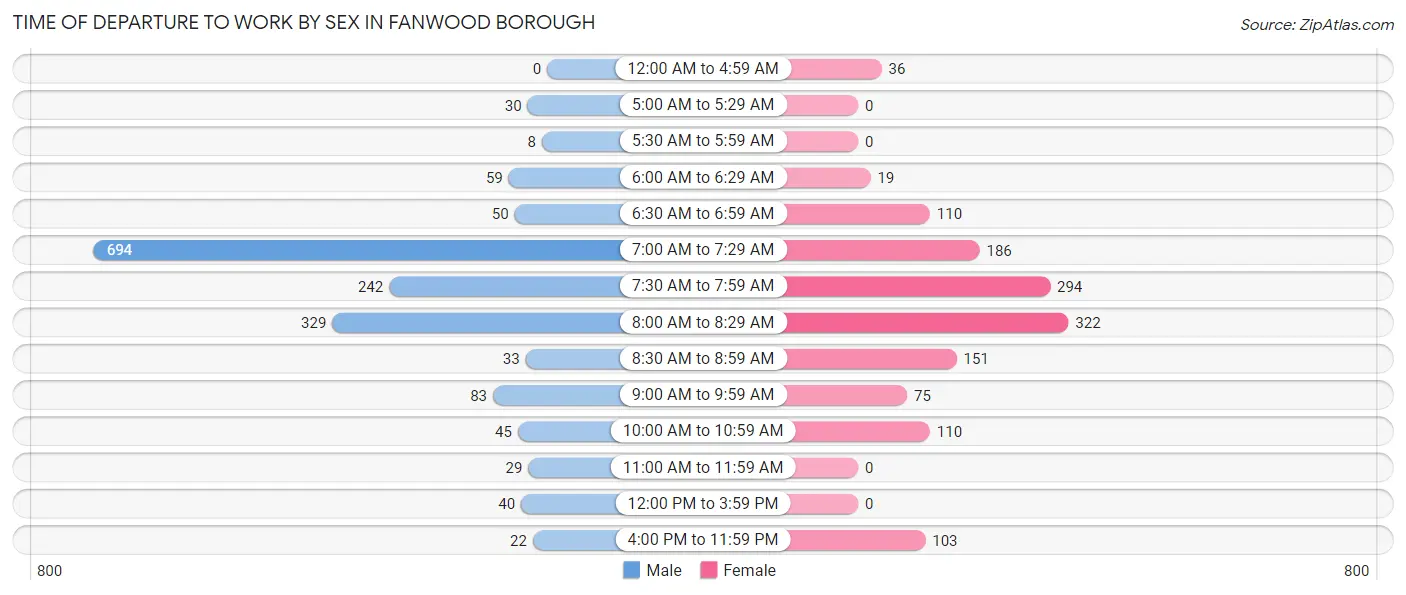
| Time of Departure | Male | Female |
| 12:00 AM to 4:59 AM | 0 (0.0%) | 36 (2.6%) |
| 5:00 AM to 5:29 AM | 30 (1.8%) | 0 (0.0%) |
| 5:30 AM to 5:59 AM | 8 (0.5%) | 0 (0.0%) |
| 6:00 AM to 6:29 AM | 59 (3.5%) | 19 (1.3%) |
| 6:30 AM to 6:59 AM | 50 (3.0%) | 110 (7.8%) |
| 7:00 AM to 7:29 AM | 694 (41.7%) | 186 (13.2%) |
| 7:30 AM to 7:59 AM | 242 (14.5%) | 294 (20.9%) |
| 8:00 AM to 8:29 AM | 329 (19.8%) | 322 (22.9%) |
| 8:30 AM to 8:59 AM | 33 (2.0%) | 151 (10.7%) |
| 9:00 AM to 9:59 AM | 83 (5.0%) | 75 (5.3%) |
| 10:00 AM to 10:59 AM | 45 (2.7%) | 110 (7.8%) |
| 11:00 AM to 11:59 AM | 29 (1.7%) | 0 (0.0%) |
| 12:00 PM to 3:59 PM | 40 (2.4%) | 0 (0.0%) |
| 4:00 PM to 11:59 PM | 22 (1.3%) | 103 (7.3%) |
| Total | 1,664 (100.0%) | 1,406 (100.0%) |
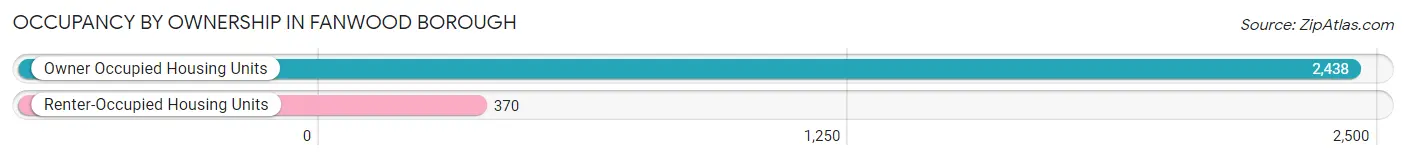
Housing Occupancy in Fanwood borough
Occupancy by Ownership in Fanwood borough
Of the total 2,808 dwellings in Fanwood borough, owner-occupied units account for 2,438 (86.8%), while renter-occupied units make up 370 (13.2%).
| Occupancy | # Housing Units | % Housing Units |
| Owner Occupied Housing Units | 2,438 | 86.8% |
| Renter-Occupied Housing Units | 370 | 13.2% |
| Total Occupied Housing Units | 2,808 | 100.0% |
Occupancy by Household Size in Fanwood borough
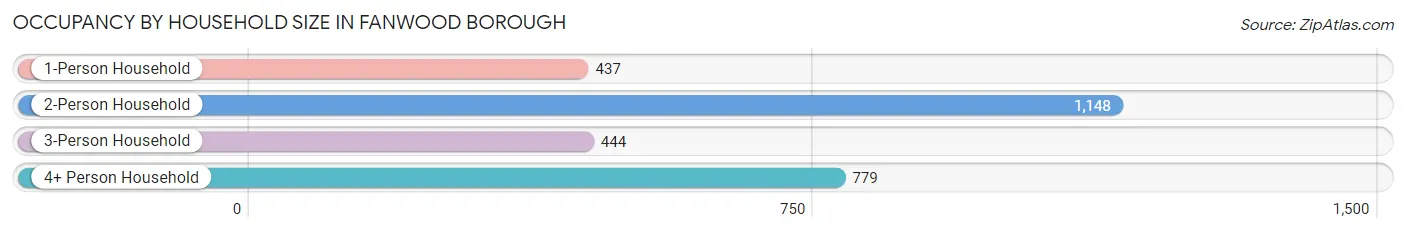
| Household Size | # Housing Units | % Housing Units |
| 1-Person Household | 437 | 15.6% |
| 2-Person Household | 1,148 | 40.9% |
| 3-Person Household | 444 | 15.8% |
| 4+ Person Household | 779 | 27.7% |
| Total Housing Units | 2,808 | 100.0% |
Occupancy by Ownership by Household Size in Fanwood borough
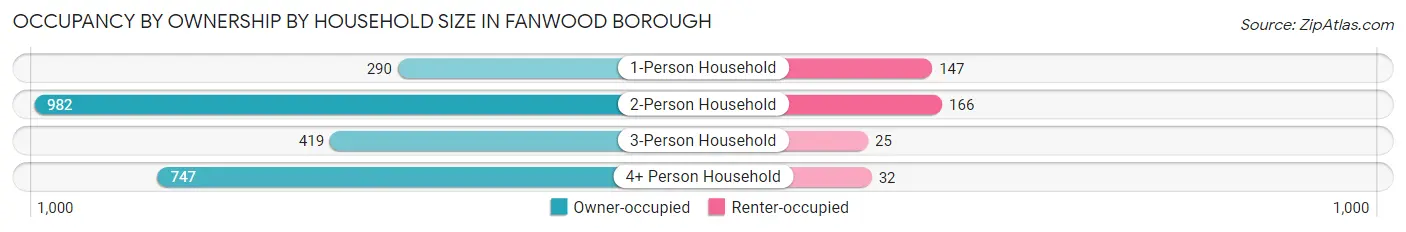
| Household Size | Owner-occupied | Renter-occupied |
| 1-Person Household | 290 (66.4%) | 147 (33.6%) |
| 2-Person Household | 982 (85.5%) | 166 (14.5%) |
| 3-Person Household | 419 (94.4%) | 25 (5.6%) |
| 4+ Person Household | 747 (95.9%) | 32 (4.1%) |
| Total Housing Units | 2,438 (86.8%) | 370 (13.2%) |
Occupancy by Educational Attainment in Fanwood borough
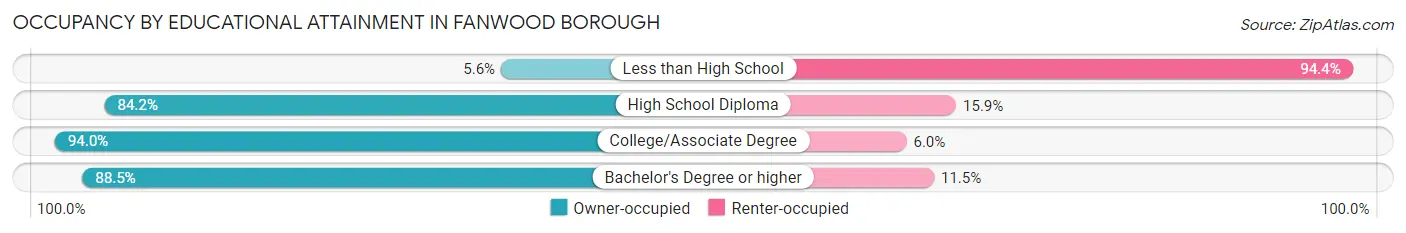
| Household Size | Owner-occupied | Renter-occupied |
| Less than High School | 4 (5.6%) | 68 (94.4%) |
| High School Diploma | 207 (84.2%) | 39 (15.9%) |
| College/Associate Degree | 390 (94.0%) | 25 (6.0%) |
| Bachelor's Degree or higher | 1,837 (88.5%) | 238 (11.5%) |
Occupancy by Age of Householder in Fanwood borough
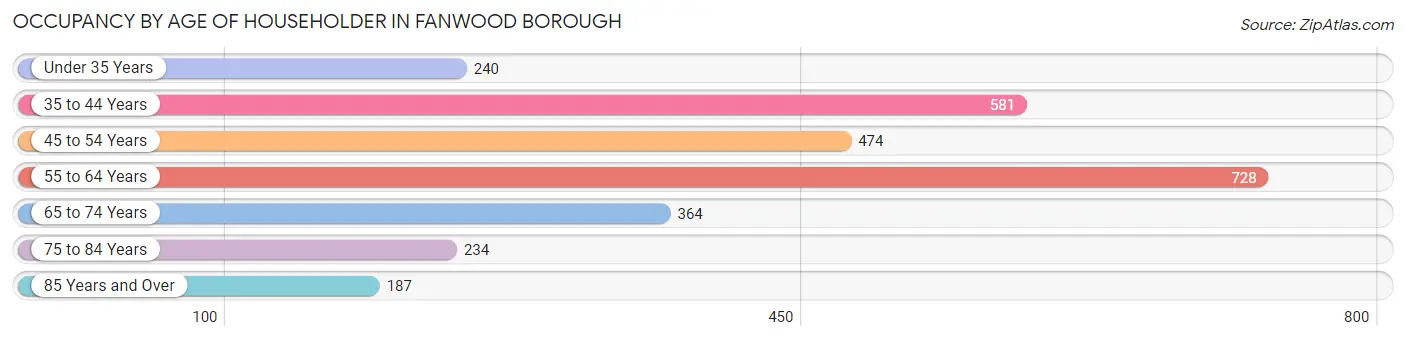
| Age Bracket | # Households | % Households |
| Under 35 Years | 240 | 8.6% |
| 35 to 44 Years | 581 | 20.7% |
| 45 to 54 Years | 474 | 16.9% |
| 55 to 64 Years | 728 | 25.9% |
| 65 to 74 Years | 364 | 13.0% |
| 75 to 84 Years | 234 | 8.3% |
| 85 Years and Over | 187 | 6.7% |
| Total | 2,808 | 100.0% |
Housing Finances in Fanwood borough
Median Income by Occupancy in Fanwood borough
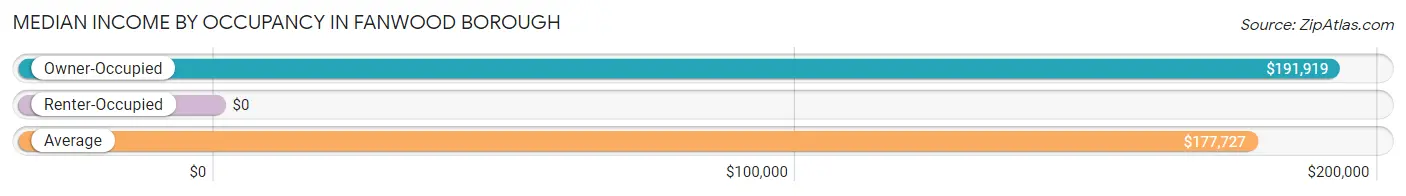
| Occupancy Type | # Households | Median Income |
| Owner-Occupied | 2,438 (86.8%) | $191,919 |
| Renter-Occupied | 370 (13.2%) | $0 |
| Average | 2,808 (100.0%) | $177,727 |
Occupancy by Householder Income Bracket in Fanwood borough
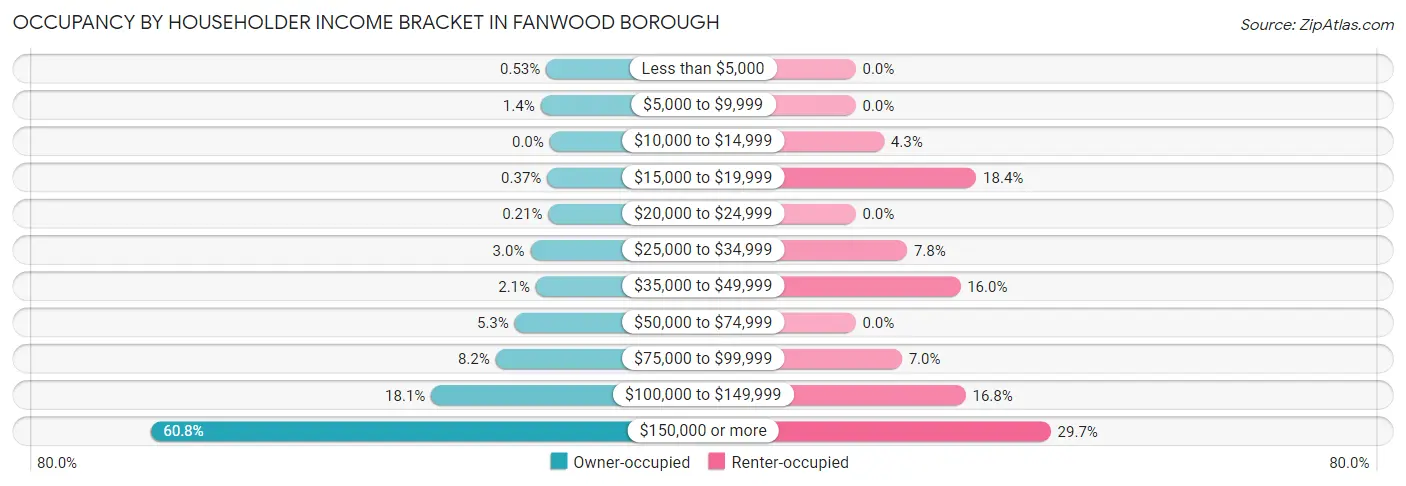
| Income Bracket | Owner-occupied | Renter-occupied |
| Less than $5,000 | 13 (0.5%) | 0 (0.0%) |
| $5,000 to $9,999 | 34 (1.4%) | 0 (0.0%) |
| $10,000 to $14,999 | 0 (0.0%) | 16 (4.3%) |
| $15,000 to $19,999 | 9 (0.4%) | 68 (18.4%) |
| $20,000 to $24,999 | 5 (0.2%) | 0 (0.0%) |
| $25,000 to $34,999 | 72 (2.9%) | 29 (7.8%) |
| $35,000 to $49,999 | 51 (2.1%) | 59 (16.0%) |
| $50,000 to $74,999 | 130 (5.3%) | 0 (0.0%) |
| $75,000 to $99,999 | 201 (8.2%) | 26 (7.0%) |
| $100,000 to $149,999 | 440 (18.0%) | 62 (16.8%) |
| $150,000 or more | 1,483 (60.8%) | 110 (29.7%) |
| Total | 2,438 (100.0%) | 370 (100.0%) |
Monthly Housing Cost Tiers in Fanwood borough
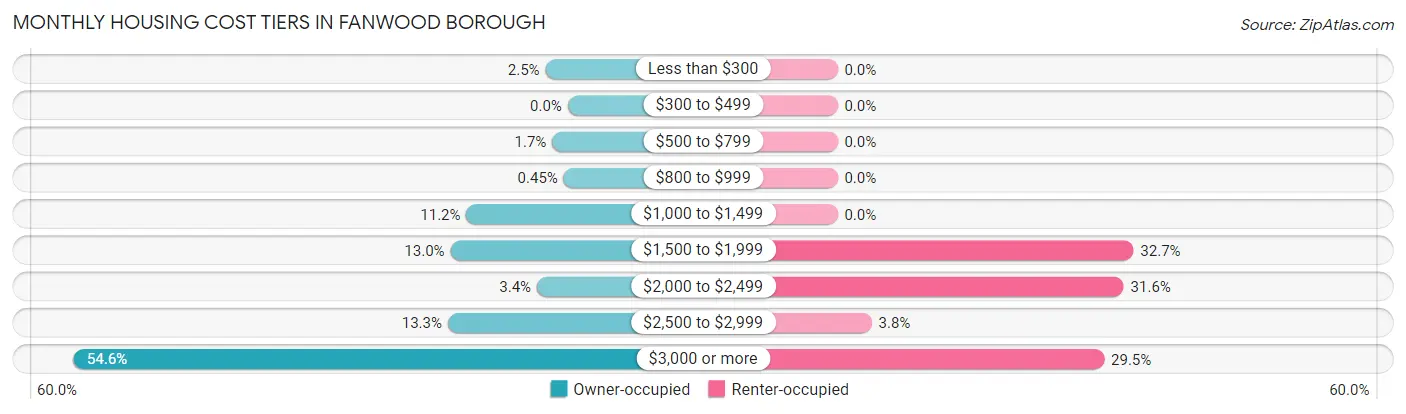
| Monthly Cost | Owner-occupied | Renter-occupied |
| Less than $300 | 60 (2.5%) | 0 (0.0%) |
| $300 to $499 | 0 (0.0%) | 0 (0.0%) |
| $500 to $799 | 42 (1.7%) | 0 (0.0%) |
| $800 to $999 | 11 (0.4%) | 0 (0.0%) |
| $1,000 to $1,499 | 273 (11.2%) | 0 (0.0%) |
| $1,500 to $1,999 | 316 (13.0%) | 121 (32.7%) |
| $2,000 to $2,499 | 83 (3.4%) | 117 (31.6%) |
| $2,500 to $2,999 | 323 (13.3%) | 14 (3.8%) |
| $3,000 or more | 1,330 (54.5%) | 109 (29.5%) |
| Total | 2,438 (100.0%) | 370 (100.0%) |
Physical Housing Characteristics in Fanwood borough
Housing Structures in Fanwood borough
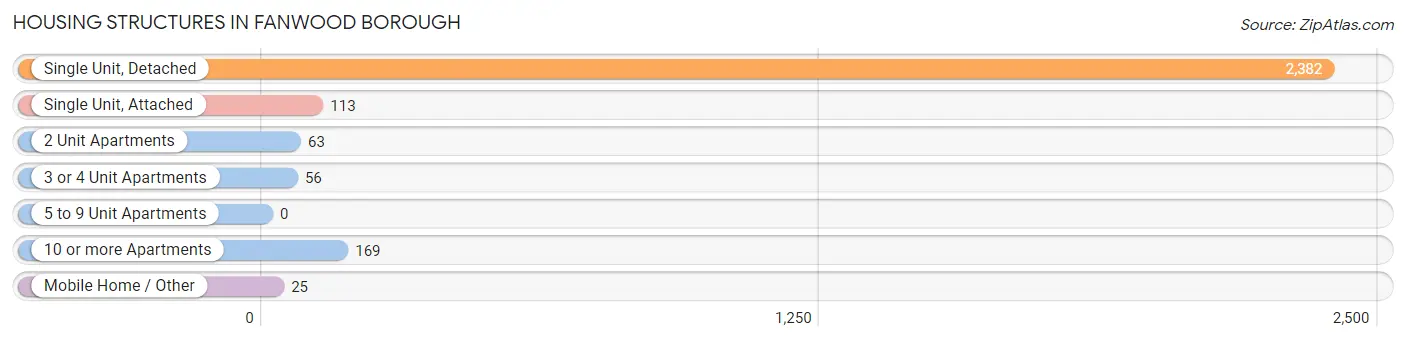
| Structure Type | # Housing Units | % Housing Units |
| Single Unit, Detached | 2,382 | 84.8% |
| Single Unit, Attached | 113 | 4.0% |
| 2 Unit Apartments | 63 | 2.2% |
| 3 or 4 Unit Apartments | 56 | 2.0% |
| 5 to 9 Unit Apartments | 0 | 0.0% |
| 10 or more Apartments | 169 | 6.0% |
| Mobile Home / Other | 25 | 0.9% |
| Total | 2,808 | 100.0% |
Housing Structures by Occupancy in Fanwood borough
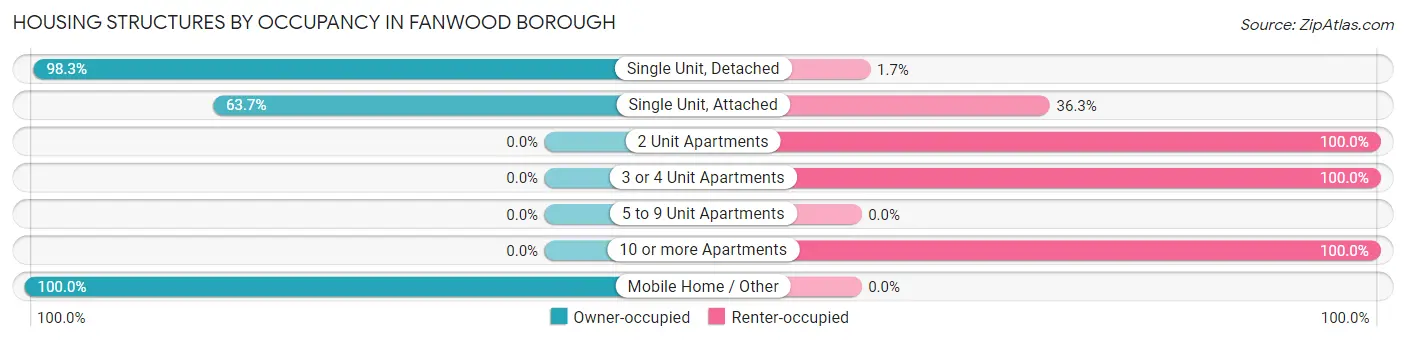
| Structure Type | Owner-occupied | Renter-occupied |
| Single Unit, Detached | 2,341 (98.3%) | 41 (1.7%) |
| Single Unit, Attached | 72 (63.7%) | 41 (36.3%) |
| 2 Unit Apartments | 0 (0.0%) | 63 (100.0%) |
| 3 or 4 Unit Apartments | 0 (0.0%) | 56 (100.0%) |
| 5 to 9 Unit Apartments | 0 (0.0%) | 0 (0.0%) |
| 10 or more Apartments | 0 (0.0%) | 169 (100.0%) |
| Mobile Home / Other | 25 (100.0%) | 0 (0.0%) |
| Total | 2,438 (86.8%) | 370 (13.2%) |
Housing Structures by Number of Rooms in Fanwood borough
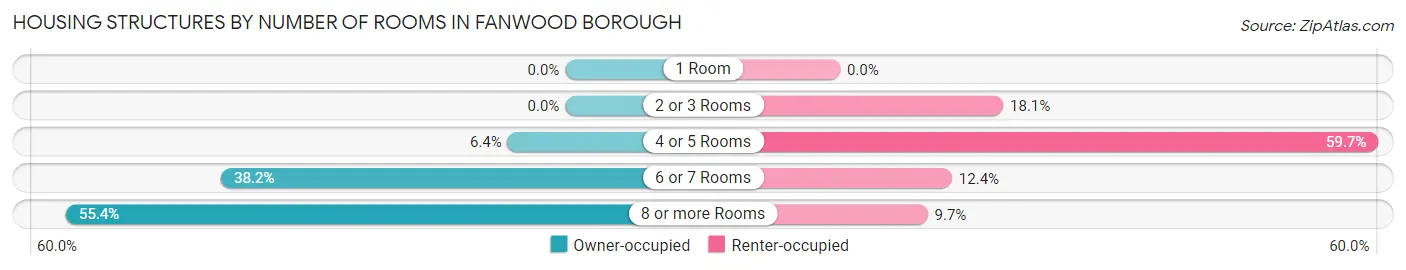
| Number of Rooms | Owner-occupied | Renter-occupied |
| 1 Room | 0 (0.0%) | 0 (0.0%) |
| 2 or 3 Rooms | 0 (0.0%) | 67 (18.1%) |
| 4 or 5 Rooms | 156 (6.4%) | 221 (59.7%) |
| 6 or 7 Rooms | 931 (38.2%) | 46 (12.4%) |
| 8 or more Rooms | 1,351 (55.4%) | 36 (9.7%) |
| Total | 2,438 (100.0%) | 370 (100.0%) |
Housing Structure by Heating Type in Fanwood borough
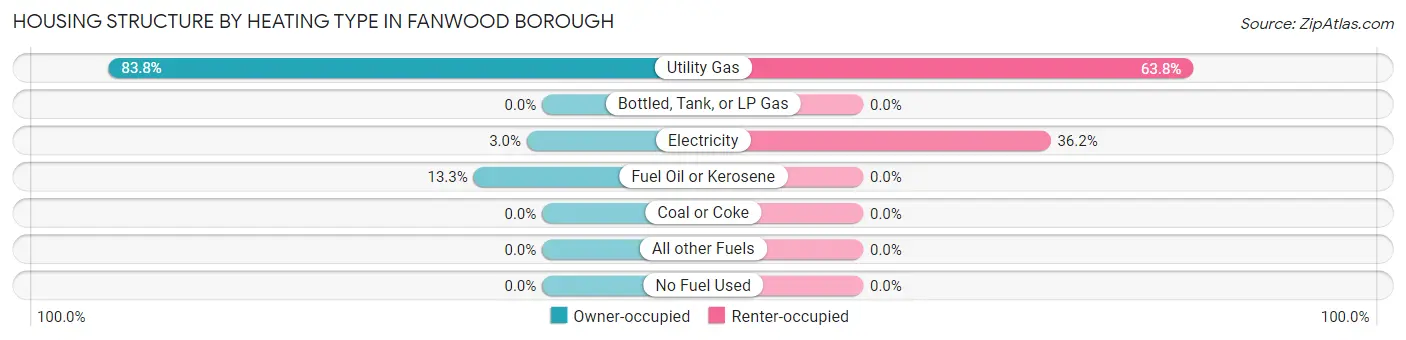
| Heating Type | Owner-occupied | Renter-occupied |
| Utility Gas | 2,043 (83.8%) | 236 (63.8%) |
| Bottled, Tank, or LP Gas | 0 (0.0%) | 0 (0.0%) |
| Electricity | 72 (2.9%) | 134 (36.2%) |
| Fuel Oil or Kerosene | 323 (13.3%) | 0 (0.0%) |
| Coal or Coke | 0 (0.0%) | 0 (0.0%) |
| All other Fuels | 0 (0.0%) | 0 (0.0%) |
| No Fuel Used | 0 (0.0%) | 0 (0.0%) |
| Total | 2,438 (100.0%) | 370 (100.0%) |
Household Vehicle Usage in Fanwood borough
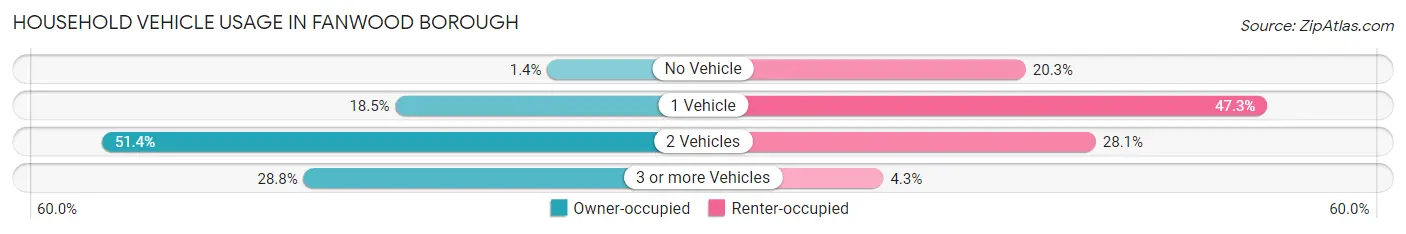
| Vehicles per Household | Owner-occupied | Renter-occupied |
| No Vehicle | 35 (1.4%) | 75 (20.3%) |
| 1 Vehicle | 450 (18.5%) | 175 (47.3%) |
| 2 Vehicles | 1,252 (51.3%) | 104 (28.1%) |
| 3 or more Vehicles | 701 (28.7%) | 16 (4.3%) |
| Total | 2,438 (100.0%) | 370 (100.0%) |
Real Estate & Mortgages in Fanwood borough
Real Estate and Mortgage Overview in Fanwood borough
| Characteristic | Without Mortgage | With Mortgage |
| Housing Units | 613 | 1,825 |
| Median Property Value | $542,700 | $607,100 |
| Median Household Income | $113,875 | $1,294 |
| Monthly Housing Costs | $1,441 | $1,322 |
| Real Estate Taxes | $10,001 | $25 |
Property Value by Mortgage Status in Fanwood borough
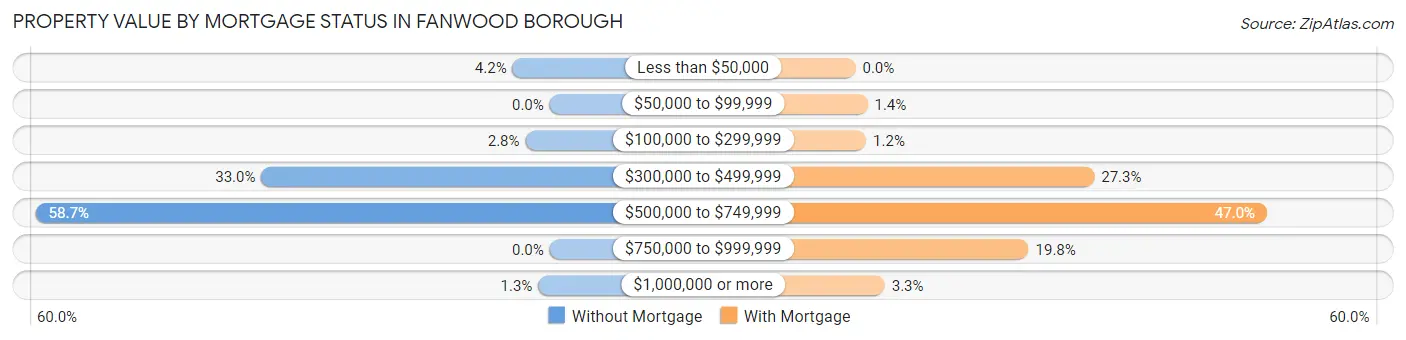
| Property Value | Without Mortgage | With Mortgage |
| Less than $50,000 | 26 (4.2%) | 0 (0.0%) |
| $50,000 to $99,999 | 0 (0.0%) | 25 (1.4%) |
| $100,000 to $299,999 | 17 (2.8%) | 22 (1.2%) |
| $300,000 to $499,999 | 202 (33.0%) | 498 (27.3%) |
| $500,000 to $749,999 | 360 (58.7%) | 858 (47.0%) |
| $750,000 to $999,999 | 0 (0.0%) | 361 (19.8%) |
| $1,000,000 or more | 8 (1.3%) | 61 (3.3%) |
| Total | 613 (100.0%) | 1,825 (100.0%) |
Household Income by Mortgage Status in Fanwood borough
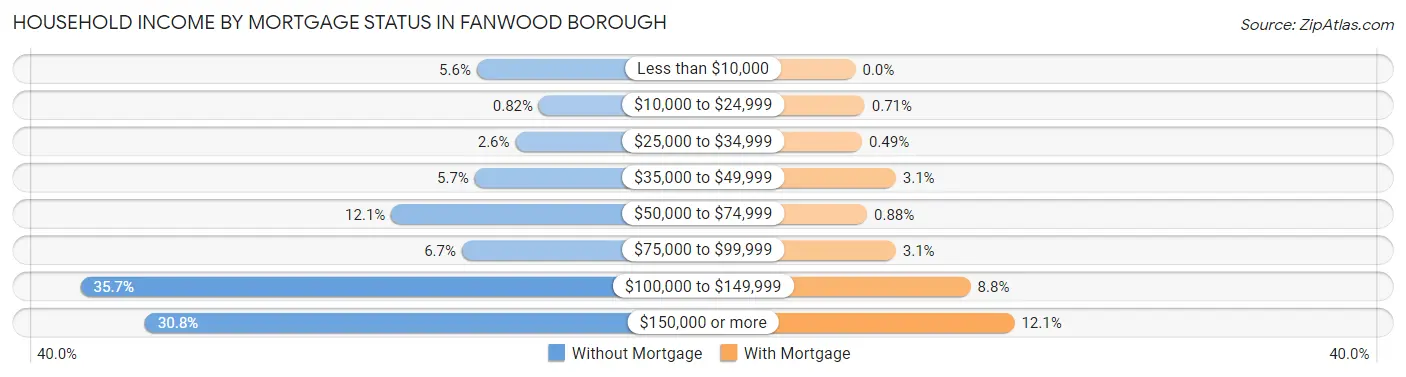
| Household Income | Without Mortgage | With Mortgage |
| Less than $10,000 | 34 (5.6%) | 0 (0.0%) |
| $10,000 to $24,999 | 5 (0.8%) | 13 (0.7%) |
| $25,000 to $34,999 | 16 (2.6%) | 9 (0.5%) |
| $35,000 to $49,999 | 35 (5.7%) | 56 (3.1%) |
| $50,000 to $74,999 | 74 (12.1%) | 16 (0.9%) |
| $75,000 to $99,999 | 41 (6.7%) | 56 (3.1%) |
| $100,000 to $149,999 | 219 (35.7%) | 160 (8.8%) |
| $150,000 or more | 189 (30.8%) | 221 (12.1%) |
| Total | 613 (100.0%) | 1,825 (100.0%) |
Property Value to Household Income Ratio in Fanwood borough
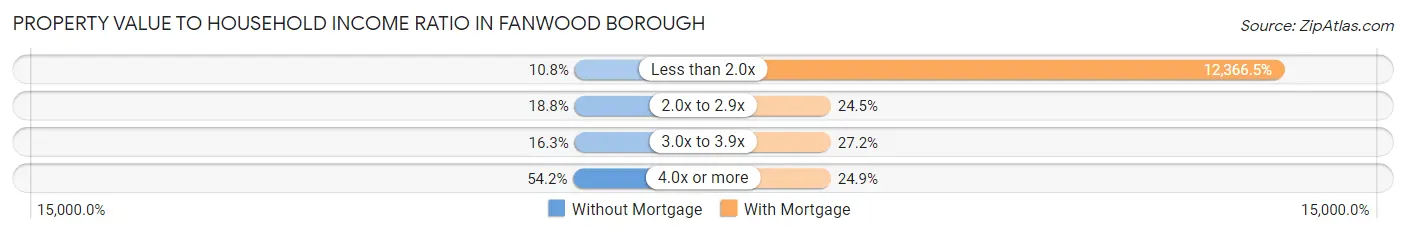
| Value-to-Income Ratio | Without Mortgage | With Mortgage |
| Less than 2.0x | 66 (10.8%) | 225,688 (12,366.5%) |
| 2.0x to 2.9x | 115 (18.8%) | 447 (24.5%) |
| 3.0x to 3.9x | 100 (16.3%) | 497 (27.2%) |
| 4.0x or more | 332 (54.2%) | 454 (24.9%) |
| Total | 613 (100.0%) | 1,825 (100.0%) |
Real Estate Taxes by Mortgage Status in Fanwood borough
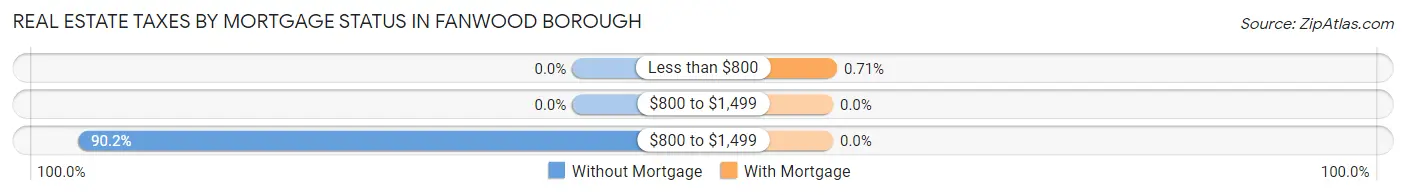
| Property Taxes | Without Mortgage | With Mortgage |
| Less than $800 | 0 (0.0%) | 13 (0.7%) |
| $800 to $1,499 | 0 (0.0%) | 0 (0.0%) |
| $800 to $1,499 | 553 (90.2%) | 0 (0.0%) |
| Total | 613 (100.0%) | 1,825 (100.0%) |
Health & Disability in Fanwood borough
Health Insurance Coverage by Age in Fanwood borough
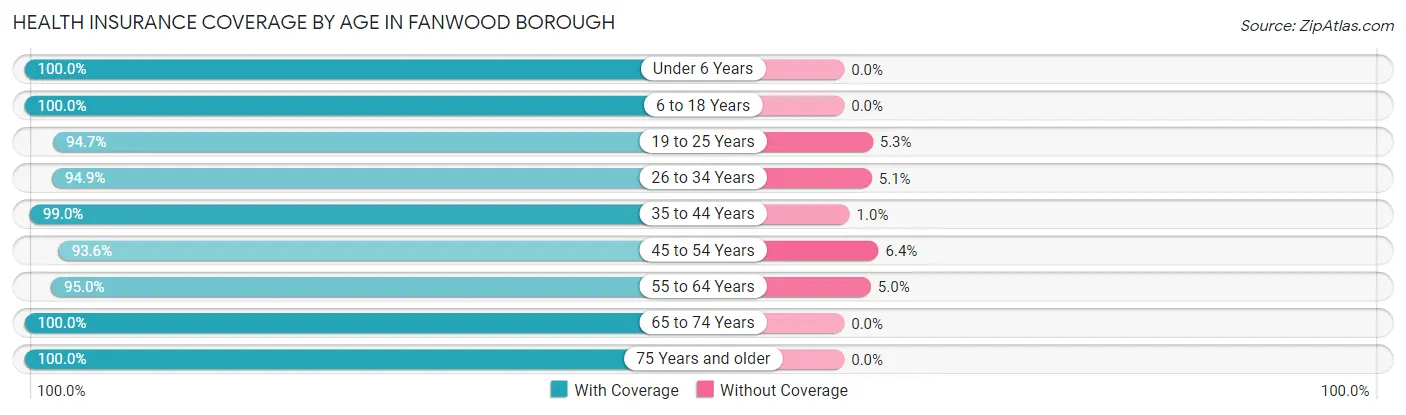
| Age Bracket | With Coverage | Without Coverage |
| Under 6 Years | 435 (100.0%) | 0 (0.0%) |
| 6 to 18 Years | 1,480 (100.0%) | 0 (0.0%) |
| 19 to 25 Years | 428 (94.7%) | 24 (5.3%) |
| 26 to 34 Years | 535 (94.9%) | 29 (5.1%) |
| 35 to 44 Years | 1,091 (99.0%) | 11 (1.0%) |
| 45 to 54 Years | 952 (93.6%) | 65 (6.4%) |
| 55 to 64 Years | 1,303 (95.0%) | 68 (5.0%) |
| 65 to 74 Years | 655 (100.0%) | 0 (0.0%) |
| 75 Years and older | 571 (100.0%) | 0 (0.0%) |
| Total | 7,450 (97.4%) | 197 (2.6%) |
Health Insurance Coverage by Citizenship Status in Fanwood borough
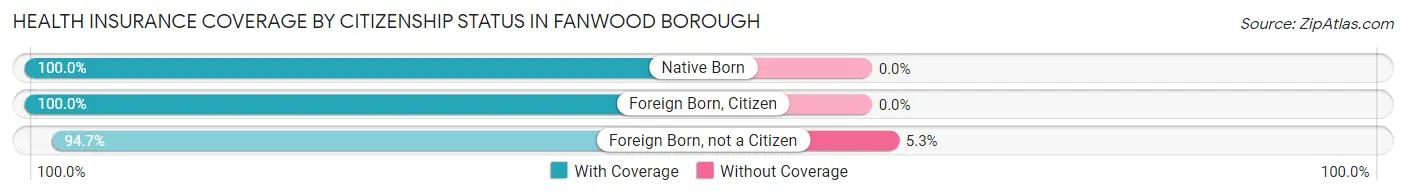
| Citizenship Status | With Coverage | Without Coverage |
| Native Born | 435 (100.0%) | 0 (0.0%) |
| Foreign Born, Citizen | 1,480 (100.0%) | 0 (0.0%) |
| Foreign Born, not a Citizen | 428 (94.7%) | 24 (5.3%) |
Health Insurance Coverage by Household Income in Fanwood borough
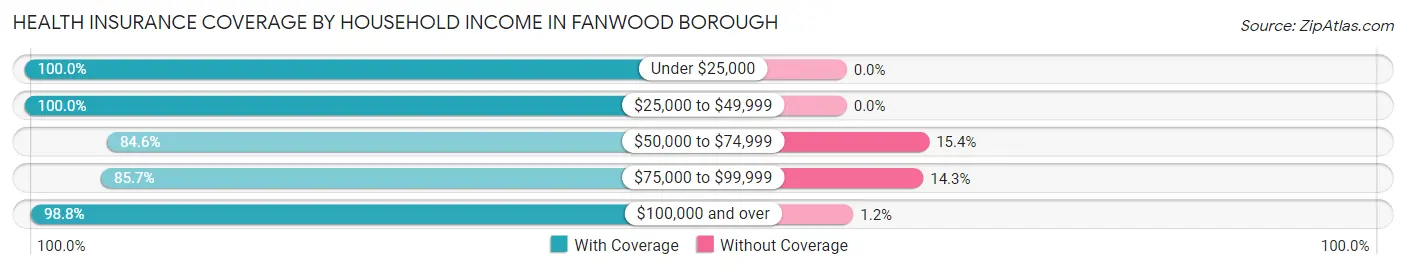
| Household Income | With Coverage | Without Coverage |
| Under $25,000 | 175 (100.0%) | 0 (0.0%) |
| $25,000 to $49,999 | 332 (100.0%) | 0 (0.0%) |
| $50,000 to $74,999 | 252 (84.6%) | 46 (15.4%) |
| $75,000 to $99,999 | 436 (85.7%) | 73 (14.3%) |
| $100,000 and over | 6,250 (98.8%) | 78 (1.2%) |
Public vs Private Health Insurance Coverage by Age in Fanwood borough
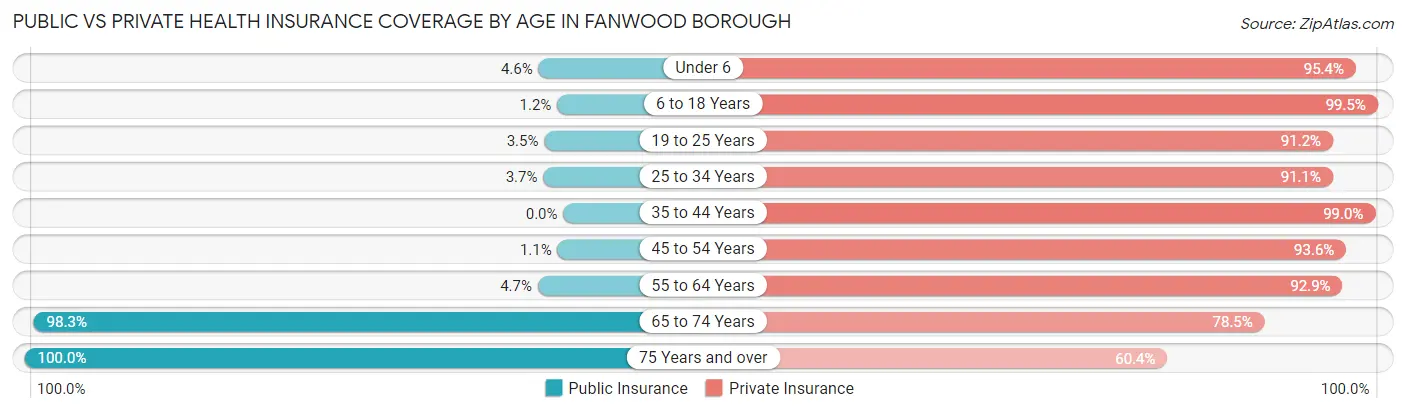
| Age Bracket | Public Insurance | Private Insurance |
| Under 6 | 20 (4.6%) | 415 (95.4%) |
| 6 to 18 Years | 17 (1.1%) | 1,472 (99.5%) |
| 19 to 25 Years | 16 (3.5%) | 412 (91.1%) |
| 25 to 34 Years | 21 (3.7%) | 514 (91.1%) |
| 35 to 44 Years | 0 (0.0%) | 1,091 (99.0%) |
| 45 to 54 Years | 11 (1.1%) | 952 (93.6%) |
| 55 to 64 Years | 65 (4.7%) | 1,274 (92.9%) |
| 65 to 74 Years | 644 (98.3%) | 514 (78.5%) |
| 75 Years and over | 571 (100.0%) | 345 (60.4%) |
| Total | 1,365 (17.8%) | 6,989 (91.4%) |
Disability Status by Sex by Age in Fanwood borough
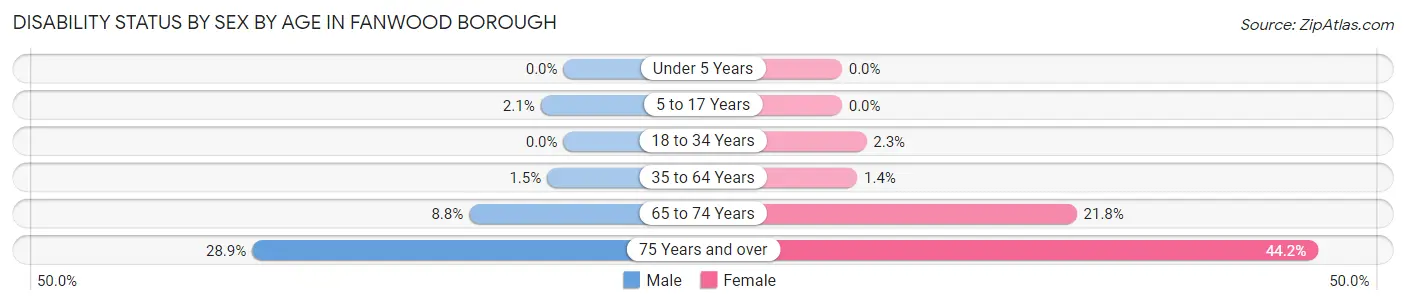
| Age Bracket | Male | Female |
| Under 5 Years | 0 (0.0%) | 0 (0.0%) |
| 5 to 17 Years | 14 (2.1%) | 0 (0.0%) |
| 18 to 34 Years | 0 (0.0%) | 15 (2.3%) |
| 35 to 64 Years | 26 (1.5%) | 25 (1.4%) |
| 65 to 74 Years | 30 (8.7%) | 68 (21.8%) |
| 75 Years and over | 78 (28.9%) | 133 (44.2%) |
Disability Class by Sex by Age in Fanwood borough
Disability Class: Hearing Difficulty
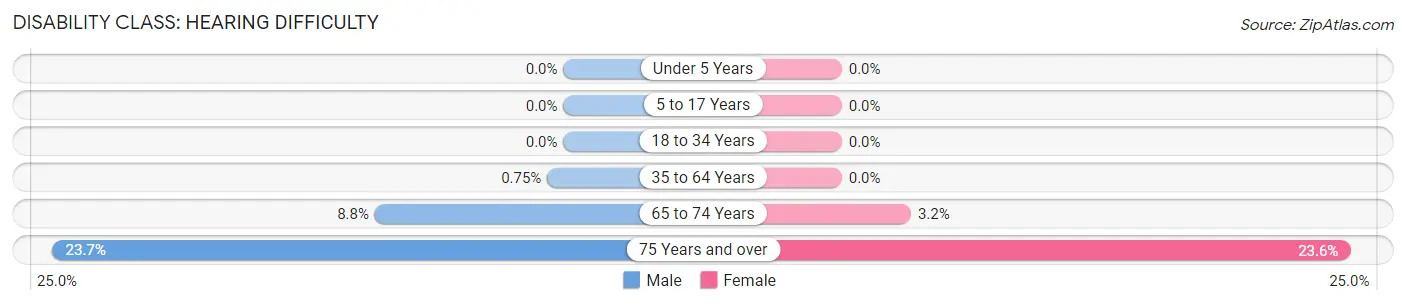
| Age Bracket | Male | Female |
| Under 5 Years | 0 (0.0%) | 0 (0.0%) |
| 5 to 17 Years | 0 (0.0%) | 0 (0.0%) |
| 18 to 34 Years | 0 (0.0%) | 0 (0.0%) |
| 35 to 64 Years | 13 (0.7%) | 0 (0.0%) |
| 65 to 74 Years | 30 (8.7%) | 10 (3.2%) |
| 75 Years and over | 64 (23.7%) | 71 (23.6%) |
Disability Class: Vision Difficulty
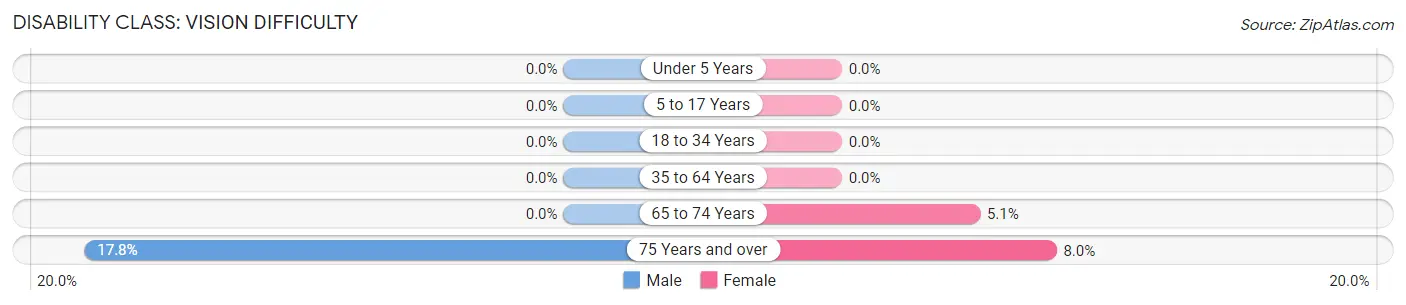
| Age Bracket | Male | Female |
| Under 5 Years | 0 (0.0%) | 0 (0.0%) |
| 5 to 17 Years | 0 (0.0%) | 0 (0.0%) |
| 18 to 34 Years | 0 (0.0%) | 0 (0.0%) |
| 35 to 64 Years | 0 (0.0%) | 0 (0.0%) |
| 65 to 74 Years | 0 (0.0%) | 16 (5.1%) |
| 75 Years and over | 48 (17.8%) | 24 (8.0%) |
Disability Class: Cognitive Difficulty
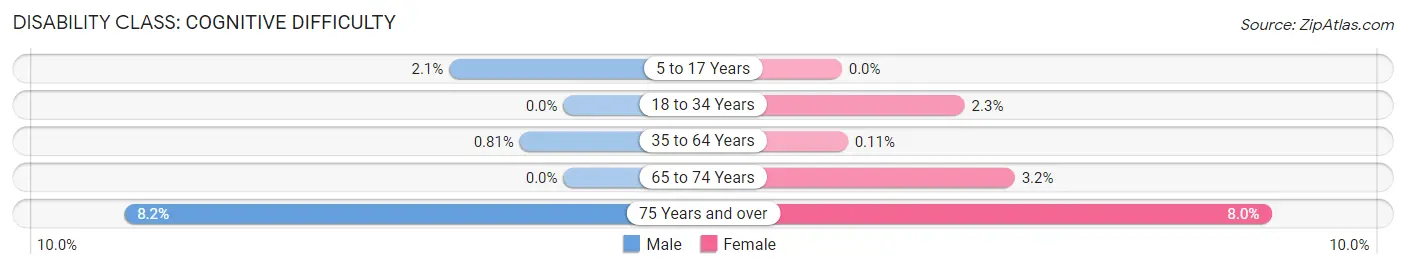
| Age Bracket | Male | Female |
| 5 to 17 Years | 14 (2.1%) | 0 (0.0%) |
| 18 to 34 Years | 0 (0.0%) | 15 (2.3%) |
| 35 to 64 Years | 14 (0.8%) | 2 (0.1%) |
| 65 to 74 Years | 0 (0.0%) | 10 (3.2%) |
| 75 Years and over | 22 (8.2%) | 24 (8.0%) |
Disability Class: Ambulatory Difficulty
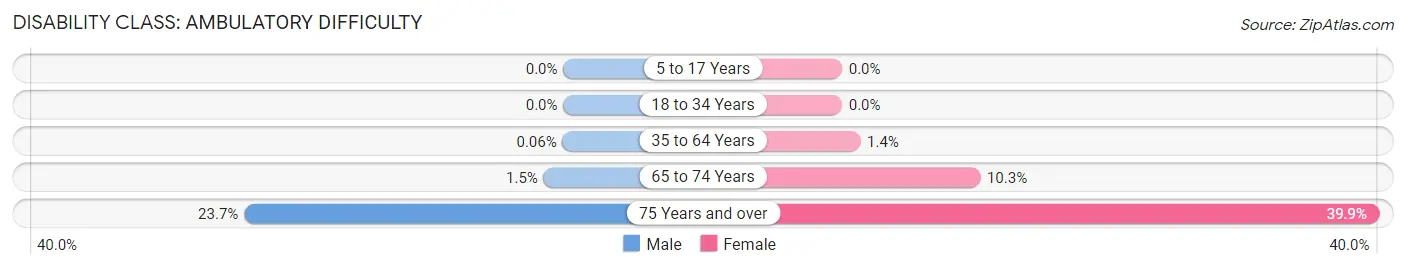
| Age Bracket | Male | Female |
| 5 to 17 Years | 0 (0.0%) | 0 (0.0%) |
| 18 to 34 Years | 0 (0.0%) | 0 (0.0%) |
| 35 to 64 Years | 1 (0.1%) | 24 (1.4%) |
| 65 to 74 Years | 5 (1.5%) | 32 (10.3%) |
| 75 Years and over | 64 (23.7%) | 120 (39.9%) |
Disability Class: Self-Care Difficulty
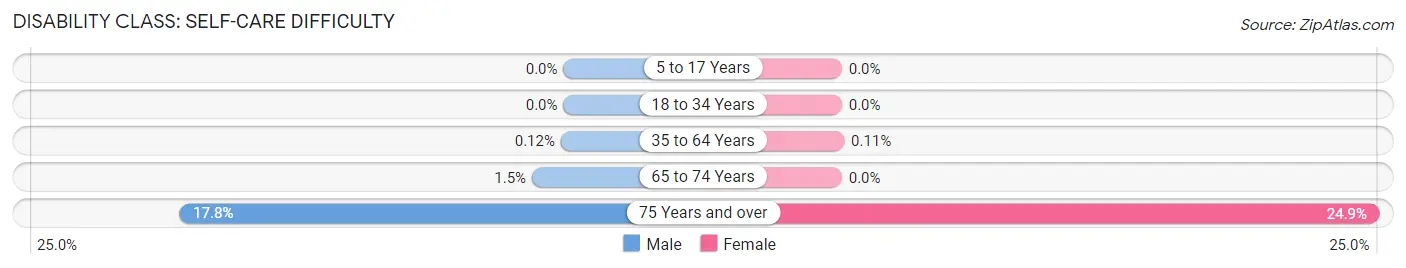
| Age Bracket | Male | Female |
| 5 to 17 Years | 0 (0.0%) | 0 (0.0%) |
| 18 to 34 Years | 0 (0.0%) | 0 (0.0%) |
| 35 to 64 Years | 2 (0.1%) | 2 (0.1%) |
| 65 to 74 Years | 5 (1.5%) | 0 (0.0%) |
| 75 Years and over | 48 (17.8%) | 75 (24.9%) |
Technology Access in Fanwood borough
Computing Device Access in Fanwood borough
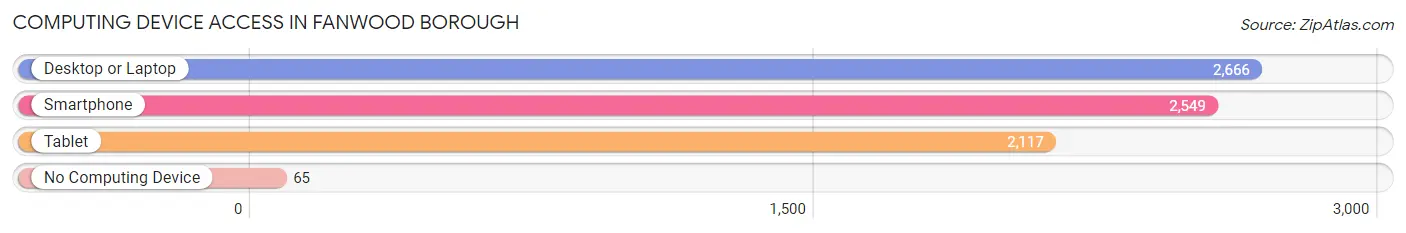
| Device Type | # Households | % Households |
| Desktop or Laptop | 2,666 | 94.9% |
| Smartphone | 2,549 | 90.8% |
| Tablet | 2,117 | 75.4% |
| No Computing Device | 65 | 2.3% |
| Total | 2,808 | 100.0% |
Internet Access in Fanwood borough

| Internet Type | # Households | % Households |
| Dial-Up Internet | 0 | 0.0% |
| Broadband Home | 2,513 | 89.5% |
| Cellular Data Only | 136 | 4.8% |
| Satellite Internet | 23 | 0.8% |
| No Internet | 58 | 2.1% |
| Total | 2,808 | 100.0% |
Fanwood borough Summary
Introduction
Located in Union County, New Jersey, Fanwood Borough is a small suburban community with a population of 7,318 as of the 2010 census. The borough is situated in the center of the county, and is bordered by Scotch Plains, Westfield, Plainfield, and Mountainside. Fanwood is a diverse community, with a mix of residential and commercial areas, and is home to a variety of businesses, restaurants, and shops.
History
Fanwood was originally part of the Elizabethtown Tract, which was purchased by the Elizabethtown Associates in 1664. The area was known as Fanwood Township until 1895, when it was incorporated as a borough. The name Fanwood is derived from the Dutch word “van woude”, which means “from the woods”.
The borough was home to a variety of industries in the late 19th and early 20th centuries, including a brickyard, a paper mill, and a sawmill. The borough also had a thriving agricultural industry, with farms producing a variety of crops, including potatoes, corn, and hay.
In the early 20th century, Fanwood began to transition from an agricultural community to a suburban one. The borough was home to a number of large estates, and many of these were subdivided into smaller lots for residential development. The borough also saw an influx of new businesses, including a movie theater, a bowling alley, and a variety of shops and restaurants.
Geography
Fanwood is located in the center of Union County, and is bordered by Scotch Plains, Westfield, Plainfield, and Mountainside. The borough is situated on the Watchung Mountains, and is home to a variety of parks and recreational areas. The borough is also home to a number of lakes, including Lake Surprise, Lake Lorraine, and Lake Carin.
The borough has a total area of 2.2 square miles, of which 0.7 square miles is land and 1.5 square miles is water. The borough is located approximately 25 miles southwest of New York City, and is accessible via the Garden State Parkway and Interstate 78.
Economy
Fanwood’s economy is largely based on the service industry, with a variety of restaurants, shops, and businesses located in the borough. The borough is also home to a number of corporate offices, including those of the pharmaceutical company Merck & Co. and the financial services firm Prudential Financial.
Demographics
As of the 2010 census, Fanwood had a population of 7,318. The racial makeup of the borough was 79.2% White, 11.2% African American, 0.3% Native American, 4.7% Asian, 0.1% Pacific Islander, and 4.5% from other races. Hispanic or Latino of any race were 11.3% of the population.
The median household income in Fanwood was $90,945, and the median family income was $106,945. The per capita income was $41,945. About 4.2% of families and 5.3% of the population were below the poverty line.
Conclusion
Fanwood Borough is a small suburban community located in Union County, New Jersey. The borough has a diverse population, and is home to a variety of businesses, restaurants, and shops. The borough is situated on the Watchung Mountains, and is home to a number of parks and recreational areas. The economy of Fanwood is largely based on the service industry, and the borough has a median household income of $90,945.
Common Questions
What is Per Capita Income in Fanwood borough?
Per Capita income in Fanwood borough is $73,487.
What is the Median Family Income in Fanwood borough?
Median Family Income in Fanwood borough is $203,447.
What is the Median Household income in Fanwood borough?
Median Household Income in Fanwood borough is $177,727.
What is Income or Wage Gap in Fanwood borough?
Income or Wage Gap in Fanwood borough is 41.7%.
Women in Fanwood borough earn 58.3 cents for every dollar earned by a man.
What is Inequality or Gini Index in Fanwood borough?
Inequality or Gini Index in Fanwood borough is 0.38.
What is the Total Population of Fanwood borough?
Total Population of Fanwood borough is 7,723.
What is the Total Male Population of Fanwood borough?
Total Male Population of Fanwood borough is 3,660.
What is the Total Female Population of Fanwood borough?
Total Female Population of Fanwood borough is 4,063.
What is the Ratio of Males per 100 Females in Fanwood borough?
There are 90.08 Males per 100 Females in Fanwood borough.
What is the Ratio of Females per 100 Males in Fanwood borough?
There are 111.01 Females per 100 Males in Fanwood borough.
What is the Median Population Age in Fanwood borough?
Median Population Age in Fanwood borough is 43.6 Years.
What is the Average Family Size in Fanwood borough
Average Family Size in Fanwood borough is 3.0 People.
What is the Average Household Size in Fanwood borough
Average Household Size in Fanwood borough is 2.7 People.
How Large is the Labor Force in Fanwood borough?
There are 4,309 People in the Labor Forcein in Fanwood borough.
What is the Percentage of People in the Labor Force in Fanwood borough?
70.8% of People are in the Labor Force in Fanwood borough.
What is the Unemployment Rate in Fanwood borough?
Unemployment Rate in Fanwood borough is 4.7%.