Essex Fells borough, NJ Map & Demographics
Essex Fells borough Overview
$113,678
PER CAPITA INCOME
$250,001
AVG FAMILY INCOME
$247,000
AVG HOUSEHOLD INCOME
59.0%
WAGE / INCOME GAP [ % ]
41.0¢/ $1
WAGE / INCOME GAP [ $ ]
0.46
INEQUALITY / GINI INDEX
2,290
TOTAL POPULATION
1,116
MALE POPULATION
1,174
FEMALE POPULATION
95.06
MALES / 100 FEMALES
105.20
FEMALES / 100 MALES
44.1
MEDIAN AGE
3.5
AVG FAMILY SIZE
3.1
AVG HOUSEHOLD SIZE
1,044
LABOR FORCE [ PEOPLE ]
64.3%
PERCENT IN LABOR FORCE
4.2%
UNEMPLOYMENT RATE
Income in Essex Fells borough
Income Overview in Essex Fells borough
Per Capita Income in Essex Fells borough is $113,678, while median incomes of families and households are $250,001 and $247,000 respectively.
| Characteristic | Number | Measure |
| Per Capita Income | 2,290 | $113,678 |
| Median Family Income | 616 | $250,001 |
| Mean Family Income | 616 | $379,822 |
| Median Household Income | 726 | $247,000 |
| Mean Household Income | 726 | $343,062 |
| Income Deficit | 616 | $0 |
| Wage / Income Gap (%) | 2,290 | 59.04% |
| Wage / Income Gap ($) | 2,290 | 40.96¢ per $1 |
| Gini / Inequality Index | 2,290 | 0.46 |
Earnings by Sex in Essex Fells borough
Average Earnings in Essex Fells borough are $119,514, $177,396 for men and $72,667 for women, a difference of 59.0%.
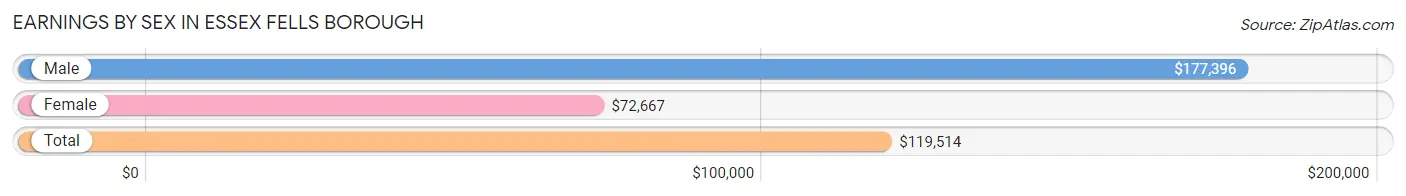
| Sex | Number | Average Earnings |
| Male | 647 (57.6%) | $177,396 |
| Female | 476 (42.4%) | $72,667 |
| Total | 1,123 (100.0%) | $119,514 |
Earnings by Sex by Income Bracket in Essex Fells borough
The most common earnings brackets in Essex Fells borough are $100,000+ for men (479 | 74.0%) and $100,000+ for women (202 | 42.4%).
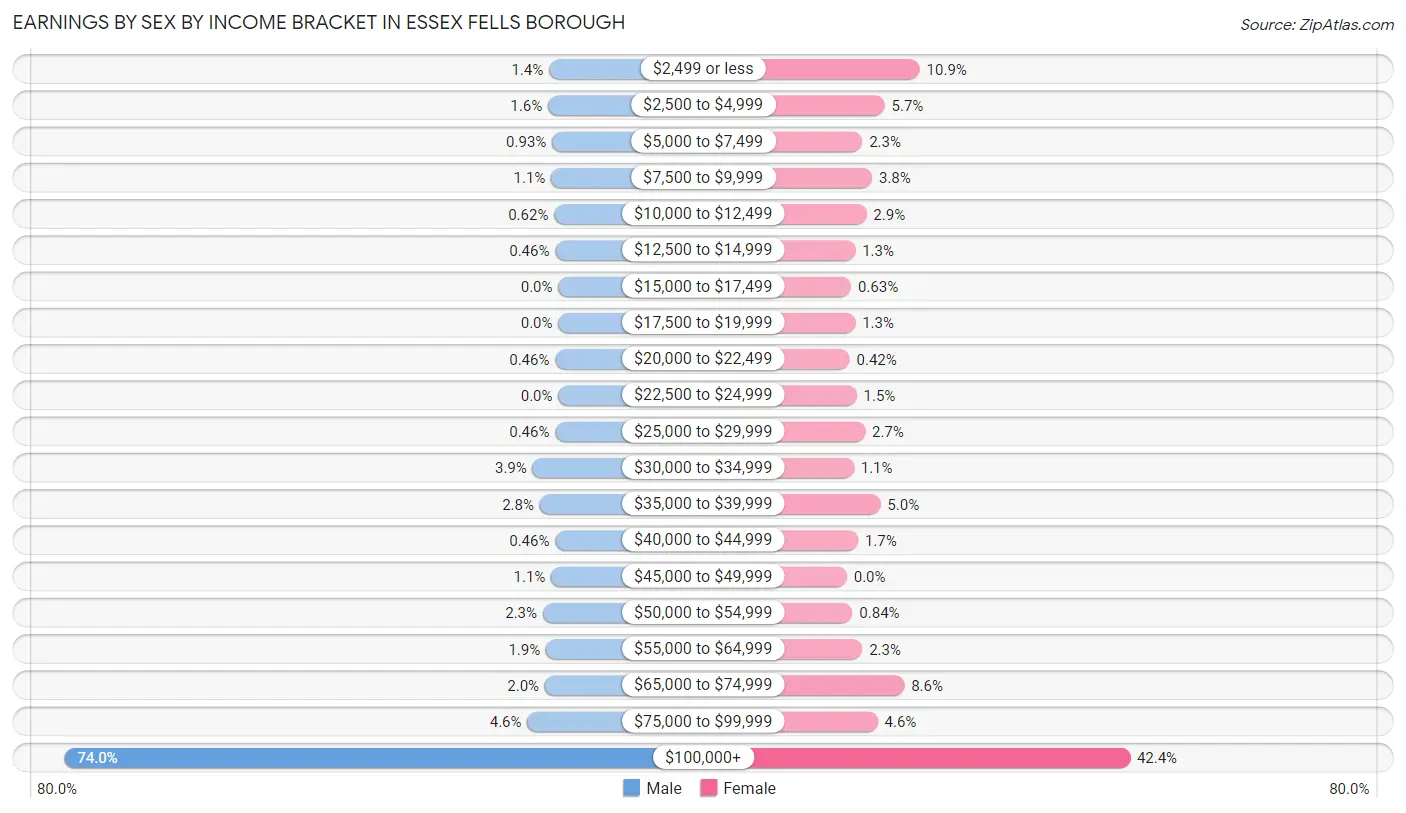
| Income | Male | Female |
| $2,499 or less | 9 (1.4%) | 52 (10.9%) |
| $2,500 to $4,999 | 10 (1.5%) | 27 (5.7%) |
| $5,000 to $7,499 | 6 (0.9%) | 11 (2.3%) |
| $7,500 to $9,999 | 7 (1.1%) | 18 (3.8%) |
| $10,000 to $12,499 | 4 (0.6%) | 14 (2.9%) |
| $12,500 to $14,999 | 3 (0.5%) | 6 (1.3%) |
| $15,000 to $17,499 | 0 (0.0%) | 3 (0.6%) |
| $17,500 to $19,999 | 0 (0.0%) | 6 (1.3%) |
| $20,000 to $22,499 | 3 (0.5%) | 2 (0.4%) |
| $22,500 to $24,999 | 0 (0.0%) | 7 (1.5%) |
| $25,000 to $29,999 | 3 (0.5%) | 13 (2.7%) |
| $30,000 to $34,999 | 25 (3.9%) | 5 (1.1%) |
| $35,000 to $39,999 | 18 (2.8%) | 24 (5.0%) |
| $40,000 to $44,999 | 3 (0.5%) | 8 (1.7%) |
| $45,000 to $49,999 | 7 (1.1%) | 0 (0.0%) |
| $50,000 to $54,999 | 15 (2.3%) | 4 (0.8%) |
| $55,000 to $64,999 | 12 (1.8%) | 11 (2.3%) |
| $65,000 to $74,999 | 13 (2.0%) | 41 (8.6%) |
| $75,000 to $99,999 | 30 (4.6%) | 22 (4.6%) |
| $100,000+ | 479 (74.0%) | 202 (42.4%) |
| Total | 647 (100.0%) | 476 (100.0%) |
Earnings by Sex by Educational Attainment in Essex Fells borough
Average earnings in Essex Fells borough are $185,893 for men and $83,750 for women, a difference of 54.9%. Men with an educational attainment of graduate degree enjoy the highest average annual earnings of $227,830, while those with college or associate's degree education earn the least with $80,000. Women with an educational attainment of graduate degree earn the most with the average annual earnings of $109,327, while those with college or associate's degree education have the smallest earnings of $25,795.
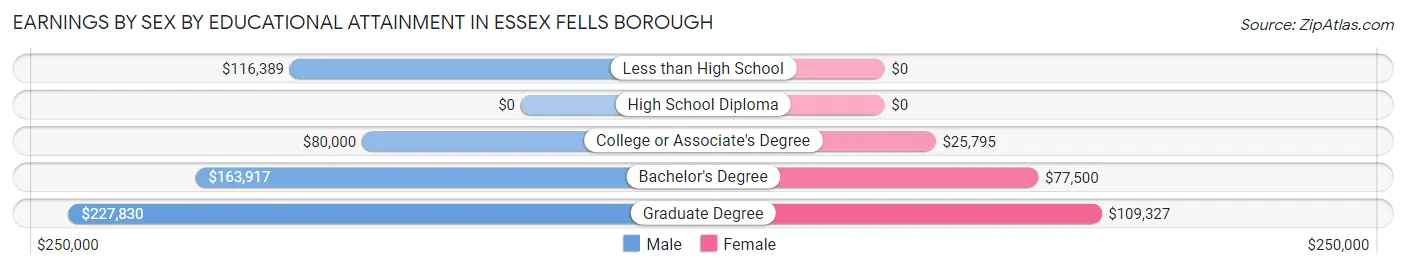
| Educational Attainment | Male Income | Female Income |
| Less than High School | $116,389 | $0 |
| High School Diploma | - | - |
| College or Associate's Degree | $80,000 | $25,795 |
| Bachelor's Degree | $163,917 | $77,500 |
| Graduate Degree | $227,830 | $109,327 |
| Total | $185,893 | $83,750 |
Family Income in Essex Fells borough
Family Income Brackets in Essex Fells borough
According to the Essex Fells borough family income data, there are 441 families falling into the $200,000+ income range, which is the most common income bracket and makes up 71.6% of all families.
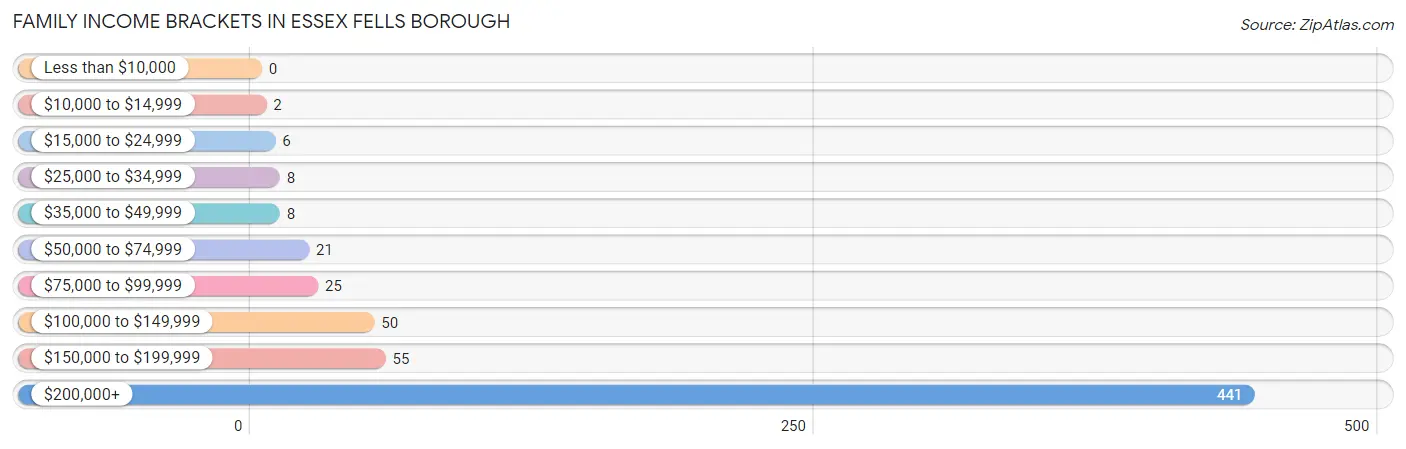
| Income Bracket | # Families | % Families |
| Less than $10,000 | 0 | 0.0% |
| $10,000 to $14,999 | 2 | 0.3% |
| $15,000 to $24,999 | 6 | 1.0% |
| $25,000 to $34,999 | 8 | 1.3% |
| $35,000 to $49,999 | 8 | 1.3% |
| $50,000 to $74,999 | 21 | 3.4% |
| $75,000 to $99,999 | 25 | 4.1% |
| $100,000 to $149,999 | 50 | 8.1% |
| $150,000 to $199,999 | 55 | 8.9% |
| $200,000+ | 441 | 71.6% |
Family Income by Famaliy Size in Essex Fells borough
3-person families (110 | 17.9%) account for the highest median family income in Essex Fells borough with $250,001 per family, while 2-person families (241 | 39.1%) have the highest median income of $123,021 per family member.
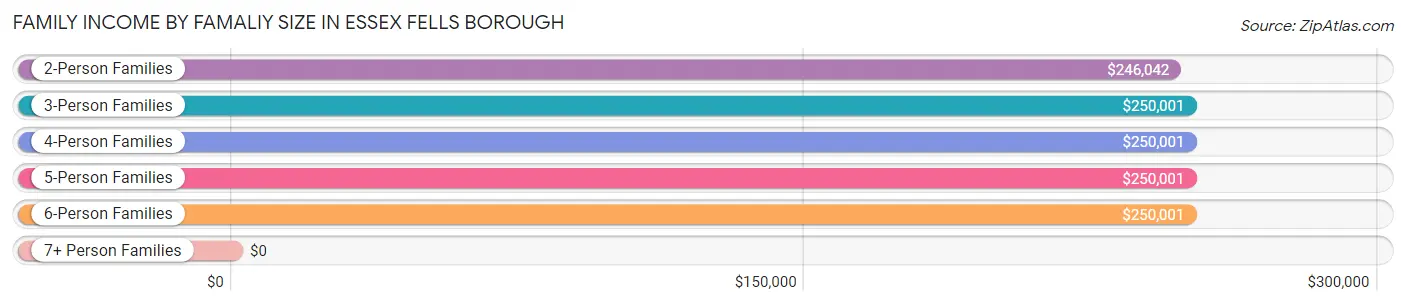
| Income Bracket | # Families | Median Income |
| 2-Person Families | 241 (39.1%) | $246,042 |
| 3-Person Families | 110 (17.9%) | $250,001 |
| 4-Person Families | 178 (28.9%) | $250,001 |
| 5-Person Families | 66 (10.7%) | $250,001 |
| 6-Person Families | 17 (2.8%) | $250,001 |
| 7+ Person Families | 4 (0.6%) | $0 |
| Total | 616 (100.0%) | $250,001 |
Family Income by Number of Earners in Essex Fells borough
The median family income in Essex Fells borough is $250,001, with families comprising 2 earners (330) having the highest median family income of $250,001, while families with no earners (46) have the lowest median family income of $89,167, accounting for 53.6% and 7.5% of families, respectively.
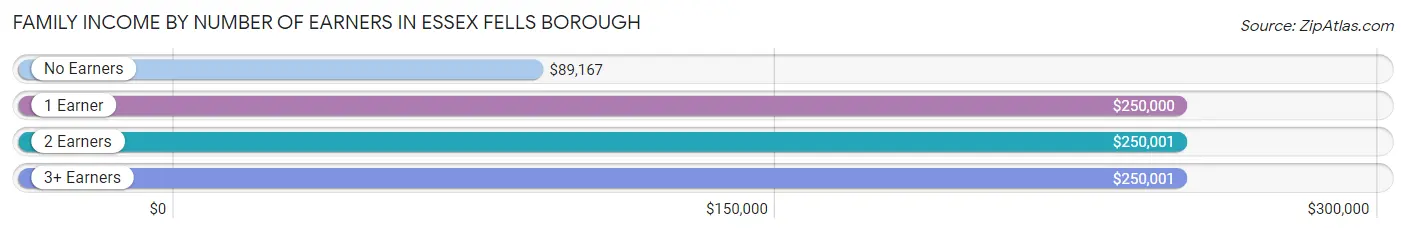
| Number of Earners | # Families | Median Income |
| No Earners | 46 (7.5%) | $89,167 |
| 1 Earner | 196 (31.8%) | $250,000 |
| 2 Earners | 330 (53.6%) | $250,001 |
| 3+ Earners | 44 (7.1%) | $250,001 |
| Total | 616 (100.0%) | $250,001 |
Household Income in Essex Fells borough
Household Income Brackets in Essex Fells borough
With 461 households falling in the category, the $200,000+ income range is the most frequent in Essex Fells borough, accounting for 63.5% of all households. In contrast, only 4 households (0.5%) fall into the less than $10,000 income bracket, making it the least populous group.
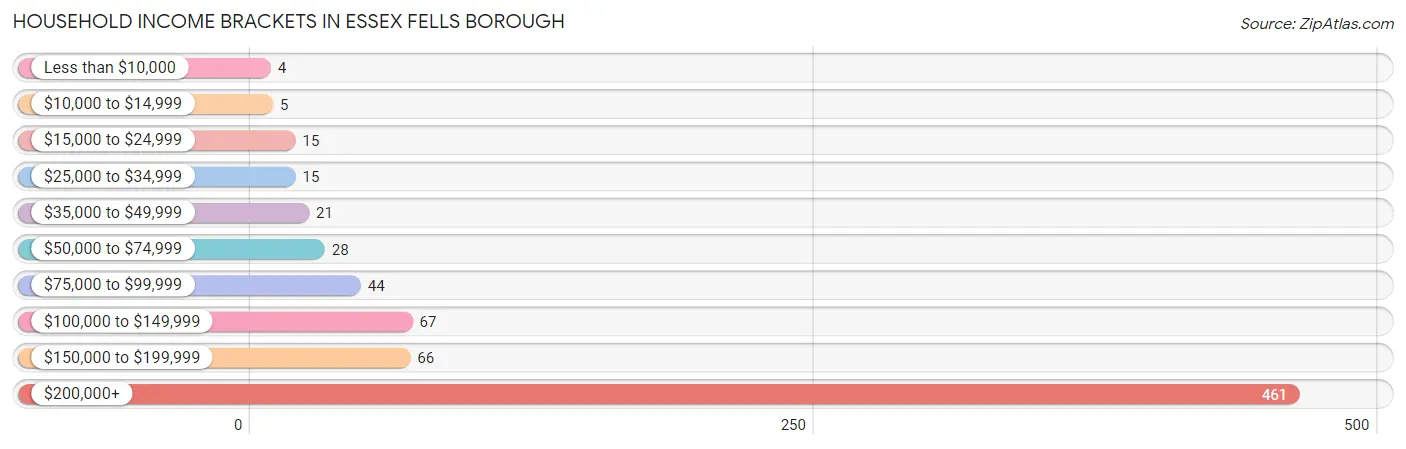
| Income Bracket | # Households | % Households |
| Less than $10,000 | 4 | 0.6% |
| $10,000 to $14,999 | 5 | 0.7% |
| $15,000 to $24,999 | 15 | 2.1% |
| $25,000 to $34,999 | 15 | 2.1% |
| $35,000 to $49,999 | 21 | 2.9% |
| $50,000 to $74,999 | 28 | 3.9% |
| $75,000 to $99,999 | 44 | 6.1% |
| $100,000 to $149,999 | 67 | 9.2% |
| $150,000 to $199,999 | 66 | 9.1% |
| $200,000+ | 461 | 63.5% |
Household Income by Householder Age in Essex Fells borough
The median household income in Essex Fells borough is $247,000, with the highest median household income of $250,001 found in the 25 to 44 years age bracket for the primary householder. A total of 178 households (24.5%) fall into this category.
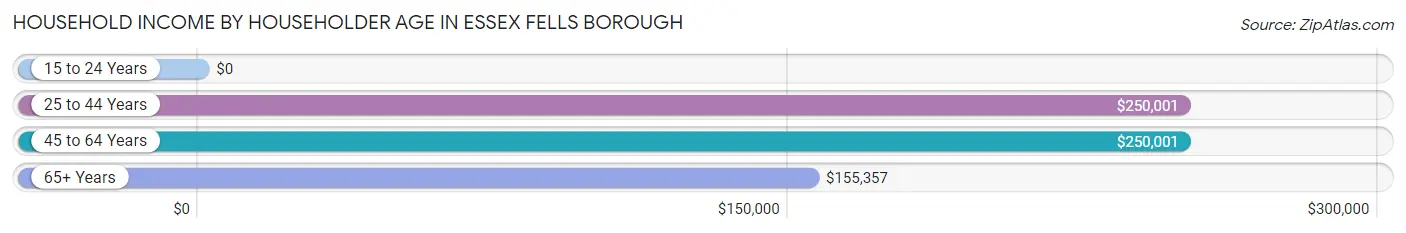
| Income Bracket | # Households | Median Income |
| 15 to 24 Years | 0 (0.0%) | $0 |
| 25 to 44 Years | 178 (24.5%) | $250,001 |
| 45 to 64 Years | 310 (42.7%) | $250,001 |
| 65+ Years | 238 (32.8%) | $155,357 |
| Total | 726 (100.0%) | $247,000 |
Poverty in Essex Fells borough
Income Below Poverty by Sex and Age in Essex Fells borough
With 0.4% poverty level for males and 1.1% for females among the residents of Essex Fells borough, 18 to 24 year old males and 25 to 34 year old females are the most vulnerable to poverty, with 2 males (3.5%) and 4 females (7.4%) in their respective age groups living below the poverty level.
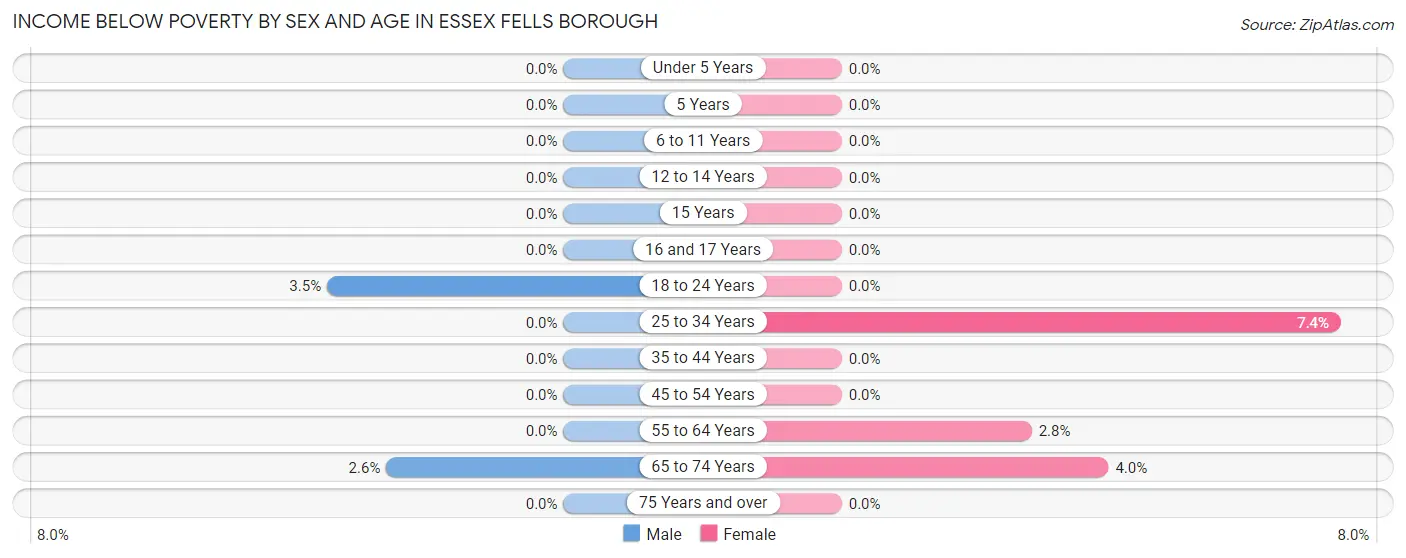
| Age Bracket | Male | Female |
| Under 5 Years | 0 (0.0%) | 0 (0.0%) |
| 5 Years | 0 (0.0%) | 0 (0.0%) |
| 6 to 11 Years | 0 (0.0%) | 0 (0.0%) |
| 12 to 14 Years | 0 (0.0%) | 0 (0.0%) |
| 15 Years | 0 (0.0%) | 0 (0.0%) |
| 16 and 17 Years | 0 (0.0%) | 0 (0.0%) |
| 18 to 24 Years | 2 (3.5%) | 0 (0.0%) |
| 25 to 34 Years | 0 (0.0%) | 4 (7.4%) |
| 35 to 44 Years | 0 (0.0%) | 0 (0.0%) |
| 45 to 54 Years | 0 (0.0%) | 0 (0.0%) |
| 55 to 64 Years | 0 (0.0%) | 5 (2.8%) |
| 65 to 74 Years | 3 (2.6%) | 4 (4.0%) |
| 75 Years and over | 0 (0.0%) | 0 (0.0%) |
| Total | 5 (0.4%) | 13 (1.1%) |
Income Above Poverty by Sex and Age in Essex Fells borough
According to the poverty statistics in Essex Fells borough, males aged under 5 years and females aged under 5 years are the age groups that are most secure financially, with 100.0% of males and 100.0% of females in these age groups living above the poverty line.
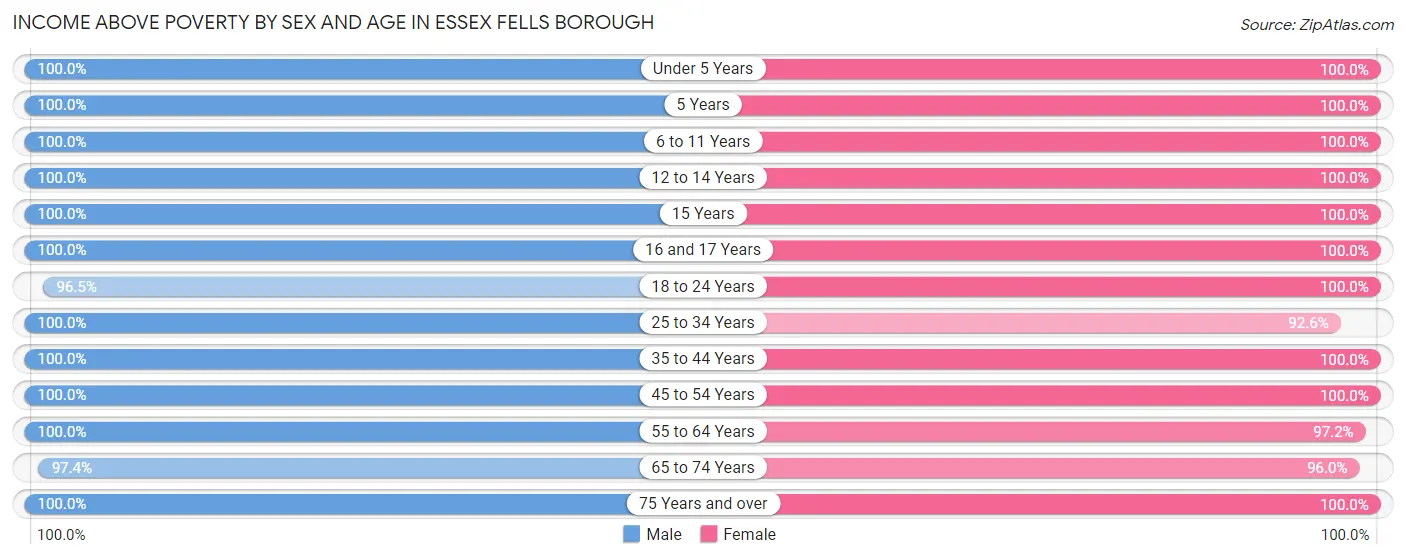
| Age Bracket | Male | Female |
| Under 5 Years | 46 (100.0%) | 56 (100.0%) |
| 5 Years | 5 (100.0%) | 22 (100.0%) |
| 6 to 11 Years | 149 (100.0%) | 185 (100.0%) |
| 12 to 14 Years | 103 (100.0%) | 82 (100.0%) |
| 15 Years | 9 (100.0%) | 9 (100.0%) |
| 16 and 17 Years | 31 (100.0%) | 26 (100.0%) |
| 18 to 24 Years | 55 (96.5%) | 56 (100.0%) |
| 25 to 34 Years | 50 (100.0%) | 50 (92.6%) |
| 35 to 44 Years | 113 (100.0%) | 156 (100.0%) |
| 45 to 54 Years | 227 (100.0%) | 141 (100.0%) |
| 55 to 64 Years | 141 (100.0%) | 172 (97.2%) |
| 65 to 74 Years | 111 (97.4%) | 97 (96.0%) |
| 75 Years and over | 71 (100.0%) | 109 (100.0%) |
| Total | 1,111 (99.6%) | 1,161 (98.9%) |
Income Below Poverty Among Married-Couple Families in Essex Fells borough
The poverty statistics for married-couple families in Essex Fells borough show that 0.3% or 2 of the total 584 families live below the poverty line. Families with no children have the highest poverty rate of 0.7%, comprising of 2 families. On the other hand, families with 1 or 2 children have the lowest poverty rate of 0.0%, which includes 0 families.
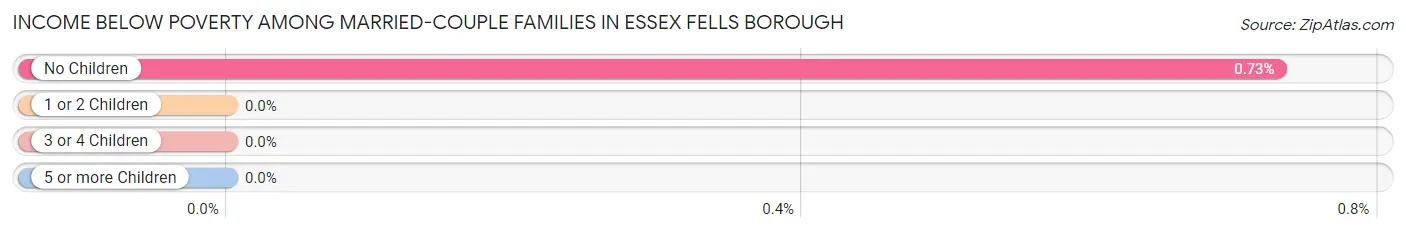
| Children | Above Poverty | Below Poverty |
| No Children | 272 (99.3%) | 2 (0.7%) |
| 1 or 2 Children | 247 (100.0%) | 0 (0.0%) |
| 3 or 4 Children | 59 (100.0%) | 0 (0.0%) |
| 5 or more Children | 4 (100.0%) | 0 (0.0%) |
| Total | 582 (99.7%) | 2 (0.3%) |
Income Below Poverty Among Single-Parent Households in Essex Fells borough
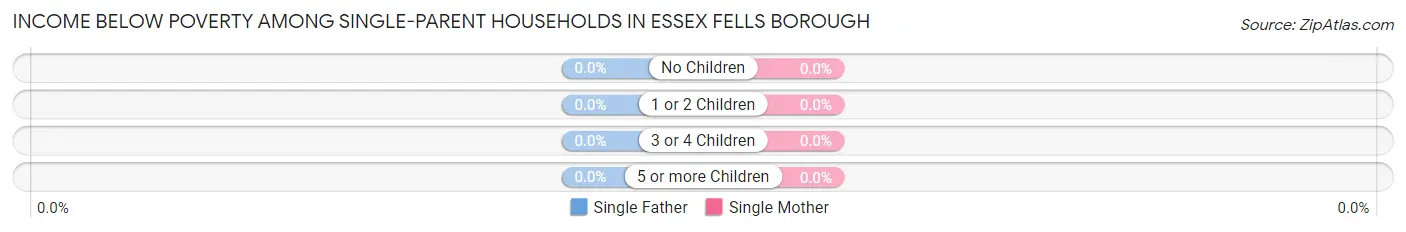
| Children | Single Father | Single Mother |
| No Children | 0 (0.0%) | 0 (0.0%) |
| 1 or 2 Children | 0 (0.0%) | 0 (0.0%) |
| 3 or 4 Children | 0 (0.0%) | 0 (0.0%) |
| 5 or more Children | 0 (0.0%) | 0 (0.0%) |
| Total | 0 (0.0%) | 0 (0.0%) |
Income Below Poverty Among Married-Couple vs Single-Parent Households in Essex Fells borough
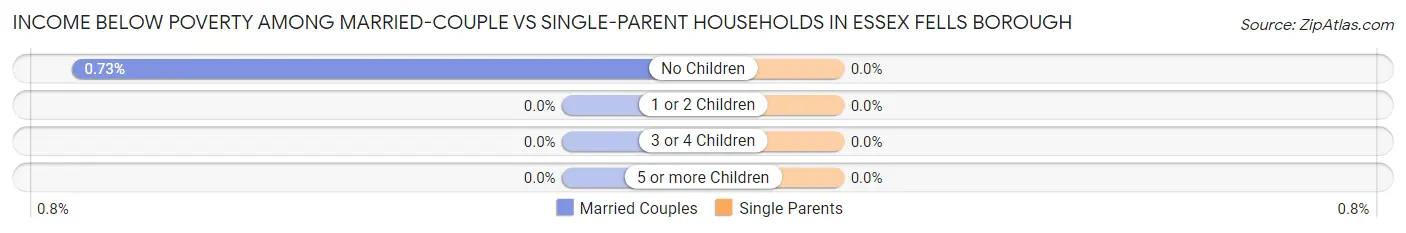
| Children | Married-Couple Families | Single-Parent Households |
| No Children | 2 (0.7%) | 0 (0.0%) |
| 1 or 2 Children | 0 (0.0%) | 0 (0.0%) |
| 3 or 4 Children | 0 (0.0%) | 0 (0.0%) |
| 5 or more Children | 0 (0.0%) | 0 (0.0%) |
| Total | 2 (0.3%) | 0 (0.0%) |
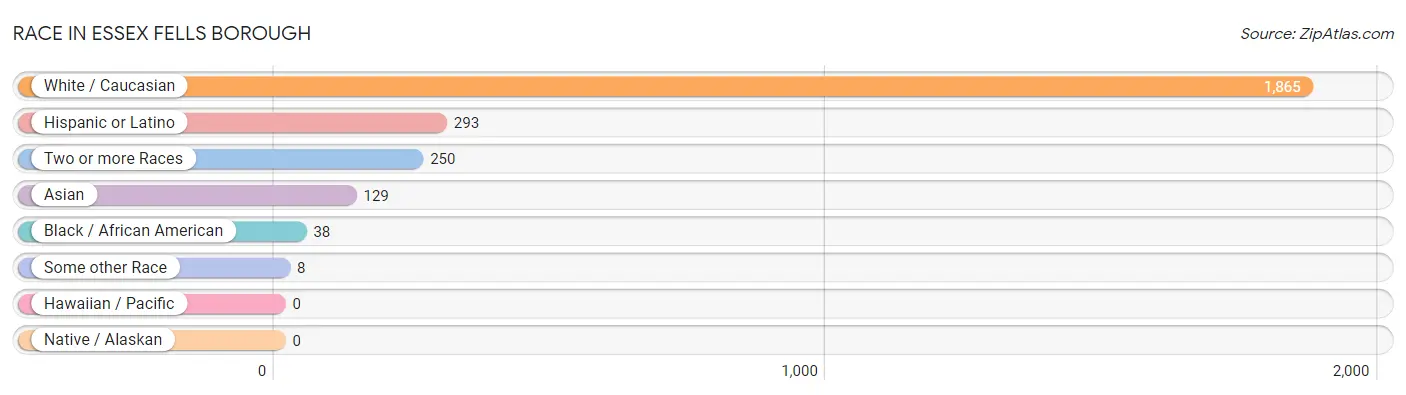
Race in Essex Fells borough
The most populous races in Essex Fells borough are White / Caucasian (1,865 | 81.4%), Hispanic or Latino (293 | 12.8%), and Two or more Races (250 | 10.9%).
| Race | # Population | % Population |
| Asian | 129 | 5.6% |
| Black / African American | 38 | 1.7% |
| Hawaiian / Pacific | 0 | 0.0% |
| Hispanic or Latino | 293 | 12.8% |
| Native / Alaskan | 0 | 0.0% |
| White / Caucasian | 1,865 | 81.4% |
| Two or more Races | 250 | 10.9% |
| Some other Race | 8 | 0.4% |
| Total | 2,290 | 100.0% |
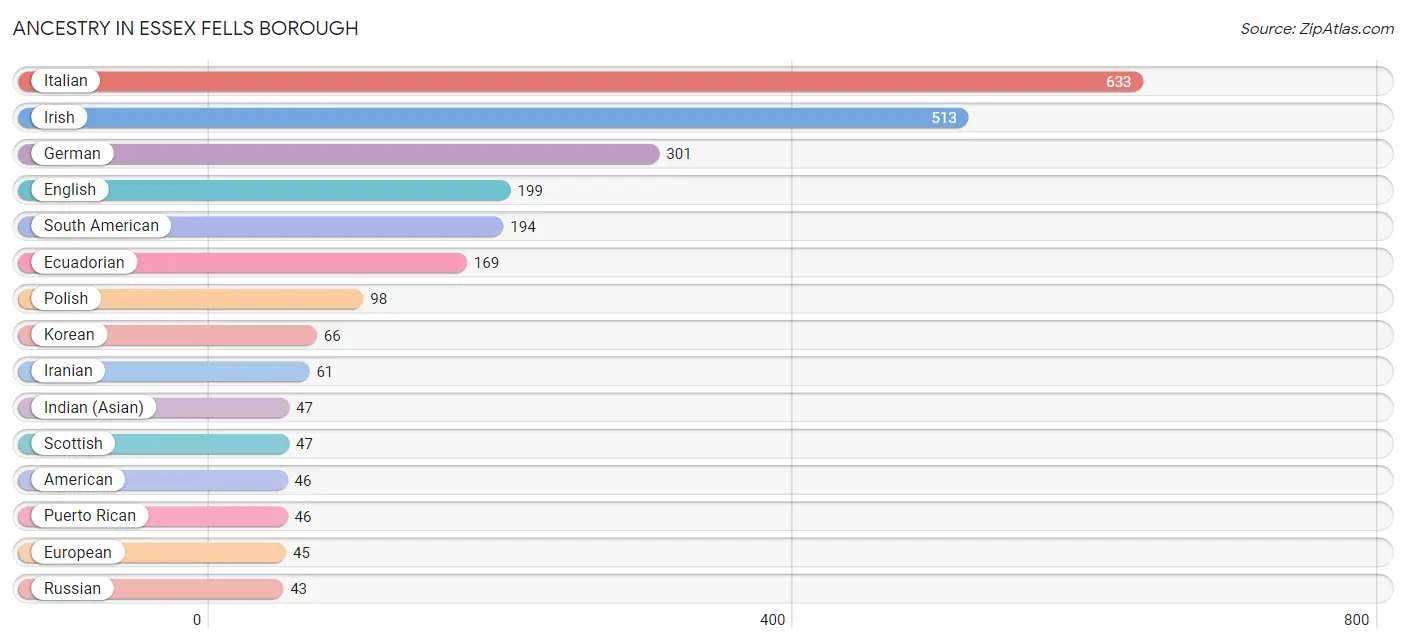
Ancestry in Essex Fells borough
The most populous ancestries reported in Essex Fells borough are Italian (633 | 27.6%), Irish (513 | 22.4%), German (301 | 13.1%), English (199 | 8.7%), and South American (194 | 8.5%), together accounting for 80.3% of all Essex Fells borough residents.
| Ancestry | # Population | % Population |
| Albanian | 13 | 0.6% |
| American | 46 | 2.0% |
| Arab | 37 | 1.6% |
| Austrian | 24 | 1.1% |
| Belgian | 3 | 0.1% |
| British | 5 | 0.2% |
| Burmese | 3 | 0.1% |
| Colombian | 9 | 0.4% |
| Croatian | 8 | 0.4% |
| Cuban | 8 | 0.4% |
| Czech | 10 | 0.4% |
| Czechoslovakian | 5 | 0.2% |
| Danish | 6 | 0.3% |
| Dominican | 10 | 0.4% |
| Dutch | 17 | 0.7% |
| Eastern European | 18 | 0.8% |
| Ecuadorian | 169 | 7.4% |
| English | 199 | 8.7% |
| European | 45 | 2.0% |
| Filipino | 5 | 0.2% |
| Finnish | 8 | 0.4% |
| French | 28 | 1.2% |
| French Canadian | 11 | 0.5% |
| German | 301 | 13.1% |
| Hungarian | 9 | 0.4% |
| Indian (Asian) | 47 | 2.1% |
| Iranian | 61 | 2.7% |
| Irish | 513 | 22.4% |
| Italian | 633 | 27.6% |
| Korean | 66 | 2.9% |
| Latvian | 8 | 0.4% |
| Lebanese | 24 | 1.1% |
| Lithuanian | 3 | 0.1% |
| Norwegian | 28 | 1.2% |
| Peruvian | 16 | 0.7% |
| Polish | 98 | 4.3% |
| Portuguese | 25 | 1.1% |
| Puerto Rican | 46 | 2.0% |
| Romanian | 27 | 1.2% |
| Russian | 43 | 1.9% |
| Scotch-Irish | 20 | 0.9% |
| Scottish | 47 | 2.1% |
| Slovak | 11 | 0.5% |
| South American | 194 | 8.5% |
| Spaniard | 8 | 0.4% |
| Spanish | 27 | 1.2% |
| Swedish | 30 | 1.3% |
| Syrian | 4 | 0.2% |
| Thai | 40 | 1.8% |
| Ukrainian | 22 | 1.0% |
| Welsh | 6 | 0.3% |
| Yugoslavian | 5 | 0.2% | View All 52 Rows |
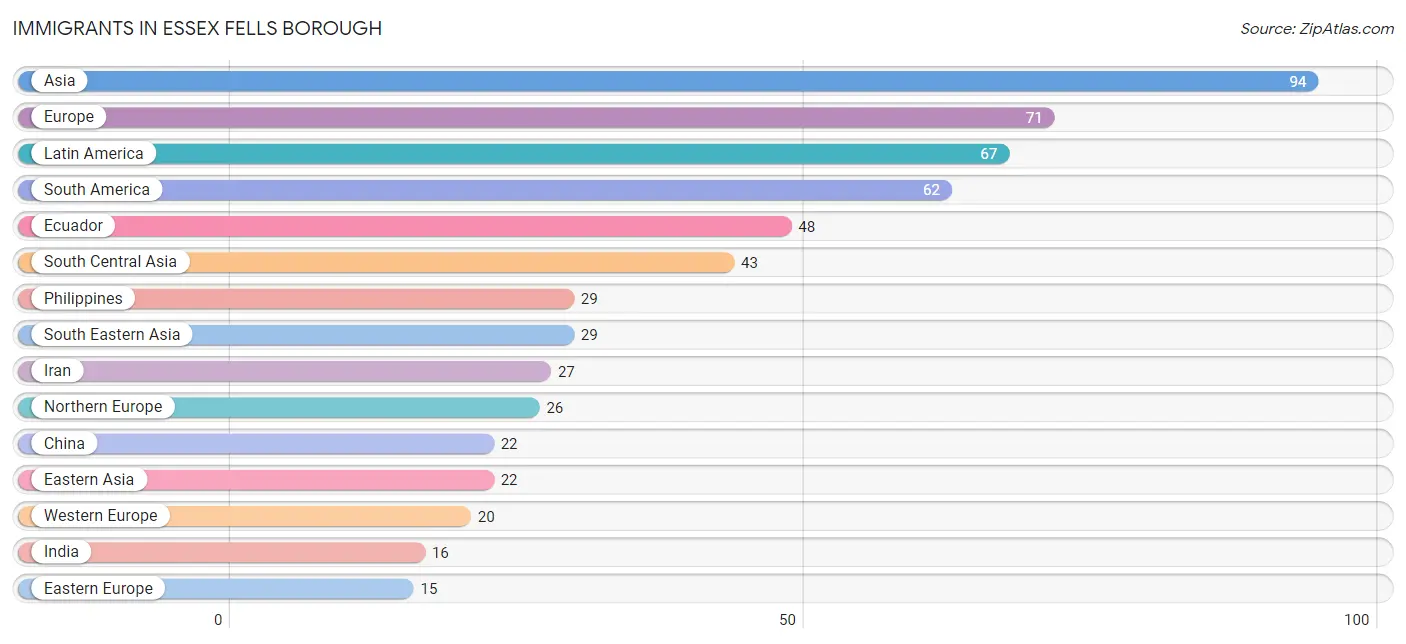
Immigrants in Essex Fells borough
The most numerous immigrant groups reported in Essex Fells borough came from Asia (94 | 4.1%), Europe (71 | 3.1%), Latin America (67 | 2.9%), South America (62 | 2.7%), and Ecuador (48 | 2.1%), together accounting for 14.9% of all Essex Fells borough residents.
| Immigration Origin | # Population | % Population |
| Africa | 9 | 0.4% |
| Albania | 2 | 0.1% |
| Asia | 94 | 4.1% |
| Brazil | 3 | 0.1% |
| Caribbean | 5 | 0.2% |
| China | 22 | 1.0% |
| Colombia | 7 | 0.3% |
| Croatia | 5 | 0.2% |
| Dominican Republic | 5 | 0.2% |
| Eastern Asia | 22 | 1.0% |
| Eastern Europe | 15 | 0.7% |
| Ecuador | 48 | 2.1% |
| England | 15 | 0.7% |
| Europe | 71 | 3.1% |
| France | 4 | 0.2% |
| Germany | 13 | 0.6% |
| Hong Kong | 3 | 0.1% |
| India | 16 | 0.7% |
| Iran | 27 | 1.2% |
| Italy | 5 | 0.2% |
| Latin America | 67 | 2.9% |
| Netherlands | 3 | 0.1% |
| Northern Europe | 26 | 1.1% |
| Peru | 4 | 0.2% |
| Philippines | 29 | 1.3% |
| Poland | 3 | 0.1% |
| Romania | 5 | 0.2% |
| South Africa | 9 | 0.4% |
| South America | 62 | 2.7% |
| South Central Asia | 43 | 1.9% |
| South Eastern Asia | 29 | 1.3% |
| Southern Europe | 10 | 0.4% |
| Spain | 5 | 0.2% |
| Sweden | 8 | 0.4% |
| Taiwan | 9 | 0.4% |
| Western Europe | 20 | 0.9% | View All 36 Rows |
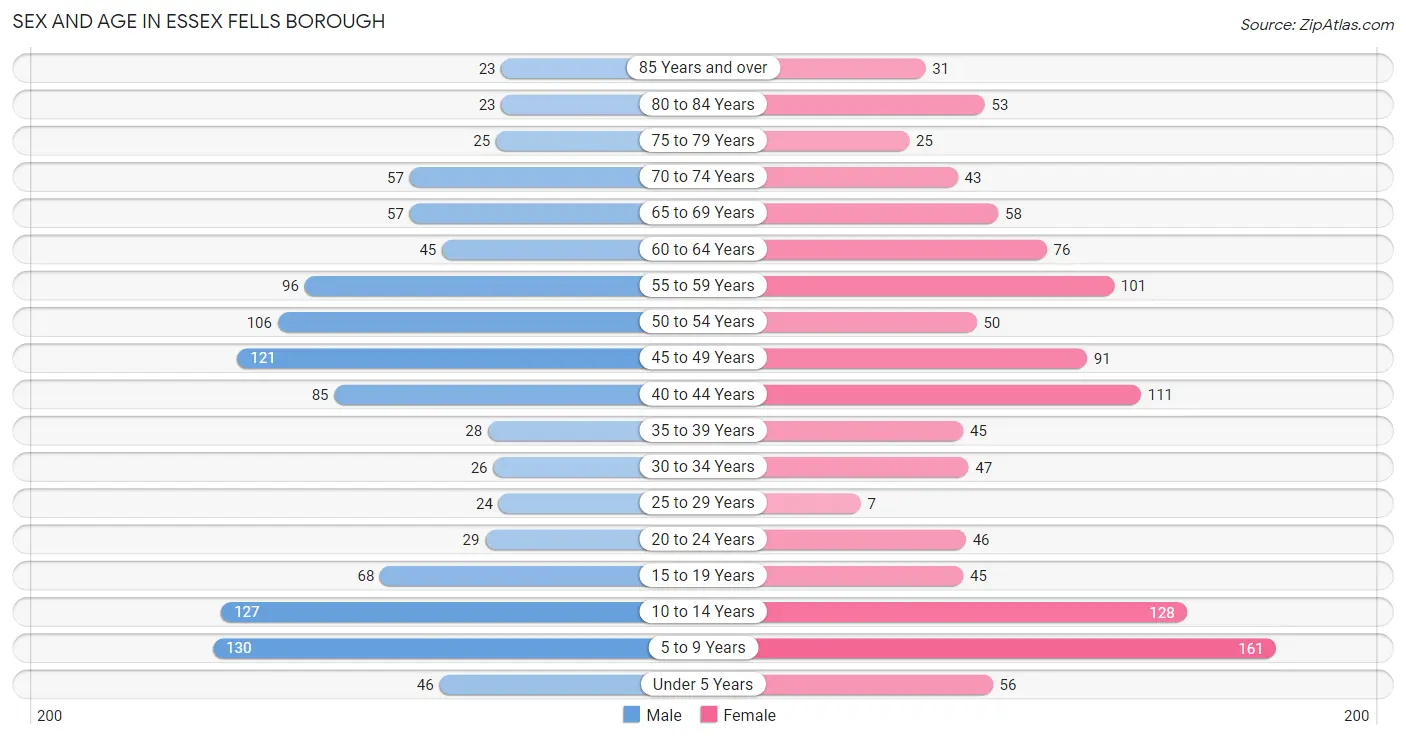
Sex and Age in Essex Fells borough
Sex and Age in Essex Fells borough
The most populous age groups in Essex Fells borough are 5 to 9 Years (130 | 11.7%) for men and 5 to 9 Years (161 | 13.7%) for women.
| Age Bracket | Male | Female |
| Under 5 Years | 46 (4.1%) | 56 (4.8%) |
| 5 to 9 Years | 130 (11.7%) | 161 (13.7%) |
| 10 to 14 Years | 127 (11.4%) | 128 (10.9%) |
| 15 to 19 Years | 68 (6.1%) | 45 (3.8%) |
| 20 to 24 Years | 29 (2.6%) | 46 (3.9%) |
| 25 to 29 Years | 24 (2.1%) | 7 (0.6%) |
| 30 to 34 Years | 26 (2.3%) | 47 (4.0%) |
| 35 to 39 Years | 28 (2.5%) | 45 (3.8%) |
| 40 to 44 Years | 85 (7.6%) | 111 (9.5%) |
| 45 to 49 Years | 121 (10.8%) | 91 (7.7%) |
| 50 to 54 Years | 106 (9.5%) | 50 (4.3%) |
| 55 to 59 Years | 96 (8.6%) | 101 (8.6%) |
| 60 to 64 Years | 45 (4.0%) | 76 (6.5%) |
| 65 to 69 Years | 57 (5.1%) | 58 (4.9%) |
| 70 to 74 Years | 57 (5.1%) | 43 (3.7%) |
| 75 to 79 Years | 25 (2.2%) | 25 (2.1%) |
| 80 to 84 Years | 23 (2.1%) | 53 (4.5%) |
| 85 Years and over | 23 (2.1%) | 31 (2.6%) |
| Total | 1,116 (100.0%) | 1,174 (100.0%) |
Families and Households in Essex Fells borough
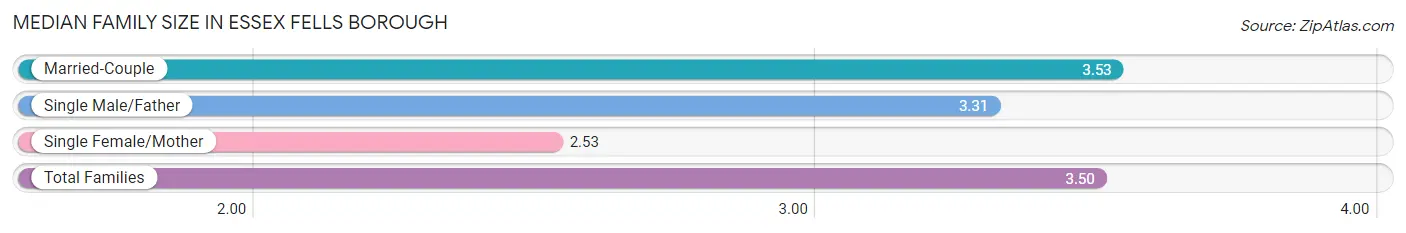
Median Family Size in Essex Fells borough
The median family size in Essex Fells borough is 3.50 persons per family, with married-couple families (584 | 94.8%) accounting for the largest median family size of 3.53 persons per family. On the other hand, single female/mother families (19 | 3.1%) represent the smallest median family size with 2.53 persons per family.
| Family Type | # Families | Family Size |
| Married-Couple | 584 (94.8%) | 3.53 |
| Single Male/Father | 13 (2.1%) | 3.31 |
| Single Female/Mother | 19 (3.1%) | 2.53 |
| Total Families | 616 (100.0%) | 3.50 |
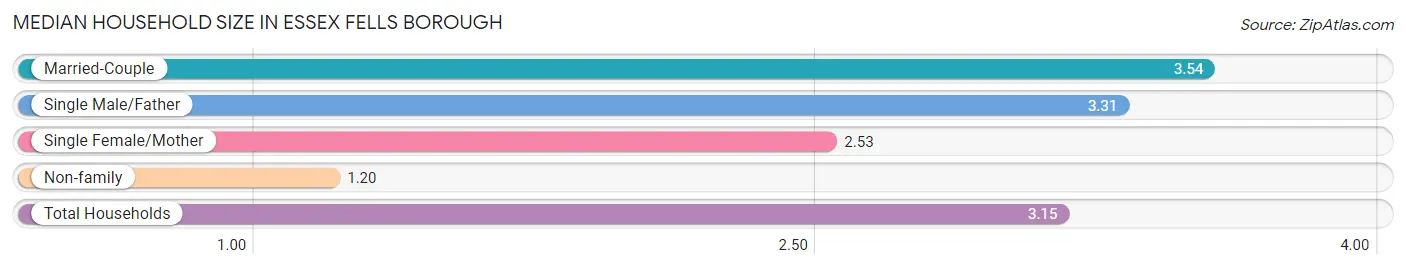
Median Household Size in Essex Fells borough
The median household size in Essex Fells borough is 3.15 persons per household, with married-couple households (584 | 80.4%) accounting for the largest median household size of 3.54 persons per household. non-family households (110 | 15.1%) represent the smallest median household size with 1.20 persons per household.
| Household Type | # Households | Household Size |
| Married-Couple | 584 (80.4%) | 3.54 |
| Single Male/Father | 13 (1.8%) | 3.31 |
| Single Female/Mother | 19 (2.6%) | 2.53 |
| Non-family | 110 (15.1%) | 1.20 |
| Total Households | 726 (100.0%) | 3.15 |
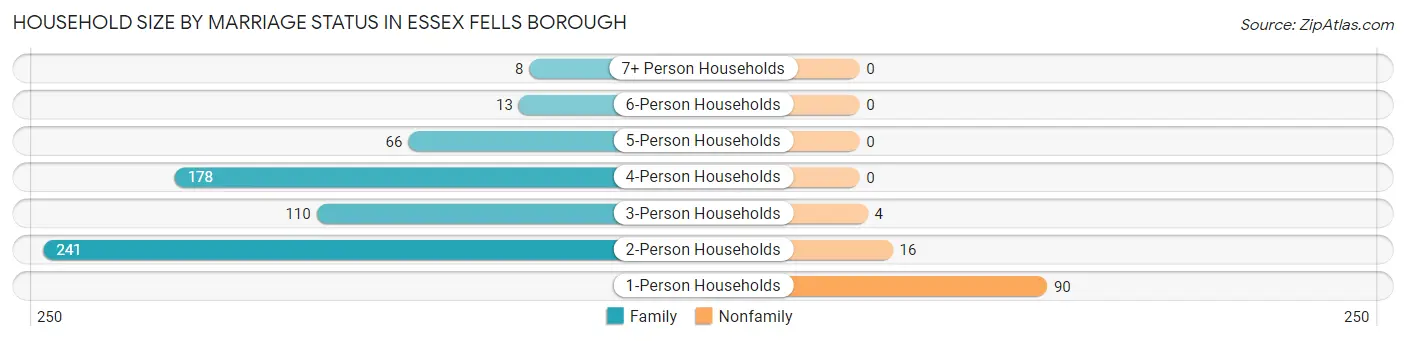
Household Size by Marriage Status in Essex Fells borough
Out of a total of 726 households in Essex Fells borough, 616 (84.9%) are family households, while 110 (15.1%) are nonfamily households. The most numerous type of family households are 2-person households, comprising 241, and the most common type of nonfamily households are 1-person households, comprising 90.
| Household Size | Family Households | Nonfamily Households |
| 1-Person Households | - | 90 (12.4%) |
| 2-Person Households | 241 (33.2%) | 16 (2.2%) |
| 3-Person Households | 110 (15.1%) | 4 (0.5%) |
| 4-Person Households | 178 (24.5%) | 0 (0.0%) |
| 5-Person Households | 66 (9.1%) | 0 (0.0%) |
| 6-Person Households | 13 (1.8%) | 0 (0.0%) |
| 7+ Person Households | 8 (1.1%) | 0 (0.0%) |
| Total | 616 (84.9%) | 110 (15.1%) |
Female Fertility in Essex Fells borough
Fertility by Age in Essex Fells borough
Average fertility rate in Essex Fells borough is 73.0 births per 1,000 women. Women in the age bracket of 35 to 50 years have the highest fertility rate with 83.0 births per 1,000 women. Women in the age bracket of 35 to 50 years acount for 72.4% of all women with births.
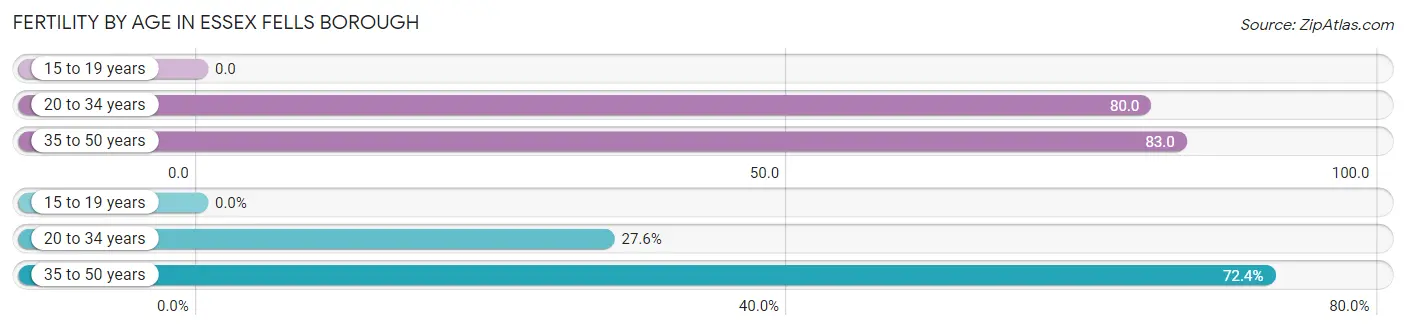
| Age Bracket | Women with Births | Births / 1,000 Women |
| 15 to 19 years | 0 (0.0%) | 0.0 |
| 20 to 34 years | 8 (27.6%) | 80.0 |
| 35 to 50 years | 21 (72.4%) | 83.0 |
| Total | 29 (100.0%) | 73.0 |
Fertility by Age by Marriage Status in Essex Fells borough
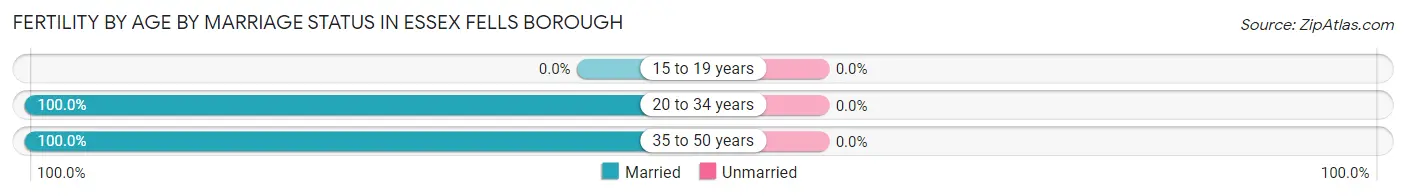
| Age Bracket | Married | Unmarried |
| 15 to 19 years | 0 (0.0%) | 0 (0.0%) |
| 20 to 34 years | 8 (100.0%) | 0 (0.0%) |
| 35 to 50 years | 21 (100.0%) | 0 (0.0%) |
| Total | 29 (100.0%) | 0 (0.0%) |
Fertility by Education in Essex Fells borough
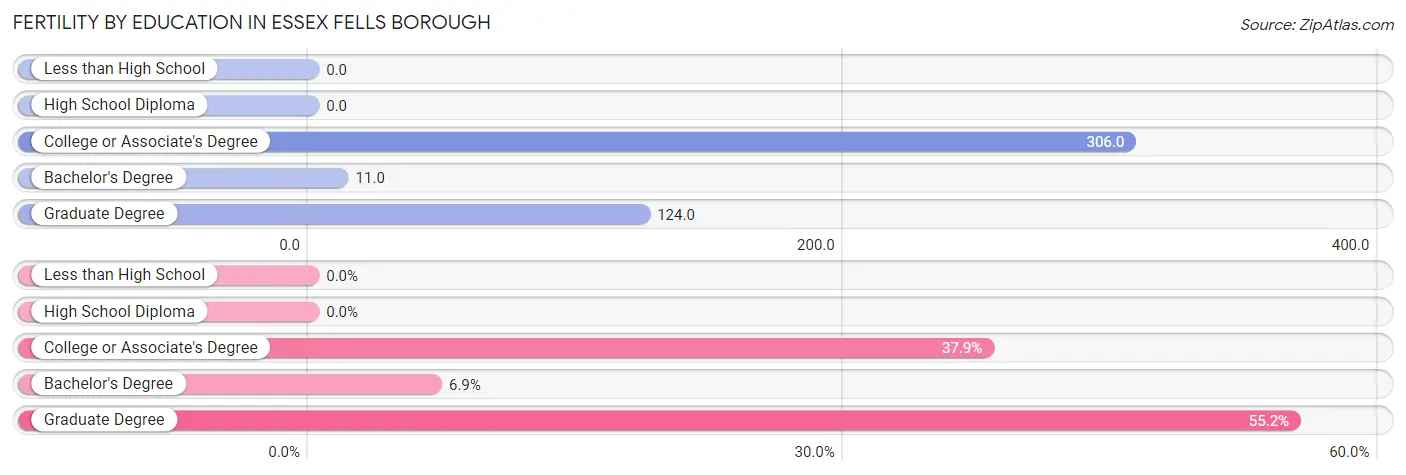
| Educational Attainment | Women with Births | Births / 1,000 Women |
| Less than High School | 0 (0.0%) | 0.0 |
| High School Diploma | 0 (0.0%) | 0.0 |
| College or Associate's Degree | 11 (37.9%) | 306.0 |
| Bachelor's Degree | 2 (6.9%) | 11.0 |
| Graduate Degree | 16 (55.2%) | 124.0 |
| Total | 29 (100.0%) | 73.0 |
Fertility by Education by Marriage Status in Essex Fells borough
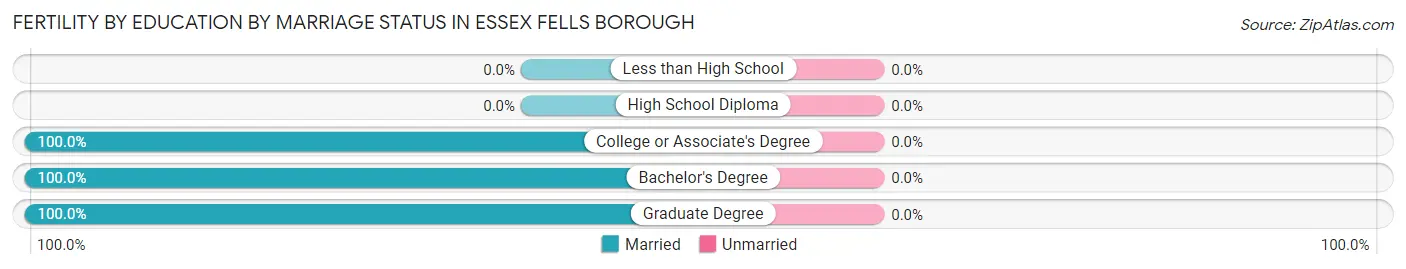
| Educational Attainment | Married | Unmarried |
| Less than High School | 0 (0.0%) | 0 (0.0%) |
| High School Diploma | 0 (0.0%) | 0 (0.0%) |
| College or Associate's Degree | 11 (100.0%) | 0 (0.0%) |
| Bachelor's Degree | 2 (100.0%) | 0 (0.0%) |
| Graduate Degree | 16 (100.0%) | 0 (0.0%) |
| Total | 29 (100.0%) | 0 (0.0%) |
Employment Characteristics in Essex Fells borough
Employment by Class of Employer in Essex Fells borough
Among the 993 employed individuals in Essex Fells borough, private company employees (649 | 65.4%), self-employed (incorporated) (145 | 14.6%), and local government employees (82 | 8.3%) make up the most common classes of employment.
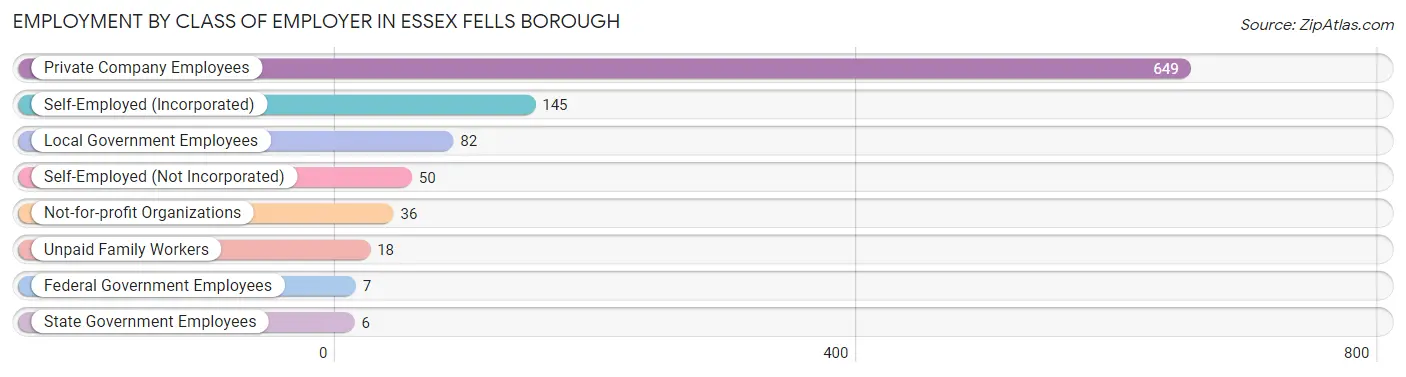
| Employer Class | # Employees | % Employees |
| Private Company Employees | 649 | 65.4% |
| Self-Employed (Incorporated) | 145 | 14.6% |
| Self-Employed (Not Incorporated) | 50 | 5.0% |
| Not-for-profit Organizations | 36 | 3.6% |
| Local Government Employees | 82 | 8.3% |
| State Government Employees | 6 | 0.6% |
| Federal Government Employees | 7 | 0.7% |
| Unpaid Family Workers | 18 | 1.8% |
| Total | 993 | 100.0% |
Employment Status by Age in Essex Fells borough
According to the labor force statistics for Essex Fells borough, out of the total population over 16 years of age (1,624), 64.3% or 1,044 individuals are in the labor force, with 4.2% or 44 of them unemployed. The age group with the highest labor force participation rate is 25 to 29 years, with 90.3% or 28 individuals in the labor force. Within the labor force, the 20 to 24 years age range has the highest percentage of unemployed individuals, with 42.0% or 21 of them being unemployed.
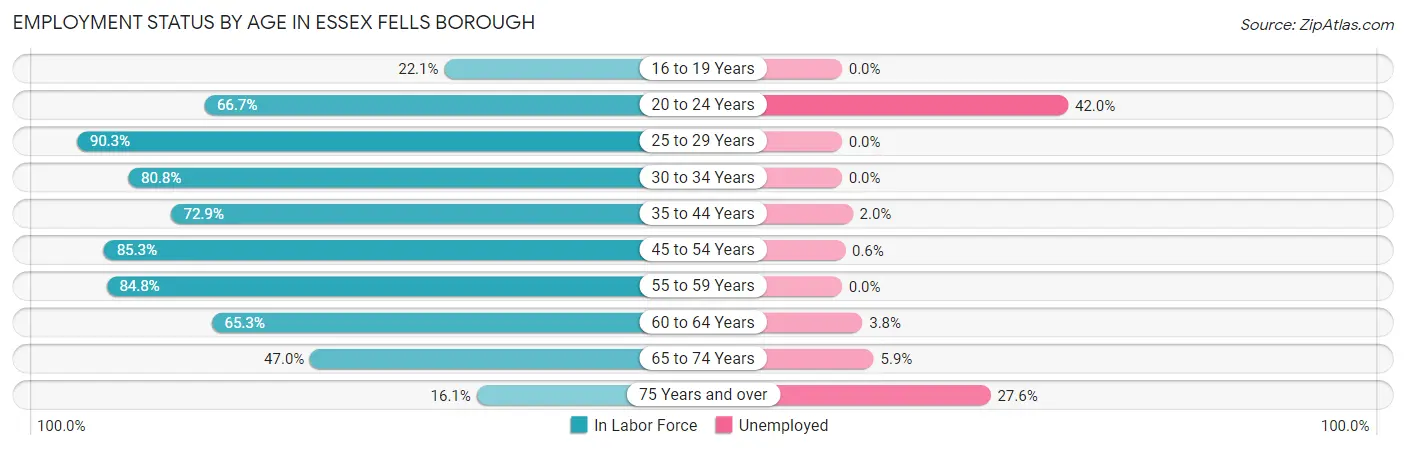
| Age Bracket | In Labor Force | Unemployed |
| 16 to 19 Years | 21 (22.1%) | 0 (0.0%) |
| 20 to 24 Years | 50 (66.7%) | 21 (42.0%) |
| 25 to 29 Years | 28 (90.3%) | 0 (0.0%) |
| 30 to 34 Years | 59 (80.8%) | 0 (0.0%) |
| 35 to 44 Years | 196 (72.9%) | 4 (2.0%) |
| 45 to 54 Years | 314 (85.3%) | 2 (0.6%) |
| 55 to 59 Years | 167 (84.8%) | 0 (0.0%) |
| 60 to 64 Years | 79 (65.3%) | 3 (3.8%) |
| 65 to 74 Years | 101 (47.0%) | 6 (5.9%) |
| 75 Years and over | 29 (16.1%) | 8 (27.6%) |
| Total | 1,044 (64.3%) | 44 (4.2%) |
Employment Status by Educational Attainment in Essex Fells borough
According to labor force statistics for Essex Fells borough, 79.6% of individuals (843) out of the total population between 25 and 64 years of age (1,059) are in the labor force, with 1.1% or 9 of them being unemployed. The group with the highest labor force participation rate are those with the educational attainment of less than high school, with 100.0% or 13 individuals in the labor force. Within the labor force, individuals with college / associate degree education have the highest percentage of unemployment, with 6.0% or 4 of them being unemployed.
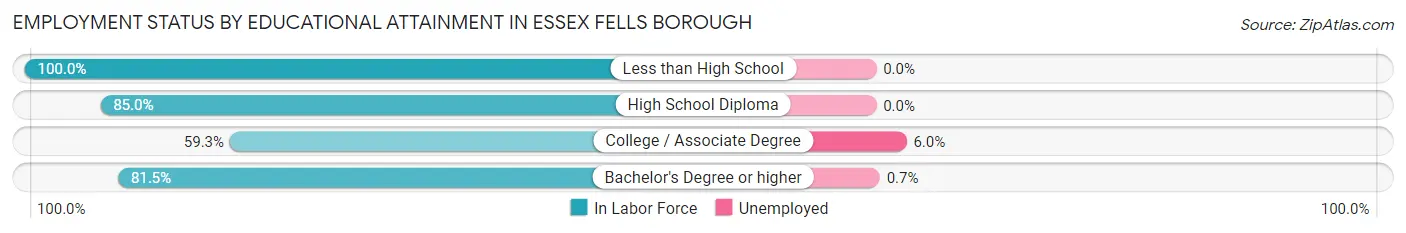
| Educational Attainment | In Labor Force | Unemployed |
| Less than High School | 13 (100.0%) | 0 (0.0%) |
| High School Diploma | 68 (85.0%) | 0 (0.0%) |
| College / Associate Degree | 67 (59.3%) | 7 (6.0%) |
| Bachelor's Degree or higher | 695 (81.5%) | 6 (0.7%) |
| Total | 843 (79.6%) | 12 (1.1%) |
Employment Occupations by Sex in Essex Fells borough
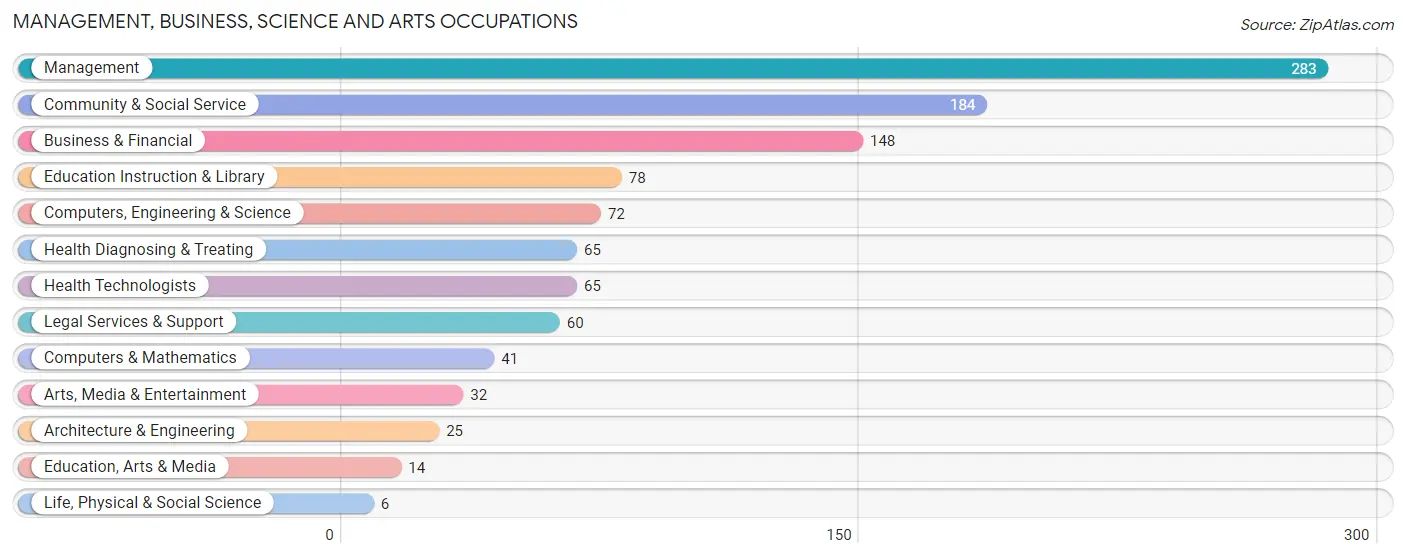
Management, Business, Science and Arts Occupations
The most common Management, Business, Science and Arts occupations in Essex Fells borough are Management (283 | 28.3%), Community & Social Service (184 | 18.4%), Business & Financial (148 | 14.8%), Education Instruction & Library (78 | 7.8%), and Computers, Engineering & Science (72 | 7.2%).
Management, Business, Science and Arts Occupations by Sex
Within the Management, Business, Science and Arts occupations in Essex Fells borough, the most male-oriented occupations are Life, Physical & Social Science (100.0%), Architecture & Engineering (88.0%), and Legal Services & Support (78.3%), while the most female-oriented occupations are Education, Arts & Media (78.6%), Education Instruction & Library (76.9%), and Arts, Media & Entertainment (62.5%).
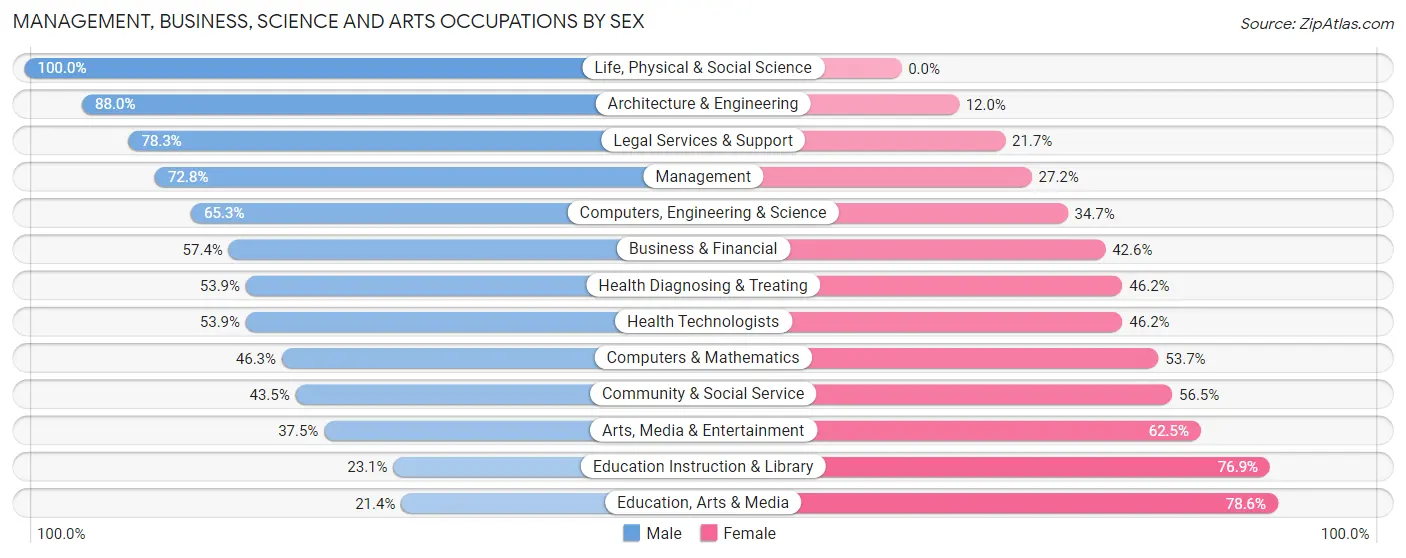
| Occupation | Male | Female |
| Management | 206 (72.8%) | 77 (27.2%) |
| Business & Financial | 85 (57.4%) | 63 (42.6%) |
| Computers, Engineering & Science | 47 (65.3%) | 25 (34.7%) |
| Computers & Mathematics | 19 (46.3%) | 22 (53.7%) |
| Architecture & Engineering | 22 (88.0%) | 3 (12.0%) |
| Life, Physical & Social Science | 6 (100.0%) | 0 (0.0%) |
| Community & Social Service | 80 (43.5%) | 104 (56.5%) |
| Education, Arts & Media | 3 (21.4%) | 11 (78.6%) |
| Legal Services & Support | 47 (78.3%) | 13 (21.7%) |
| Education Instruction & Library | 18 (23.1%) | 60 (76.9%) |
| Arts, Media & Entertainment | 12 (37.5%) | 20 (62.5%) |
| Health Diagnosing & Treating | 35 (53.8%) | 30 (46.2%) |
| Health Technologists | 35 (53.8%) | 30 (46.2%) |
| Total (Category) | 453 (60.2%) | 299 (39.8%) |
| Total (Overall) | 617 (61.7%) | 383 (38.3%) |
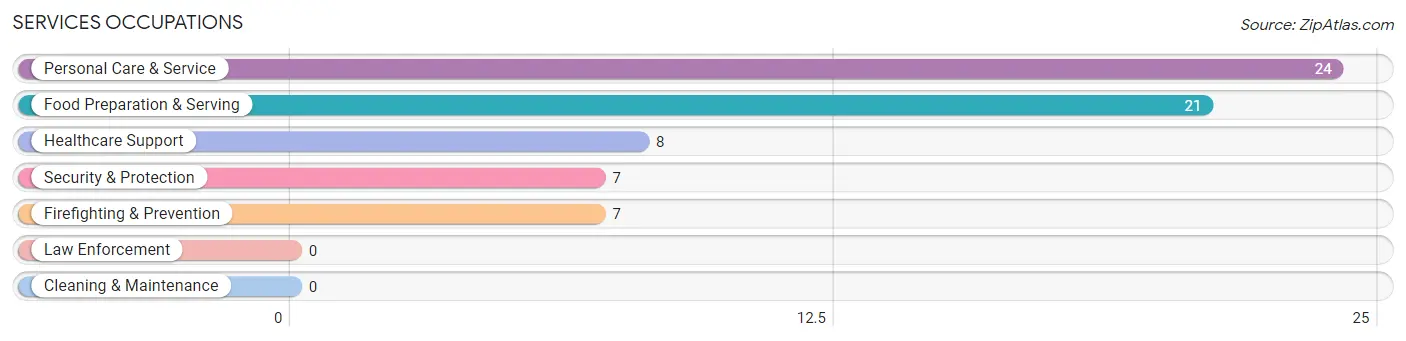
Services Occupations
The most common Services occupations in Essex Fells borough are Personal Care & Service (24 | 2.4%), Food Preparation & Serving (21 | 2.1%), Healthcare Support (8 | 0.8%), Security & Protection (7 | 0.7%), and Firefighting & Prevention (7 | 0.7%).
Services Occupations by Sex
Within the Services occupations in Essex Fells borough, the most male-oriented occupations are Food Preparation & Serving (61.9%), Security & Protection (57.1%), and Firefighting & Prevention (57.1%), while the most female-oriented occupations are Healthcare Support (100.0%), Personal Care & Service (75.0%), and Security & Protection (42.9%).
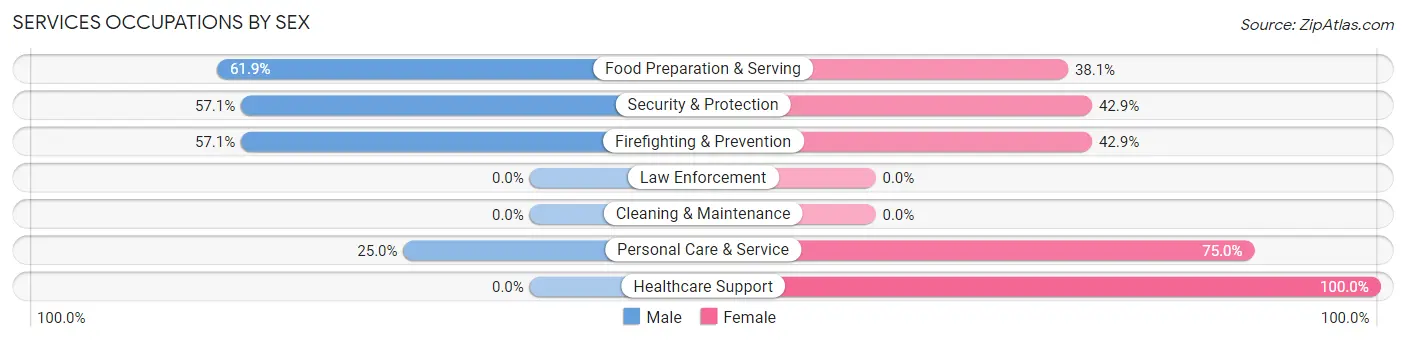
| Occupation | Male | Female |
| Healthcare Support | 0 (0.0%) | 8 (100.0%) |
| Security & Protection | 4 (57.1%) | 3 (42.9%) |
| Firefighting & Prevention | 4 (57.1%) | 3 (42.9%) |
| Law Enforcement | 0 (0.0%) | 0 (0.0%) |
| Food Preparation & Serving | 13 (61.9%) | 8 (38.1%) |
| Cleaning & Maintenance | 0 (0.0%) | 0 (0.0%) |
| Personal Care & Service | 6 (25.0%) | 18 (75.0%) |
| Total (Category) | 23 (38.3%) | 37 (61.7%) |
| Total (Overall) | 617 (61.7%) | 383 (38.3%) |
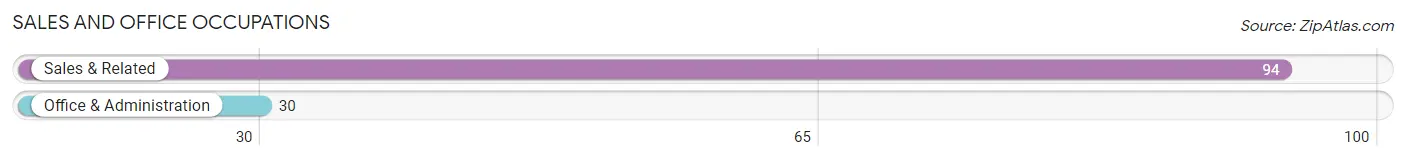
Sales and Office Occupations
The most common Sales and Office occupations in Essex Fells borough are Sales & Related (94 | 9.4%), and Office & Administration (30 | 3.0%).
Sales and Office Occupations by Sex
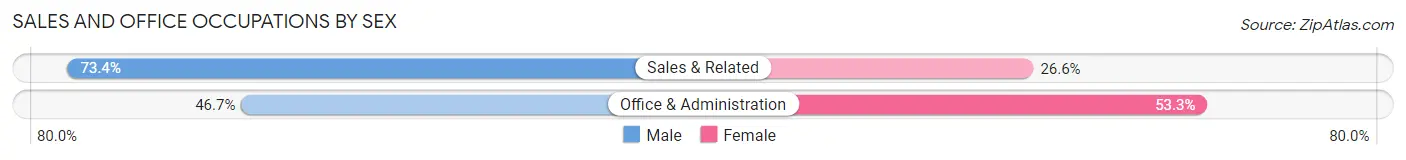
| Occupation | Male | Female |
| Sales & Related | 69 (73.4%) | 25 (26.6%) |
| Office & Administration | 14 (46.7%) | 16 (53.3%) |
| Total (Category) | 83 (66.9%) | 41 (33.1%) |
| Total (Overall) | 617 (61.7%) | 383 (38.3%) |
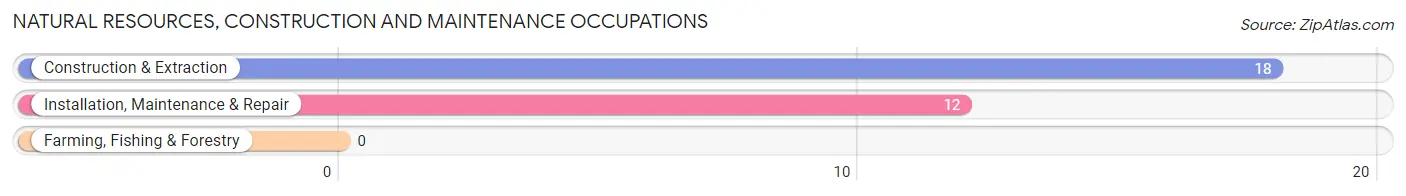
Natural Resources, Construction and Maintenance Occupations
The most common Natural Resources, Construction and Maintenance occupations in Essex Fells borough are Construction & Extraction (18 | 1.8%), and Installation, Maintenance & Repair (12 | 1.2%).
Natural Resources, Construction and Maintenance Occupations by Sex
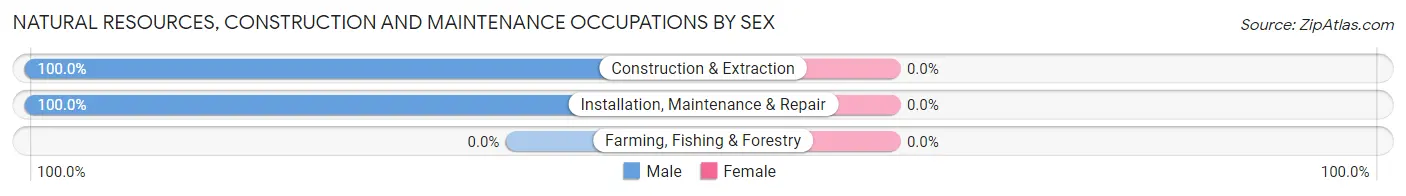
| Occupation | Male | Female |
| Farming, Fishing & Forestry | 0 (0.0%) | 0 (0.0%) |
| Construction & Extraction | 18 (100.0%) | 0 (0.0%) |
| Installation, Maintenance & Repair | 12 (100.0%) | 0 (0.0%) |
| Total (Category) | 30 (100.0%) | 0 (0.0%) |
| Total (Overall) | 617 (61.7%) | 383 (38.3%) |
Production, Transportation and Moving Occupations
The most common Production, Transportation and Moving occupations in Essex Fells borough are Production (17 | 1.7%), Transportation (9 | 0.9%), and Material Moving (8 | 0.8%).
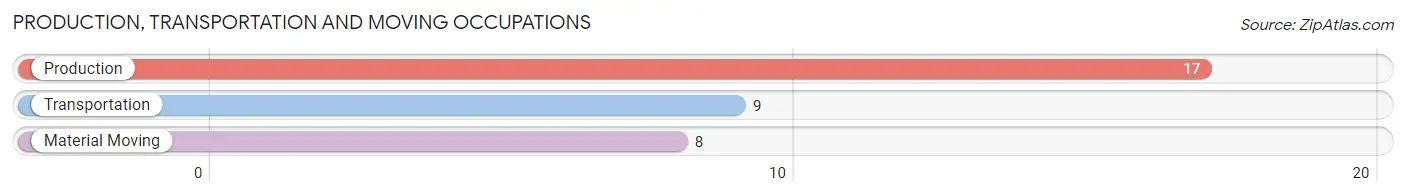
Production, Transportation and Moving Occupations by Sex
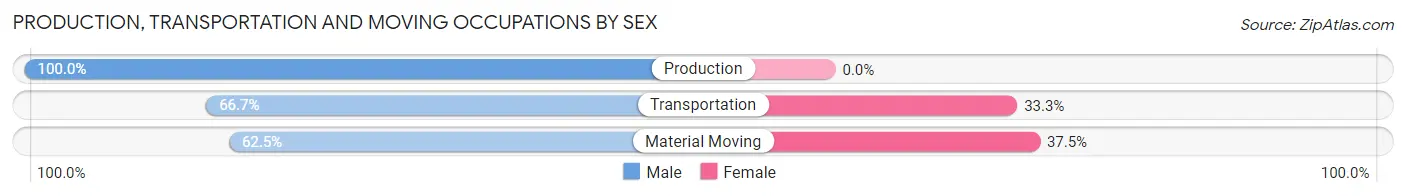
| Occupation | Male | Female |
| Production | 17 (100.0%) | 0 (0.0%) |
| Transportation | 6 (66.7%) | 3 (33.3%) |
| Material Moving | 5 (62.5%) | 3 (37.5%) |
| Total (Category) | 28 (82.4%) | 6 (17.6%) |
| Total (Overall) | 617 (61.7%) | 383 (38.3%) |
Employment Industries by Sex in Essex Fells borough
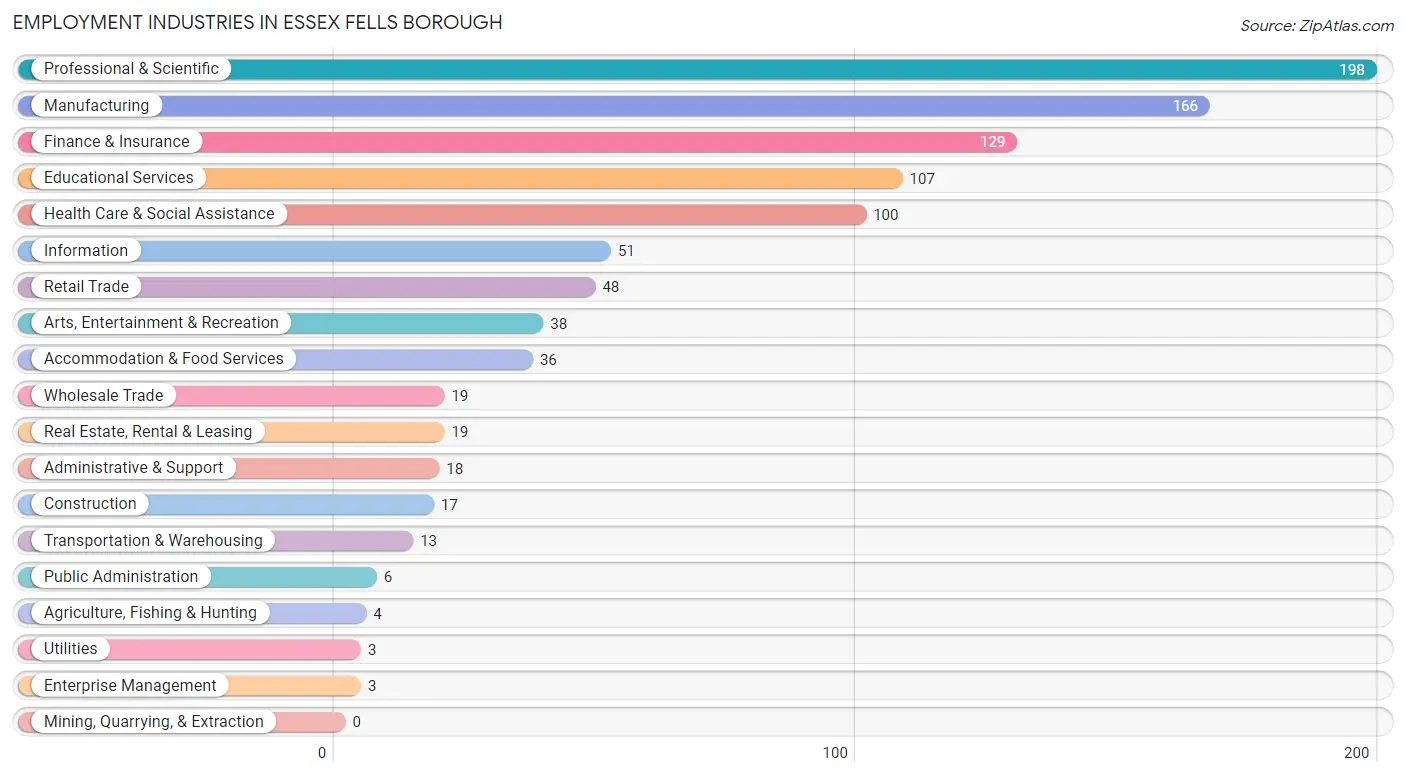
Employment Industries in Essex Fells borough
The major employment industries in Essex Fells borough include Professional & Scientific (198 | 19.8%), Manufacturing (166 | 16.6%), Finance & Insurance (129 | 12.9%), Educational Services (107 | 10.7%), and Health Care & Social Assistance (100 | 10.0%).
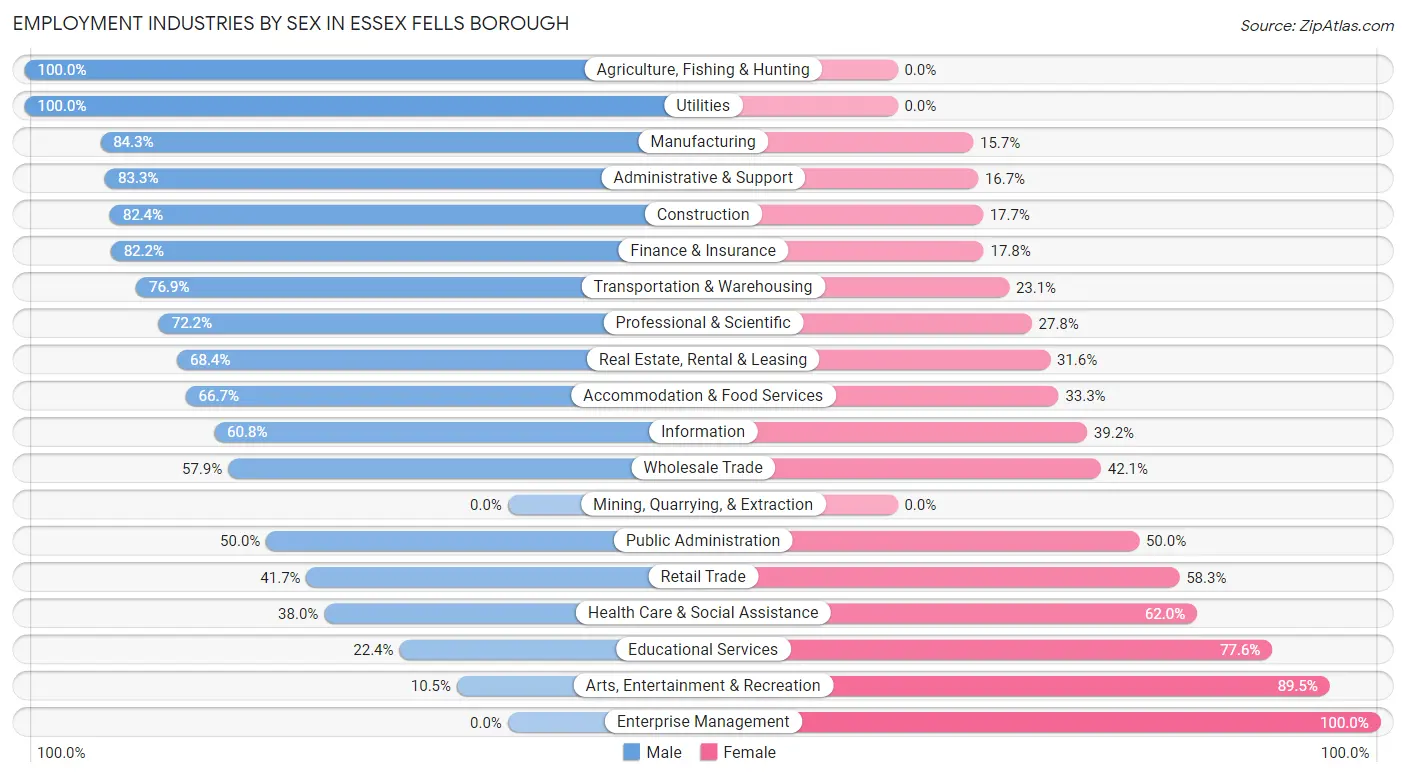
Employment Industries by Sex in Essex Fells borough
The Essex Fells borough industries that see more men than women are Agriculture, Fishing & Hunting (100.0%), Utilities (100.0%), and Manufacturing (84.3%), whereas the industries that tend to have a higher number of women are Enterprise Management (100.0%), Arts, Entertainment & Recreation (89.5%), and Educational Services (77.6%).
| Industry | Male | Female |
| Agriculture, Fishing & Hunting | 4 (100.0%) | 0 (0.0%) |
| Mining, Quarrying, & Extraction | 0 (0.0%) | 0 (0.0%) |
| Construction | 14 (82.4%) | 3 (17.6%) |
| Manufacturing | 140 (84.3%) | 26 (15.7%) |
| Wholesale Trade | 11 (57.9%) | 8 (42.1%) |
| Retail Trade | 20 (41.7%) | 28 (58.3%) |
| Transportation & Warehousing | 10 (76.9%) | 3 (23.1%) |
| Utilities | 3 (100.0%) | 0 (0.0%) |
| Information | 31 (60.8%) | 20 (39.2%) |
| Finance & Insurance | 106 (82.2%) | 23 (17.8%) |
| Real Estate, Rental & Leasing | 13 (68.4%) | 6 (31.6%) |
| Professional & Scientific | 143 (72.2%) | 55 (27.8%) |
| Enterprise Management | 0 (0.0%) | 3 (100.0%) |
| Administrative & Support | 15 (83.3%) | 3 (16.7%) |
| Educational Services | 24 (22.4%) | 83 (77.6%) |
| Health Care & Social Assistance | 38 (38.0%) | 62 (62.0%) |
| Arts, Entertainment & Recreation | 4 (10.5%) | 34 (89.5%) |
| Accommodation & Food Services | 24 (66.7%) | 12 (33.3%) |
| Public Administration | 3 (50.0%) | 3 (50.0%) |
| Total | 617 (61.7%) | 383 (38.3%) |
Education in Essex Fells borough
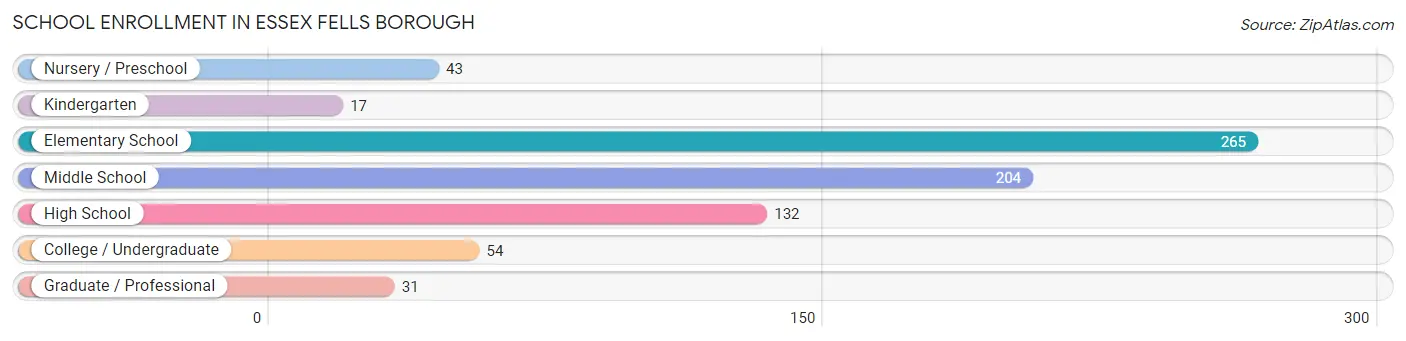
School Enrollment in Essex Fells borough
The most common levels of schooling among the 746 students in Essex Fells borough are elementary school (265 | 35.5%), middle school (204 | 27.4%), and high school (132 | 17.7%).
| School Level | # Students | % Students |
| Nursery / Preschool | 43 | 5.8% |
| Kindergarten | 17 | 2.3% |
| Elementary School | 265 | 35.5% |
| Middle School | 204 | 27.4% |
| High School | 132 | 17.7% |
| College / Undergraduate | 54 | 7.2% |
| Graduate / Professional | 31 | 4.2% |
| Total | 746 | 100.0% |
School Enrollment by Age by Funding Source in Essex Fells borough
Out of a total of 746 students who are enrolled in schools in Essex Fells borough, 136 (18.2%) attend a private institution, while the remaining 610 (81.8%) are enrolled in public schools. The age group of 20 to 24 year olds has the highest likelihood of being enrolled in private schools, with 18 (48.6% in the age bracket) enrolled. Conversely, the age group of 25 to 34 year olds has the lowest likelihood of being enrolled in a private school, with 4 (100.0% in the age bracket) attending a public institution.
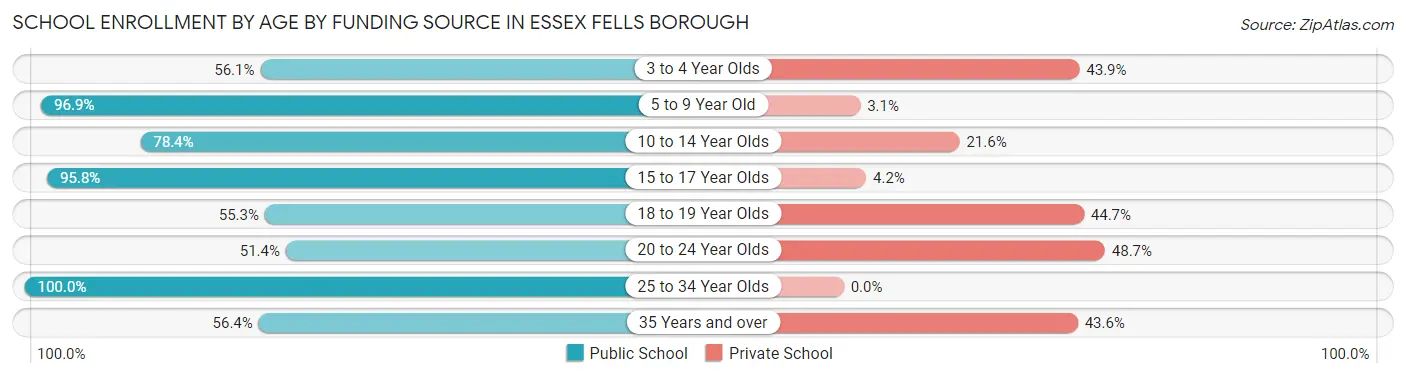
| Age Bracket | Public School | Private School |
| 3 to 4 Year Olds | 23 (56.1%) | 18 (43.9%) |
| 5 to 9 Year Old | 252 (96.9%) | 8 (3.1%) |
| 10 to 14 Year Olds | 200 (78.4%) | 55 (21.6%) |
| 15 to 17 Year Olds | 69 (95.8%) | 3 (4.2%) |
| 18 to 19 Year Olds | 21 (55.3%) | 17 (44.7%) |
| 20 to 24 Year Olds | 19 (51.3%) | 18 (48.6%) |
| 25 to 34 Year Olds | 4 (100.0%) | 0 (0.0%) |
| 35 Years and over | 22 (56.4%) | 17 (43.6%) |
| Total | 610 (81.8%) | 136 (18.2%) |
Educational Attainment by Field of Study in Essex Fells borough
Business (313 | 25.7%), social sciences (154 | 12.6%), education (124 | 10.2%), bio, nature & agricultural (108 | 8.9%), and literature & languages (91 | 7.5%) are the most common fields of study among 1,218 individuals in Essex Fells borough who have obtained a bachelor's degree or higher.
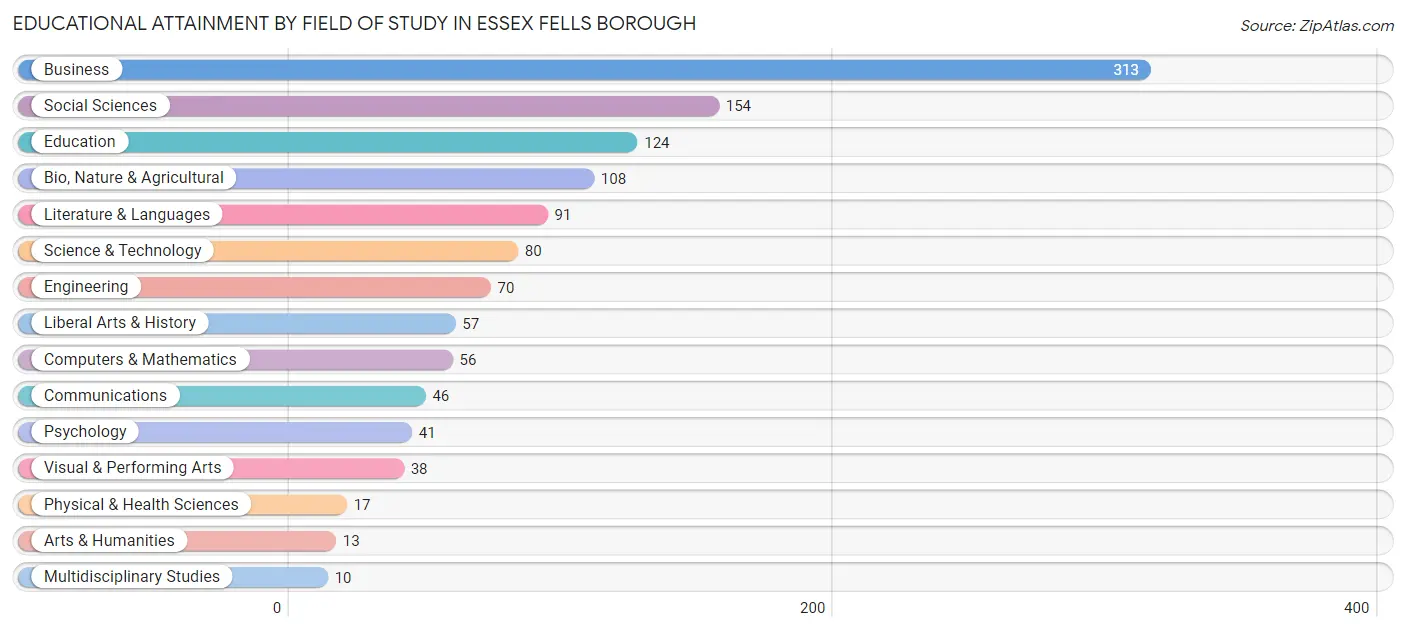
| Field of Study | # Graduates | % Graduates |
| Computers & Mathematics | 56 | 4.6% |
| Bio, Nature & Agricultural | 108 | 8.9% |
| Physical & Health Sciences | 17 | 1.4% |
| Psychology | 41 | 3.4% |
| Social Sciences | 154 | 12.6% |
| Engineering | 70 | 5.8% |
| Multidisciplinary Studies | 10 | 0.8% |
| Science & Technology | 80 | 6.6% |
| Business | 313 | 25.7% |
| Education | 124 | 10.2% |
| Literature & Languages | 91 | 7.5% |
| Liberal Arts & History | 57 | 4.7% |
| Visual & Performing Arts | 38 | 3.1% |
| Communications | 46 | 3.8% |
| Arts & Humanities | 13 | 1.1% |
| Total | 1,218 | 100.0% |
Transportation & Commute in Essex Fells borough
Vehicle Availability by Sex in Essex Fells borough
The most prevalent vehicle ownership categories in Essex Fells borough are males with 2 vehicles (335, accounting for 54.3%) and females with 2 vehicles (194, making up 89.1%).
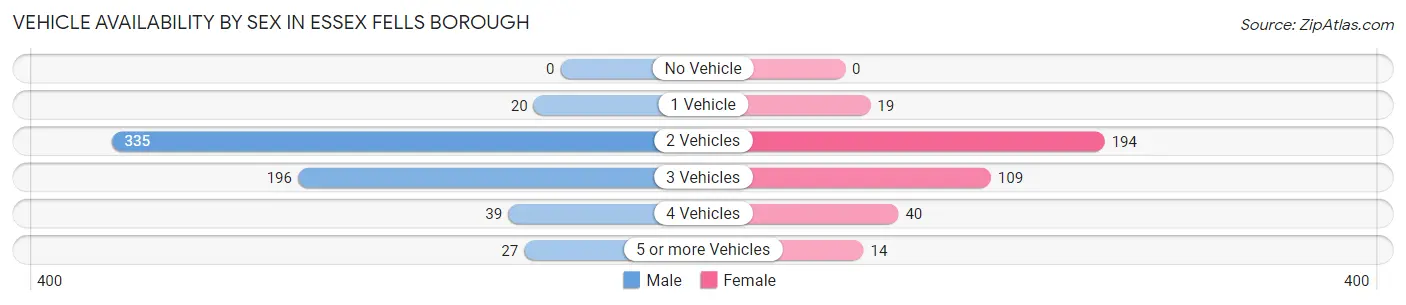
| Vehicles Available | Male | Female |
| No Vehicle | 0 (0.0%) | 0 (0.0%) |
| 1 Vehicle | 20 (3.2%) | 19 (5.1%) |
| 2 Vehicles | 335 (54.3%) | 194 (51.6%) |
| 3 Vehicles | 196 (31.8%) | 109 (29.0%) |
| 4 Vehicles | 39 (6.3%) | 40 (10.6%) |
| 5 or more Vehicles | 27 (4.4%) | 14 (3.7%) |
| Total | 617 (100.0%) | 376 (100.0%) |
Commute Time in Essex Fells borough
The most frequently occuring commute durations in Essex Fells borough are 15 to 19 minutes (116 commuters, 16.4%), 10 to 14 minutes (101 commuters, 14.3%), and 45 to 59 minutes (84 commuters, 11.9%).
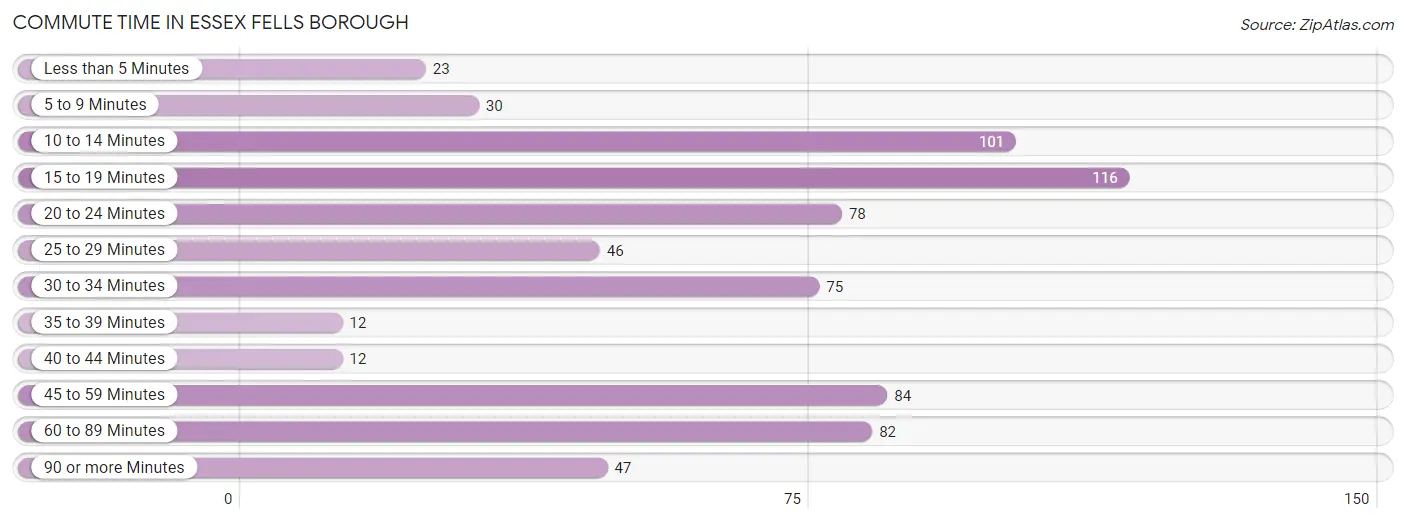
| Commute Time | # Commuters | % Commuters |
| Less than 5 Minutes | 23 | 3.3% |
| 5 to 9 Minutes | 30 | 4.3% |
| 10 to 14 Minutes | 101 | 14.3% |
| 15 to 19 Minutes | 116 | 16.4% |
| 20 to 24 Minutes | 78 | 11.1% |
| 25 to 29 Minutes | 46 | 6.5% |
| 30 to 34 Minutes | 75 | 10.6% |
| 35 to 39 Minutes | 12 | 1.7% |
| 40 to 44 Minutes | 12 | 1.7% |
| 45 to 59 Minutes | 84 | 11.9% |
| 60 to 89 Minutes | 82 | 11.6% |
| 90 or more Minutes | 47 | 6.7% |
Commute Time by Sex in Essex Fells borough
The most common commute times in Essex Fells borough are 45 to 59 minutes (68 commuters, 15.3%) for males and 15 to 19 minutes (55 commuters, 21.0%) for females.
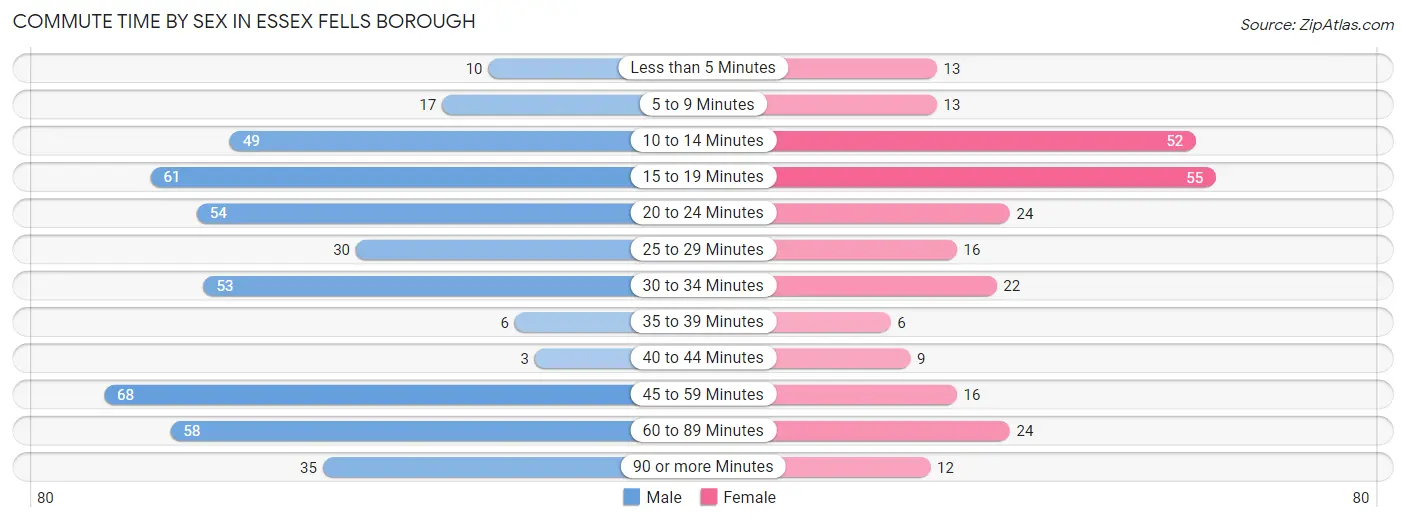
| Commute Time | Male | Female |
| Less than 5 Minutes | 10 (2.2%) | 13 (5.0%) |
| 5 to 9 Minutes | 17 (3.8%) | 13 (5.0%) |
| 10 to 14 Minutes | 49 (11.0%) | 52 (19.9%) |
| 15 to 19 Minutes | 61 (13.7%) | 55 (21.0%) |
| 20 to 24 Minutes | 54 (12.2%) | 24 (9.2%) |
| 25 to 29 Minutes | 30 (6.8%) | 16 (6.1%) |
| 30 to 34 Minutes | 53 (11.9%) | 22 (8.4%) |
| 35 to 39 Minutes | 6 (1.3%) | 6 (2.3%) |
| 40 to 44 Minutes | 3 (0.7%) | 9 (3.4%) |
| 45 to 59 Minutes | 68 (15.3%) | 16 (6.1%) |
| 60 to 89 Minutes | 58 (13.1%) | 24 (9.2%) |
| 90 or more Minutes | 35 (7.9%) | 12 (4.6%) |
Time of Departure to Work by Sex in Essex Fells borough
The most frequent times of departure to work in Essex Fells borough are 8:00 AM to 8:29 AM (83, 18.7%) for males and 8:30 AM to 8:59 AM (45, 17.2%) for females.
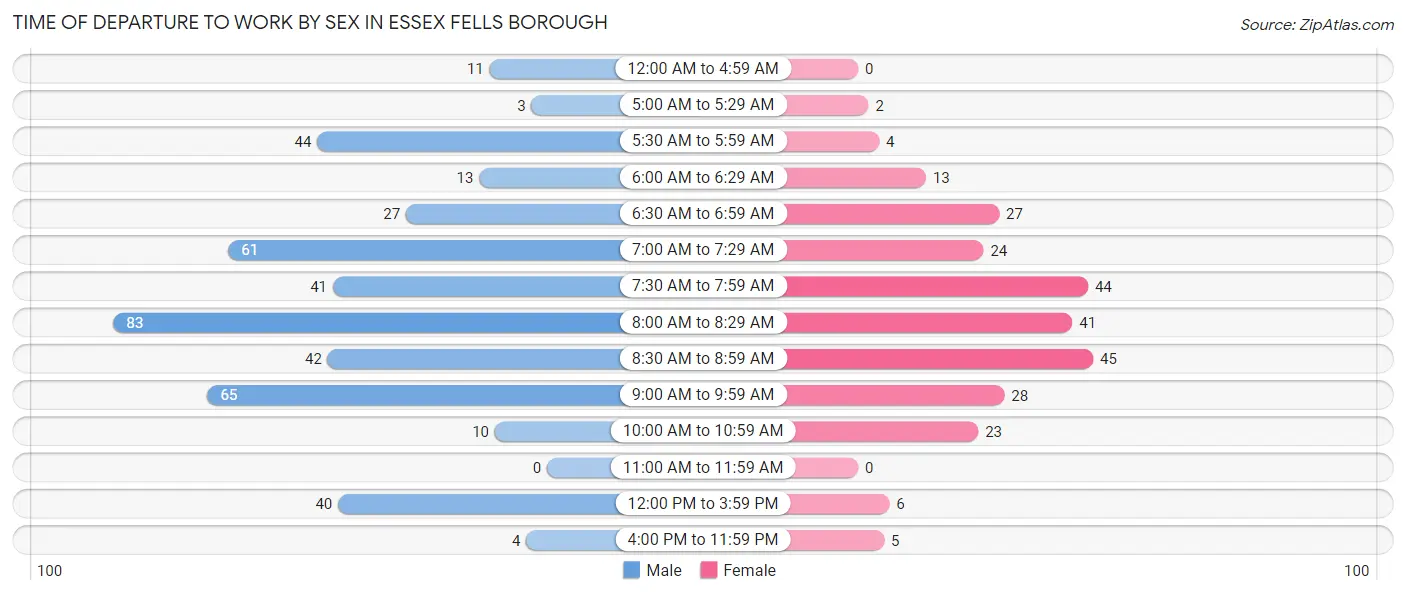
| Time of Departure | Male | Female |
| 12:00 AM to 4:59 AM | 11 (2.5%) | 0 (0.0%) |
| 5:00 AM to 5:29 AM | 3 (0.7%) | 2 (0.8%) |
| 5:30 AM to 5:59 AM | 44 (9.9%) | 4 (1.5%) |
| 6:00 AM to 6:29 AM | 13 (2.9%) | 13 (5.0%) |
| 6:30 AM to 6:59 AM | 27 (6.1%) | 27 (10.3%) |
| 7:00 AM to 7:29 AM | 61 (13.7%) | 24 (9.2%) |
| 7:30 AM to 7:59 AM | 41 (9.2%) | 44 (16.8%) |
| 8:00 AM to 8:29 AM | 83 (18.7%) | 41 (15.7%) |
| 8:30 AM to 8:59 AM | 42 (9.5%) | 45 (17.2%) |
| 9:00 AM to 9:59 AM | 65 (14.6%) | 28 (10.7%) |
| 10:00 AM to 10:59 AM | 10 (2.2%) | 23 (8.8%) |
| 11:00 AM to 11:59 AM | 0 (0.0%) | 0 (0.0%) |
| 12:00 PM to 3:59 PM | 40 (9.0%) | 6 (2.3%) |
| 4:00 PM to 11:59 PM | 4 (0.9%) | 5 (1.9%) |
| Total | 444 (100.0%) | 262 (100.0%) |
Housing Occupancy in Essex Fells borough
Occupancy by Ownership in Essex Fells borough
Of the total 726 dwellings in Essex Fells borough, owner-occupied units account for 707 (97.4%), while renter-occupied units make up 19 (2.6%).
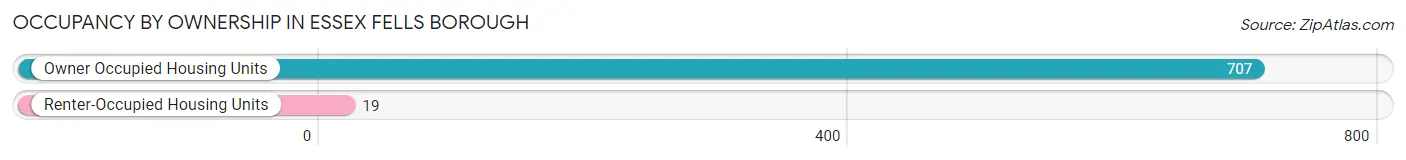
| Occupancy | # Housing Units | % Housing Units |
| Owner Occupied Housing Units | 707 | 97.4% |
| Renter-Occupied Housing Units | 19 | 2.6% |
| Total Occupied Housing Units | 726 | 100.0% |
Occupancy by Household Size in Essex Fells borough
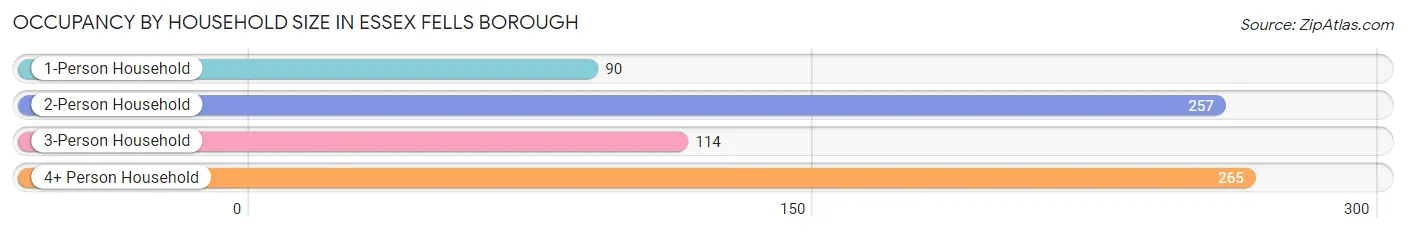
| Household Size | # Housing Units | % Housing Units |
| 1-Person Household | 90 | 12.4% |
| 2-Person Household | 257 | 35.4% |
| 3-Person Household | 114 | 15.7% |
| 4+ Person Household | 265 | 36.5% |
| Total Housing Units | 726 | 100.0% |
Occupancy by Ownership by Household Size in Essex Fells borough
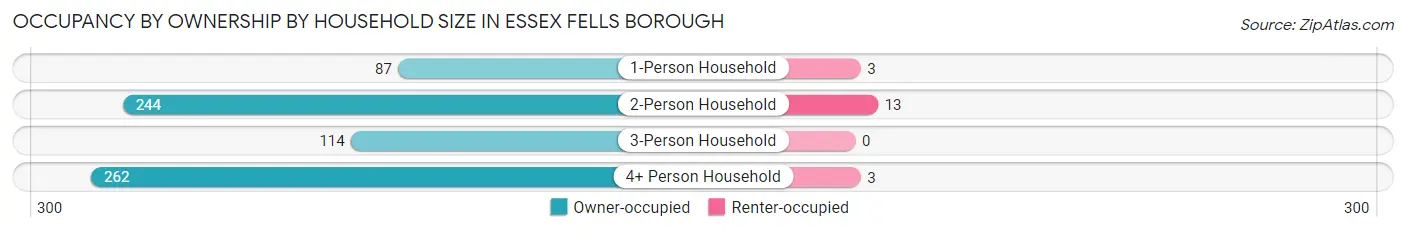
| Household Size | Owner-occupied | Renter-occupied |
| 1-Person Household | 87 (96.7%) | 3 (3.3%) |
| 2-Person Household | 244 (94.9%) | 13 (5.1%) |
| 3-Person Household | 114 (100.0%) | 0 (0.0%) |
| 4+ Person Household | 262 (98.9%) | 3 (1.1%) |
| Total Housing Units | 707 (97.4%) | 19 (2.6%) |
Occupancy by Educational Attainment in Essex Fells borough
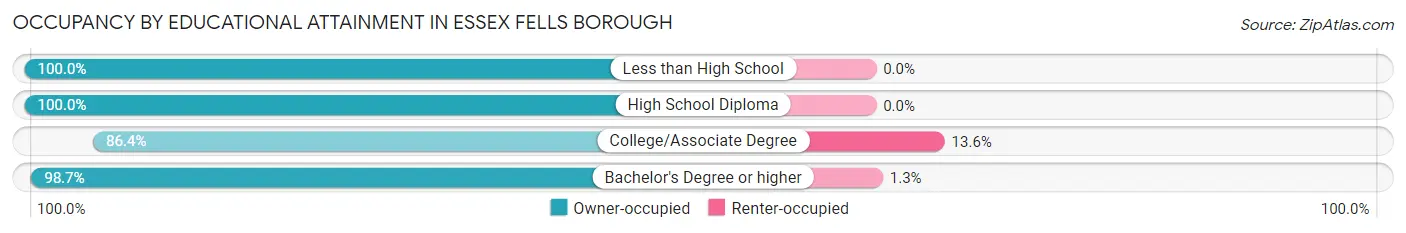
| Household Size | Owner-occupied | Renter-occupied |
| Less than High School | 10 (100.0%) | 0 (0.0%) |
| High School Diploma | 34 (100.0%) | 0 (0.0%) |
| College/Associate Degree | 70 (86.4%) | 11 (13.6%) |
| Bachelor's Degree or higher | 593 (98.7%) | 8 (1.3%) |
Occupancy by Age of Householder in Essex Fells borough
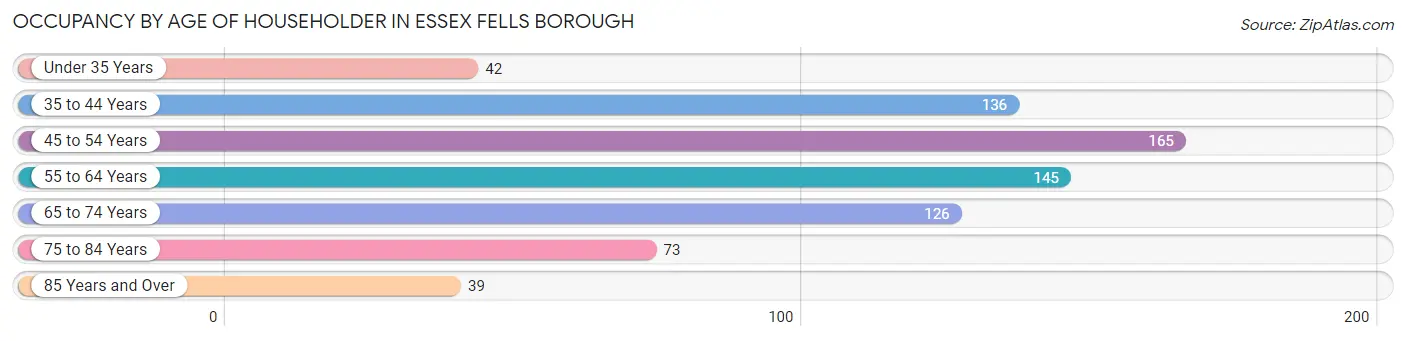
| Age Bracket | # Households | % Households |
| Under 35 Years | 42 | 5.8% |
| 35 to 44 Years | 136 | 18.7% |
| 45 to 54 Years | 165 | 22.7% |
| 55 to 64 Years | 145 | 20.0% |
| 65 to 74 Years | 126 | 17.4% |
| 75 to 84 Years | 73 | 10.1% |
| 85 Years and Over | 39 | 5.4% |
| Total | 726 | 100.0% |
Housing Finances in Essex Fells borough
Median Income by Occupancy in Essex Fells borough
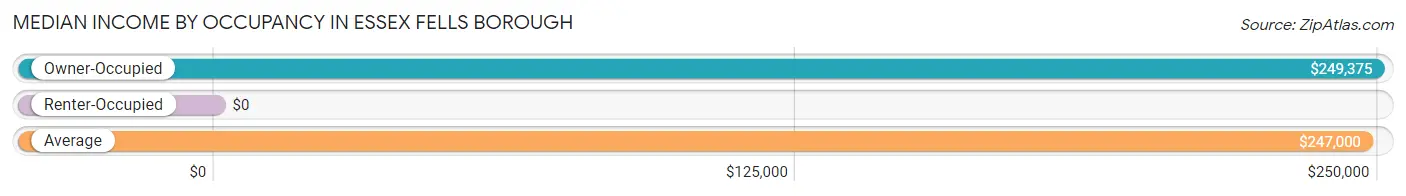
| Occupancy Type | # Households | Median Income |
| Owner-Occupied | 707 (97.4%) | $249,375 |
| Renter-Occupied | 19 (2.6%) | $0 |
| Average | 726 (100.0%) | $247,000 |
Occupancy by Householder Income Bracket in Essex Fells borough
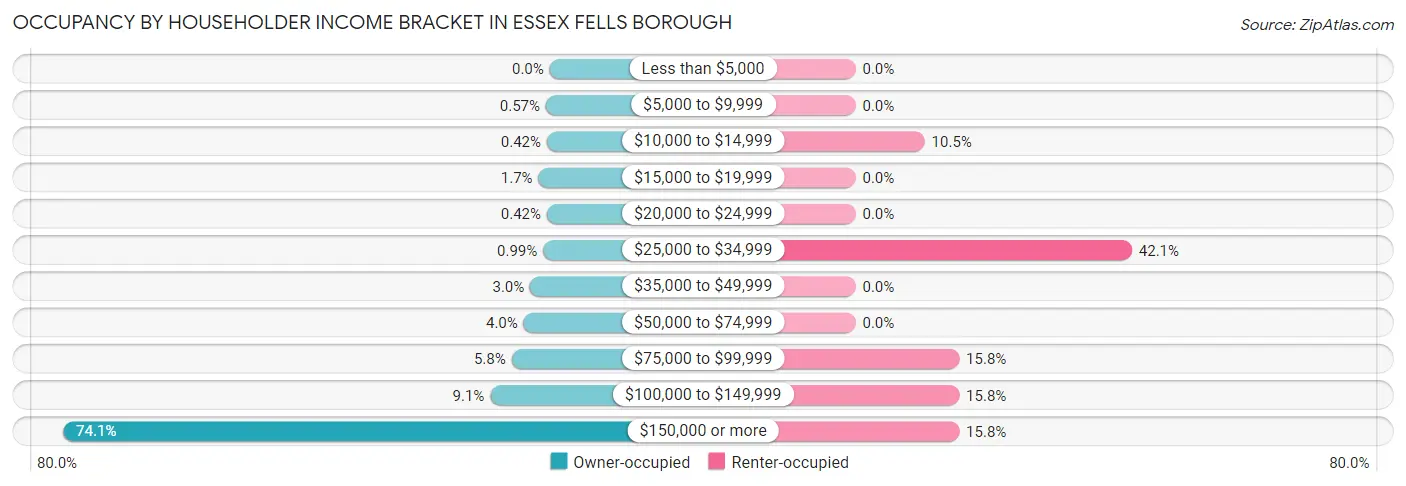
| Income Bracket | Owner-occupied | Renter-occupied |
| Less than $5,000 | 0 (0.0%) | 0 (0.0%) |
| $5,000 to $9,999 | 4 (0.6%) | 0 (0.0%) |
| $10,000 to $14,999 | 3 (0.4%) | 2 (10.5%) |
| $15,000 to $19,999 | 12 (1.7%) | 0 (0.0%) |
| $20,000 to $24,999 | 3 (0.4%) | 0 (0.0%) |
| $25,000 to $34,999 | 7 (1.0%) | 8 (42.1%) |
| $35,000 to $49,999 | 21 (3.0%) | 0 (0.0%) |
| $50,000 to $74,999 | 28 (4.0%) | 0 (0.0%) |
| $75,000 to $99,999 | 41 (5.8%) | 3 (15.8%) |
| $100,000 to $149,999 | 64 (9.0%) | 3 (15.8%) |
| $150,000 or more | 524 (74.1%) | 3 (15.8%) |
| Total | 707 (100.0%) | 19 (100.0%) |
Monthly Housing Cost Tiers in Essex Fells borough
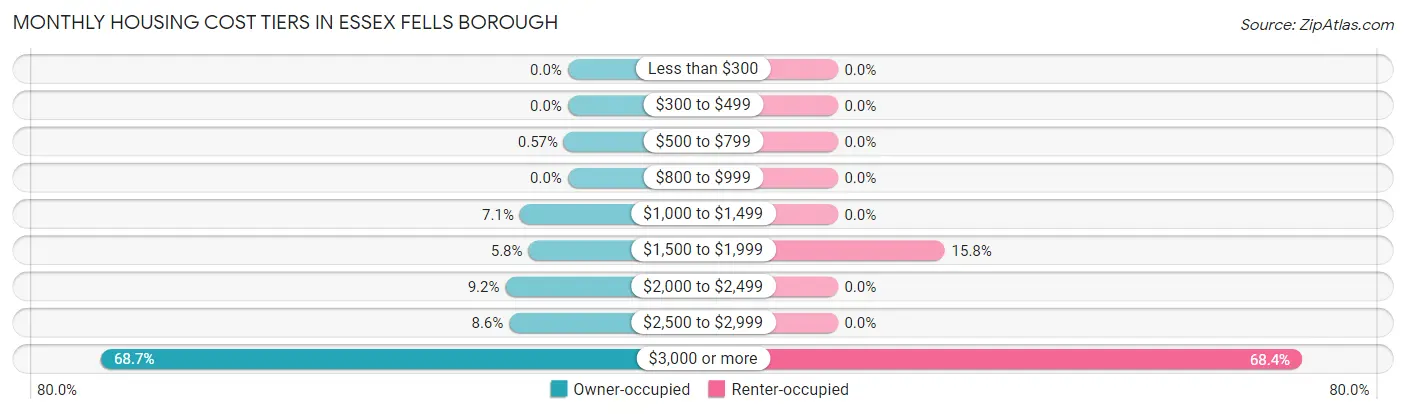
| Monthly Cost | Owner-occupied | Renter-occupied |
| Less than $300 | 0 (0.0%) | 0 (0.0%) |
| $300 to $499 | 0 (0.0%) | 0 (0.0%) |
| $500 to $799 | 4 (0.6%) | 0 (0.0%) |
| $800 to $999 | 0 (0.0%) | 0 (0.0%) |
| $1,000 to $1,499 | 50 (7.1%) | 0 (0.0%) |
| $1,500 to $1,999 | 41 (5.8%) | 3 (15.8%) |
| $2,000 to $2,499 | 65 (9.2%) | 0 (0.0%) |
| $2,500 to $2,999 | 61 (8.6%) | 0 (0.0%) |
| $3,000 or more | 486 (68.7%) | 13 (68.4%) |
| Total | 707 (100.0%) | 19 (100.0%) |
Physical Housing Characteristics in Essex Fells borough
Housing Structures in Essex Fells borough
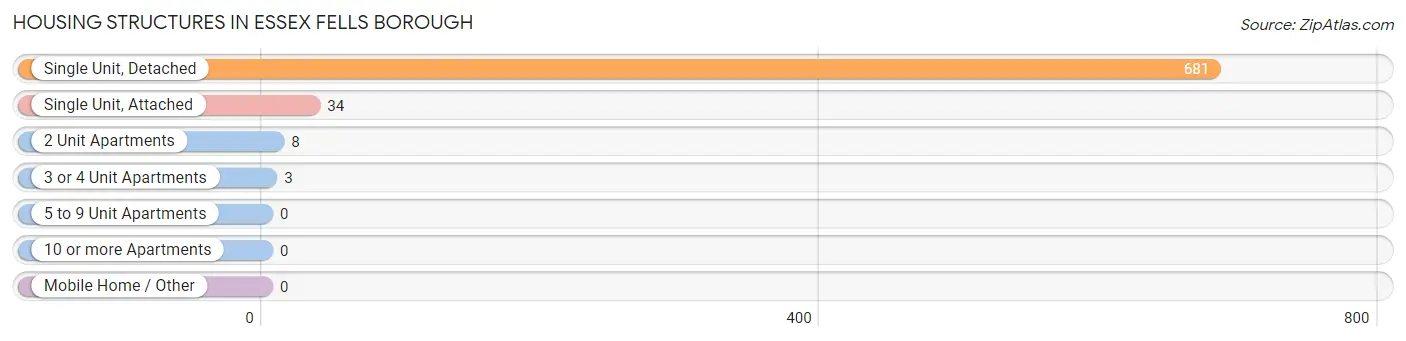
| Structure Type | # Housing Units | % Housing Units |
| Single Unit, Detached | 681 | 93.8% |
| Single Unit, Attached | 34 | 4.7% |
| 2 Unit Apartments | 8 | 1.1% |
| 3 or 4 Unit Apartments | 3 | 0.4% |
| 5 to 9 Unit Apartments | 0 | 0.0% |
| 10 or more Apartments | 0 | 0.0% |
| Mobile Home / Other | 0 | 0.0% |
| Total | 726 | 100.0% |
Housing Structures by Occupancy in Essex Fells borough
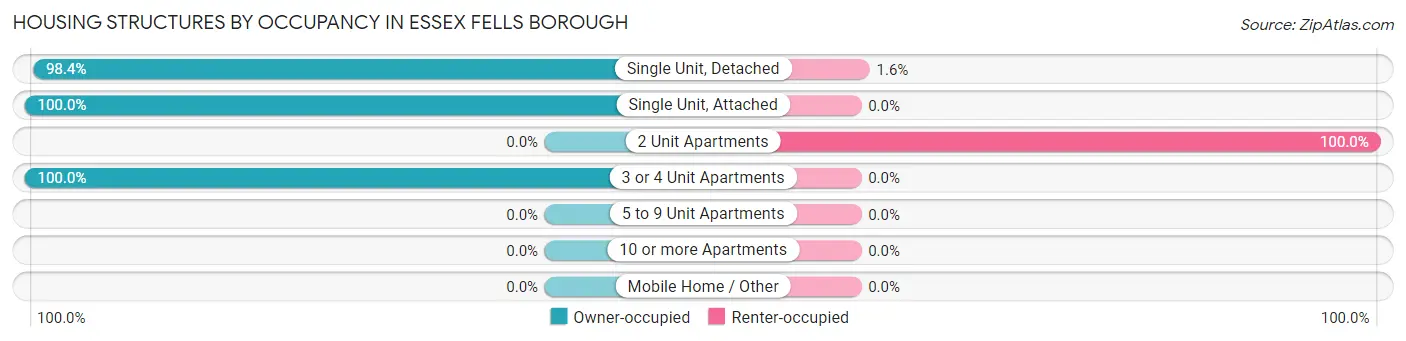
| Structure Type | Owner-occupied | Renter-occupied |
| Single Unit, Detached | 670 (98.4%) | 11 (1.6%) |
| Single Unit, Attached | 34 (100.0%) | 0 (0.0%) |
| 2 Unit Apartments | 0 (0.0%) | 8 (100.0%) |
| 3 or 4 Unit Apartments | 3 (100.0%) | 0 (0.0%) |
| 5 to 9 Unit Apartments | 0 (0.0%) | 0 (0.0%) |
| 10 or more Apartments | 0 (0.0%) | 0 (0.0%) |
| Mobile Home / Other | 0 (0.0%) | 0 (0.0%) |
| Total | 707 (97.4%) | 19 (2.6%) |
Housing Structures by Number of Rooms in Essex Fells borough
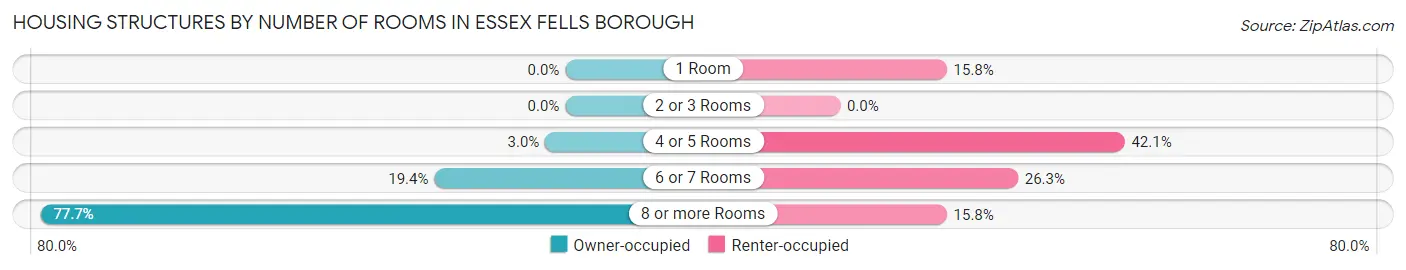
| Number of Rooms | Owner-occupied | Renter-occupied |
| 1 Room | 0 (0.0%) | 3 (15.8%) |
| 2 or 3 Rooms | 0 (0.0%) | 0 (0.0%) |
| 4 or 5 Rooms | 21 (3.0%) | 8 (42.1%) |
| 6 or 7 Rooms | 137 (19.4%) | 5 (26.3%) |
| 8 or more Rooms | 549 (77.6%) | 3 (15.8%) |
| Total | 707 (100.0%) | 19 (100.0%) |
Housing Structure by Heating Type in Essex Fells borough
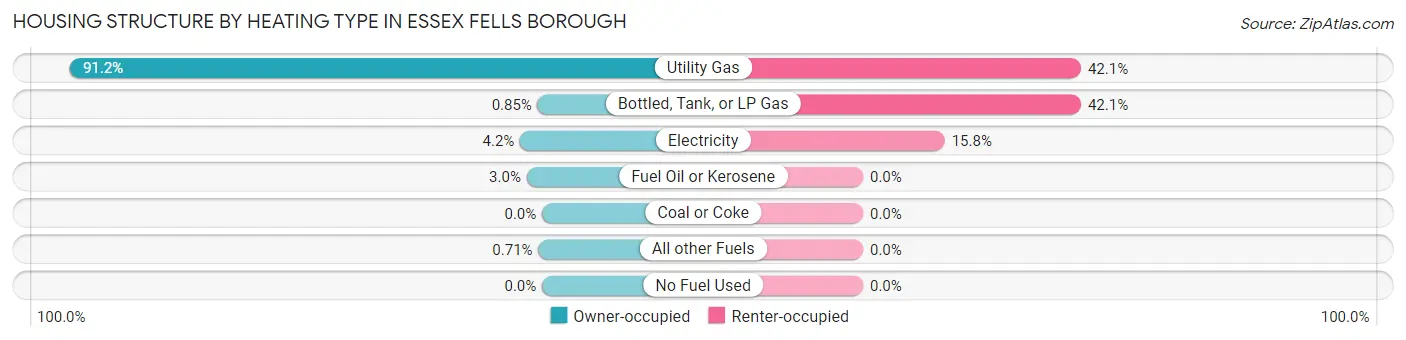
| Heating Type | Owner-occupied | Renter-occupied |
| Utility Gas | 645 (91.2%) | 8 (42.1%) |
| Bottled, Tank, or LP Gas | 6 (0.9%) | 8 (42.1%) |
| Electricity | 30 (4.2%) | 3 (15.8%) |
| Fuel Oil or Kerosene | 21 (3.0%) | 0 (0.0%) |
| Coal or Coke | 0 (0.0%) | 0 (0.0%) |
| All other Fuels | 5 (0.7%) | 0 (0.0%) |
| No Fuel Used | 0 (0.0%) | 0 (0.0%) |
| Total | 707 (100.0%) | 19 (100.0%) |
Household Vehicle Usage in Essex Fells borough
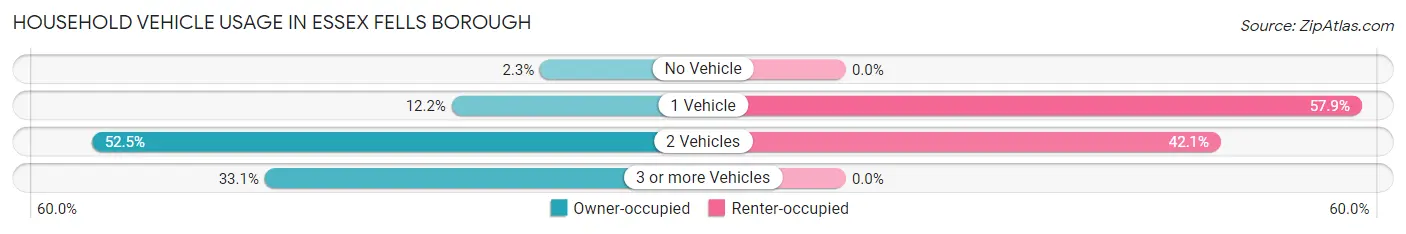
| Vehicles per Household | Owner-occupied | Renter-occupied |
| No Vehicle | 16 (2.3%) | 0 (0.0%) |
| 1 Vehicle | 86 (12.2%) | 11 (57.9%) |
| 2 Vehicles | 371 (52.5%) | 8 (42.1%) |
| 3 or more Vehicles | 234 (33.1%) | 0 (0.0%) |
| Total | 707 (100.0%) | 19 (100.0%) |
Real Estate & Mortgages in Essex Fells borough
Real Estate and Mortgage Overview in Essex Fells borough
| Characteristic | Without Mortgage | With Mortgage |
| Housing Units | 221 | 486 |
| Median Property Value | $893,500 | $952,900 |
| Median Household Income | $216,696 | $384 |
| Monthly Housing Costs | $1,501 | $434 |
| Real Estate Taxes | $10,001 | $0 |
Property Value by Mortgage Status in Essex Fells borough
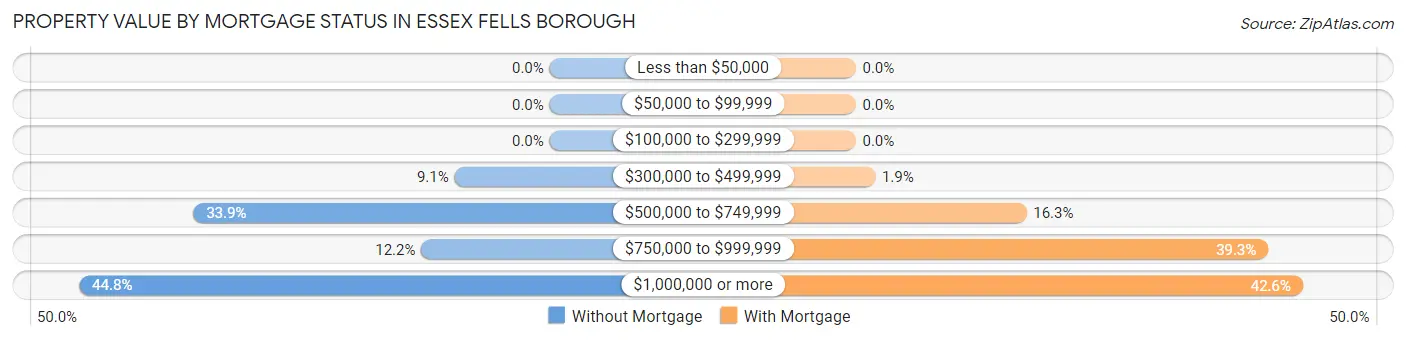
| Property Value | Without Mortgage | With Mortgage |
| Less than $50,000 | 0 (0.0%) | 0 (0.0%) |
| $50,000 to $99,999 | 0 (0.0%) | 0 (0.0%) |
| $100,000 to $299,999 | 0 (0.0%) | 0 (0.0%) |
| $300,000 to $499,999 | 20 (9.0%) | 9 (1.8%) |
| $500,000 to $749,999 | 75 (33.9%) | 79 (16.3%) |
| $750,000 to $999,999 | 27 (12.2%) | 191 (39.3%) |
| $1,000,000 or more | 99 (44.8%) | 207 (42.6%) |
| Total | 221 (100.0%) | 486 (100.0%) |
Household Income by Mortgage Status in Essex Fells borough
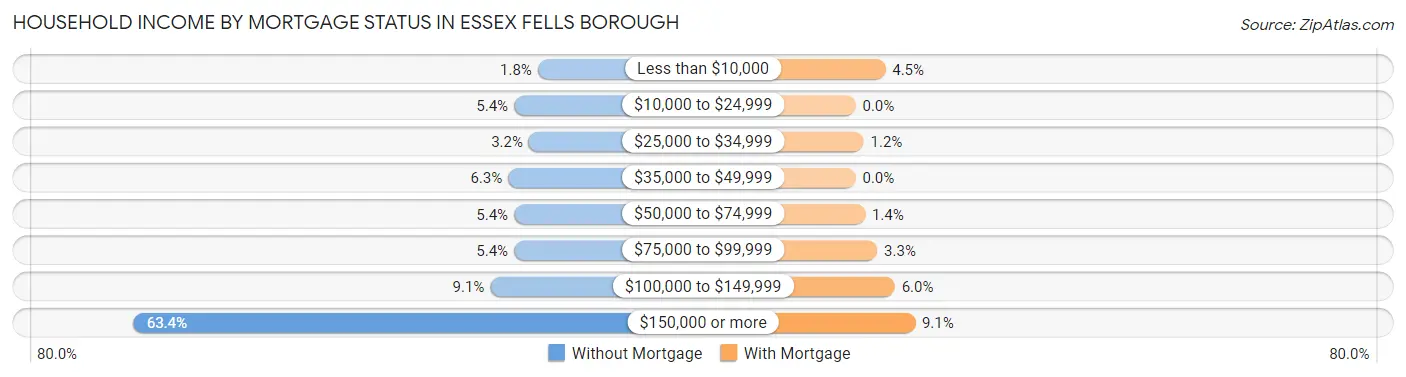
| Household Income | Without Mortgage | With Mortgage |
| Less than $10,000 | 4 (1.8%) | 22 (4.5%) |
| $10,000 to $24,999 | 12 (5.4%) | 0 (0.0%) |
| $25,000 to $34,999 | 7 (3.2%) | 6 (1.2%) |
| $35,000 to $49,999 | 14 (6.3%) | 0 (0.0%) |
| $50,000 to $74,999 | 12 (5.4%) | 7 (1.4%) |
| $75,000 to $99,999 | 12 (5.4%) | 16 (3.3%) |
| $100,000 to $149,999 | 20 (9.0%) | 29 (6.0%) |
| $150,000 or more | 140 (63.3%) | 44 (9.0%) |
| Total | 221 (100.0%) | 486 (100.0%) |
Property Value to Household Income Ratio in Essex Fells borough
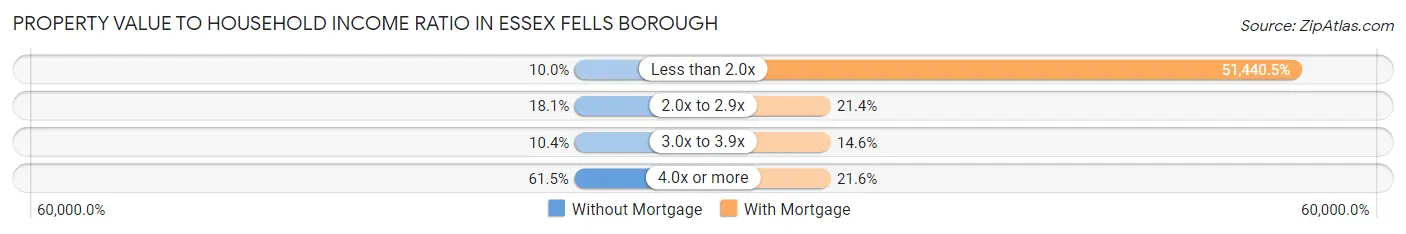
| Value-to-Income Ratio | Without Mortgage | With Mortgage |
| Less than 2.0x | 22 (10.0%) | 250,001 (51,440.5%) |
| 2.0x to 2.9x | 40 (18.1%) | 104 (21.4%) |
| 3.0x to 3.9x | 23 (10.4%) | 71 (14.6%) |
| 4.0x or more | 136 (61.5%) | 105 (21.6%) |
| Total | 221 (100.0%) | 486 (100.0%) |
Real Estate Taxes by Mortgage Status in Essex Fells borough
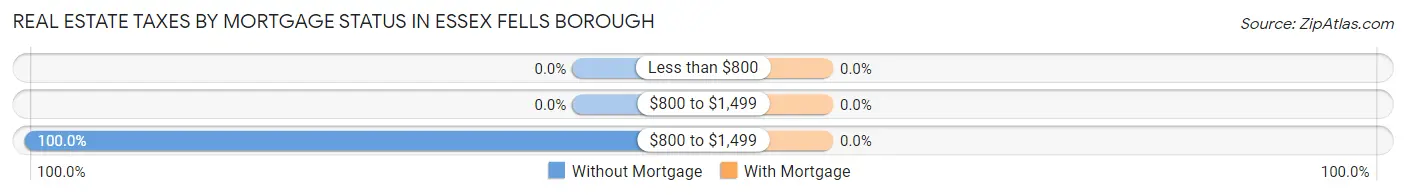
| Property Taxes | Without Mortgage | With Mortgage |
| Less than $800 | 0 (0.0%) | 0 (0.0%) |
| $800 to $1,499 | 0 (0.0%) | 0 (0.0%) |
| $800 to $1,499 | 221 (100.0%) | 0 (0.0%) |
| Total | 221 (100.0%) | 486 (100.0%) |
Health & Disability in Essex Fells borough
Health Insurance Coverage by Age in Essex Fells borough
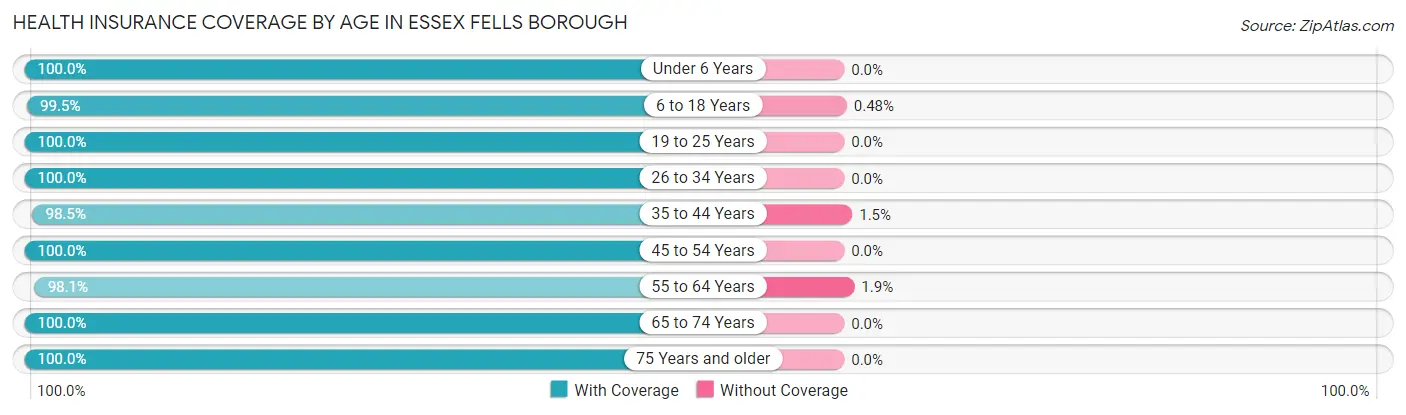
| Age Bracket | With Coverage | Without Coverage |
| Under 6 Years | 129 (100.0%) | 0 (0.0%) |
| 6 to 18 Years | 622 (99.5%) | 3 (0.5%) |
| 19 to 25 Years | 89 (100.0%) | 0 (0.0%) |
| 26 to 34 Years | 97 (100.0%) | 0 (0.0%) |
| 35 to 44 Years | 265 (98.5%) | 4 (1.5%) |
| 45 to 54 Years | 368 (100.0%) | 0 (0.0%) |
| 55 to 64 Years | 312 (98.1%) | 6 (1.9%) |
| 65 to 74 Years | 215 (100.0%) | 0 (0.0%) |
| 75 Years and older | 180 (100.0%) | 0 (0.0%) |
| Total | 2,277 (99.4%) | 13 (0.6%) |
Health Insurance Coverage by Citizenship Status in Essex Fells borough
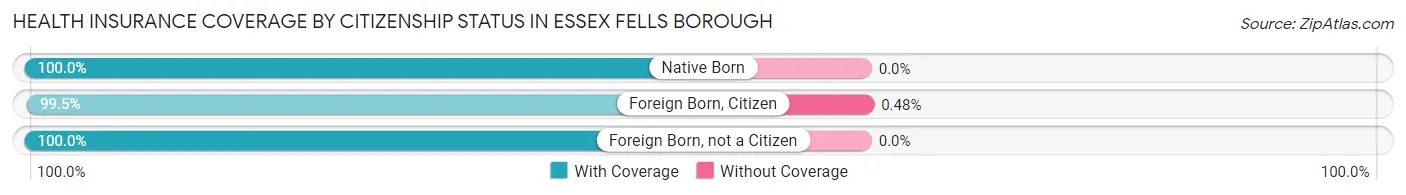
| Citizenship Status | With Coverage | Without Coverage |
| Native Born | 129 (100.0%) | 0 (0.0%) |
| Foreign Born, Citizen | 622 (99.5%) | 3 (0.5%) |
| Foreign Born, not a Citizen | 89 (100.0%) | 0 (0.0%) |
Health Insurance Coverage by Household Income in Essex Fells borough
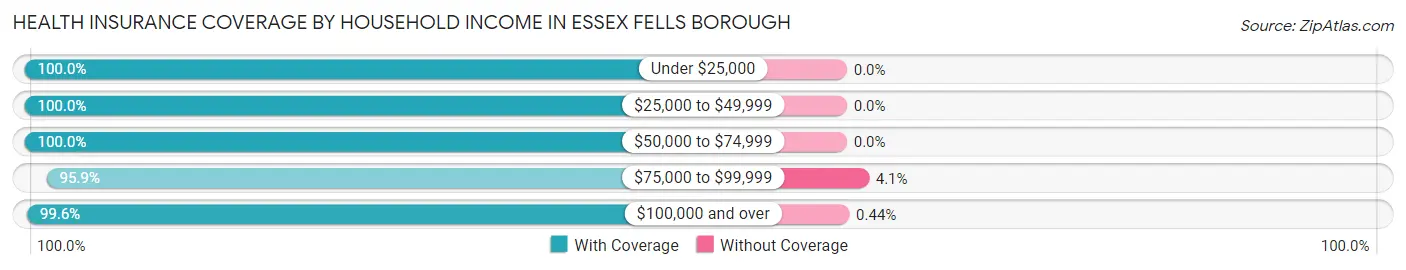
| Household Income | With Coverage | Without Coverage |
| Under $25,000 | 33 (100.0%) | 0 (0.0%) |
| $25,000 to $49,999 | 63 (100.0%) | 0 (0.0%) |
| $50,000 to $74,999 | 49 (100.0%) | 0 (0.0%) |
| $75,000 to $99,999 | 93 (95.9%) | 4 (4.1%) |
| $100,000 and over | 2,039 (99.6%) | 9 (0.4%) |
Public vs Private Health Insurance Coverage by Age in Essex Fells borough
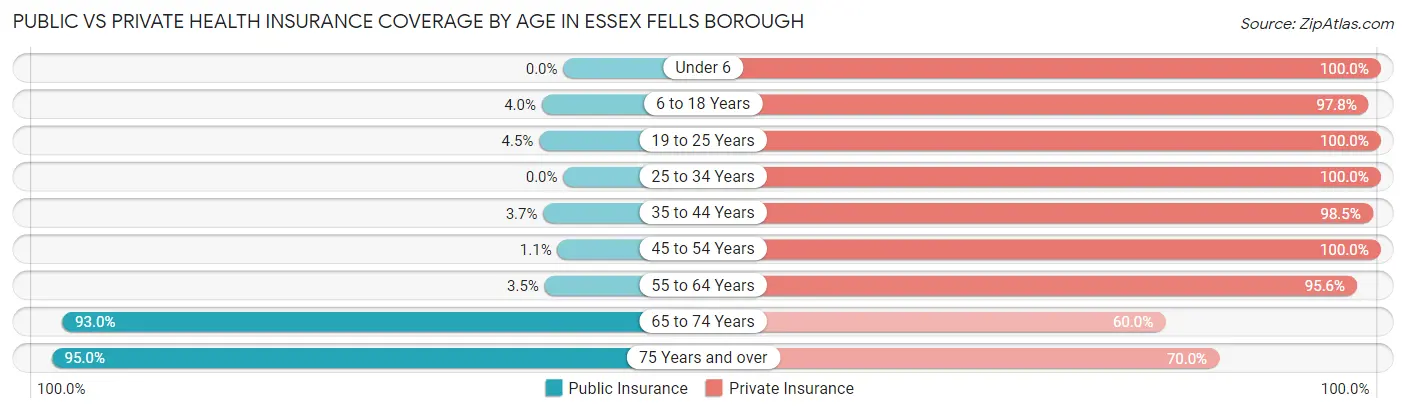
| Age Bracket | Public Insurance | Private Insurance |
| Under 6 | 0 (0.0%) | 129 (100.0%) |
| 6 to 18 Years | 25 (4.0%) | 611 (97.8%) |
| 19 to 25 Years | 4 (4.5%) | 89 (100.0%) |
| 25 to 34 Years | 0 (0.0%) | 97 (100.0%) |
| 35 to 44 Years | 10 (3.7%) | 265 (98.5%) |
| 45 to 54 Years | 4 (1.1%) | 368 (100.0%) |
| 55 to 64 Years | 11 (3.5%) | 304 (95.6%) |
| 65 to 74 Years | 200 (93.0%) | 129 (60.0%) |
| 75 Years and over | 171 (95.0%) | 126 (70.0%) |
| Total | 425 (18.6%) | 2,118 (92.5%) |
Disability Status by Sex by Age in Essex Fells borough
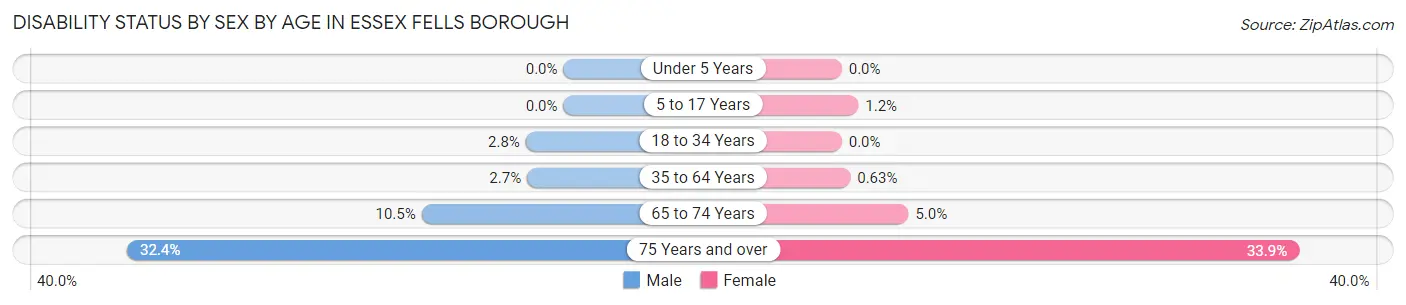
| Age Bracket | Male | Female |
| Under 5 Years | 0 (0.0%) | 0 (0.0%) |
| 5 to 17 Years | 0 (0.0%) | 4 (1.2%) |
| 18 to 34 Years | 3 (2.8%) | 0 (0.0%) |
| 35 to 64 Years | 13 (2.7%) | 3 (0.6%) |
| 65 to 74 Years | 12 (10.5%) | 5 (5.0%) |
| 75 Years and over | 23 (32.4%) | 37 (33.9%) |
Disability Class by Sex by Age in Essex Fells borough
Disability Class: Hearing Difficulty
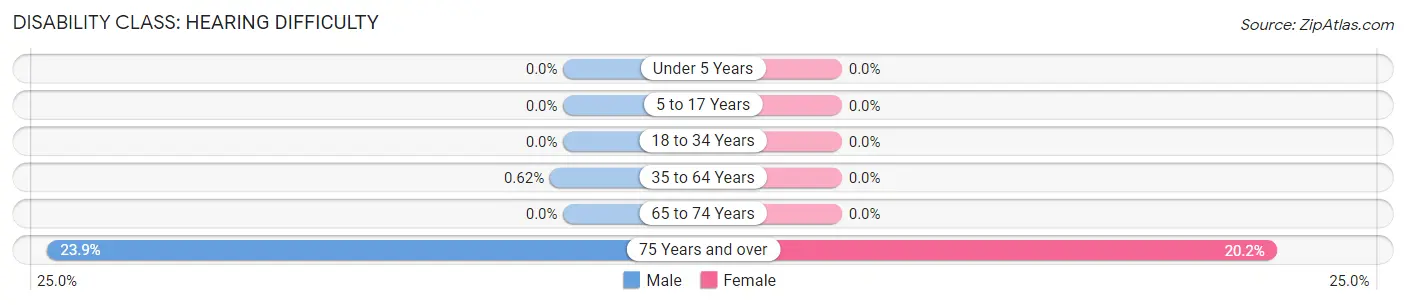
| Age Bracket | Male | Female |
| Under 5 Years | 0 (0.0%) | 0 (0.0%) |
| 5 to 17 Years | 0 (0.0%) | 0 (0.0%) |
| 18 to 34 Years | 0 (0.0%) | 0 (0.0%) |
| 35 to 64 Years | 3 (0.6%) | 0 (0.0%) |
| 65 to 74 Years | 0 (0.0%) | 0 (0.0%) |
| 75 Years and over | 17 (23.9%) | 22 (20.2%) |
Disability Class: Vision Difficulty
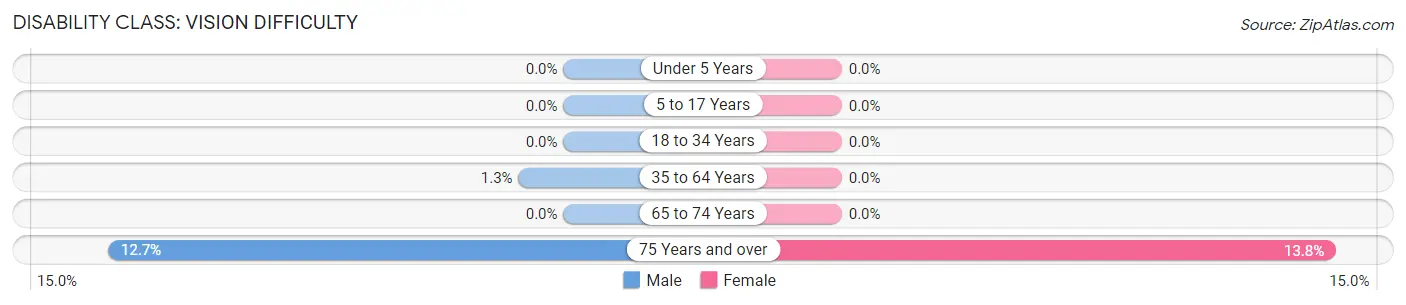
| Age Bracket | Male | Female |
| Under 5 Years | 0 (0.0%) | 0 (0.0%) |
| 5 to 17 Years | 0 (0.0%) | 0 (0.0%) |
| 18 to 34 Years | 0 (0.0%) | 0 (0.0%) |
| 35 to 64 Years | 6 (1.3%) | 0 (0.0%) |
| 65 to 74 Years | 0 (0.0%) | 0 (0.0%) |
| 75 Years and over | 9 (12.7%) | 15 (13.8%) |
Disability Class: Cognitive Difficulty
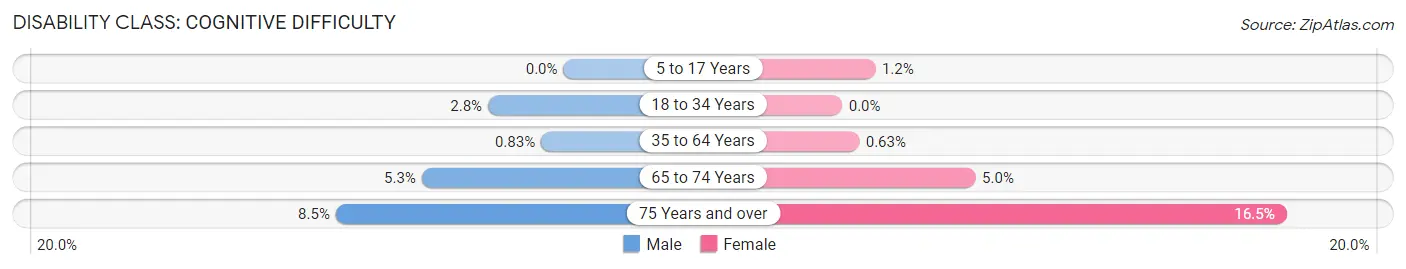
| Age Bracket | Male | Female |
| 5 to 17 Years | 0 (0.0%) | 4 (1.2%) |
| 18 to 34 Years | 3 (2.8%) | 0 (0.0%) |
| 35 to 64 Years | 4 (0.8%) | 3 (0.6%) |
| 65 to 74 Years | 6 (5.3%) | 5 (5.0%) |
| 75 Years and over | 6 (8.5%) | 18 (16.5%) |
Disability Class: Ambulatory Difficulty
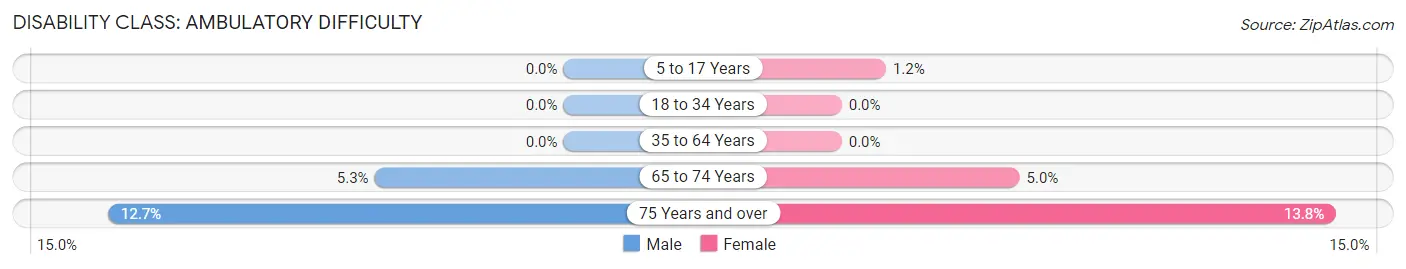
| Age Bracket | Male | Female |
| 5 to 17 Years | 0 (0.0%) | 4 (1.2%) |
| 18 to 34 Years | 0 (0.0%) | 0 (0.0%) |
| 35 to 64 Years | 0 (0.0%) | 0 (0.0%) |
| 65 to 74 Years | 6 (5.3%) | 5 (5.0%) |
| 75 Years and over | 9 (12.7%) | 15 (13.8%) |
Disability Class: Self-Care Difficulty
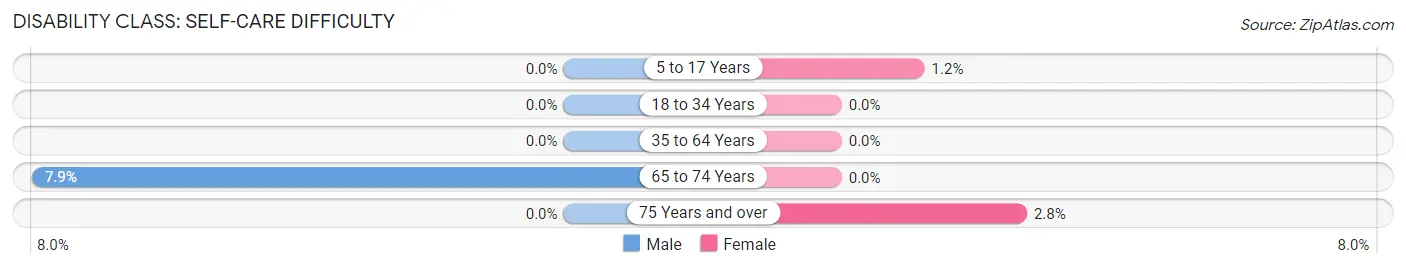
| Age Bracket | Male | Female |
| 5 to 17 Years | 0 (0.0%) | 4 (1.2%) |
| 18 to 34 Years | 0 (0.0%) | 0 (0.0%) |
| 35 to 64 Years | 0 (0.0%) | 0 (0.0%) |
| 65 to 74 Years | 9 (7.9%) | 0 (0.0%) |
| 75 Years and over | 0 (0.0%) | 3 (2.8%) |
Technology Access in Essex Fells borough
Computing Device Access in Essex Fells borough
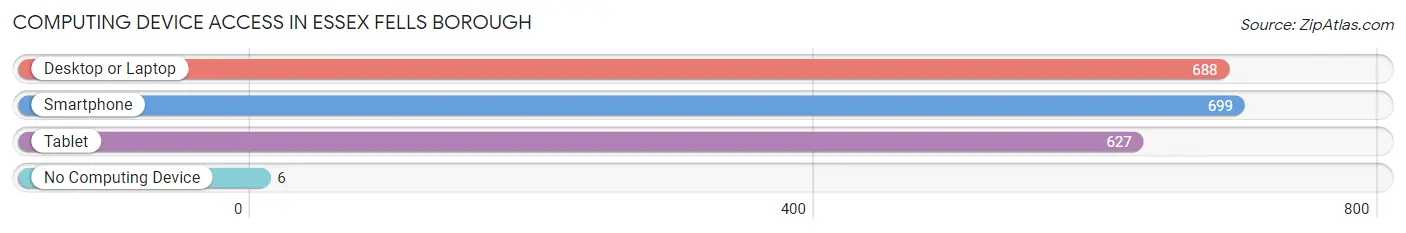
| Device Type | # Households | % Households |
| Desktop or Laptop | 688 | 94.8% |
| Smartphone | 699 | 96.3% |
| Tablet | 627 | 86.4% |
| No Computing Device | 6 | 0.8% |
| Total | 726 | 100.0% |
Internet Access in Essex Fells borough
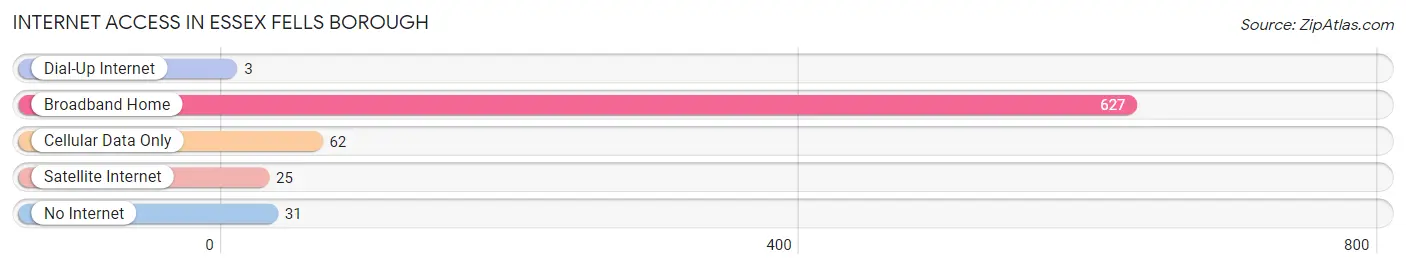
| Internet Type | # Households | % Households |
| Dial-Up Internet | 3 | 0.4% |
| Broadband Home | 627 | 86.4% |
| Cellular Data Only | 62 | 8.5% |
| Satellite Internet | 25 | 3.4% |
| No Internet | 31 | 4.3% |
| Total | 726 | 100.0% |
Essex Fells borough Summary
Essex Fells Borough is a small borough located in Essex County, New Jersey. It is situated in the northeastern part of the state, just west of the Passaic River. The borough is bordered by Caldwell, North Caldwell, Verona, and West Caldwell. The population of Essex Fells Borough was 2,113 as of the 2010 census.
History
Essex Fells Borough was incorporated in 1902, and was named after the Essex Fells Country Club, which was founded in 1891. The club was founded by a group of wealthy New Yorkers who wanted to create a private retreat in the countryside. The club was a popular destination for the wealthy and powerful, and it was the site of many important events, including the first meeting of the National Amateur Golf Association in 1895.
The borough was originally a rural farming community, but it began to develop rapidly in the early 20th century. The construction of the Essex Fells Country Club and the development of the surrounding area attracted many wealthy residents. The borough was known for its large estates and luxurious homes.
Geography
Essex Fells Borough is located in northeastern New Jersey, just west of the Passaic River. It is bordered by Caldwell, North Caldwell, Verona, and West Caldwell. The borough covers an area of 1.3 square miles, and has a population density of 1,619 people per square mile.
The borough is located in the Watchung Mountains, and is home to several parks and nature preserves. The borough is also home to the Essex Fells Country Club, which is located on the banks of the Passaic River.
Economy
Essex Fells Borough has a strong economy, with a median household income of $150,000. The borough is home to several businesses, including a number of professional services firms, retail stores, and restaurants. The borough is also home to the Essex Fells Country Club, which is a popular destination for golfers and other recreational activities.
Demographics
As of the 2010 census, the population of Essex Fells Borough was 2,113. The racial makeup of the borough was 94.3% White, 1.2% African American, 0.2% Native American, 2.7% Asian, and 1.6% from other races. The median age of the borough was 44.7 years.
The median household income in Essex Fells Borough was $150,000, and the median family income was $164,000. The per capita income was $80,000. The borough had a poverty rate of 2.3%.
Conclusion
Essex Fells Borough is a small borough located in Essex County, New Jersey. It is situated in the northeastern part of the state, just west of the Passaic River. The borough was originally a rural farming community, but it began to develop rapidly in the early 20th century. The borough is home to several businesses, including a number of professional services firms, retail stores, and restaurants. The population of Essex Fells Borough was 2,113 as of the 2010 census, and the median household income was $150,000.
Common Questions
What is Per Capita Income in Essex Fells borough?
Per Capita income in Essex Fells borough is $113,678.
What is the Median Family Income in Essex Fells borough?
Median Family Income in Essex Fells borough is $250,001.
What is the Median Household income in Essex Fells borough?
Median Household Income in Essex Fells borough is $247,000.
What is Income or Wage Gap in Essex Fells borough?
Income or Wage Gap in Essex Fells borough is 59.0%.
Women in Essex Fells borough earn 41.0 cents for every dollar earned by a man.
What is Inequality or Gini Index in Essex Fells borough?
Inequality or Gini Index in Essex Fells borough is 0.46.
What is the Total Population of Essex Fells borough?
Total Population of Essex Fells borough is 2,290.
What is the Total Male Population of Essex Fells borough?
Total Male Population of Essex Fells borough is 1,116.
What is the Total Female Population of Essex Fells borough?
Total Female Population of Essex Fells borough is 1,174.
What is the Ratio of Males per 100 Females in Essex Fells borough?
There are 95.06 Males per 100 Females in Essex Fells borough.
What is the Ratio of Females per 100 Males in Essex Fells borough?
There are 105.20 Females per 100 Males in Essex Fells borough.
What is the Median Population Age in Essex Fells borough?
Median Population Age in Essex Fells borough is 44.1 Years.
What is the Average Family Size in Essex Fells borough
Average Family Size in Essex Fells borough is 3.5 People.
What is the Average Household Size in Essex Fells borough
Average Household Size in Essex Fells borough is 3.1 People.
How Large is the Labor Force in Essex Fells borough?
There are 1,044 People in the Labor Forcein in Essex Fells borough.
What is the Percentage of People in the Labor Force in Essex Fells borough?
64.3% of People are in the Labor Force in Essex Fells borough.
What is the Unemployment Rate in Essex Fells borough?
Unemployment Rate in Essex Fells borough is 4.2%.