Palmyra borough, NJ Map & Demographics
Palmyra borough Overview
$44,593
PER CAPITA INCOME
$90,354
AVG FAMILY INCOME
$84,866
AVG HOUSEHOLD INCOME
22.3%
WAGE / INCOME GAP [ % ]
77.7¢/ $1
WAGE / INCOME GAP [ $ ]
0.36
INEQUALITY / GINI INDEX
7,437
TOTAL POPULATION
3,577
MALE POPULATION
3,860
FEMALE POPULATION
92.67
MALES / 100 FEMALES
107.91
FEMALES / 100 MALES
43.0
MEDIAN AGE
2.9
AVG FAMILY SIZE
2.3
AVG HOUSEHOLD SIZE
4,610
LABOR FORCE [ PEOPLE ]
73.4%
PERCENT IN LABOR FORCE
7.6%
UNEMPLOYMENT RATE
Income in Palmyra borough
Income Overview in Palmyra borough
Per Capita Income in Palmyra borough is $44,593, while median incomes of families and households are $90,354 and $84,866 respectively.
| Characteristic | Number | Measure |
| Per Capita Income | 7,437 | $44,593 |
| Median Family Income | 1,825 | $90,354 |
| Mean Family Income | 1,825 | $109,185 |
| Median Household Income | 3,200 | $84,866 |
| Mean Household Income | 3,200 | $101,243 |
| Income Deficit | 1,825 | $0 |
| Wage / Income Gap (%) | 7,437 | 22.34% |
| Wage / Income Gap ($) | 7,437 | 77.66¢ per $1 |
| Gini / Inequality Index | 7,437 | 0.36 |
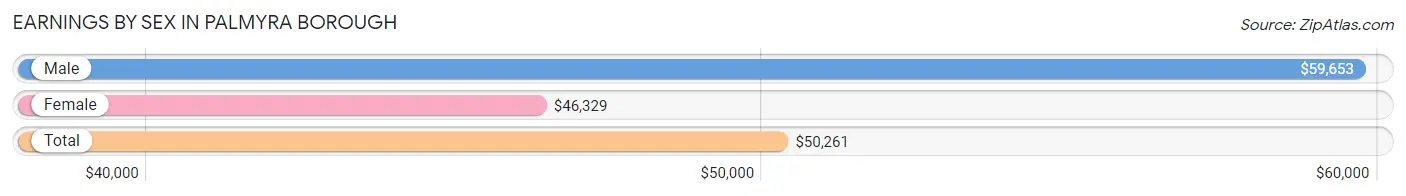
Earnings by Sex in Palmyra borough
Average Earnings in Palmyra borough are $50,261, $59,653 for men and $46,329 for women, a difference of 22.3%.
| Sex | Number | Average Earnings |
| Male | 2,147 (46.1%) | $59,653 |
| Female | 2,509 (53.9%) | $46,329 |
| Total | 4,656 (100.0%) | $50,261 |
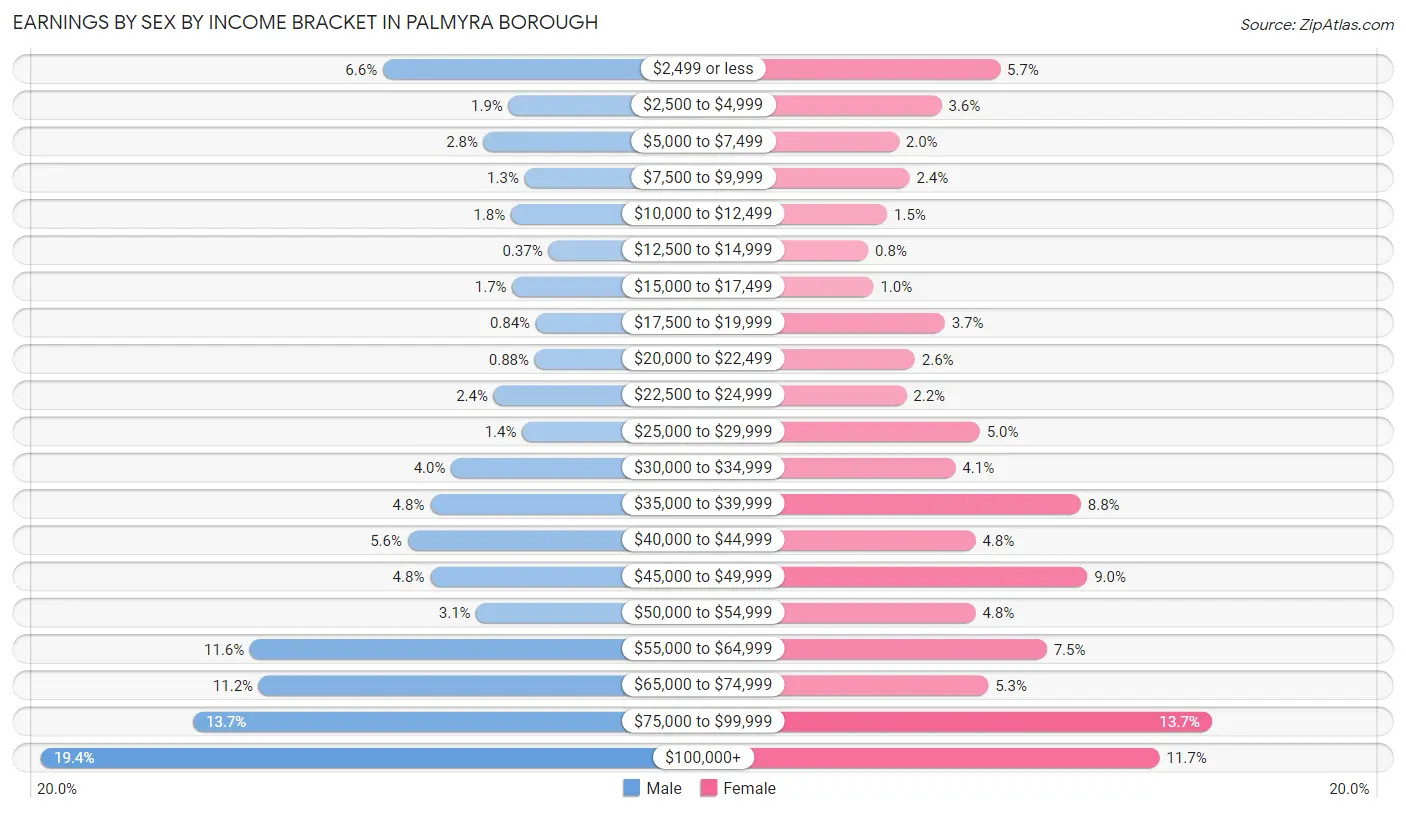
Earnings by Sex by Income Bracket in Palmyra borough
The most common earnings brackets in Palmyra borough are $100,000+ for men (416 | 19.4%) and $75,000 to $99,999 for women (343 | 13.7%).
| Income | Male | Female |
| $2,499 or less | 141 (6.6%) | 144 (5.7%) |
| $2,500 to $4,999 | 40 (1.9%) | 89 (3.5%) |
| $5,000 to $7,499 | 60 (2.8%) | 49 (1.9%) |
| $7,500 to $9,999 | 27 (1.3%) | 59 (2.4%) |
| $10,000 to $12,499 | 38 (1.8%) | 38 (1.5%) |
| $12,500 to $14,999 | 8 (0.4%) | 20 (0.8%) |
| $15,000 to $17,499 | 37 (1.7%) | 25 (1.0%) |
| $17,500 to $19,999 | 18 (0.8%) | 92 (3.7%) |
| $20,000 to $22,499 | 19 (0.9%) | 64 (2.5%) |
| $22,500 to $24,999 | 52 (2.4%) | 56 (2.2%) |
| $25,000 to $29,999 | 29 (1.3%) | 125 (5.0%) |
| $30,000 to $34,999 | 86 (4.0%) | 102 (4.1%) |
| $35,000 to $39,999 | 103 (4.8%) | 220 (8.8%) |
| $40,000 to $44,999 | 121 (5.6%) | 121 (4.8%) |
| $45,000 to $49,999 | 103 (4.8%) | 226 (9.0%) |
| $50,000 to $54,999 | 66 (3.1%) | 121 (4.8%) |
| $55,000 to $64,999 | 248 (11.6%) | 188 (7.5%) |
| $65,000 to $74,999 | 241 (11.2%) | 133 (5.3%) |
| $75,000 to $99,999 | 294 (13.7%) | 343 (13.7%) |
| $100,000+ | 416 (19.4%) | 294 (11.7%) |
| Total | 2,147 (100.0%) | 2,509 (100.0%) |
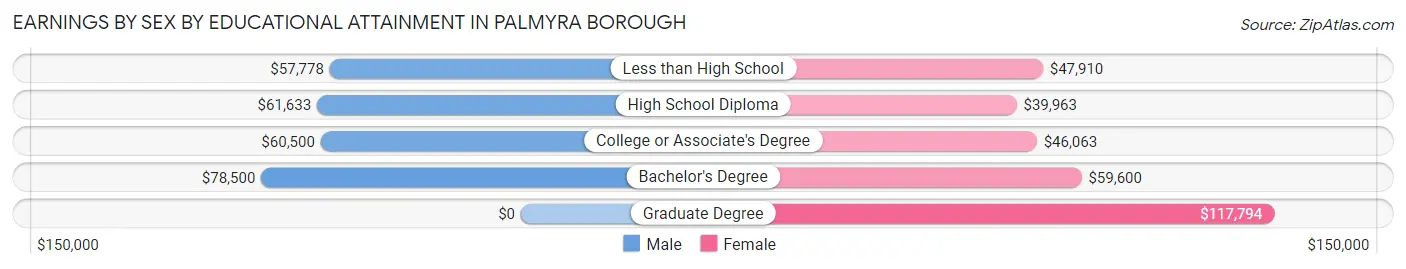
Earnings by Sex by Educational Attainment in Palmyra borough
Average earnings in Palmyra borough are $64,816 for men and $49,633 for women, a difference of 23.4%. Men with an educational attainment of bachelor's degree enjoy the highest average annual earnings of $78,500, while those with less than high school education earn the least with $57,778. Women with an educational attainment of graduate degree earn the most with the average annual earnings of $117,794, while those with high school diploma education have the smallest earnings of $39,963.
| Educational Attainment | Male Income | Female Income |
| Less than High School | $57,778 | $47,910 |
| High School Diploma | $61,633 | $39,963 |
| College or Associate's Degree | $60,500 | $46,063 |
| Bachelor's Degree | $78,500 | $59,600 |
| Graduate Degree | - | - |
| Total | $64,816 | $49,633 |
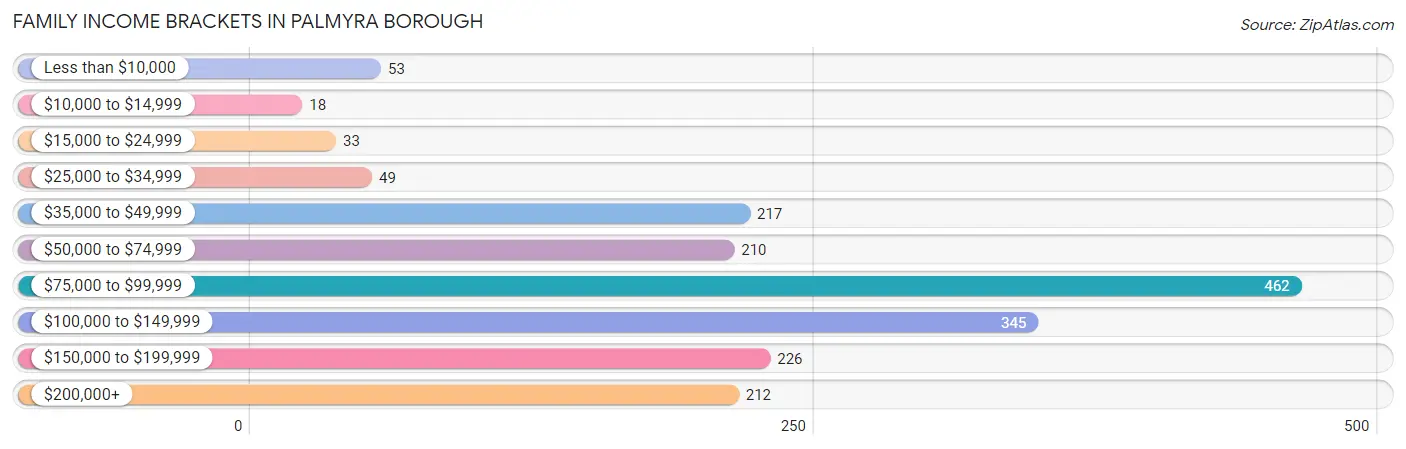
Family Income in Palmyra borough
Family Income Brackets in Palmyra borough
According to the Palmyra borough family income data, there are 462 families falling into the $75,000 to $99,999 income range, which is the most common income bracket and makes up 25.3% of all families. Conversely, the $10,000 to $14,999 income bracket is the least frequent group with only 18 families (1.0%) belonging to this category.
| Income Bracket | # Families | % Families |
| Less than $10,000 | 53 | 2.9% |
| $10,000 to $14,999 | 18 | 1.0% |
| $15,000 to $24,999 | 33 | 1.8% |
| $25,000 to $34,999 | 49 | 2.7% |
| $35,000 to $49,999 | 217 | 11.9% |
| $50,000 to $74,999 | 210 | 11.5% |
| $75,000 to $99,999 | 462 | 25.3% |
| $100,000 to $149,999 | 345 | 18.9% |
| $150,000 to $199,999 | 226 | 12.4% |
| $200,000+ | 212 | 11.6% |
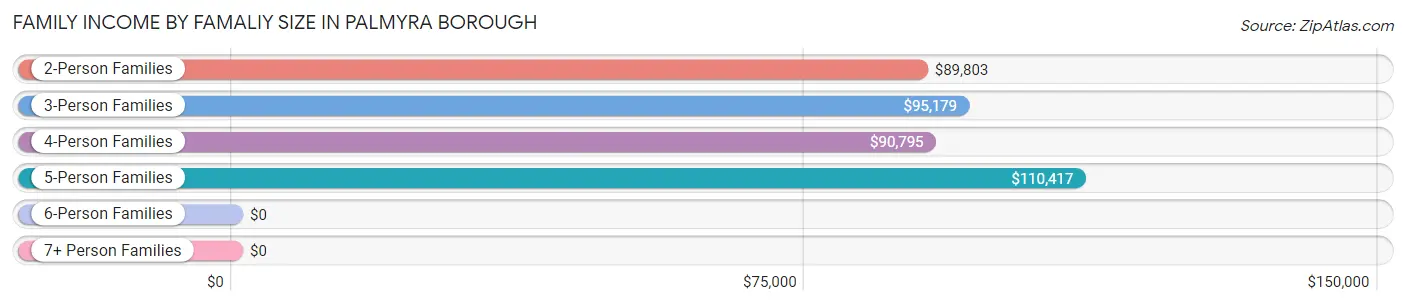
Family Income by Famaliy Size in Palmyra borough
5-person families (196 | 10.7%) account for the highest median family income in Palmyra borough with $110,417 per family, while 2-person families (981 | 53.7%) have the highest median income of $44,902 per family member.
| Income Bracket | # Families | Median Income |
| 2-Person Families | 981 (53.7%) | $89,803 |
| 3-Person Families | 389 (21.3%) | $95,179 |
| 4-Person Families | 233 (12.8%) | $90,795 |
| 5-Person Families | 196 (10.7%) | $110,417 |
| 6-Person Families | 12 (0.7%) | $0 |
| 7+ Person Families | 14 (0.8%) | $0 |
| Total | 1,825 (100.0%) | $90,354 |
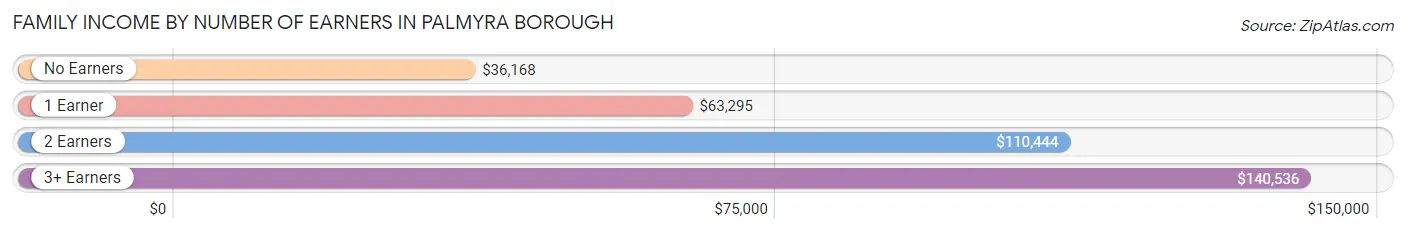
Family Income by Number of Earners in Palmyra borough
The median family income in Palmyra borough is $90,354, with families comprising 3+ earners (156) having the highest median family income of $140,536, while families with no earners (173) have the lowest median family income of $36,168, accounting for 8.6% and 9.5% of families, respectively.
| Number of Earners | # Families | Median Income |
| No Earners | 173 (9.5%) | $36,168 |
| 1 Earner | 531 (29.1%) | $63,295 |
| 2 Earners | 965 (52.9%) | $110,444 |
| 3+ Earners | 156 (8.6%) | $140,536 |
| Total | 1,825 (100.0%) | $90,354 |
Household Income in Palmyra borough
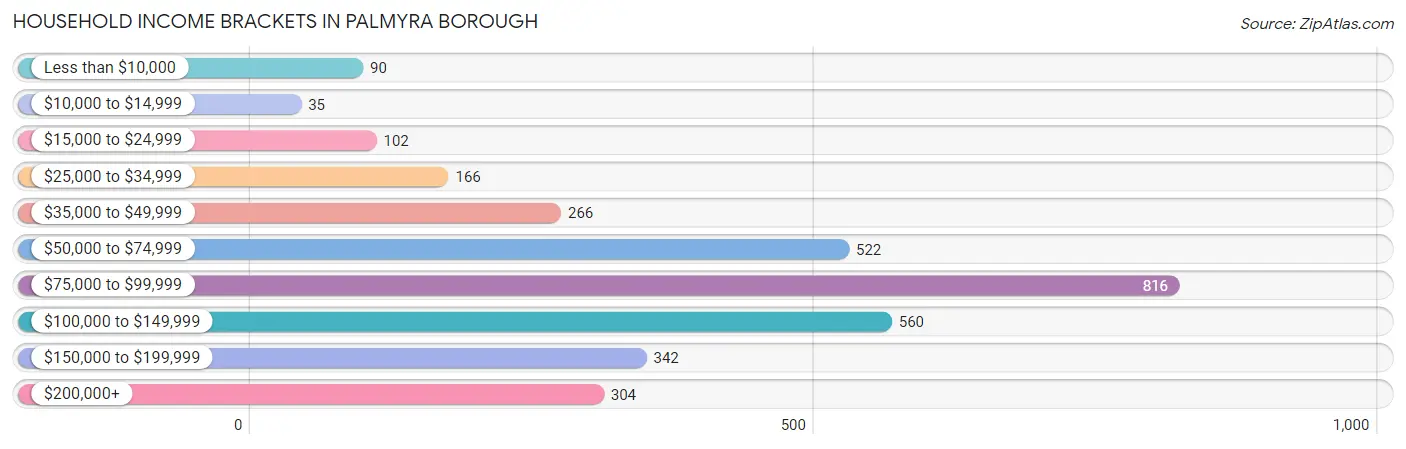
Household Income Brackets in Palmyra borough
With 816 households falling in the category, the $75,000 to $99,999 income range is the most frequent in Palmyra borough, accounting for 25.5% of all households. In contrast, only 35 households (1.1%) fall into the $10,000 to $14,999 income bracket, making it the least populous group.
| Income Bracket | # Households | % Households |
| Less than $10,000 | 90 | 2.8% |
| $10,000 to $14,999 | 35 | 1.1% |
| $15,000 to $24,999 | 102 | 3.2% |
| $25,000 to $34,999 | 166 | 5.2% |
| $35,000 to $49,999 | 266 | 8.3% |
| $50,000 to $74,999 | 522 | 16.3% |
| $75,000 to $99,999 | 816 | 25.5% |
| $100,000 to $149,999 | 560 | 17.5% |
| $150,000 to $199,999 | 342 | 10.7% |
| $200,000+ | 304 | 9.5% |
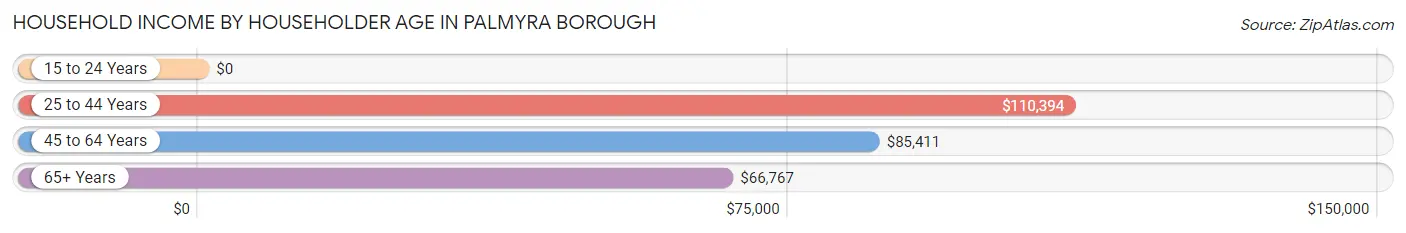
Household Income by Householder Age in Palmyra borough
The median household income in Palmyra borough is $84,866, with the highest median household income of $110,394 found in the 25 to 44 years age bracket for the primary householder. A total of 979 households (30.6%) fall into this category. Meanwhile, the 15 to 24 years age bracket for the primary householder has the lowest median household income of $0, with 8 households (0.3%) in this group.
| Income Bracket | # Households | Median Income |
| 15 to 24 Years | 8 (0.3%) | $0 |
| 25 to 44 Years | 979 (30.6%) | $110,394 |
| 45 to 64 Years | 1,466 (45.8%) | $85,411 |
| 65+ Years | 747 (23.3%) | $66,767 |
| Total | 3,200 (100.0%) | $84,866 |
Poverty in Palmyra borough
Income Below Poverty by Sex and Age in Palmyra borough
With 10.2% poverty level for males and 7.7% for females among the residents of Palmyra borough, 16 and 17 year old males and 18 to 24 year old females are the most vulnerable to poverty, with 53 males (67.9%) and 87 females (22.5%) in their respective age groups living below the poverty level.
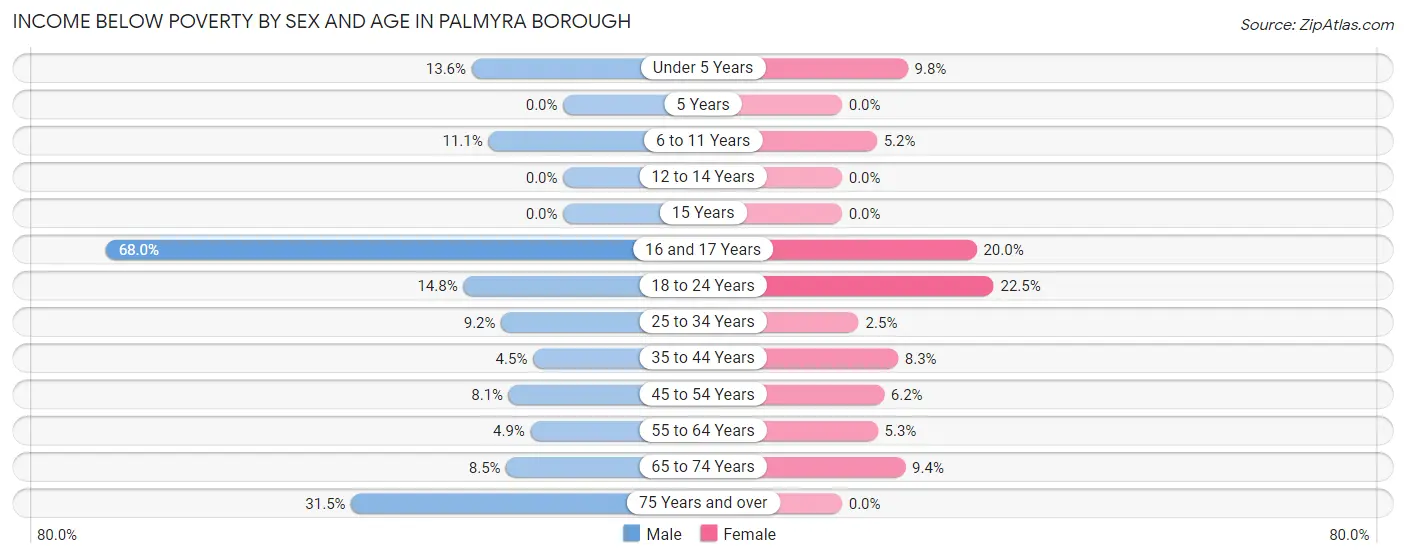
| Age Bracket | Male | Female |
| Under 5 Years | 14 (13.6%) | 13 (9.8%) |
| 5 Years | 0 (0.0%) | 0 (0.0%) |
| 6 to 11 Years | 30 (11.1%) | 14 (5.2%) |
| 12 to 14 Years | 0 (0.0%) | 0 (0.0%) |
| 15 Years | 0 (0.0%) | 0 (0.0%) |
| 16 and 17 Years | 53 (67.9%) | 18 (20.0%) |
| 18 to 24 Years | 51 (14.8%) | 87 (22.5%) |
| 25 to 34 Years | 52 (9.2%) | 13 (2.5%) |
| 35 to 44 Years | 14 (4.5%) | 40 (8.3%) |
| 45 to 54 Years | 42 (8.1%) | 36 (6.2%) |
| 55 to 64 Years | 31 (4.9%) | 38 (5.3%) |
| 65 to 74 Years | 31 (8.5%) | 40 (9.4%) |
| 75 Years and over | 45 (31.5%) | 0 (0.0%) |
| Total | 363 (10.2%) | 299 (7.7%) |
Income Above Poverty by Sex and Age in Palmyra borough
According to the poverty statistics in Palmyra borough, males aged 5 years and females aged 5 years are the age groups that are most secure financially, with 100.0% of males and 100.0% of females in these age groups living above the poverty line.
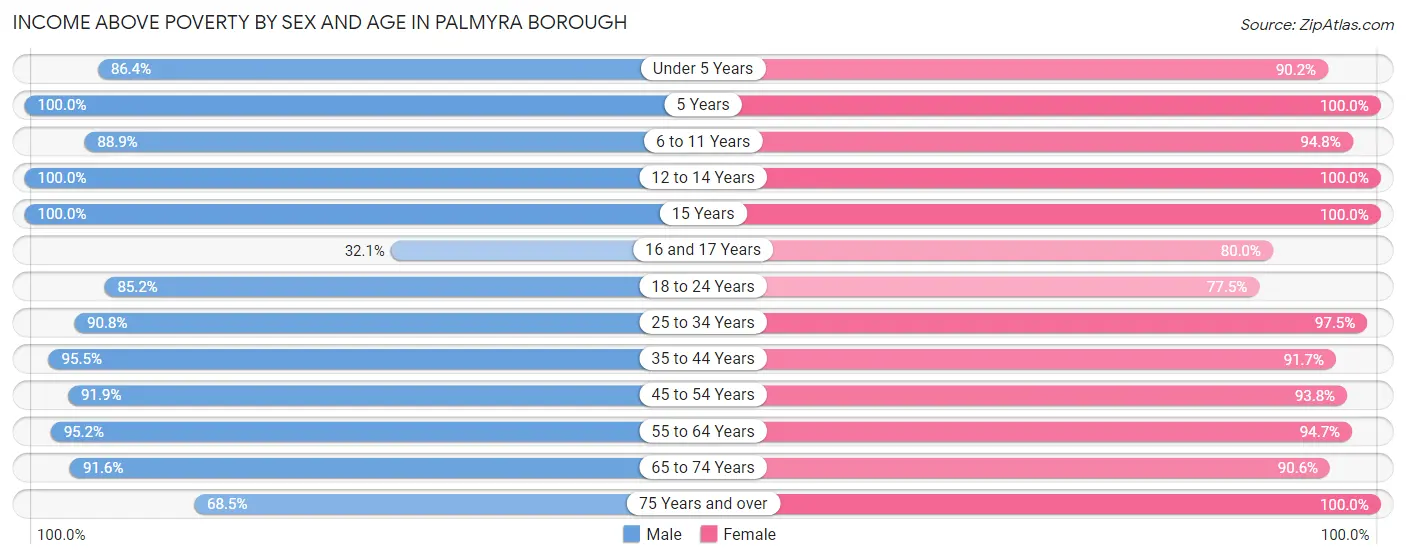
| Age Bracket | Male | Female |
| Under 5 Years | 89 (86.4%) | 120 (90.2%) |
| 5 Years | 8 (100.0%) | 50 (100.0%) |
| 6 to 11 Years | 240 (88.9%) | 256 (94.8%) |
| 12 to 14 Years | 175 (100.0%) | 32 (100.0%) |
| 15 Years | 52 (100.0%) | 62 (100.0%) |
| 16 and 17 Years | 25 (32.1%) | 72 (80.0%) |
| 18 to 24 Years | 293 (85.2%) | 299 (77.5%) |
| 25 to 34 Years | 513 (90.8%) | 506 (97.5%) |
| 35 to 44 Years | 299 (95.5%) | 441 (91.7%) |
| 45 to 54 Years | 478 (91.9%) | 541 (93.8%) |
| 55 to 64 Years | 608 (95.2%) | 676 (94.7%) |
| 65 to 74 Years | 336 (91.5%) | 385 (90.6%) |
| 75 Years and over | 98 (68.5%) | 120 (100.0%) |
| Total | 3,214 (89.8%) | 3,560 (92.2%) |
Income Below Poverty Among Married-Couple Families in Palmyra borough
The poverty statistics for married-couple families in Palmyra borough show that 1.5% or 17 of the total 1,172 families live below the poverty line. Families with no children have the highest poverty rate of 2.2%, comprising of 17 families. On the other hand, families with 1 or 2 children have the lowest poverty rate of 0.0%, which includes 0 families.
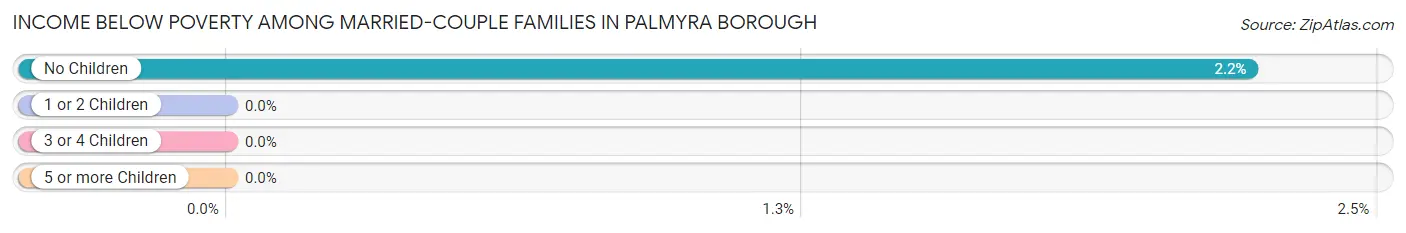
| Children | Above Poverty | Below Poverty |
| No Children | 750 (97.8%) | 17 (2.2%) |
| 1 or 2 Children | 295 (100.0%) | 0 (0.0%) |
| 3 or 4 Children | 110 (100.0%) | 0 (0.0%) |
| 5 or more Children | 0 (0.0%) | 0 (0.0%) |
| Total | 1,155 (98.6%) | 17 (1.5%) |
Income Below Poverty Among Single-Parent Households in Palmyra borough
According to the poverty data in Palmyra borough, 10.9% or 17 single-father households and 11.9% or 59 single-mother households are living below the poverty line. Among single-father households, those with 3 or 4 children have the highest poverty rate, with 17 households (73.9%) experiencing poverty. Likewise, among single-mother households, those with 1 or 2 children have the highest poverty rate, with 43 households (23.0%) falling below the poverty line.
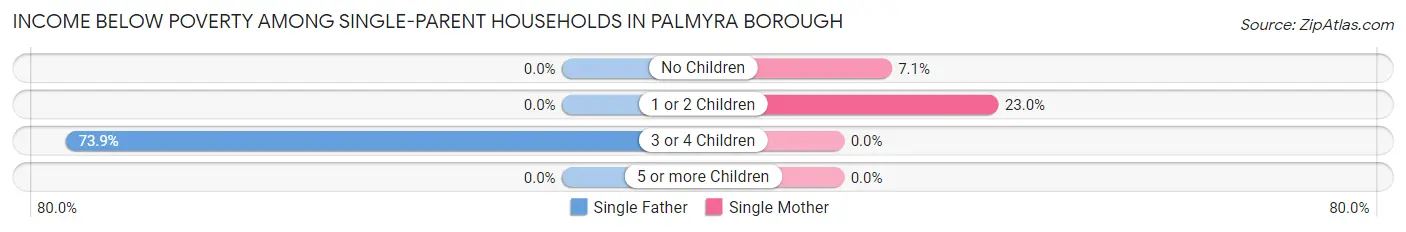
| Children | Single Father | Single Mother |
| No Children | 0 (0.0%) | 16 (7.1%) |
| 1 or 2 Children | 0 (0.0%) | 43 (23.0%) |
| 3 or 4 Children | 17 (73.9%) | 0 (0.0%) |
| 5 or more Children | 0 (0.0%) | 0 (0.0%) |
| Total | 17 (10.9%) | 59 (11.9%) |
Income Below Poverty Among Married-Couple vs Single-Parent Households in Palmyra borough
The poverty data for Palmyra borough shows that 17 of the married-couple family households (1.5%) and 76 of the single-parent households (11.6%) are living below the poverty level. Within the married-couple family households, those with no children have the highest poverty rate, with 17 households (2.2%) falling below the poverty line. Among the single-parent households, those with 1 or 2 children have the highest poverty rate, with 43 household (21.9%) living below poverty.
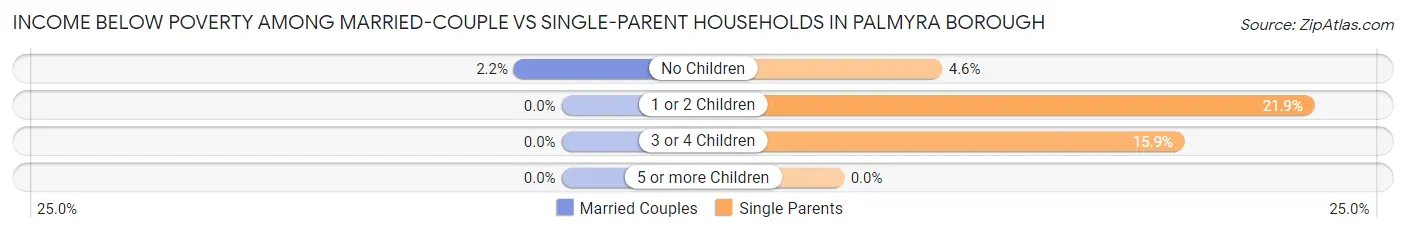
| Children | Married-Couple Families | Single-Parent Households |
| No Children | 17 (2.2%) | 16 (4.6%) |
| 1 or 2 Children | 0 (0.0%) | 43 (21.9%) |
| 3 or 4 Children | 0 (0.0%) | 17 (15.9%) |
| 5 or more Children | 0 (0.0%) | 0 (0.0%) |
| Total | 17 (1.5%) | 76 (11.6%) |
Race in Palmyra borough
The most populous races in Palmyra borough are White / Caucasian (5,033 | 67.7%), Black / African American (1,106 | 14.9%), and Hispanic or Latino (727 | 9.8%).
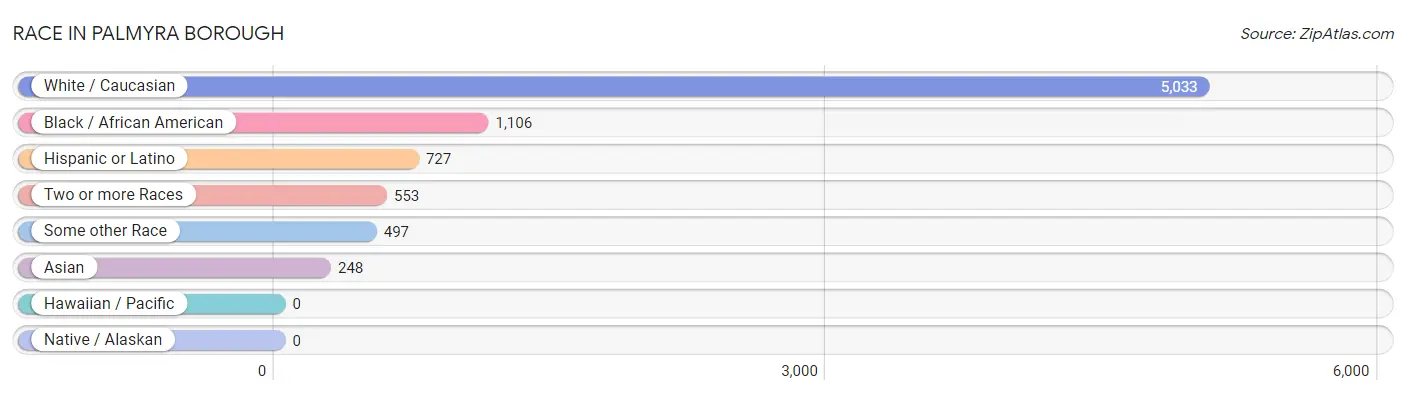
| Race | # Population | % Population |
| Asian | 248 | 3.3% |
| Black / African American | 1,106 | 14.9% |
| Hawaiian / Pacific | 0 | 0.0% |
| Hispanic or Latino | 727 | 9.8% |
| Native / Alaskan | 0 | 0.0% |
| White / Caucasian | 5,033 | 67.7% |
| Two or more Races | 553 | 7.4% |
| Some other Race | 497 | 6.7% |
| Total | 7,437 | 100.0% |
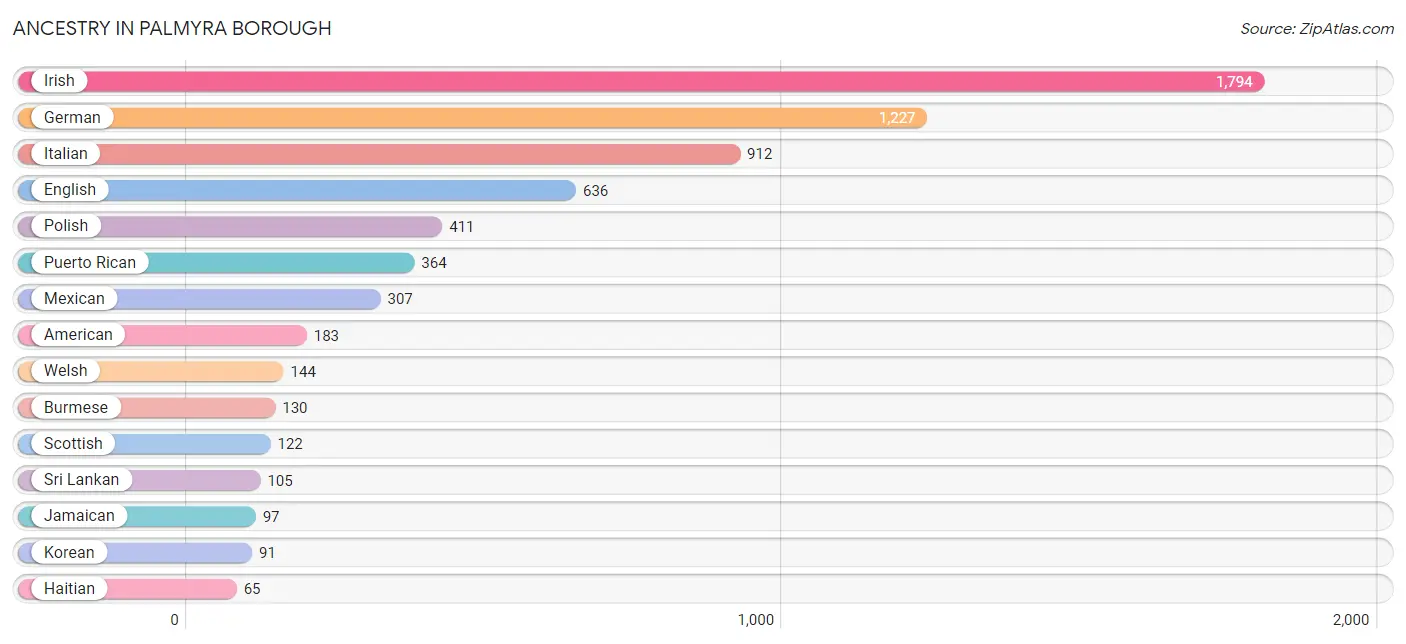
Ancestry in Palmyra borough
The most populous ancestries reported in Palmyra borough are Irish (1,794 | 24.1%), German (1,227 | 16.5%), Italian (912 | 12.3%), English (636 | 8.6%), and Polish (411 | 5.5%), together accounting for 67.0% of all Palmyra borough residents.
| Ancestry | # Population | % Population |
| African | 46 | 0.6% |
| American | 183 | 2.5% |
| Argentinean | 9 | 0.1% |
| Austrian | 21 | 0.3% |
| Belgian | 21 | 0.3% |
| Bhutanese | 5 | 0.1% |
| Brazilian | 5 | 0.1% |
| British | 28 | 0.4% |
| Burmese | 130 | 1.8% |
| Central American | 14 | 0.2% |
| Cherokee | 6 | 0.1% |
| Chippewa | 20 | 0.3% |
| Costa Rican | 9 | 0.1% |
| Dutch | 58 | 0.8% |
| Eastern European | 39 | 0.5% |
| English | 636 | 8.6% |
| European | 64 | 0.9% |
| French | 63 | 0.9% |
| French Canadian | 9 | 0.1% |
| German | 1,227 | 16.5% |
| Greek | 44 | 0.6% |
| Haitian | 65 | 0.9% |
| Hungarian | 29 | 0.4% |
| Icelander | 11 | 0.2% |
| Indian (Asian) | 11 | 0.2% |
| Irish | 1,794 | 24.1% |
| Italian | 912 | 12.3% |
| Jamaican | 97 | 1.3% |
| Korean | 91 | 1.2% |
| Lithuanian | 23 | 0.3% |
| Mexican | 307 | 4.1% |
| Nicaraguan | 5 | 0.1% |
| Pakistani | 36 | 0.5% |
| Polish | 411 | 5.5% |
| Portuguese | 10 | 0.1% |
| Puerto Rican | 364 | 4.9% |
| Russian | 50 | 0.7% |
| Samoan | 18 | 0.2% |
| Scotch-Irish | 21 | 0.3% |
| Scottish | 122 | 1.6% |
| Serbian | 11 | 0.2% |
| Sioux | 1 | 0.0% |
| Slavic | 21 | 0.3% |
| Slovak | 7 | 0.1% |
| South American | 9 | 0.1% |
| Spaniard | 14 | 0.2% |
| Spanish | 19 | 0.3% |
| Sri Lankan | 105 | 1.4% |
| Subsaharan African | 46 | 0.6% |
| Swedish | 40 | 0.5% |
| Ukrainian | 42 | 0.6% |
| Welsh | 144 | 1.9% | View All 52 Rows |
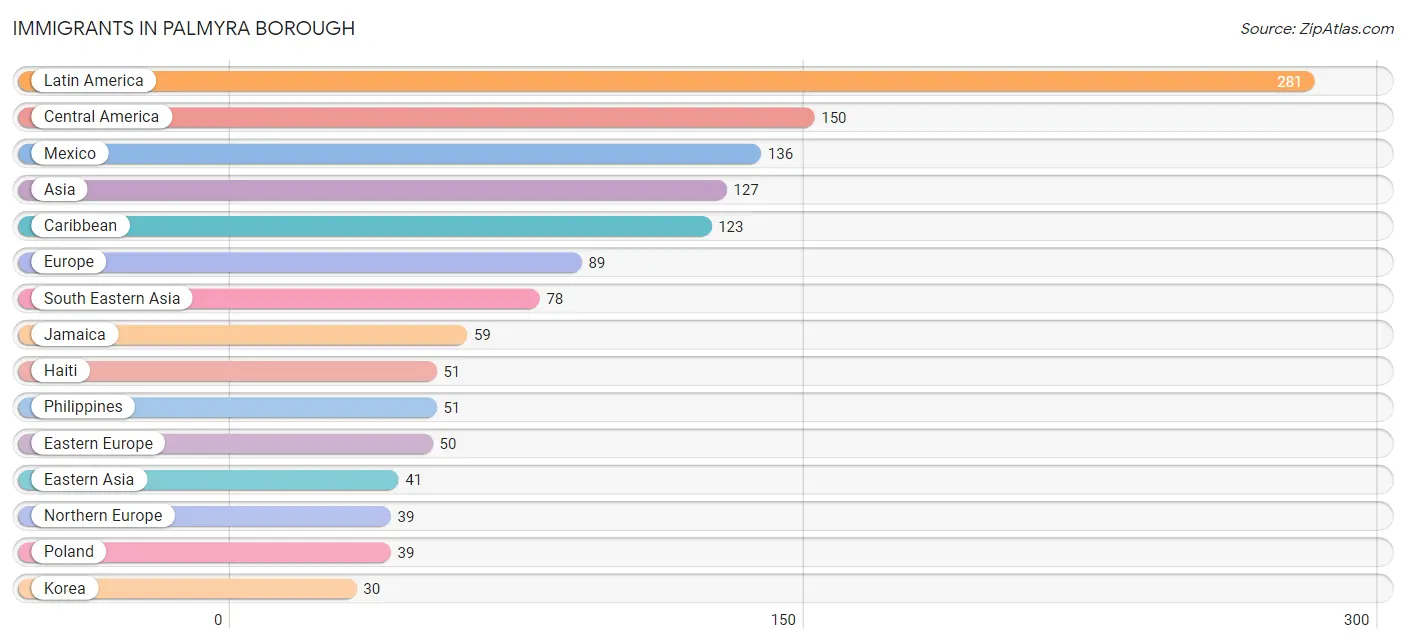
Immigrants in Palmyra borough
The most numerous immigrant groups reported in Palmyra borough came from Latin America (281 | 3.8%), Central America (150 | 2.0%), Mexico (136 | 1.8%), Asia (127 | 1.7%), and Caribbean (123 | 1.7%), together accounting for 11.0% of all Palmyra borough residents.
| Immigration Origin | # Population | % Population |
| Asia | 127 | 1.7% |
| Brazil | 8 | 0.1% |
| Caribbean | 123 | 1.7% |
| Central America | 150 | 2.0% |
| China | 11 | 0.2% |
| Costa Rica | 9 | 0.1% |
| Dominican Republic | 13 | 0.2% |
| Eastern Asia | 41 | 0.5% |
| Eastern Europe | 50 | 0.7% |
| England | 28 | 0.4% |
| Europe | 89 | 1.2% |
| Haiti | 51 | 0.7% |
| India | 8 | 0.1% |
| Jamaica | 59 | 0.8% |
| Korea | 30 | 0.4% |
| Latin America | 281 | 3.8% |
| Mexico | 136 | 1.8% |
| Nicaragua | 5 | 0.1% |
| Northern Europe | 39 | 0.5% |
| Philippines | 51 | 0.7% |
| Poland | 39 | 0.5% |
| South America | 8 | 0.1% |
| South Central Asia | 8 | 0.1% |
| South Eastern Asia | 78 | 1.1% |
| Vietnam | 27 | 0.4% | View All 25 Rows |
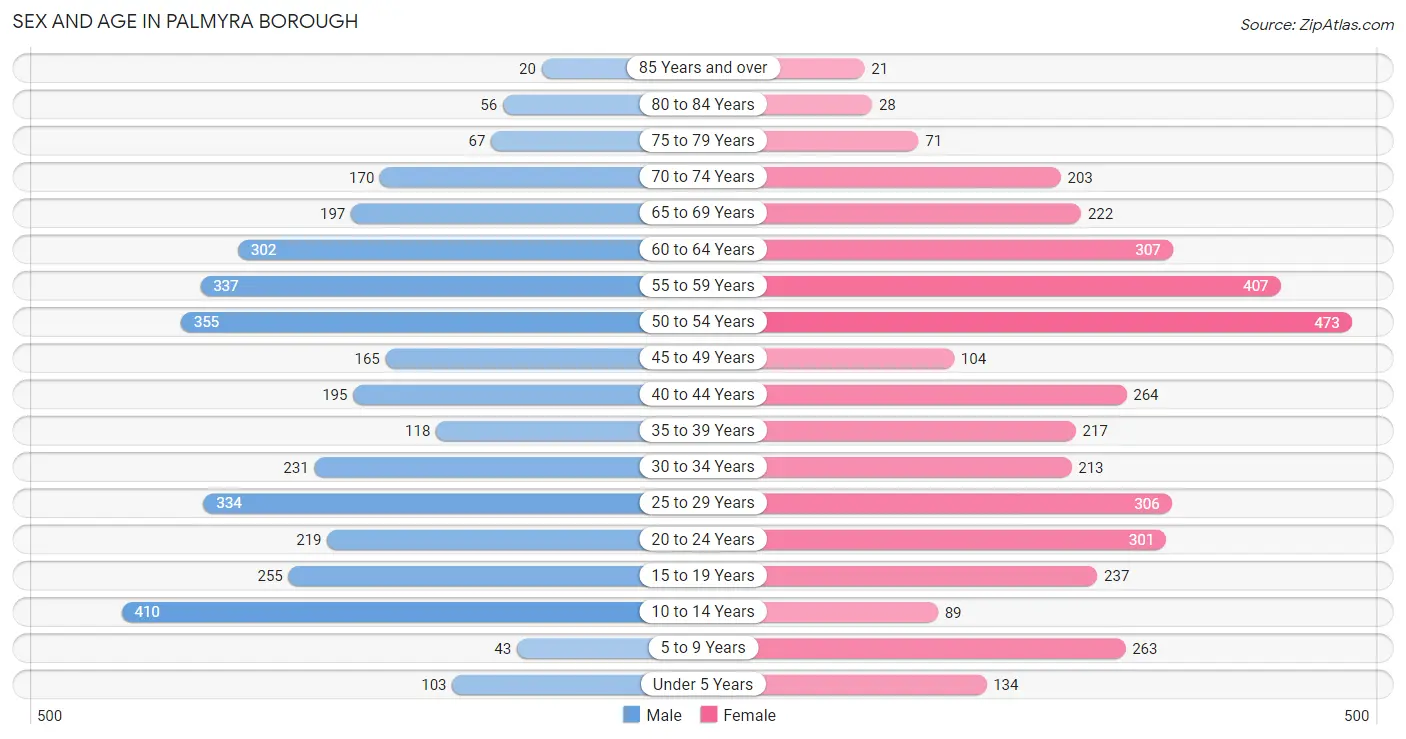
Sex and Age in Palmyra borough
Sex and Age in Palmyra borough
The most populous age groups in Palmyra borough are 10 to 14 Years (410 | 11.5%) for men and 50 to 54 Years (473 | 12.2%) for women.
| Age Bracket | Male | Female |
| Under 5 Years | 103 (2.9%) | 134 (3.5%) |
| 5 to 9 Years | 43 (1.2%) | 263 (6.8%) |
| 10 to 14 Years | 410 (11.5%) | 89 (2.3%) |
| 15 to 19 Years | 255 (7.1%) | 237 (6.1%) |
| 20 to 24 Years | 219 (6.1%) | 301 (7.8%) |
| 25 to 29 Years | 334 (9.3%) | 306 (7.9%) |
| 30 to 34 Years | 231 (6.5%) | 213 (5.5%) |
| 35 to 39 Years | 118 (3.3%) | 217 (5.6%) |
| 40 to 44 Years | 195 (5.4%) | 264 (6.8%) |
| 45 to 49 Years | 165 (4.6%) | 104 (2.7%) |
| 50 to 54 Years | 355 (9.9%) | 473 (12.2%) |
| 55 to 59 Years | 337 (9.4%) | 407 (10.5%) |
| 60 to 64 Years | 302 (8.4%) | 307 (8.0%) |
| 65 to 69 Years | 197 (5.5%) | 222 (5.8%) |
| 70 to 74 Years | 170 (4.8%) | 203 (5.3%) |
| 75 to 79 Years | 67 (1.9%) | 71 (1.8%) |
| 80 to 84 Years | 56 (1.6%) | 28 (0.7%) |
| 85 Years and over | 20 (0.6%) | 21 (0.5%) |
| Total | 3,577 (100.0%) | 3,860 (100.0%) |
Families and Households in Palmyra borough
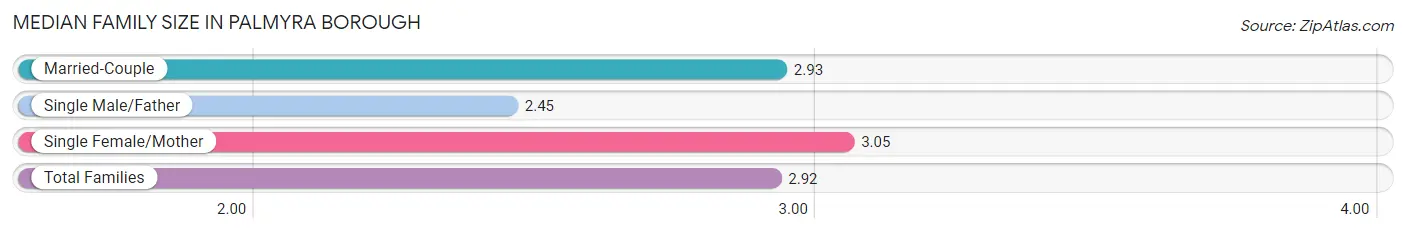
Median Family Size in Palmyra borough
The median family size in Palmyra borough is 2.92 persons per family, with single female/mother families (497 | 27.2%) accounting for the largest median family size of 3.05 persons per family. On the other hand, single male/father families (156 | 8.6%) represent the smallest median family size with 2.45 persons per family.
| Family Type | # Families | Family Size |
| Married-Couple | 1,172 (64.2%) | 2.93 |
| Single Male/Father | 156 (8.6%) | 2.45 |
| Single Female/Mother | 497 (27.2%) | 3.05 |
| Total Families | 1,825 (100.0%) | 2.92 |
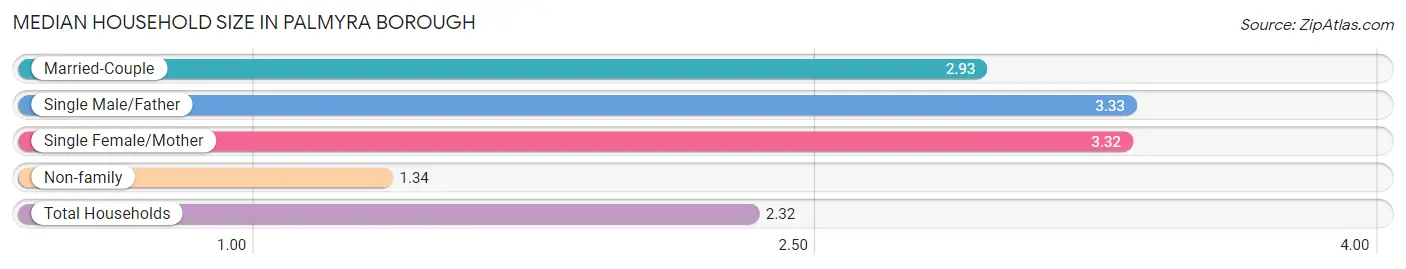
Median Household Size in Palmyra borough
The median household size in Palmyra borough is 2.32 persons per household, with single male/father households (156 | 4.9%) accounting for the largest median household size of 3.33 persons per household. non-family households (1,375 | 43.0%) represent the smallest median household size with 1.34 persons per household.
| Household Type | # Households | Household Size |
| Married-Couple | 1,172 (36.6%) | 2.93 |
| Single Male/Father | 156 (4.9%) | 3.33 |
| Single Female/Mother | 497 (15.5%) | 3.32 |
| Non-family | 1,375 (43.0%) | 1.34 |
| Total Households | 3,200 (100.0%) | 2.32 |
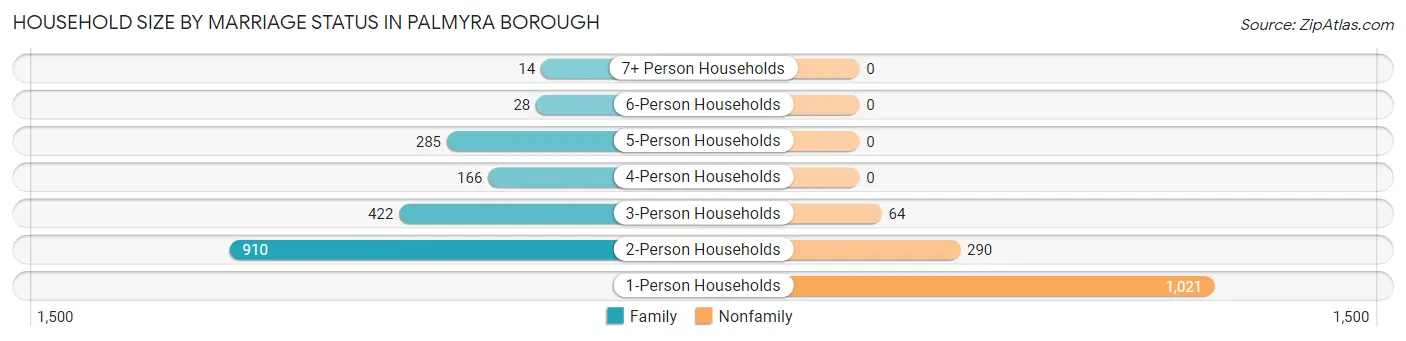
Household Size by Marriage Status in Palmyra borough
Out of a total of 3,200 households in Palmyra borough, 1,825 (57.0%) are family households, while 1,375 (43.0%) are nonfamily households. The most numerous type of family households are 2-person households, comprising 910, and the most common type of nonfamily households are 1-person households, comprising 1,021.
| Household Size | Family Households | Nonfamily Households |
| 1-Person Households | - | 1,021 (31.9%) |
| 2-Person Households | 910 (28.4%) | 290 (9.1%) |
| 3-Person Households | 422 (13.2%) | 64 (2.0%) |
| 4-Person Households | 166 (5.2%) | 0 (0.0%) |
| 5-Person Households | 285 (8.9%) | 0 (0.0%) |
| 6-Person Households | 28 (0.9%) | 0 (0.0%) |
| 7+ Person Households | 14 (0.4%) | 0 (0.0%) |
| Total | 1,825 (57.0%) | 1,375 (43.0%) |
Female Fertility in Palmyra borough
Fertility by Age in Palmyra borough
Average fertility rate in Palmyra borough is 40.0 births per 1,000 women. Women in the age bracket of 20 to 34 years have the highest fertility rate with 73.0 births per 1,000 women. Women in the age bracket of 20 to 34 years acount for 83.3% of all women with births.
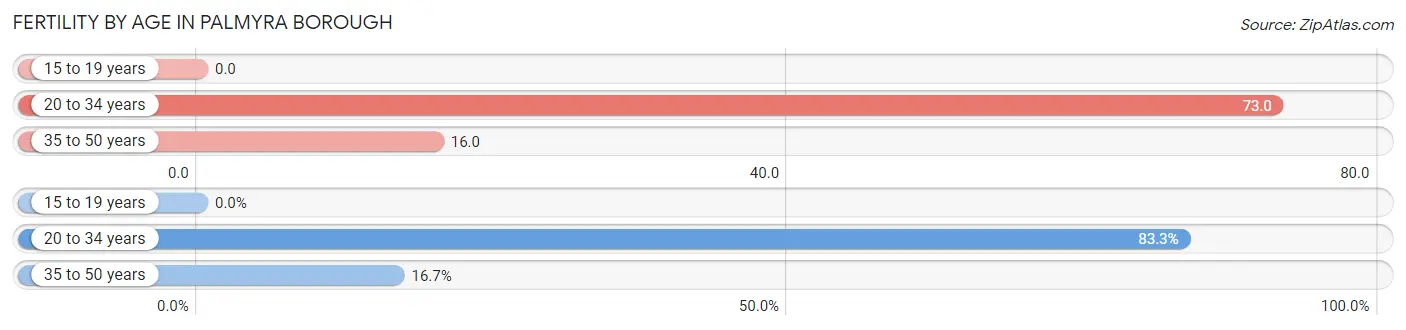
| Age Bracket | Women with Births | Births / 1,000 Women |
| 15 to 19 years | 0 (0.0%) | 0.0 |
| 20 to 34 years | 60 (83.3%) | 73.0 |
| 35 to 50 years | 12 (16.7%) | 16.0 |
| Total | 72 (100.0%) | 40.0 |
Fertility by Age by Marriage Status in Palmyra borough
69.4% of women with births (72) in Palmyra borough are married. The highest percentage of unmarried women with births falls into 20 to 34 years age bracket with 36.7% of them unmarried at the time of birth, while the lowest percentage of unmarried women with births belong to 35 to 50 years age bracket with 0.0% of them unmarried.
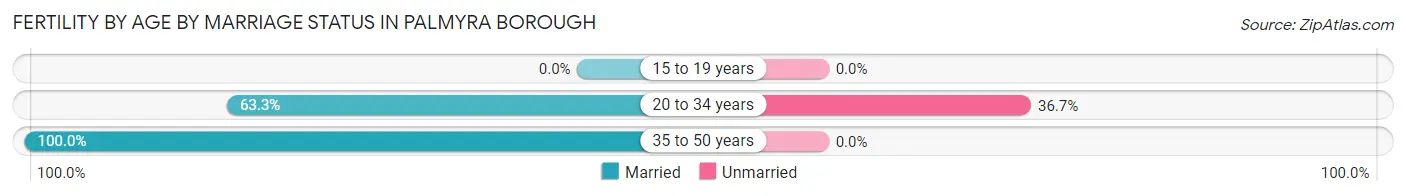
| Age Bracket | Married | Unmarried |
| 15 to 19 years | 0 (0.0%) | 0 (0.0%) |
| 20 to 34 years | 38 (63.3%) | 22 (36.7%) |
| 35 to 50 years | 12 (100.0%) | 0 (0.0%) |
| Total | 50 (69.4%) | 22 (30.6%) |
Fertility by Education in Palmyra borough
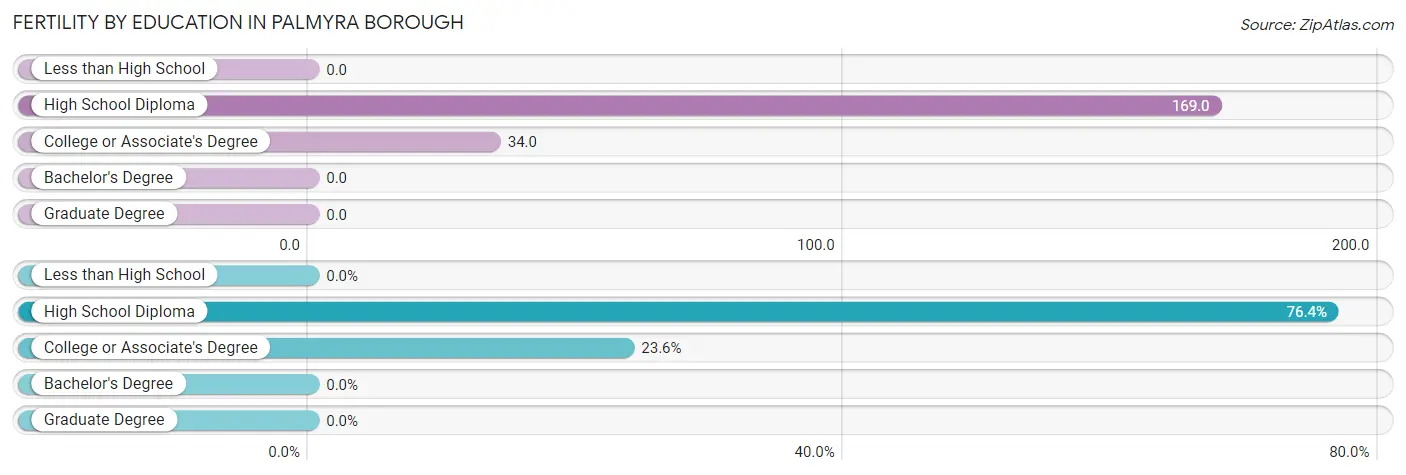
| Educational Attainment | Women with Births | Births / 1,000 Women |
| Less than High School | 0 (0.0%) | 0.0 |
| High School Diploma | 55 (76.4%) | 169.0 |
| College or Associate's Degree | 17 (23.6%) | 34.0 |
| Bachelor's Degree | 0 (0.0%) | 0.0 |
| Graduate Degree | 0 (0.0%) | 0.0 |
| Total | 72 (100.0%) | 40.0 |
Fertility by Education by Marriage Status in Palmyra borough
30.6% of women with births in Palmyra borough are unmarried. Women with the educational attainment of college or associate's degree are most likely to be married with 100.0% of them married at childbirth, while women with the educational attainment of high school diploma are least likely to be married with 40.0% of them unmarried at childbirth.
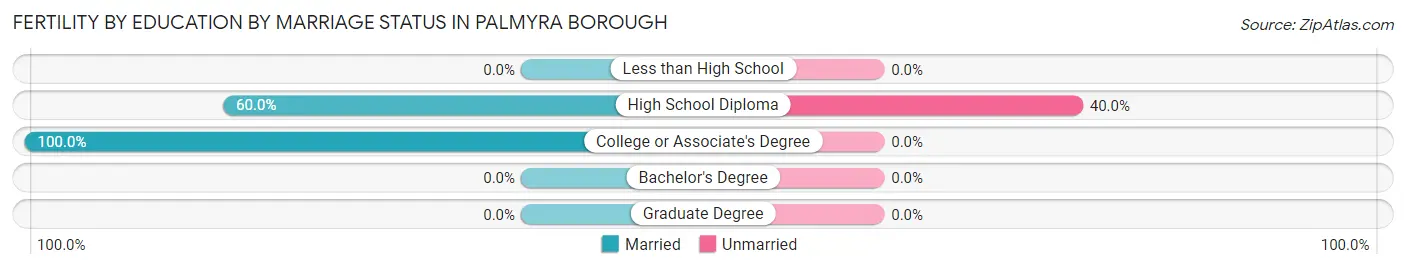
| Educational Attainment | Married | Unmarried |
| Less than High School | 0 (0.0%) | 0 (0.0%) |
| High School Diploma | 33 (60.0%) | 22 (40.0%) |
| College or Associate's Degree | 17 (100.0%) | 0 (0.0%) |
| Bachelor's Degree | 0 (0.0%) | 0 (0.0%) |
| Graduate Degree | 0 (0.0%) | 0 (0.0%) |
| Total | 50 (69.4%) | 22 (30.6%) |
Employment Characteristics in Palmyra borough
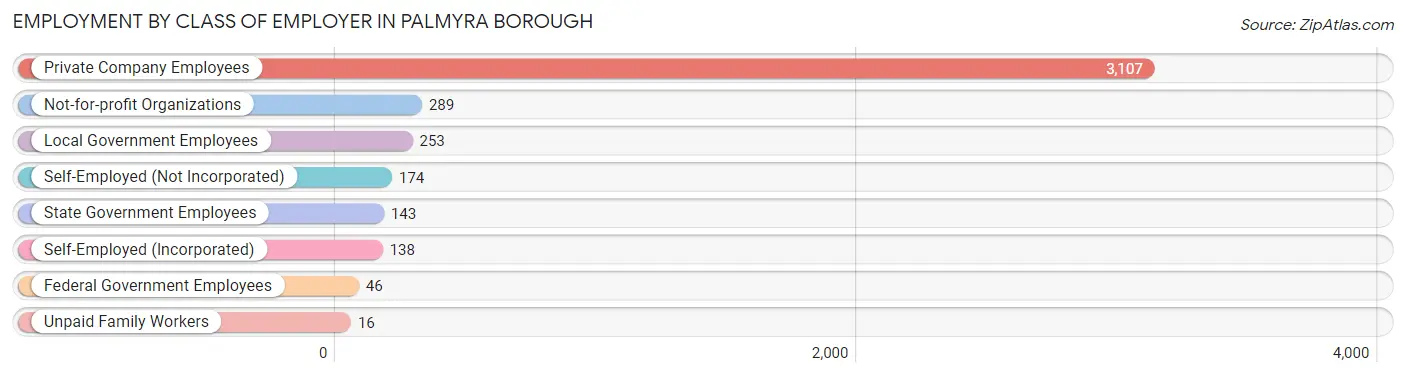
Employment by Class of Employer in Palmyra borough
Among the 4,166 employed individuals in Palmyra borough, private company employees (3,107 | 74.6%), not-for-profit organizations (289 | 6.9%), and local government employees (253 | 6.1%) make up the most common classes of employment.
| Employer Class | # Employees | % Employees |
| Private Company Employees | 3,107 | 74.6% |
| Self-Employed (Incorporated) | 138 | 3.3% |
| Self-Employed (Not Incorporated) | 174 | 4.2% |
| Not-for-profit Organizations | 289 | 6.9% |
| Local Government Employees | 253 | 6.1% |
| State Government Employees | 143 | 3.4% |
| Federal Government Employees | 46 | 1.1% |
| Unpaid Family Workers | 16 | 0.4% |
| Total | 4,166 | 100.0% |
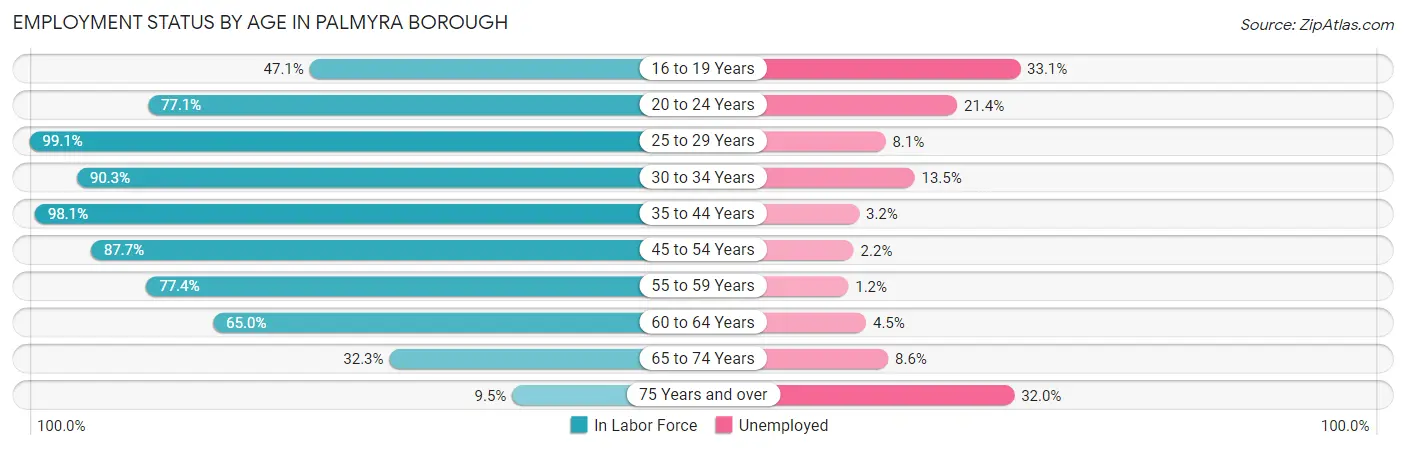
Employment Status by Age in Palmyra borough
According to the labor force statistics for Palmyra borough, out of the total population over 16 years of age (6,281), 73.4% or 4,610 individuals are in the labor force, with 7.6% or 350 of them unemployed. The age group with the highest labor force participation rate is 25 to 29 years, with 99.1% or 634 individuals in the labor force. Within the labor force, the 16 to 19 years age range has the highest percentage of unemployed individuals, with 33.1% or 59 of them being unemployed.
| Age Bracket | In Labor Force | Unemployed |
| 16 to 19 Years | 178 (47.1%) | 59 (33.1%) |
| 20 to 24 Years | 401 (77.1%) | 86 (21.4%) |
| 25 to 29 Years | 634 (99.1%) | 51 (8.1%) |
| 30 to 34 Years | 401 (90.3%) | 54 (13.5%) |
| 35 to 44 Years | 779 (98.1%) | 25 (3.2%) |
| 45 to 54 Years | 962 (87.7%) | 21 (2.2%) |
| 55 to 59 Years | 576 (77.4%) | 7 (1.2%) |
| 60 to 64 Years | 396 (65.0%) | 18 (4.5%) |
| 65 to 74 Years | 256 (32.3%) | 22 (8.6%) |
| 75 Years and over | 25 (9.5%) | 8 (32.0%) |
| Total | 4,610 (73.4%) | 350 (7.6%) |
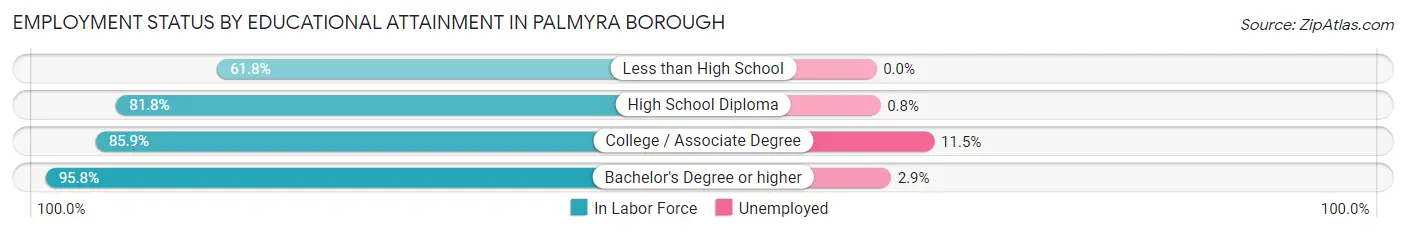
Employment Status by Educational Attainment in Palmyra borough
According to labor force statistics for Palmyra borough, 86.6% of individuals (3,748) out of the total population between 25 and 64 years of age (4,328) are in the labor force, with 4.7% or 176 of them being unemployed. The group with the highest labor force participation rate are those with the educational attainment of bachelor's degree or higher, with 95.8% or 1,362 individuals in the labor force. Within the labor force, individuals with college / associate degree education have the highest percentage of unemployment, with 11.5% or 129 of them being unemployed.
| Educational Attainment | In Labor Force | Unemployed |
| Less than High School | 134 (61.8%) | 0 (0.0%) |
| High School Diploma | 1,135 (81.8%) | 11 (0.8%) |
| College / Associate Degree | 1,118 (85.9%) | 150 (11.5%) |
| Bachelor's Degree or higher | 1,362 (95.8%) | 41 (2.9%) |
| Total | 3,748 (86.6%) | 203 (4.7%) |
Employment Occupations by Sex in Palmyra borough
Management, Business, Science and Arts Occupations
The most common Management, Business, Science and Arts occupations in Palmyra borough are Management (414 | 9.7%), Community & Social Service (360 | 8.5%), Computers, Engineering & Science (284 | 6.7%), Health Diagnosing & Treating (283 | 6.7%), and Business & Financial (211 | 5.0%).
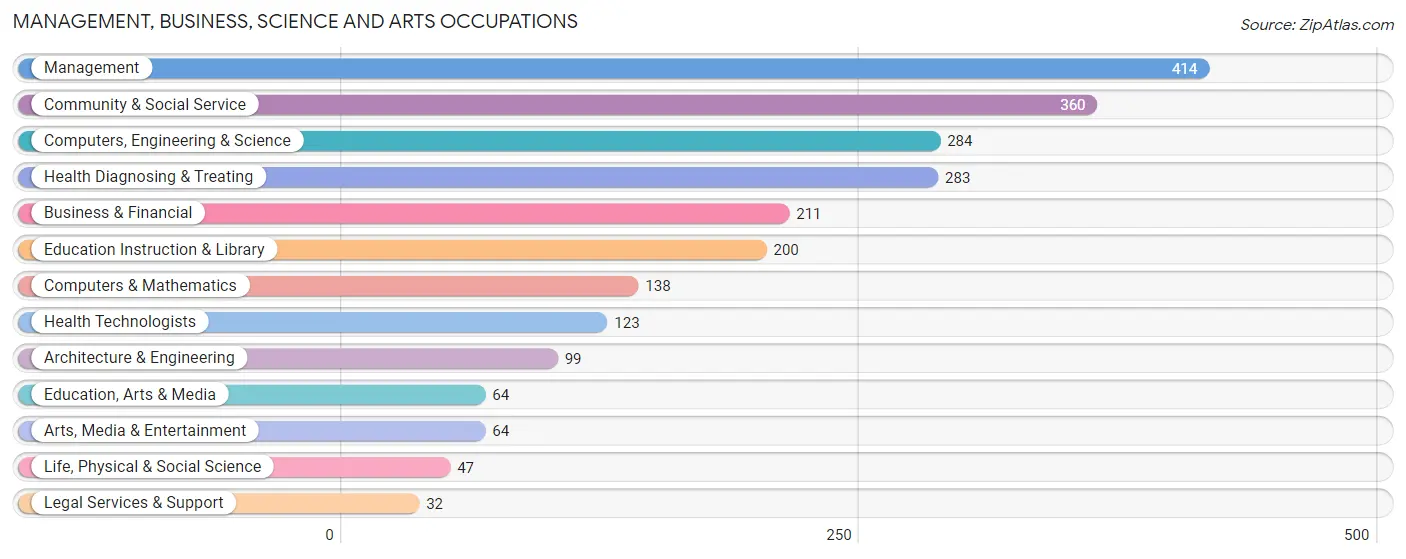
Management, Business, Science and Arts Occupations by Sex
Within the Management, Business, Science and Arts occupations in Palmyra borough, the most male-oriented occupations are Architecture & Engineering (100.0%), Computers & Mathematics (79.0%), and Computers, Engineering & Science (73.2%), while the most female-oriented occupations are Life, Physical & Social Science (100.0%), Legal Services & Support (100.0%), and Health Technologists (94.3%).
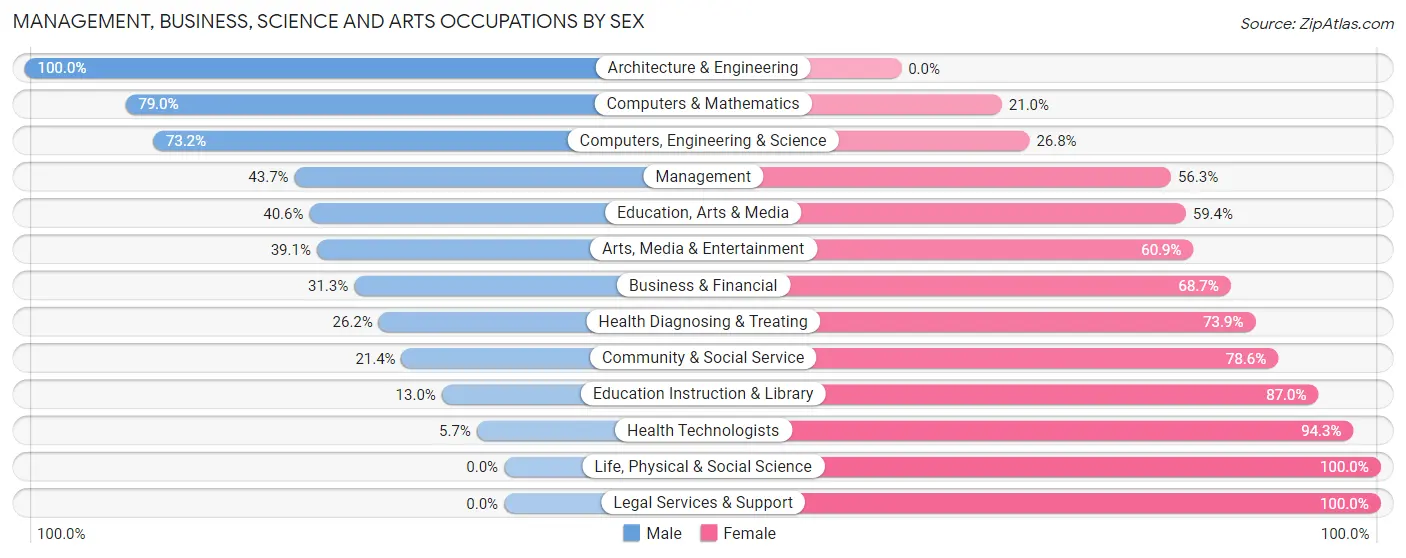
| Occupation | Male | Female |
| Management | 181 (43.7%) | 233 (56.3%) |
| Business & Financial | 66 (31.3%) | 145 (68.7%) |
| Computers, Engineering & Science | 208 (73.2%) | 76 (26.8%) |
| Computers & Mathematics | 109 (79.0%) | 29 (21.0%) |
| Architecture & Engineering | 99 (100.0%) | 0 (0.0%) |
| Life, Physical & Social Science | 0 (0.0%) | 47 (100.0%) |
| Community & Social Service | 77 (21.4%) | 283 (78.6%) |
| Education, Arts & Media | 26 (40.6%) | 38 (59.4%) |
| Legal Services & Support | 0 (0.0%) | 32 (100.0%) |
| Education Instruction & Library | 26 (13.0%) | 174 (87.0%) |
| Arts, Media & Entertainment | 25 (39.1%) | 39 (60.9%) |
| Health Diagnosing & Treating | 74 (26.2%) | 209 (73.9%) |
| Health Technologists | 7 (5.7%) | 116 (94.3%) |
| Total (Category) | 606 (39.1%) | 946 (61.0%) |
| Total (Overall) | 1,846 (43.4%) | 2,408 (56.6%) |
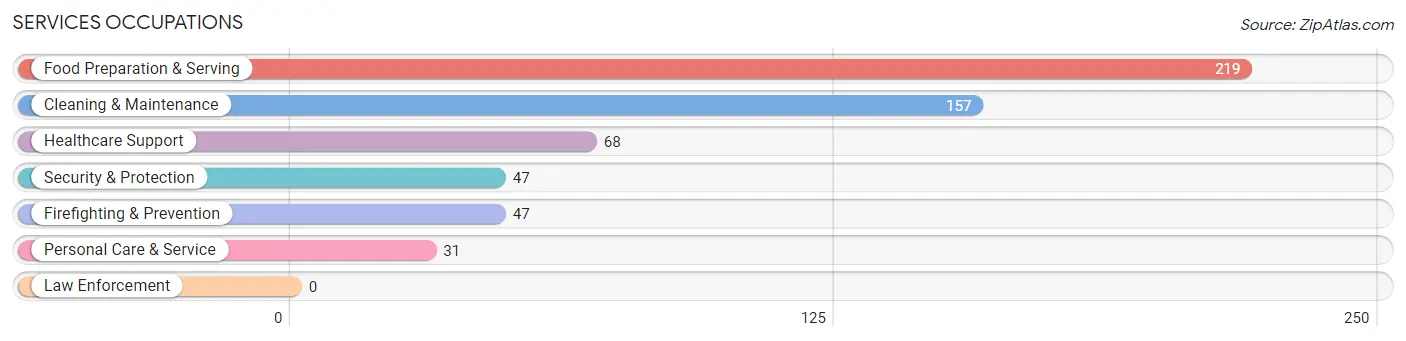
Services Occupations
The most common Services occupations in Palmyra borough are Food Preparation & Serving (219 | 5.1%), Cleaning & Maintenance (157 | 3.7%), Healthcare Support (68 | 1.6%), Security & Protection (47 | 1.1%), and Firefighting & Prevention (47 | 1.1%).
Services Occupations by Sex
Within the Services occupations in Palmyra borough, the most male-oriented occupations are Security & Protection (100.0%), Firefighting & Prevention (100.0%), and Personal Care & Service (38.7%), while the most female-oriented occupations are Healthcare Support (76.5%), Food Preparation & Serving (69.9%), and Cleaning & Maintenance (64.3%).
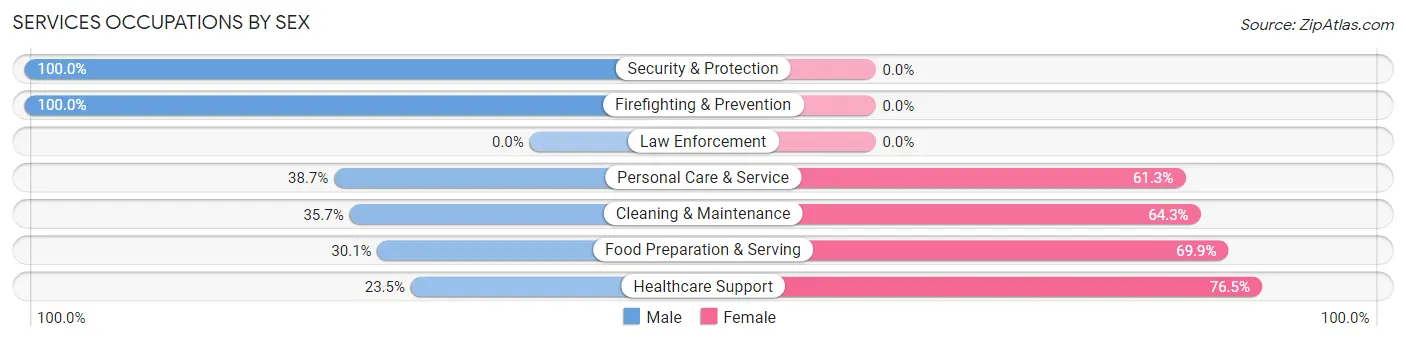
| Occupation | Male | Female |
| Healthcare Support | 16 (23.5%) | 52 (76.5%) |
| Security & Protection | 47 (100.0%) | 0 (0.0%) |
| Firefighting & Prevention | 47 (100.0%) | 0 (0.0%) |
| Law Enforcement | 0 (0.0%) | 0 (0.0%) |
| Food Preparation & Serving | 66 (30.1%) | 153 (69.9%) |
| Cleaning & Maintenance | 56 (35.7%) | 101 (64.3%) |
| Personal Care & Service | 12 (38.7%) | 19 (61.3%) |
| Total (Category) | 197 (37.7%) | 325 (62.3%) |
| Total (Overall) | 1,846 (43.4%) | 2,408 (56.6%) |
Sales and Office Occupations
The most common Sales and Office occupations in Palmyra borough are Office & Administration (761 | 17.9%), and Sales & Related (511 | 12.0%).

Sales and Office Occupations by Sex

| Occupation | Male | Female |
| Sales & Related | 221 (43.2%) | 290 (56.8%) |
| Office & Administration | 149 (19.6%) | 612 (80.4%) |
| Total (Category) | 370 (29.1%) | 902 (70.9%) |
| Total (Overall) | 1,846 (43.4%) | 2,408 (56.6%) |
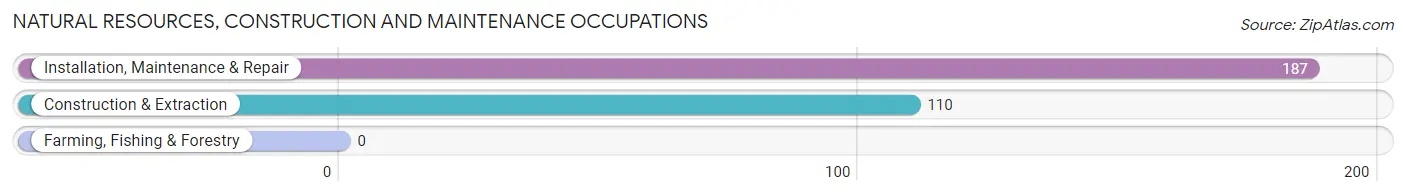
Natural Resources, Construction and Maintenance Occupations
The most common Natural Resources, Construction and Maintenance occupations in Palmyra borough are Installation, Maintenance & Repair (187 | 4.4%), and Construction & Extraction (110 | 2.6%).
Natural Resources, Construction and Maintenance Occupations by Sex

| Occupation | Male | Female |
| Farming, Fishing & Forestry | 0 (0.0%) | 0 (0.0%) |
| Construction & Extraction | 98 (89.1%) | 12 (10.9%) |
| Installation, Maintenance & Repair | 187 (100.0%) | 0 (0.0%) |
| Total (Category) | 285 (96.0%) | 12 (4.0%) |
| Total (Overall) | 1,846 (43.4%) | 2,408 (56.6%) |
Production, Transportation and Moving Occupations
The most common Production, Transportation and Moving occupations in Palmyra borough are Production (279 | 6.6%), Material Moving (196 | 4.6%), and Transportation (136 | 3.2%).
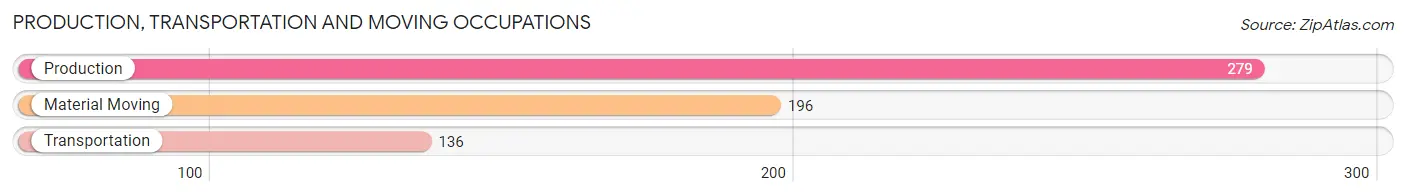
Production, Transportation and Moving Occupations by Sex
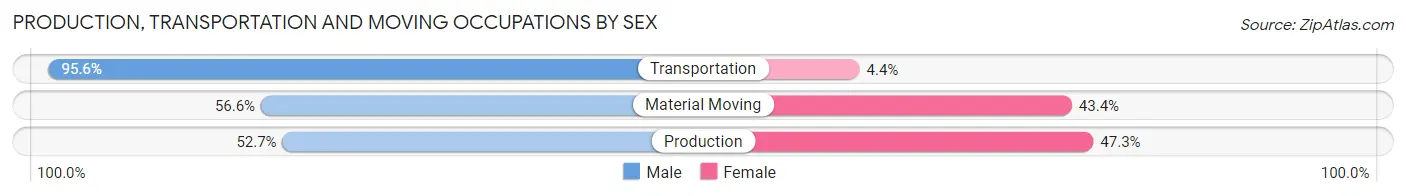
| Occupation | Male | Female |
| Production | 147 (52.7%) | 132 (47.3%) |
| Transportation | 130 (95.6%) | 6 (4.4%) |
| Material Moving | 111 (56.6%) | 85 (43.4%) |
| Total (Category) | 388 (63.5%) | 223 (36.5%) |
| Total (Overall) | 1,846 (43.4%) | 2,408 (56.6%) |
Employment Industries by Sex in Palmyra borough
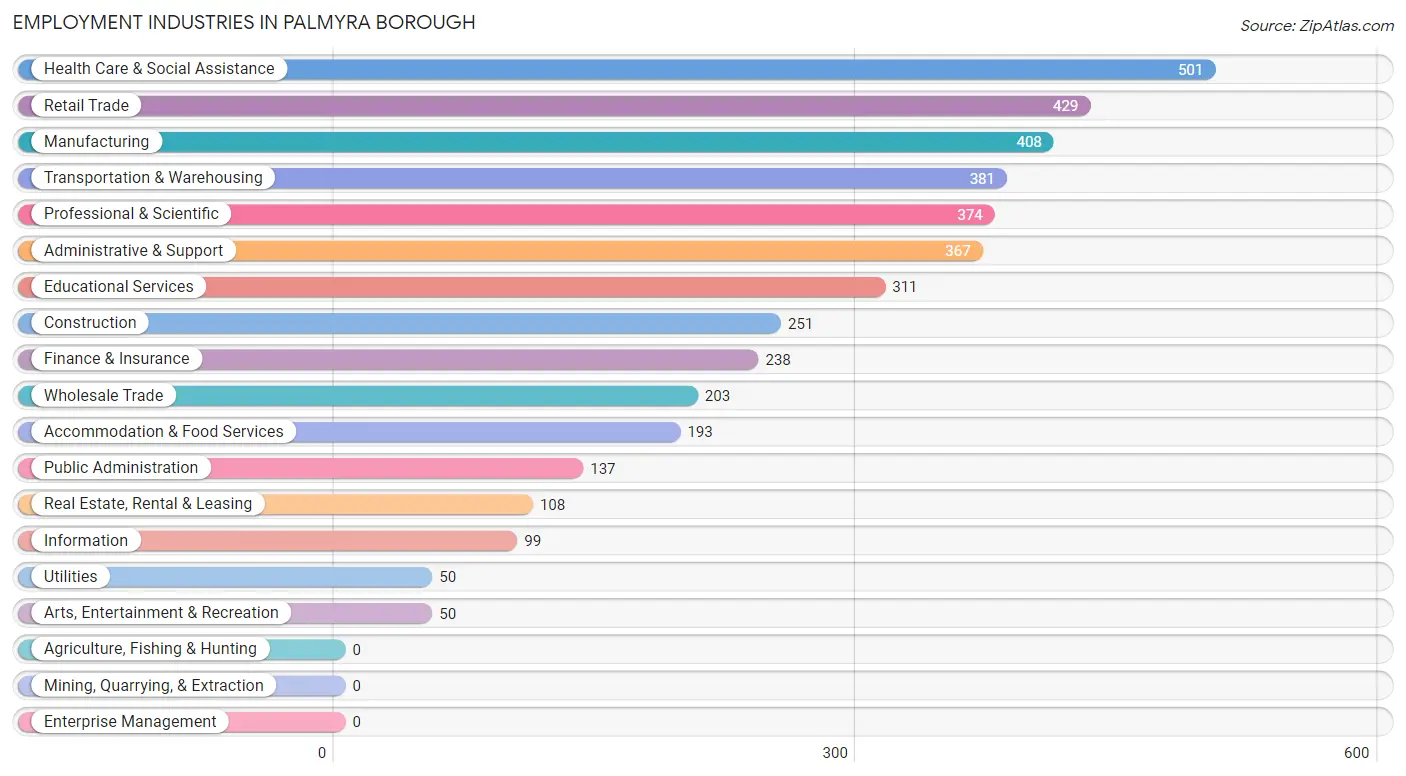
Employment Industries in Palmyra borough
The major employment industries in Palmyra borough include Health Care & Social Assistance (501 | 11.8%), Retail Trade (429 | 10.1%), Manufacturing (408 | 9.6%), Transportation & Warehousing (381 | 9.0%), and Professional & Scientific (374 | 8.8%).
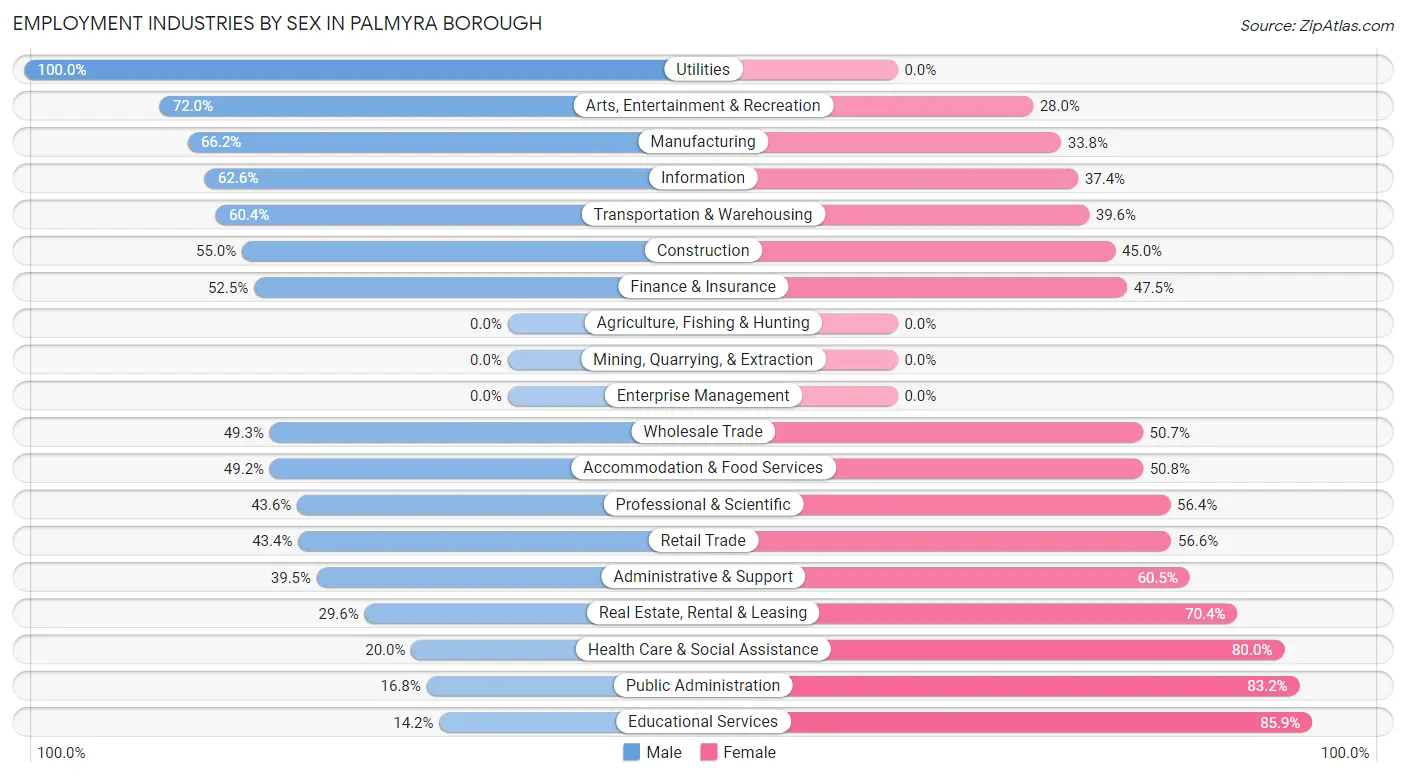
Employment Industries by Sex in Palmyra borough
The Palmyra borough industries that see more men than women are Utilities (100.0%), Arts, Entertainment & Recreation (72.0%), and Manufacturing (66.2%), whereas the industries that tend to have a higher number of women are Educational Services (85.9%), Public Administration (83.2%), and Health Care & Social Assistance (80.0%).
| Industry | Male | Female |
| Agriculture, Fishing & Hunting | 0 (0.0%) | 0 (0.0%) |
| Mining, Quarrying, & Extraction | 0 (0.0%) | 0 (0.0%) |
| Construction | 138 (55.0%) | 113 (45.0%) |
| Manufacturing | 270 (66.2%) | 138 (33.8%) |
| Wholesale Trade | 100 (49.3%) | 103 (50.7%) |
| Retail Trade | 186 (43.4%) | 243 (56.6%) |
| Transportation & Warehousing | 230 (60.4%) | 151 (39.6%) |
| Utilities | 50 (100.0%) | 0 (0.0%) |
| Information | 62 (62.6%) | 37 (37.4%) |
| Finance & Insurance | 125 (52.5%) | 113 (47.5%) |
| Real Estate, Rental & Leasing | 32 (29.6%) | 76 (70.4%) |
| Professional & Scientific | 163 (43.6%) | 211 (56.4%) |
| Enterprise Management | 0 (0.0%) | 0 (0.0%) |
| Administrative & Support | 145 (39.5%) | 222 (60.5%) |
| Educational Services | 44 (14.1%) | 267 (85.9%) |
| Health Care & Social Assistance | 100 (20.0%) | 401 (80.0%) |
| Arts, Entertainment & Recreation | 36 (72.0%) | 14 (28.0%) |
| Accommodation & Food Services | 95 (49.2%) | 98 (50.8%) |
| Public Administration | 23 (16.8%) | 114 (83.2%) |
| Total | 1,846 (43.4%) | 2,408 (56.6%) |
Education in Palmyra borough
School Enrollment in Palmyra borough
The most common levels of schooling among the 1,517 students in Palmyra borough are high school (482 | 31.8%), college / undergraduate (370 | 24.4%), and middle school (283 | 18.7%).
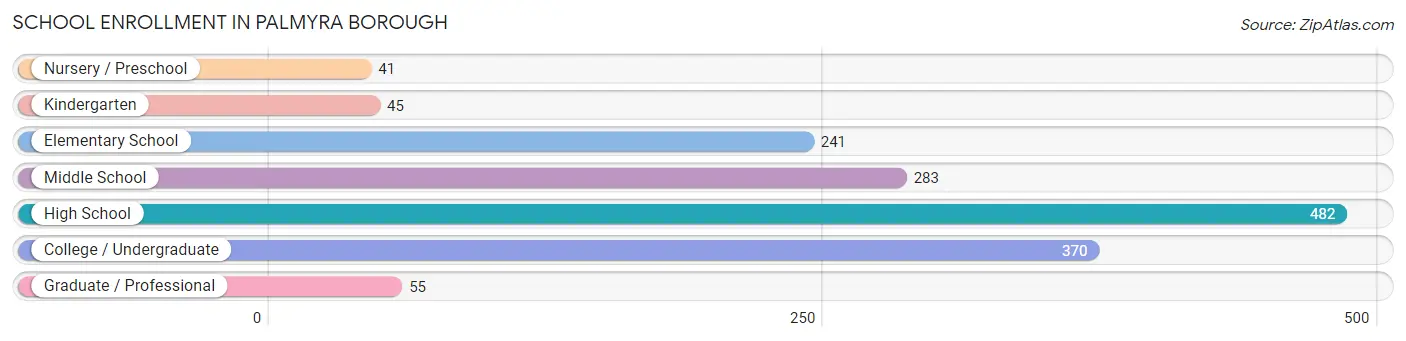
| School Level | # Students | % Students |
| Nursery / Preschool | 41 | 2.7% |
| Kindergarten | 45 | 3.0% |
| Elementary School | 241 | 15.9% |
| Middle School | 283 | 18.7% |
| High School | 482 | 31.8% |
| College / Undergraduate | 370 | 24.4% |
| Graduate / Professional | 55 | 3.6% |
| Total | 1,517 | 100.0% |
School Enrollment by Age by Funding Source in Palmyra borough
Out of a total of 1,517 students who are enrolled in schools in Palmyra borough, 285 (18.8%) attend a private institution, while the remaining 1,232 (81.2%) are enrolled in public schools. The age group of 25 to 34 year olds has the highest likelihood of being enrolled in private schools, with 85 (65.4% in the age bracket) enrolled. Conversely, the age group of 5 to 9 year old has the lowest likelihood of being enrolled in a private school, with 212 (100.0% in the age bracket) attending a public institution.
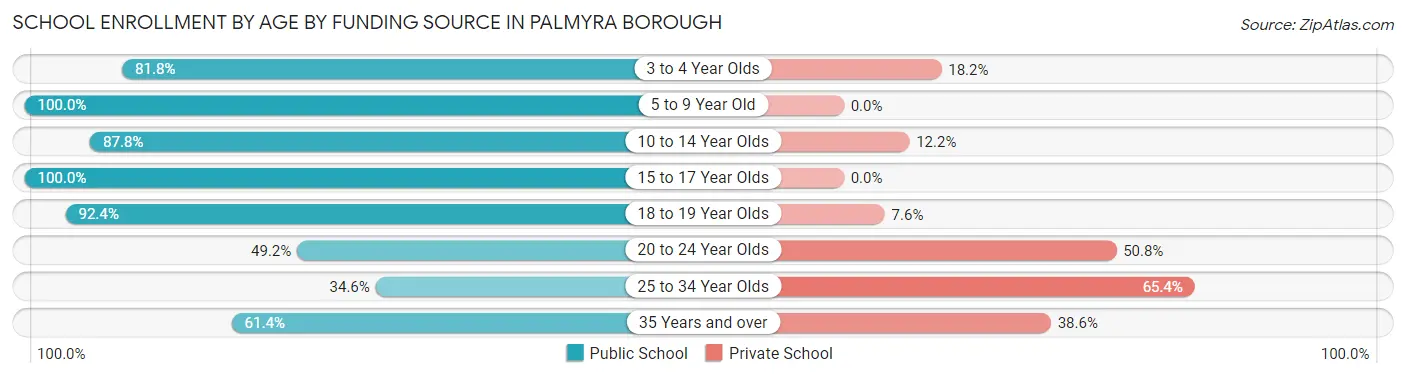
| Age Bracket | Public School | Private School |
| 3 to 4 Year Olds | 27 (81.8%) | 6 (18.2%) |
| 5 to 9 Year Old | 212 (100.0%) | 0 (0.0%) |
| 10 to 14 Year Olds | 417 (87.8%) | 58 (12.2%) |
| 15 to 17 Year Olds | 282 (100.0%) | 0 (0.0%) |
| 18 to 19 Year Olds | 109 (92.4%) | 9 (7.6%) |
| 20 to 24 Year Olds | 97 (49.2%) | 100 (50.8%) |
| 25 to 34 Year Olds | 45 (34.6%) | 85 (65.4%) |
| 35 Years and over | 43 (61.4%) | 27 (38.6%) |
| Total | 1,232 (81.2%) | 285 (18.8%) |
Educational Attainment by Field of Study in Palmyra borough
Business (279 | 15.8%), communications (202 | 11.5%), education (179 | 10.2%), science & technology (174 | 9.9%), and engineering (130 | 7.4%) are the most common fields of study among 1,763 individuals in Palmyra borough who have obtained a bachelor's degree or higher.
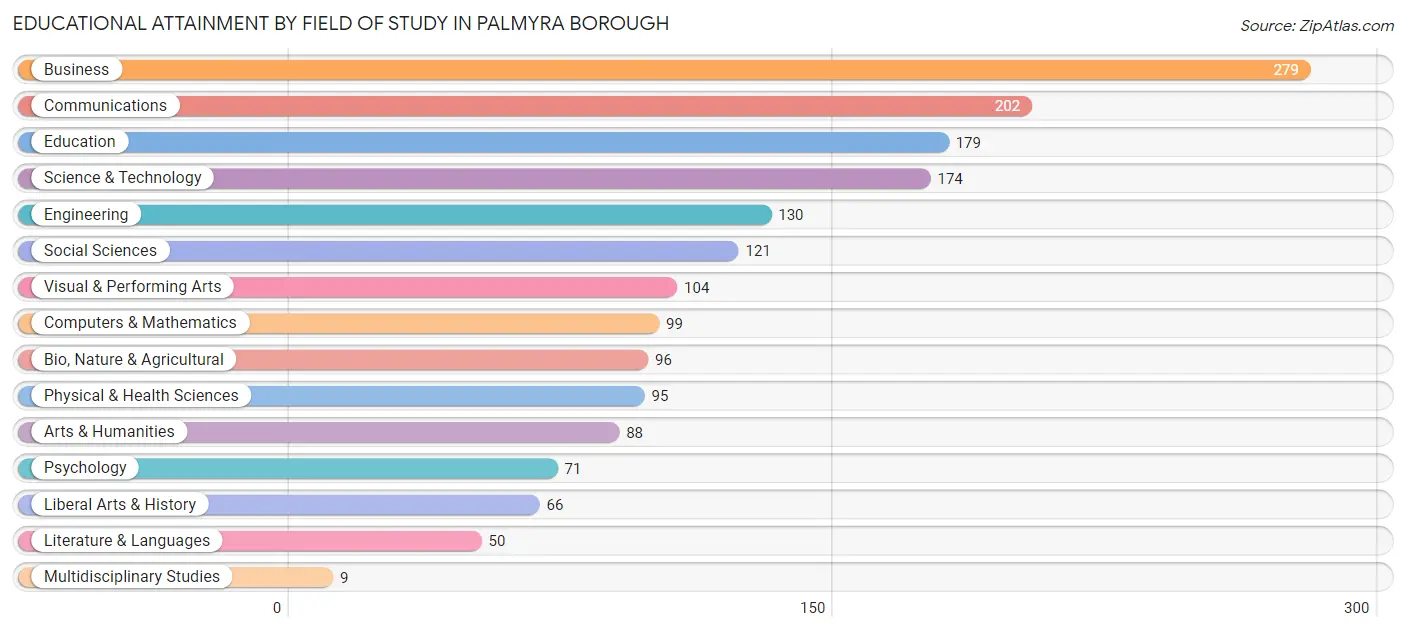
| Field of Study | # Graduates | % Graduates |
| Computers & Mathematics | 99 | 5.6% |
| Bio, Nature & Agricultural | 96 | 5.4% |
| Physical & Health Sciences | 95 | 5.4% |
| Psychology | 71 | 4.0% |
| Social Sciences | 121 | 6.9% |
| Engineering | 130 | 7.4% |
| Multidisciplinary Studies | 9 | 0.5% |
| Science & Technology | 174 | 9.9% |
| Business | 279 | 15.8% |
| Education | 179 | 10.2% |
| Literature & Languages | 50 | 2.8% |
| Liberal Arts & History | 66 | 3.7% |
| Visual & Performing Arts | 104 | 5.9% |
| Communications | 202 | 11.5% |
| Arts & Humanities | 88 | 5.0% |
| Total | 1,763 | 100.0% |
Transportation & Commute in Palmyra borough
Vehicle Availability by Sex in Palmyra borough
The most prevalent vehicle ownership categories in Palmyra borough are males with 2 vehicles (887, accounting for 48.5%) and females with 2 vehicles (980, making up 37.9%).
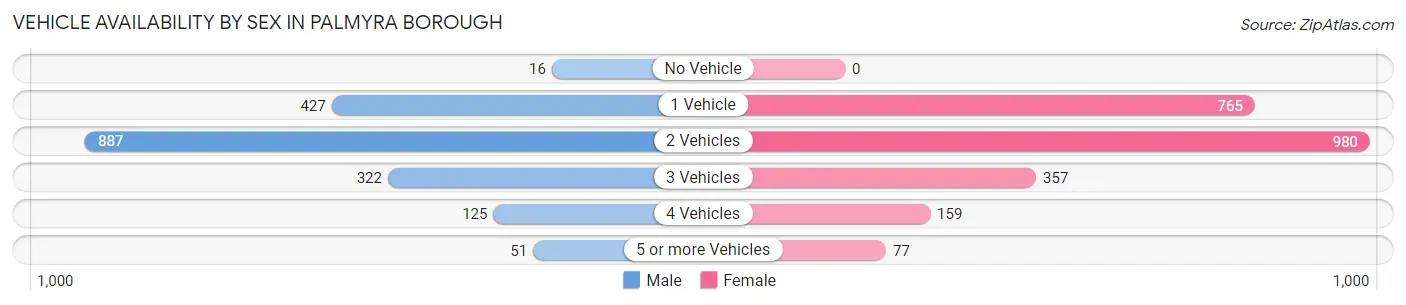
| Vehicles Available | Male | Female |
| No Vehicle | 16 (0.9%) | 0 (0.0%) |
| 1 Vehicle | 427 (23.4%) | 765 (32.7%) |
| 2 Vehicles | 887 (48.5%) | 980 (41.9%) |
| 3 Vehicles | 322 (17.6%) | 357 (15.3%) |
| 4 Vehicles | 125 (6.8%) | 159 (6.8%) |
| 5 or more Vehicles | 51 (2.8%) | 77 (3.3%) |
| Total | 1,828 (100.0%) | 2,338 (100.0%) |
Commute Time in Palmyra borough
The most frequently occuring commute durations in Palmyra borough are 20 to 24 minutes (632 commuters, 17.3%), 30 to 34 minutes (588 commuters, 16.1%), and 15 to 19 minutes (516 commuters, 14.1%).
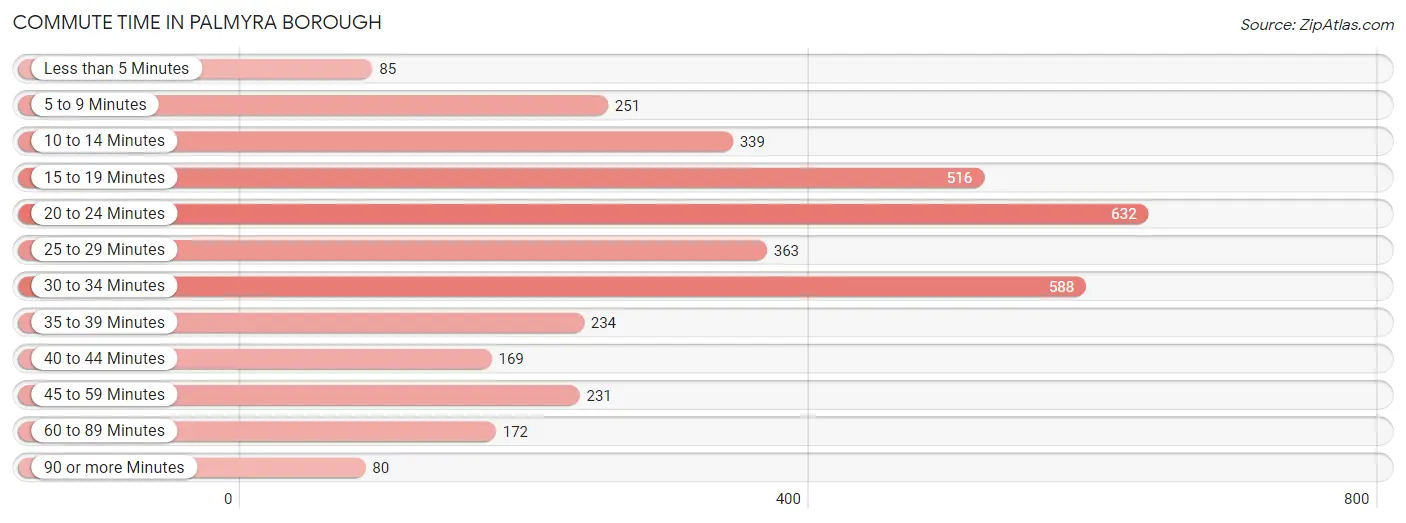
| Commute Time | # Commuters | % Commuters |
| Less than 5 Minutes | 85 | 2.3% |
| 5 to 9 Minutes | 251 | 6.9% |
| 10 to 14 Minutes | 339 | 9.3% |
| 15 to 19 Minutes | 516 | 14.1% |
| 20 to 24 Minutes | 632 | 17.3% |
| 25 to 29 Minutes | 363 | 9.9% |
| 30 to 34 Minutes | 588 | 16.1% |
| 35 to 39 Minutes | 234 | 6.4% |
| 40 to 44 Minutes | 169 | 4.6% |
| 45 to 59 Minutes | 231 | 6.3% |
| 60 to 89 Minutes | 172 | 4.7% |
| 90 or more Minutes | 80 | 2.2% |
Commute Time by Sex in Palmyra borough
The most common commute times in Palmyra borough are 15 to 19 minutes (311 commuters, 18.9%) for males and 20 to 24 minutes (417 commuters, 20.7%) for females.
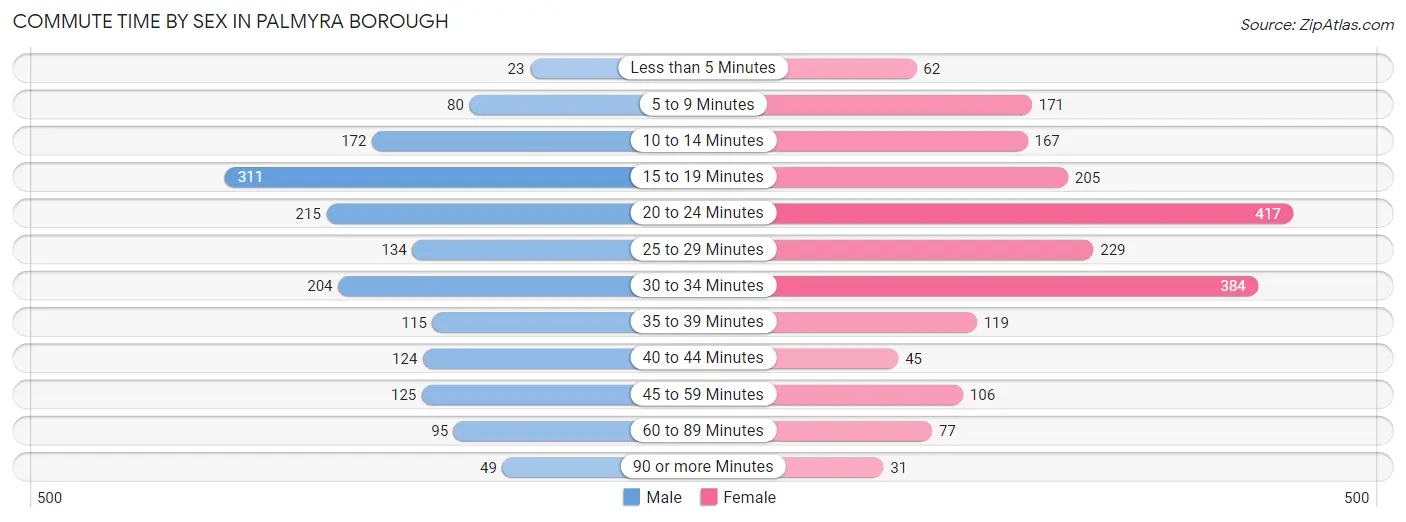
| Commute Time | Male | Female |
| Less than 5 Minutes | 23 (1.4%) | 62 (3.1%) |
| 5 to 9 Minutes | 80 (4.9%) | 171 (8.5%) |
| 10 to 14 Minutes | 172 (10.4%) | 167 (8.3%) |
| 15 to 19 Minutes | 311 (18.9%) | 205 (10.2%) |
| 20 to 24 Minutes | 215 (13.1%) | 417 (20.7%) |
| 25 to 29 Minutes | 134 (8.1%) | 229 (11.4%) |
| 30 to 34 Minutes | 204 (12.4%) | 384 (19.1%) |
| 35 to 39 Minutes | 115 (7.0%) | 119 (5.9%) |
| 40 to 44 Minutes | 124 (7.5%) | 45 (2.2%) |
| 45 to 59 Minutes | 125 (7.6%) | 106 (5.3%) |
| 60 to 89 Minutes | 95 (5.8%) | 77 (3.8%) |
| 90 or more Minutes | 49 (3.0%) | 31 (1.5%) |
Time of Departure to Work by Sex in Palmyra borough
The most frequent times of departure to work in Palmyra borough are 6:30 AM to 6:59 AM (240, 14.6%) for males and 7:00 AM to 7:29 AM (361, 17.9%) for females.
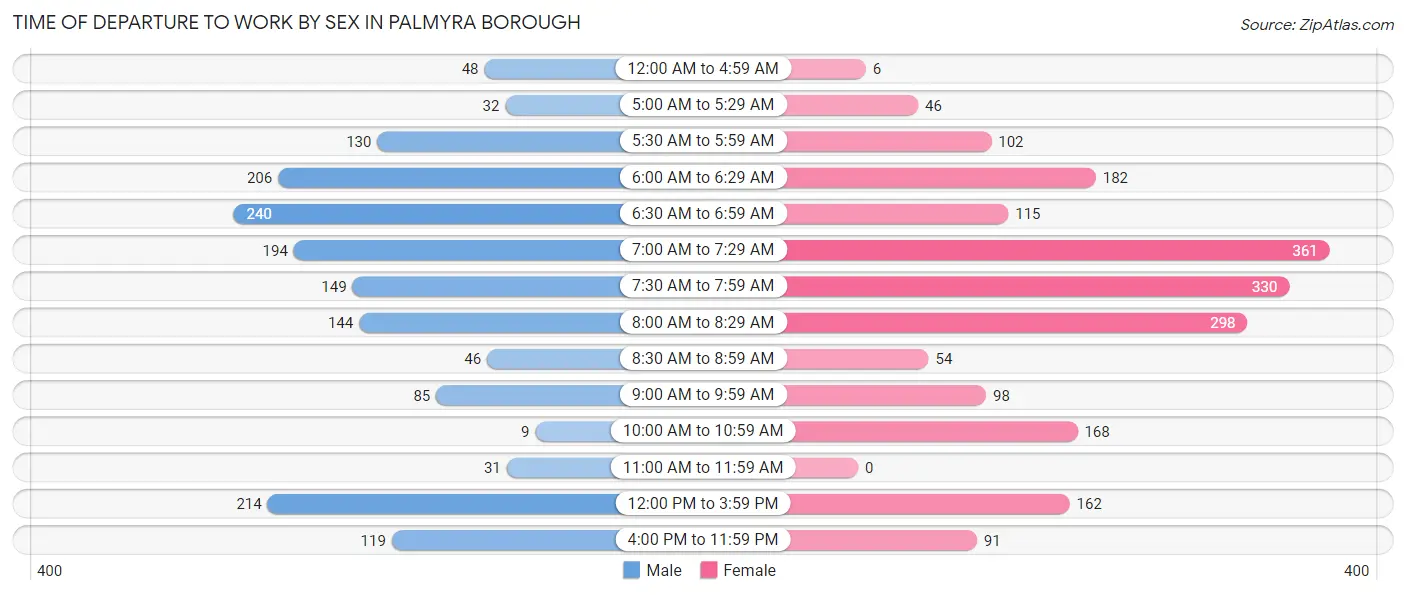
| Time of Departure | Male | Female |
| 12:00 AM to 4:59 AM | 48 (2.9%) | 6 (0.3%) |
| 5:00 AM to 5:29 AM | 32 (1.9%) | 46 (2.3%) |
| 5:30 AM to 5:59 AM | 130 (7.9%) | 102 (5.1%) |
| 6:00 AM to 6:29 AM | 206 (12.5%) | 182 (9.0%) |
| 6:30 AM to 6:59 AM | 240 (14.6%) | 115 (5.7%) |
| 7:00 AM to 7:29 AM | 194 (11.8%) | 361 (17.9%) |
| 7:30 AM to 7:59 AM | 149 (9.0%) | 330 (16.4%) |
| 8:00 AM to 8:29 AM | 144 (8.7%) | 298 (14.8%) |
| 8:30 AM to 8:59 AM | 46 (2.8%) | 54 (2.7%) |
| 9:00 AM to 9:59 AM | 85 (5.2%) | 98 (4.9%) |
| 10:00 AM to 10:59 AM | 9 (0.5%) | 168 (8.4%) |
| 11:00 AM to 11:59 AM | 31 (1.9%) | 0 (0.0%) |
| 12:00 PM to 3:59 PM | 214 (13.0%) | 162 (8.1%) |
| 4:00 PM to 11:59 PM | 119 (7.2%) | 91 (4.5%) |
| Total | 1,647 (100.0%) | 2,013 (100.0%) |
Housing Occupancy in Palmyra borough
Occupancy by Ownership in Palmyra borough
Of the total 3,200 dwellings in Palmyra borough, owner-occupied units account for 2,389 (74.7%), while renter-occupied units make up 811 (25.3%).
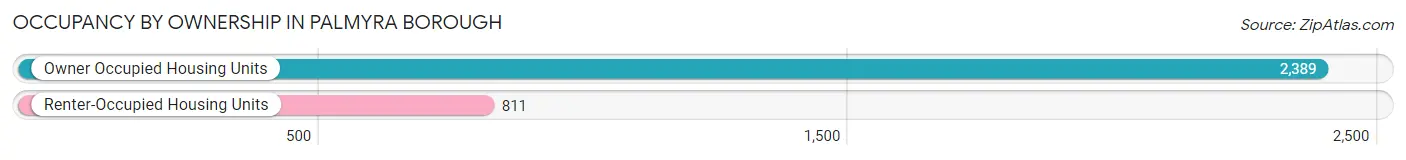
| Occupancy | # Housing Units | % Housing Units |
| Owner Occupied Housing Units | 2,389 | 74.7% |
| Renter-Occupied Housing Units | 811 | 25.3% |
| Total Occupied Housing Units | 3,200 | 100.0% |
Occupancy by Household Size in Palmyra borough
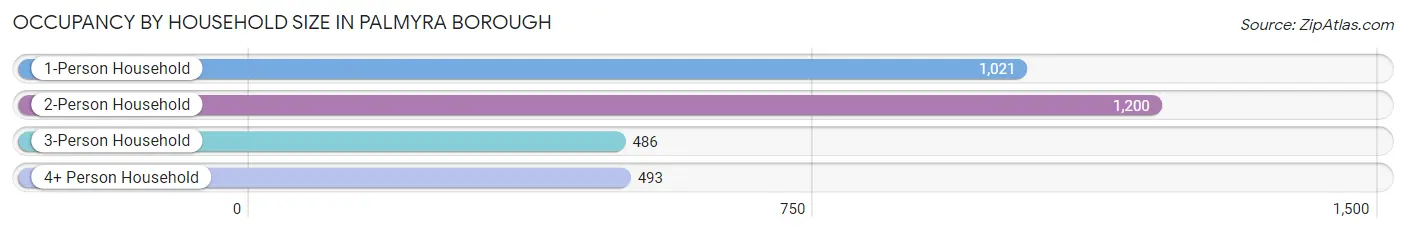
| Household Size | # Housing Units | % Housing Units |
| 1-Person Household | 1,021 | 31.9% |
| 2-Person Household | 1,200 | 37.5% |
| 3-Person Household | 486 | 15.2% |
| 4+ Person Household | 493 | 15.4% |
| Total Housing Units | 3,200 | 100.0% |
Occupancy by Ownership by Household Size in Palmyra borough
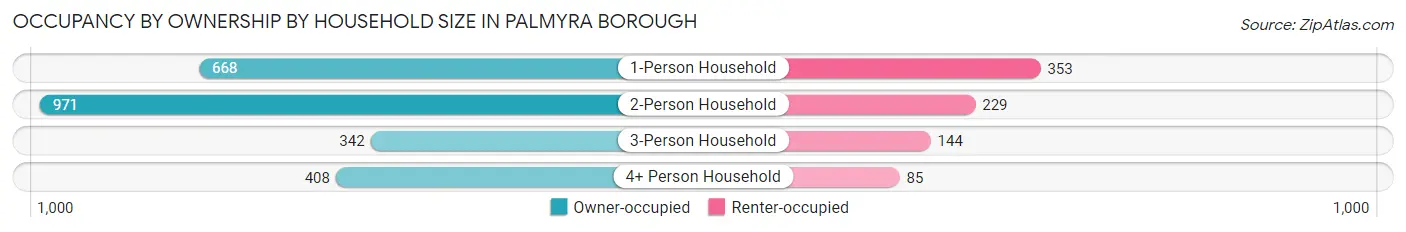
| Household Size | Owner-occupied | Renter-occupied |
| 1-Person Household | 668 (65.4%) | 353 (34.6%) |
| 2-Person Household | 971 (80.9%) | 229 (19.1%) |
| 3-Person Household | 342 (70.4%) | 144 (29.6%) |
| 4+ Person Household | 408 (82.8%) | 85 (17.2%) |
| Total Housing Units | 2,389 (74.7%) | 811 (25.3%) |
Occupancy by Educational Attainment in Palmyra borough
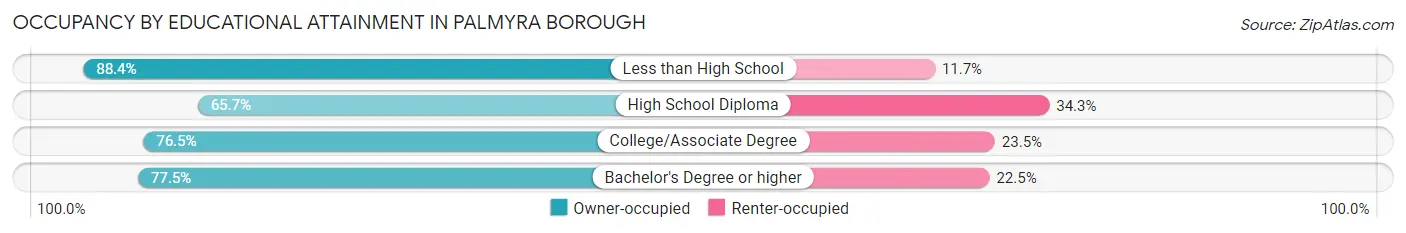
| Household Size | Owner-occupied | Renter-occupied |
| Less than High School | 182 (88.3%) | 24 (11.7%) |
| High School Diploma | 572 (65.7%) | 299 (34.3%) |
| College/Associate Degree | 783 (76.5%) | 241 (23.5%) |
| Bachelor's Degree or higher | 852 (77.5%) | 247 (22.5%) |
Occupancy by Age of Householder in Palmyra borough
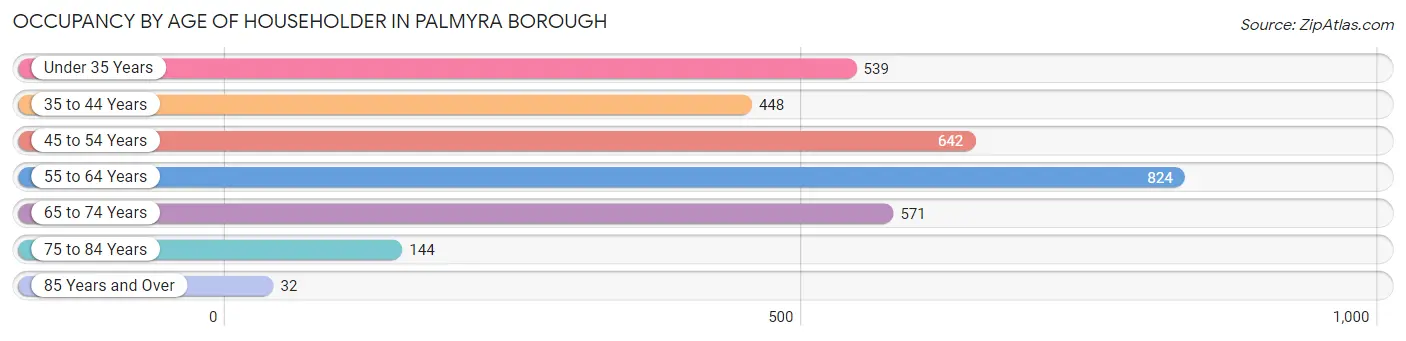
| Age Bracket | # Households | % Households |
| Under 35 Years | 539 | 16.8% |
| 35 to 44 Years | 448 | 14.0% |
| 45 to 54 Years | 642 | 20.1% |
| 55 to 64 Years | 824 | 25.8% |
| 65 to 74 Years | 571 | 17.8% |
| 75 to 84 Years | 144 | 4.5% |
| 85 Years and Over | 32 | 1.0% |
| Total | 3,200 | 100.0% |
Housing Finances in Palmyra borough
Median Income by Occupancy in Palmyra borough
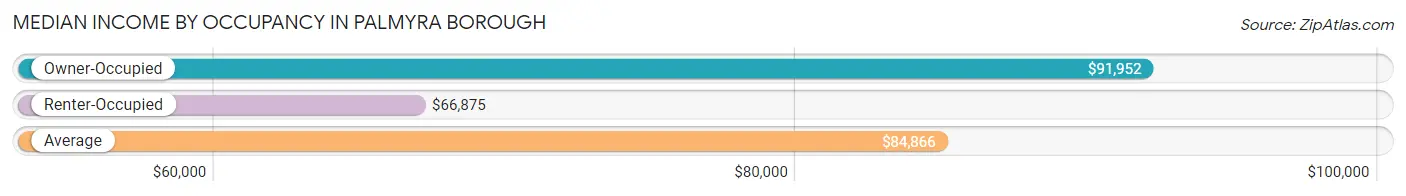
| Occupancy Type | # Households | Median Income |
| Owner-Occupied | 2,389 (74.7%) | $91,952 |
| Renter-Occupied | 811 (25.3%) | $66,875 |
| Average | 3,200 (100.0%) | $84,866 |
Occupancy by Householder Income Bracket in Palmyra borough
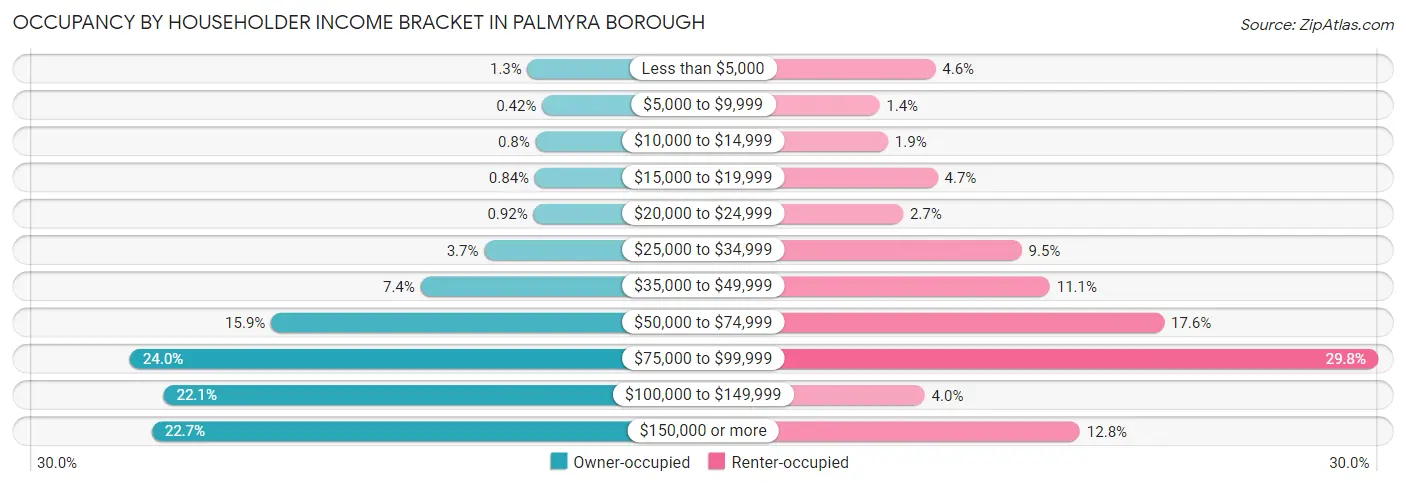
| Income Bracket | Owner-occupied | Renter-occupied |
| Less than $5,000 | 30 (1.3%) | 37 (4.6%) |
| $5,000 to $9,999 | 10 (0.4%) | 11 (1.4%) |
| $10,000 to $14,999 | 19 (0.8%) | 15 (1.8%) |
| $15,000 to $19,999 | 20 (0.8%) | 38 (4.7%) |
| $20,000 to $24,999 | 22 (0.9%) | 22 (2.7%) |
| $25,000 to $34,999 | 89 (3.7%) | 77 (9.5%) |
| $35,000 to $49,999 | 176 (7.4%) | 90 (11.1%) |
| $50,000 to $74,999 | 380 (15.9%) | 143 (17.6%) |
| $75,000 to $99,999 | 573 (24.0%) | 242 (29.8%) |
| $100,000 to $149,999 | 527 (22.1%) | 32 (4.0%) |
| $150,000 or more | 543 (22.7%) | 104 (12.8%) |
| Total | 2,389 (100.0%) | 811 (100.0%) |
Monthly Housing Cost Tiers in Palmyra borough
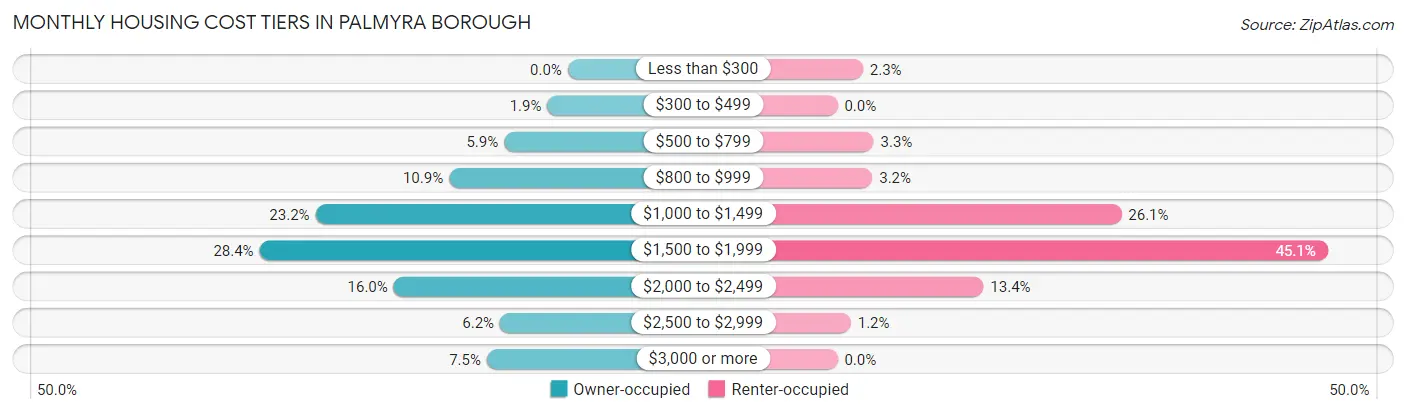
| Monthly Cost | Owner-occupied | Renter-occupied |
| Less than $300 | 0 (0.0%) | 19 (2.3%) |
| $300 to $499 | 45 (1.9%) | 0 (0.0%) |
| $500 to $799 | 140 (5.9%) | 27 (3.3%) |
| $800 to $999 | 261 (10.9%) | 26 (3.2%) |
| $1,000 to $1,499 | 555 (23.2%) | 212 (26.1%) |
| $1,500 to $1,999 | 678 (28.4%) | 366 (45.1%) |
| $2,000 to $2,499 | 383 (16.0%) | 109 (13.4%) |
| $2,500 to $2,999 | 149 (6.2%) | 10 (1.2%) |
| $3,000 or more | 178 (7.4%) | 0 (0.0%) |
| Total | 2,389 (100.0%) | 811 (100.0%) |
Physical Housing Characteristics in Palmyra borough
Housing Structures in Palmyra borough
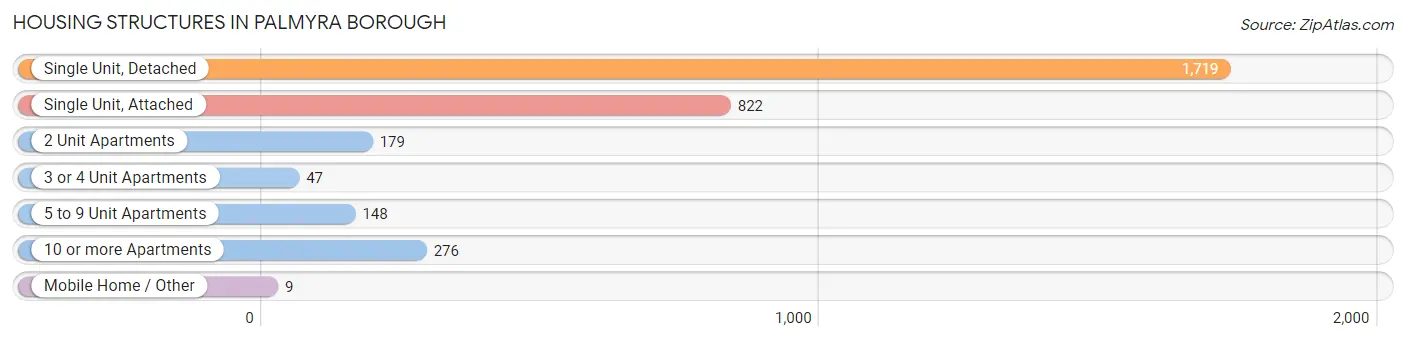
| Structure Type | # Housing Units | % Housing Units |
| Single Unit, Detached | 1,719 | 53.7% |
| Single Unit, Attached | 822 | 25.7% |
| 2 Unit Apartments | 179 | 5.6% |
| 3 or 4 Unit Apartments | 47 | 1.5% |
| 5 to 9 Unit Apartments | 148 | 4.6% |
| 10 or more Apartments | 276 | 8.6% |
| Mobile Home / Other | 9 | 0.3% |
| Total | 3,200 | 100.0% |
Housing Structures by Occupancy in Palmyra borough
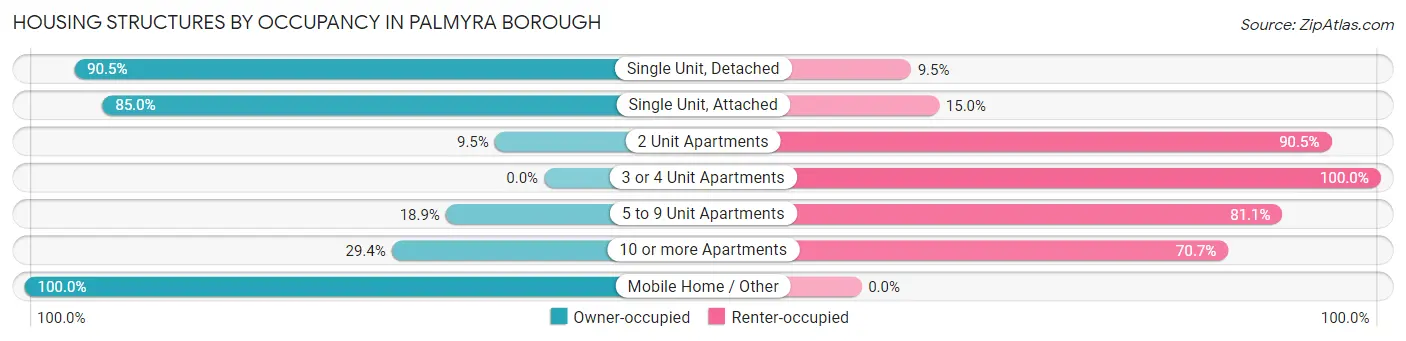
| Structure Type | Owner-occupied | Renter-occupied |
| Single Unit, Detached | 1,555 (90.5%) | 164 (9.5%) |
| Single Unit, Attached | 699 (85.0%) | 123 (15.0%) |
| 2 Unit Apartments | 17 (9.5%) | 162 (90.5%) |
| 3 or 4 Unit Apartments | 0 (0.0%) | 47 (100.0%) |
| 5 to 9 Unit Apartments | 28 (18.9%) | 120 (81.1%) |
| 10 or more Apartments | 81 (29.3%) | 195 (70.7%) |
| Mobile Home / Other | 9 (100.0%) | 0 (0.0%) |
| Total | 2,389 (74.7%) | 811 (25.3%) |
Housing Structures by Number of Rooms in Palmyra borough
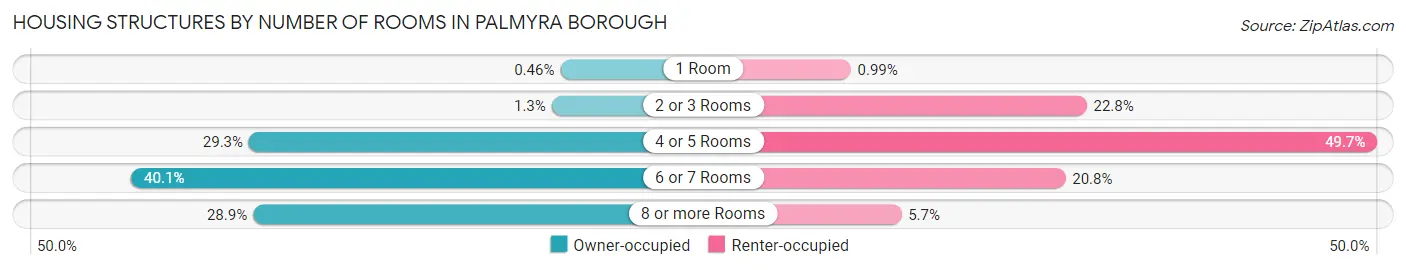
| Number of Rooms | Owner-occupied | Renter-occupied |
| 1 Room | 11 (0.5%) | 8 (1.0%) |
| 2 or 3 Rooms | 30 (1.3%) | 185 (22.8%) |
| 4 or 5 Rooms | 699 (29.3%) | 403 (49.7%) |
| 6 or 7 Rooms | 959 (40.1%) | 169 (20.8%) |
| 8 or more Rooms | 690 (28.9%) | 46 (5.7%) |
| Total | 2,389 (100.0%) | 811 (100.0%) |
Housing Structure by Heating Type in Palmyra borough
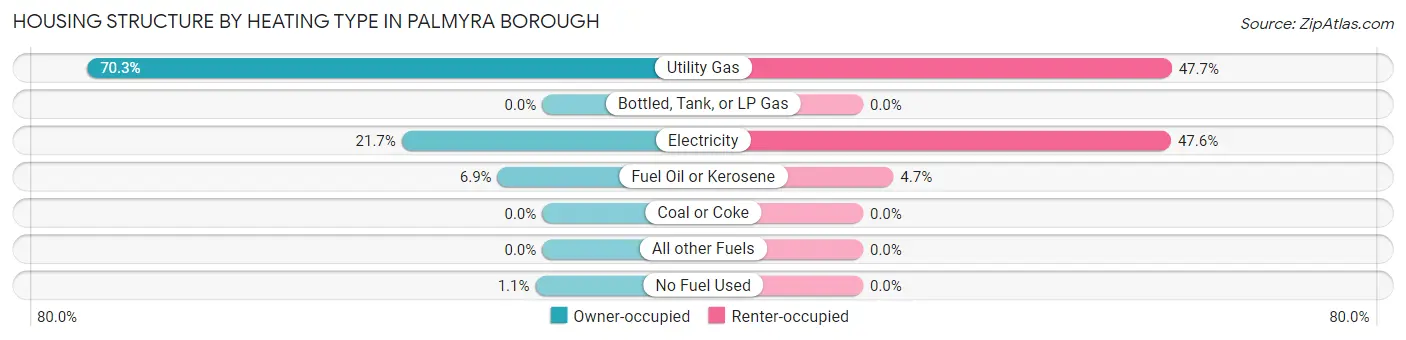
| Heating Type | Owner-occupied | Renter-occupied |
| Utility Gas | 1,680 (70.3%) | 387 (47.7%) |
| Bottled, Tank, or LP Gas | 0 (0.0%) | 0 (0.0%) |
| Electricity | 519 (21.7%) | 386 (47.6%) |
| Fuel Oil or Kerosene | 165 (6.9%) | 38 (4.7%) |
| Coal or Coke | 0 (0.0%) | 0 (0.0%) |
| All other Fuels | 0 (0.0%) | 0 (0.0%) |
| No Fuel Used | 25 (1.1%) | 0 (0.0%) |
| Total | 2,389 (100.0%) | 811 (100.0%) |
Household Vehicle Usage in Palmyra borough
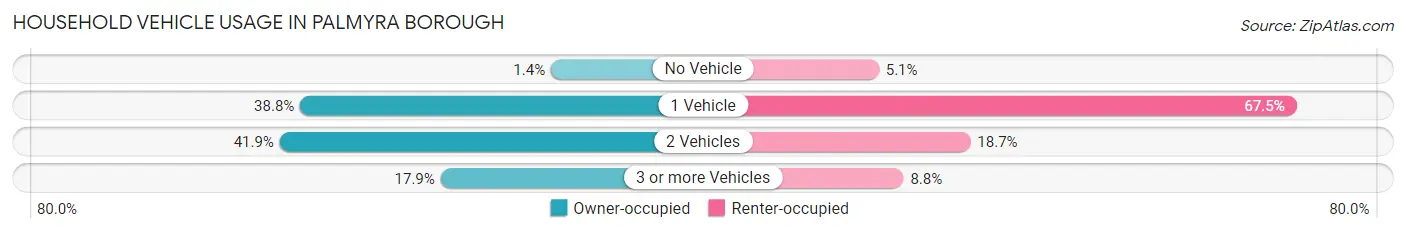
| Vehicles per Household | Owner-occupied | Renter-occupied |
| No Vehicle | 33 (1.4%) | 41 (5.1%) |
| 1 Vehicle | 928 (38.8%) | 547 (67.4%) |
| 2 Vehicles | 1,001 (41.9%) | 152 (18.7%) |
| 3 or more Vehicles | 427 (17.9%) | 71 (8.7%) |
| Total | 2,389 (100.0%) | 811 (100.0%) |
Real Estate & Mortgages in Palmyra borough
Real Estate and Mortgage Overview in Palmyra borough
| Characteristic | Without Mortgage | With Mortgage |
| Housing Units | 663 | 1,726 |
| Median Property Value | $186,000 | $210,000 |
| Median Household Income | $77,415 | $477 |
| Monthly Housing Costs | $936 | $178 |
| Real Estate Taxes | $6,171 | $65 |
Property Value by Mortgage Status in Palmyra borough
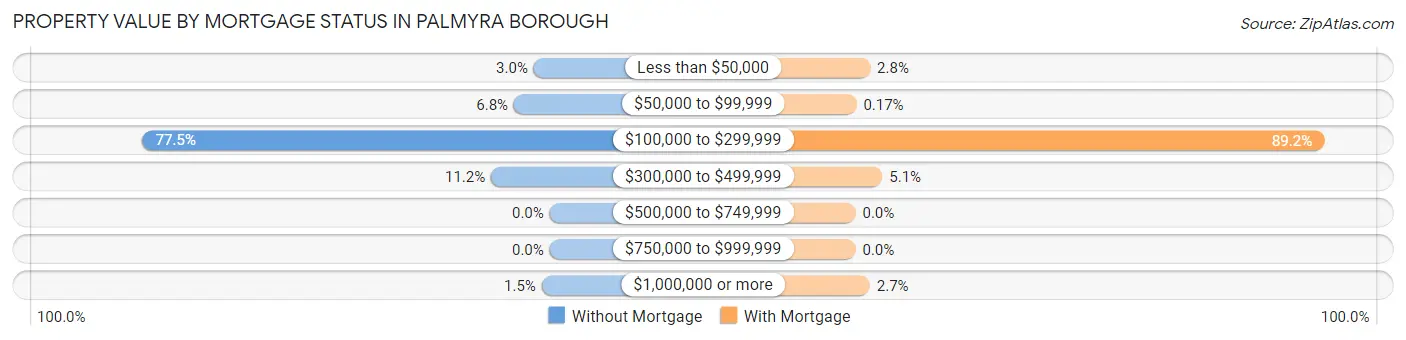
| Property Value | Without Mortgage | With Mortgage |
| Less than $50,000 | 20 (3.0%) | 48 (2.8%) |
| $50,000 to $99,999 | 45 (6.8%) | 3 (0.2%) |
| $100,000 to $299,999 | 514 (77.5%) | 1,540 (89.2%) |
| $300,000 to $499,999 | 74 (11.2%) | 88 (5.1%) |
| $500,000 to $749,999 | 0 (0.0%) | 0 (0.0%) |
| $750,000 to $999,999 | 0 (0.0%) | 0 (0.0%) |
| $1,000,000 or more | 10 (1.5%) | 47 (2.7%) |
| Total | 663 (100.0%) | 1,726 (100.0%) |
Household Income by Mortgage Status in Palmyra borough
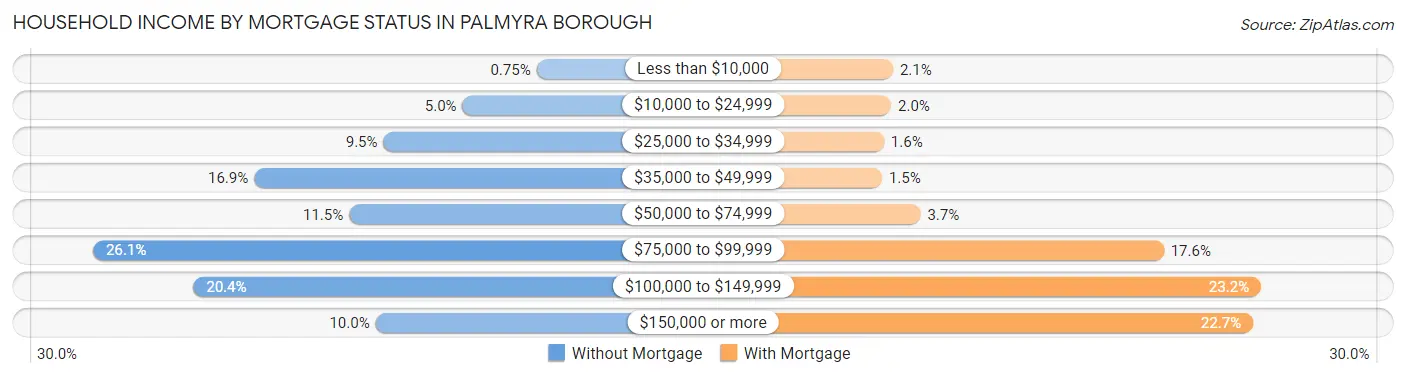
| Household Income | Without Mortgage | With Mortgage |
| Less than $10,000 | 5 (0.7%) | 37 (2.1%) |
| $10,000 to $24,999 | 33 (5.0%) | 35 (2.0%) |
| $25,000 to $34,999 | 63 (9.5%) | 28 (1.6%) |
| $35,000 to $49,999 | 112 (16.9%) | 26 (1.5%) |
| $50,000 to $74,999 | 76 (11.5%) | 64 (3.7%) |
| $75,000 to $99,999 | 173 (26.1%) | 304 (17.6%) |
| $100,000 to $149,999 | 135 (20.4%) | 400 (23.2%) |
| $150,000 or more | 66 (10.0%) | 392 (22.7%) |
| Total | 663 (100.0%) | 1,726 (100.0%) |
Property Value to Household Income Ratio in Palmyra borough
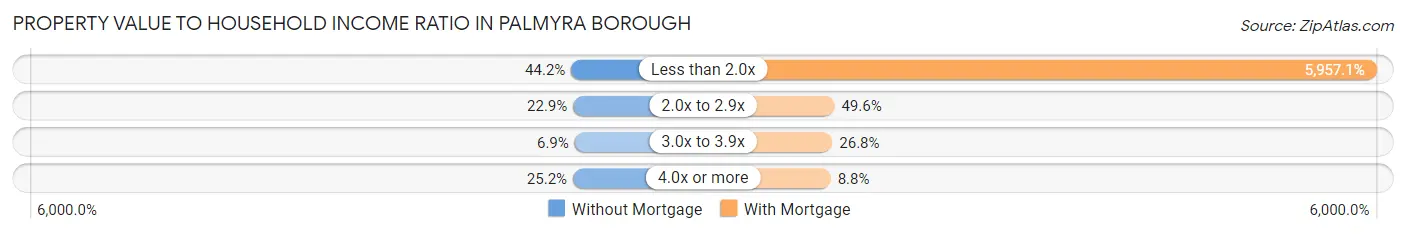
| Value-to-Income Ratio | Without Mortgage | With Mortgage |
| Less than 2.0x | 293 (44.2%) | 102,819 (5,957.1%) |
| 2.0x to 2.9x | 152 (22.9%) | 856 (49.6%) |
| 3.0x to 3.9x | 46 (6.9%) | 462 (26.8%) |
| 4.0x or more | 167 (25.2%) | 151 (8.7%) |
| Total | 663 (100.0%) | 1,726 (100.0%) |
Real Estate Taxes by Mortgage Status in Palmyra borough
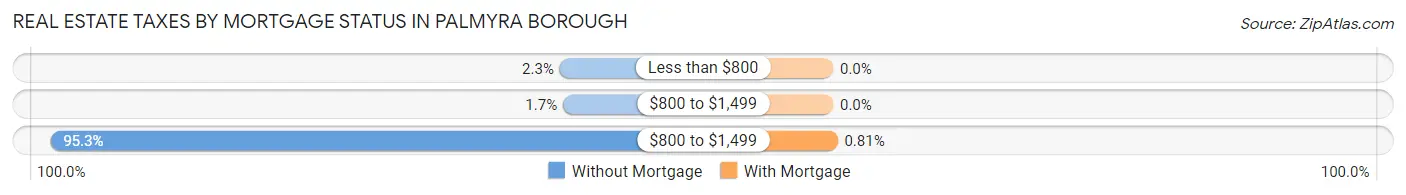
| Property Taxes | Without Mortgage | With Mortgage |
| Less than $800 | 15 (2.3%) | 0 (0.0%) |
| $800 to $1,499 | 11 (1.7%) | 0 (0.0%) |
| $800 to $1,499 | 632 (95.3%) | 14 (0.8%) |
| Total | 663 (100.0%) | 1,726 (100.0%) |
Health & Disability in Palmyra borough
Health Insurance Coverage by Age in Palmyra borough
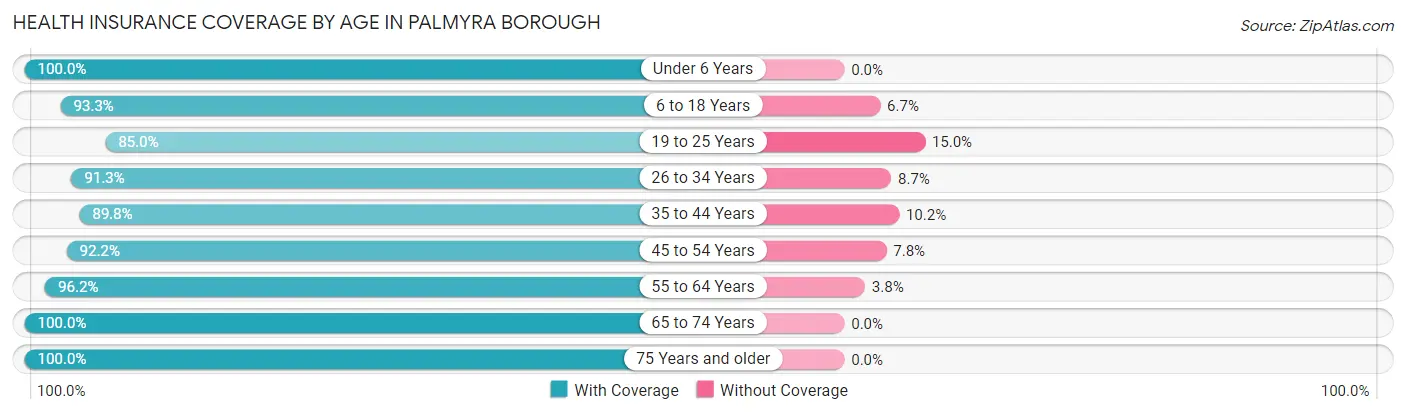
| Age Bracket | With Coverage | Without Coverage |
| Under 6 Years | 295 (100.0%) | 0 (0.0%) |
| 6 to 18 Years | 1,032 (93.3%) | 74 (6.7%) |
| 19 to 25 Years | 695 (85.0%) | 123 (15.0%) |
| 26 to 34 Years | 836 (91.3%) | 80 (8.7%) |
| 35 to 44 Years | 713 (89.8%) | 81 (10.2%) |
| 45 to 54 Years | 1,011 (92.2%) | 86 (7.8%) |
| 55 to 64 Years | 1,301 (96.2%) | 52 (3.8%) |
| 65 to 74 Years | 792 (100.0%) | 0 (0.0%) |
| 75 Years and older | 263 (100.0%) | 0 (0.0%) |
| Total | 6,938 (93.3%) | 496 (6.7%) |
Health Insurance Coverage by Citizenship Status in Palmyra borough
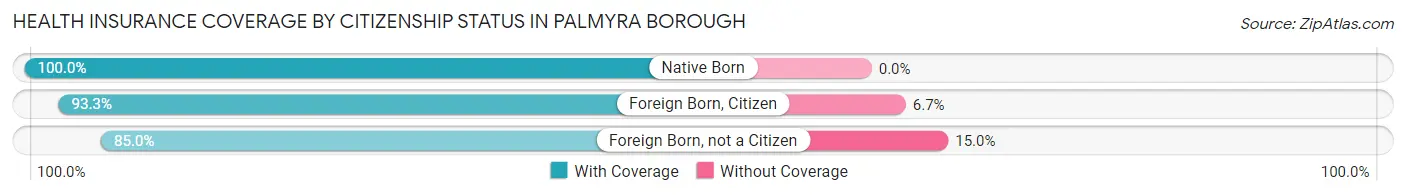
| Citizenship Status | With Coverage | Without Coverage |
| Native Born | 295 (100.0%) | 0 (0.0%) |
| Foreign Born, Citizen | 1,032 (93.3%) | 74 (6.7%) |
| Foreign Born, not a Citizen | 695 (85.0%) | 123 (15.0%) |
Health Insurance Coverage by Household Income in Palmyra borough
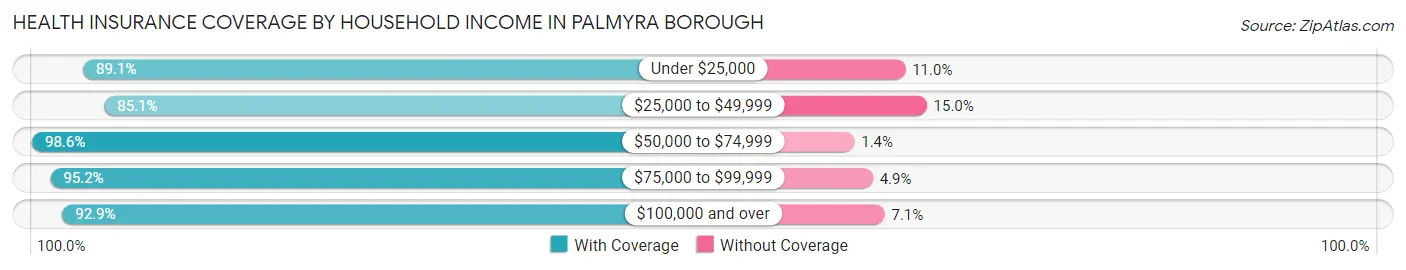
| Household Income | With Coverage | Without Coverage |
| Under $25,000 | 309 (89.0%) | 38 (11.0%) |
| $25,000 to $49,999 | 660 (85.1%) | 116 (14.9%) |
| $50,000 to $74,999 | 1,196 (98.6%) | 17 (1.4%) |
| $75,000 to $99,999 | 1,511 (95.2%) | 77 (4.9%) |
| $100,000 and over | 3,262 (92.9%) | 248 (7.1%) |
Public vs Private Health Insurance Coverage by Age in Palmyra borough
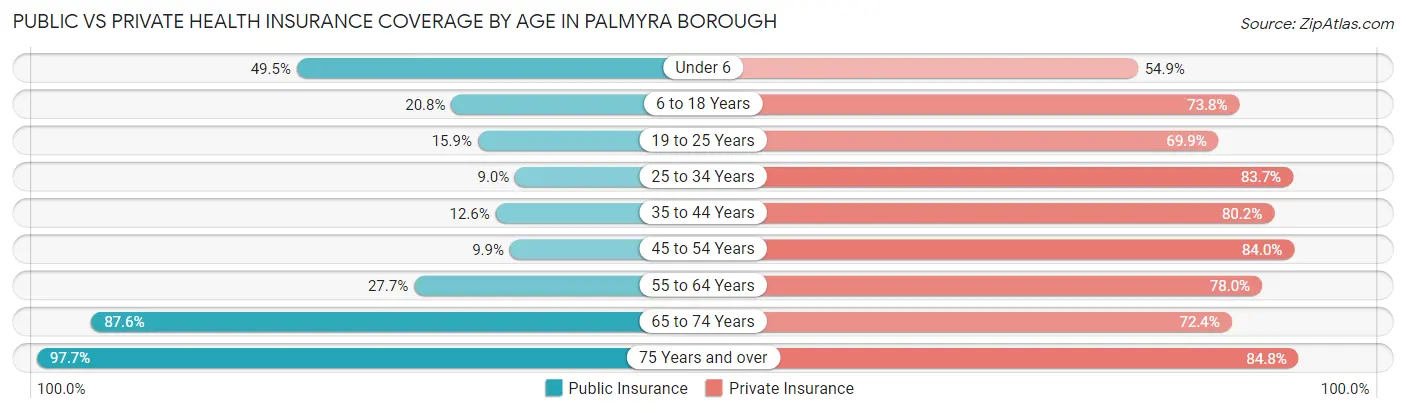
| Age Bracket | Public Insurance | Private Insurance |
| Under 6 | 146 (49.5%) | 162 (54.9%) |
| 6 to 18 Years | 230 (20.8%) | 816 (73.8%) |
| 19 to 25 Years | 130 (15.9%) | 572 (69.9%) |
| 25 to 34 Years | 82 (8.9%) | 767 (83.7%) |
| 35 to 44 Years | 100 (12.6%) | 637 (80.2%) |
| 45 to 54 Years | 109 (9.9%) | 921 (84.0%) |
| 55 to 64 Years | 375 (27.7%) | 1,055 (78.0%) |
| 65 to 74 Years | 694 (87.6%) | 573 (72.4%) |
| 75 Years and over | 257 (97.7%) | 223 (84.8%) |
| Total | 2,123 (28.6%) | 5,726 (77.0%) |
Disability Status by Sex by Age in Palmyra borough
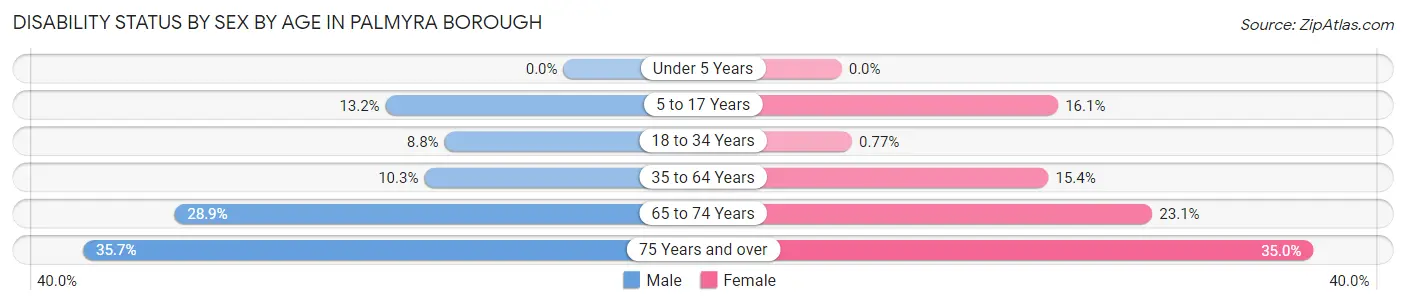
| Age Bracket | Male | Female |
| Under 5 Years | 0 (0.0%) | 0 (0.0%) |
| 5 to 17 Years | 77 (13.2%) | 81 (16.1%) |
| 18 to 34 Years | 80 (8.8%) | 7 (0.8%) |
| 35 to 64 Years | 152 (10.3%) | 272 (15.3%) |
| 65 to 74 Years | 106 (28.9%) | 98 (23.1%) |
| 75 Years and over | 51 (35.7%) | 42 (35.0%) |
Disability Class by Sex by Age in Palmyra borough
Disability Class: Hearing Difficulty
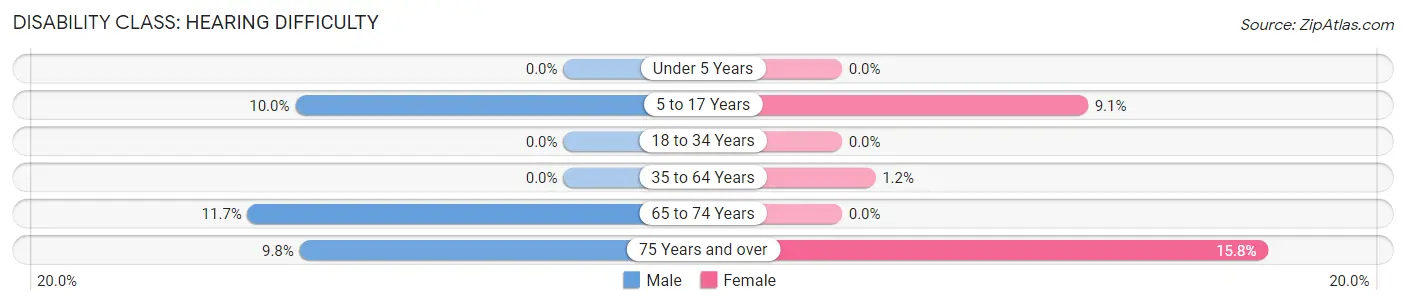
| Age Bracket | Male | Female |
| Under 5 Years | 0 (0.0%) | 0 (0.0%) |
| 5 to 17 Years | 58 (10.0%) | 46 (9.1%) |
| 18 to 34 Years | 0 (0.0%) | 0 (0.0%) |
| 35 to 64 Years | 0 (0.0%) | 22 (1.2%) |
| 65 to 74 Years | 43 (11.7%) | 0 (0.0%) |
| 75 Years and over | 14 (9.8%) | 19 (15.8%) |
Disability Class: Vision Difficulty
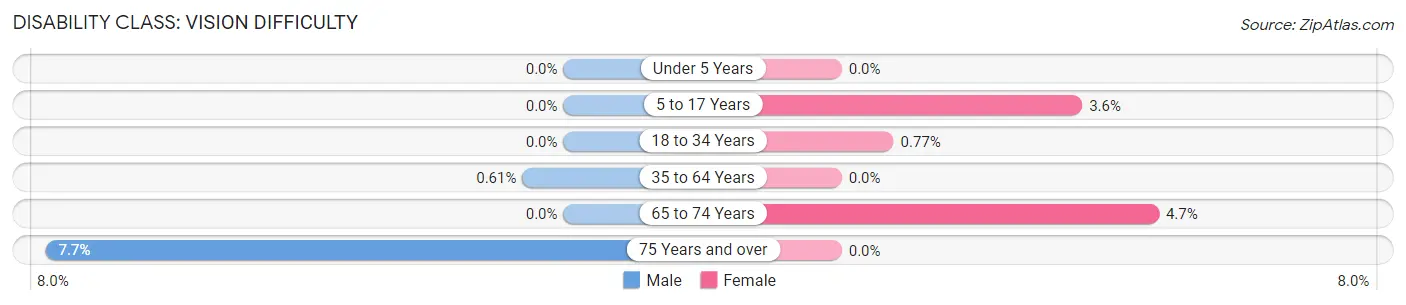
| Age Bracket | Male | Female |
| Under 5 Years | 0 (0.0%) | 0 (0.0%) |
| 5 to 17 Years | 0 (0.0%) | 18 (3.6%) |
| 18 to 34 Years | 0 (0.0%) | 7 (0.8%) |
| 35 to 64 Years | 9 (0.6%) | 0 (0.0%) |
| 65 to 74 Years | 0 (0.0%) | 20 (4.7%) |
| 75 Years and over | 11 (7.7%) | 0 (0.0%) |
Disability Class: Cognitive Difficulty
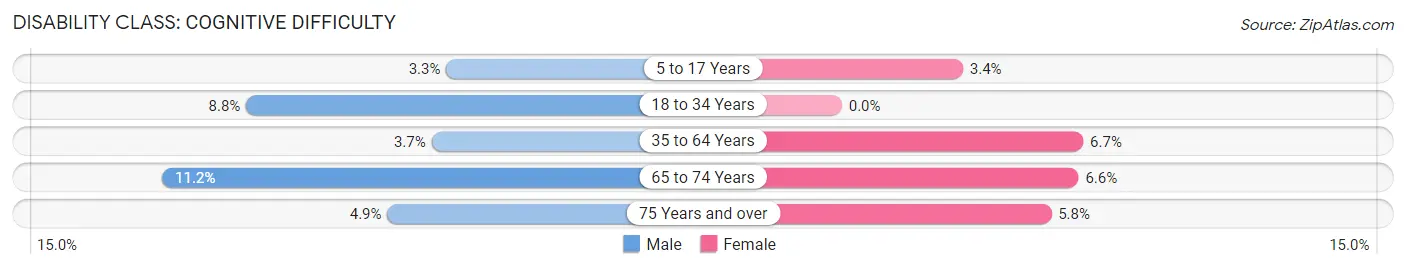
| Age Bracket | Male | Female |
| 5 to 17 Years | 19 (3.3%) | 17 (3.4%) |
| 18 to 34 Years | 80 (8.8%) | 0 (0.0%) |
| 35 to 64 Years | 54 (3.7%) | 119 (6.7%) |
| 65 to 74 Years | 41 (11.2%) | 28 (6.6%) |
| 75 Years and over | 7 (4.9%) | 7 (5.8%) |
Disability Class: Ambulatory Difficulty
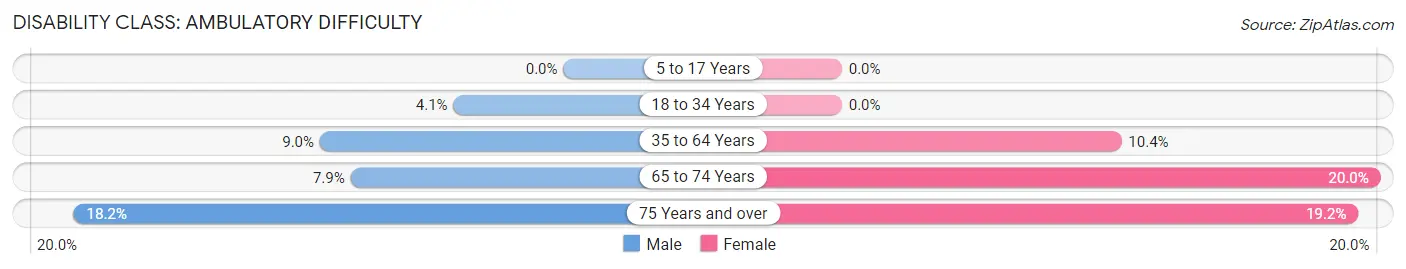
| Age Bracket | Male | Female |
| 5 to 17 Years | 0 (0.0%) | 0 (0.0%) |
| 18 to 34 Years | 37 (4.1%) | 0 (0.0%) |
| 35 to 64 Years | 133 (9.0%) | 184 (10.4%) |
| 65 to 74 Years | 29 (7.9%) | 85 (20.0%) |
| 75 Years and over | 26 (18.2%) | 23 (19.2%) |
Disability Class: Self-Care Difficulty
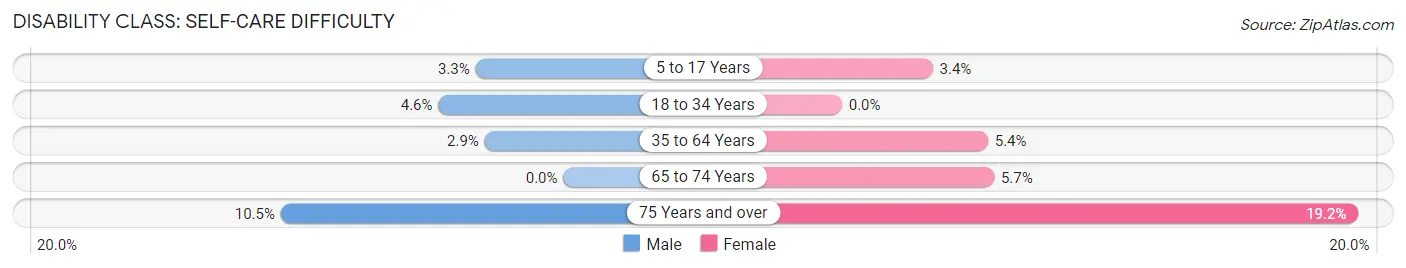
| Age Bracket | Male | Female |
| 5 to 17 Years | 19 (3.3%) | 17 (3.4%) |
| 18 to 34 Years | 42 (4.6%) | 0 (0.0%) |
| 35 to 64 Years | 43 (2.9%) | 96 (5.4%) |
| 65 to 74 Years | 0 (0.0%) | 24 (5.7%) |
| 75 Years and over | 15 (10.5%) | 23 (19.2%) |
Technology Access in Palmyra borough
Computing Device Access in Palmyra borough
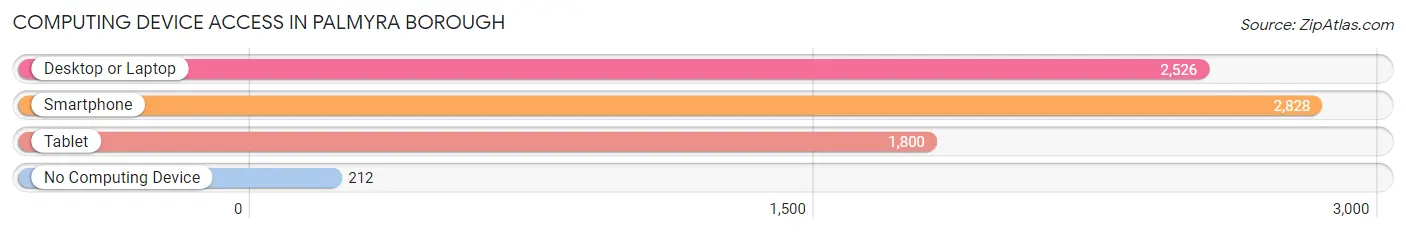
| Device Type | # Households | % Households |
| Desktop or Laptop | 2,526 | 78.9% |
| Smartphone | 2,828 | 88.4% |
| Tablet | 1,800 | 56.2% |
| No Computing Device | 212 | 6.6% |
| Total | 3,200 | 100.0% |
Internet Access in Palmyra borough
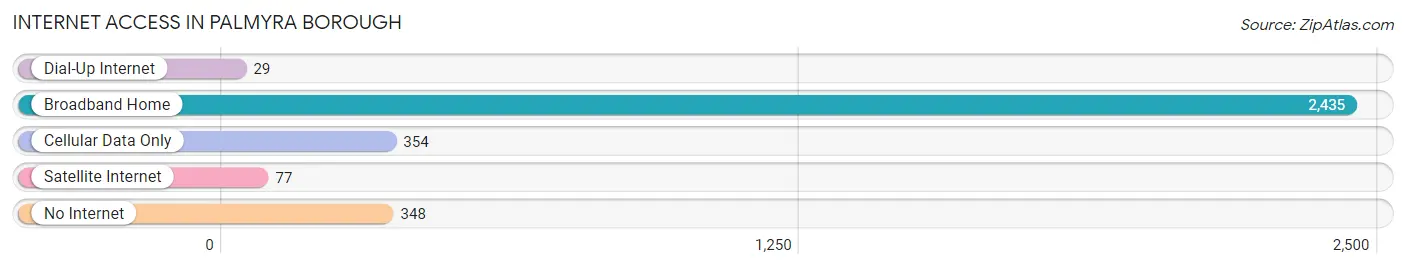
| Internet Type | # Households | % Households |
| Dial-Up Internet | 29 | 0.9% |
| Broadband Home | 2,435 | 76.1% |
| Cellular Data Only | 354 | 11.1% |
| Satellite Internet | 77 | 2.4% |
| No Internet | 348 | 10.9% |
| Total | 3,200 | 100.0% |
Palmyra borough Summary
Palmyra Borough is a small borough located in Burlington County, New Jersey. It is situated on the Delaware River, just north of Philadelphia. The borough was incorporated in 1894 and has a population of approximately 7,000 people.
Geography
Palmyra Borough is located in the Delaware Valley region of New Jersey. It is situated on the Delaware River, just north of Philadelphia. The borough is bordered by the townships of Cinnaminson, Delran, and Riverton. The borough is approximately 2.5 square miles in size and is located in the Central Jersey region of the state.
The borough is located in a flat, low-lying area, with the highest elevation being just over 100 feet above sea level. The borough is located in a humid subtropical climate zone, with hot, humid summers and mild winters. The average annual precipitation is approximately 45 inches.
Economy
The economy of Palmyra Borough is largely based on the service industry. The borough is home to a variety of retail stores, restaurants, and other businesses. The borough also has a number of manufacturing and industrial businesses, including a paper mill and a plastics factory.
The borough is also home to a number of small businesses, including a number of professional services firms. The borough is also home to a number of medical facilities, including a hospital and a number of medical offices.
Demographics
As of the 2010 census, the population of Palmyra Borough was 7,000. The racial makeup of the borough was 79.3% White, 11.2% African American, 0.3% Native American, 2.2% Asian, and 6.9% from other races. Hispanic or Latino of any race were 8.3% of the population.
The median household income in Palmyra Borough was $60,000, and the median family income was $68,000. The per capita income was $25,000. About 8.3% of families and 10.2% of the population were below the poverty line, including 14.3% of those under age 18 and 6.2% of those age 65 or over.
History
Palmyra Borough was first settled in the late 1600s by Quaker settlers. The borough was originally part of Cinnaminson Township, but was incorporated as its own borough in 1894.
The borough was named after the ancient city of Palmyra, which was located in modern-day Syria. The borough was a popular destination for tourists in the late 19th and early 20th centuries, due to its proximity to Philadelphia.
The borough was home to a number of notable residents, including the poet Walt Whitman, who lived in the borough for a time. The borough was also home to a number of prominent businesses, including a paper mill and a plastics factory.
In the late 20th century, the borough experienced a period of growth and development. The borough is now home to a number of retail stores, restaurants, and other businesses. The borough is also home to a number of medical facilities, including a hospital and a number of medical offices.
Common Questions
What is Per Capita Income in Palmyra borough?
Per Capita income in Palmyra borough is $44,593.
What is the Median Family Income in Palmyra borough?
Median Family Income in Palmyra borough is $90,354.
What is the Median Household income in Palmyra borough?
Median Household Income in Palmyra borough is $84,866.
What is Income or Wage Gap in Palmyra borough?
Income or Wage Gap in Palmyra borough is 22.3%.
Women in Palmyra borough earn 77.7 cents for every dollar earned by a man.
What is Inequality or Gini Index in Palmyra borough?
Inequality or Gini Index in Palmyra borough is 0.36.
What is the Total Population of Palmyra borough?
Total Population of Palmyra borough is 7,437.
What is the Total Male Population of Palmyra borough?
Total Male Population of Palmyra borough is 3,577.
What is the Total Female Population of Palmyra borough?
Total Female Population of Palmyra borough is 3,860.
What is the Ratio of Males per 100 Females in Palmyra borough?
There are 92.67 Males per 100 Females in Palmyra borough.
What is the Ratio of Females per 100 Males in Palmyra borough?
There are 107.91 Females per 100 Males in Palmyra borough.
What is the Median Population Age in Palmyra borough?
Median Population Age in Palmyra borough is 43.0 Years.
What is the Average Family Size in Palmyra borough
Average Family Size in Palmyra borough is 2.9 People.
What is the Average Household Size in Palmyra borough
Average Household Size in Palmyra borough is 2.3 People.
How Large is the Labor Force in Palmyra borough?
There are 4,610 People in the Labor Forcein in Palmyra borough.
What is the Percentage of People in the Labor Force in Palmyra borough?
73.4% of People are in the Labor Force in Palmyra borough.
What is the Unemployment Rate in Palmyra borough?
Unemployment Rate in Palmyra borough is 7.6%.