Keyport borough, NJ Map & Demographics
Keyport borough Overview
$43,755
PER CAPITA INCOME
$104,537
AVG FAMILY INCOME
$75,709
AVG HOUSEHOLD INCOME
25.0%
WAGE / INCOME GAP [ % ]
75.0¢/ $1
WAGE / INCOME GAP [ $ ]
0.42
INEQUALITY / GINI INDEX
7,188
TOTAL POPULATION
3,408
MALE POPULATION
3,780
FEMALE POPULATION
90.16
MALES / 100 FEMALES
110.92
FEMALES / 100 MALES
46.5
MEDIAN AGE
3.1
AVG FAMILY SIZE
2.1
AVG HOUSEHOLD SIZE
3,902
LABOR FORCE [ PEOPLE ]
64.8%
PERCENT IN LABOR FORCE
10.4%
UNEMPLOYMENT RATE
Income in Keyport borough
Income Overview in Keyport borough
Per Capita Income in Keyport borough is $43,755, while median incomes of families and households are $104,537 and $75,709 respectively.
| Characteristic | Number | Measure |
| Per Capita Income | 7,188 | $43,755 |
| Median Family Income | 1,628 | $104,537 |
| Mean Family Income | 1,628 | $124,166 |
| Median Household Income | 3,364 | $75,709 |
| Mean Household Income | 3,364 | $94,133 |
| Income Deficit | 1,628 | $0 |
| Wage / Income Gap (%) | 7,188 | 24.98% |
| Wage / Income Gap ($) | 7,188 | 75.02¢ per $1 |
| Gini / Inequality Index | 7,188 | 0.42 |
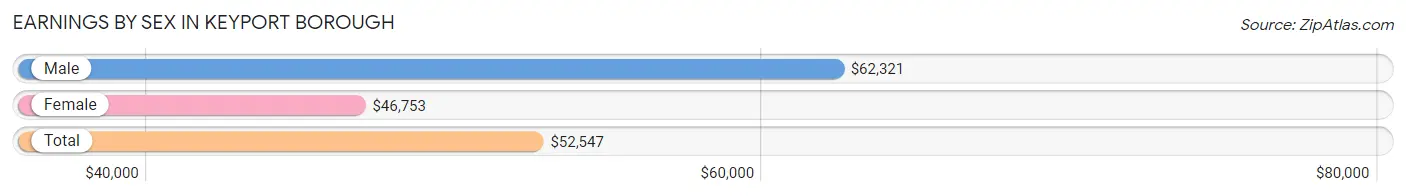
Earnings by Sex in Keyport borough
Average Earnings in Keyport borough are $52,547, $62,321 for men and $46,753 for women, a difference of 25.0%.
| Sex | Number | Average Earnings |
| Male | 2,072 (53.2%) | $62,321 |
| Female | 1,820 (46.8%) | $46,753 |
| Total | 3,892 (100.0%) | $52,547 |
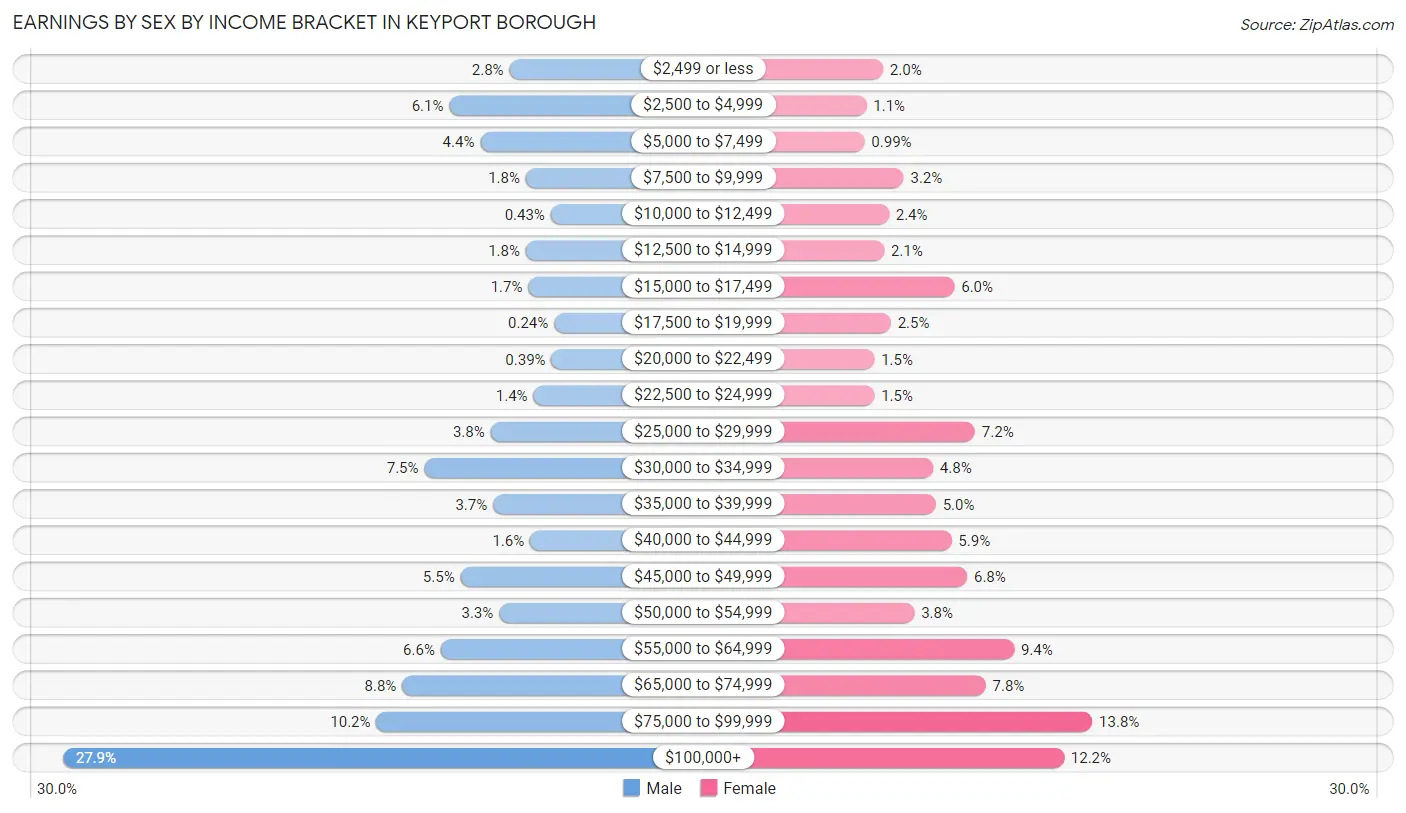
Earnings by Sex by Income Bracket in Keyport borough
The most common earnings brackets in Keyport borough are $100,000+ for men (577 | 27.9%) and $75,000 to $99,999 for women (251 | 13.8%).
| Income | Male | Female |
| $2,499 or less | 57 (2.8%) | 37 (2.0%) |
| $2,500 to $4,999 | 127 (6.1%) | 20 (1.1%) |
| $5,000 to $7,499 | 91 (4.4%) | 18 (1.0%) |
| $7,500 to $9,999 | 38 (1.8%) | 58 (3.2%) |
| $10,000 to $12,499 | 9 (0.4%) | 43 (2.4%) |
| $12,500 to $14,999 | 38 (1.8%) | 38 (2.1%) |
| $15,000 to $17,499 | 35 (1.7%) | 110 (6.0%) |
| $17,500 to $19,999 | 5 (0.2%) | 45 (2.5%) |
| $20,000 to $22,499 | 8 (0.4%) | 28 (1.5%) |
| $22,500 to $24,999 | 29 (1.4%) | 28 (1.5%) |
| $25,000 to $29,999 | 79 (3.8%) | 131 (7.2%) |
| $30,000 to $34,999 | 156 (7.5%) | 88 (4.8%) |
| $35,000 to $39,999 | 76 (3.7%) | 91 (5.0%) |
| $40,000 to $44,999 | 33 (1.6%) | 107 (5.9%) |
| $45,000 to $49,999 | 114 (5.5%) | 123 (6.8%) |
| $50,000 to $54,999 | 69 (3.3%) | 69 (3.8%) |
| $55,000 to $64,999 | 137 (6.6%) | 171 (9.4%) |
| $65,000 to $74,999 | 182 (8.8%) | 142 (7.8%) |
| $75,000 to $99,999 | 212 (10.2%) | 251 (13.8%) |
| $100,000+ | 577 (27.9%) | 222 (12.2%) |
| Total | 2,072 (100.0%) | 1,820 (100.0%) |
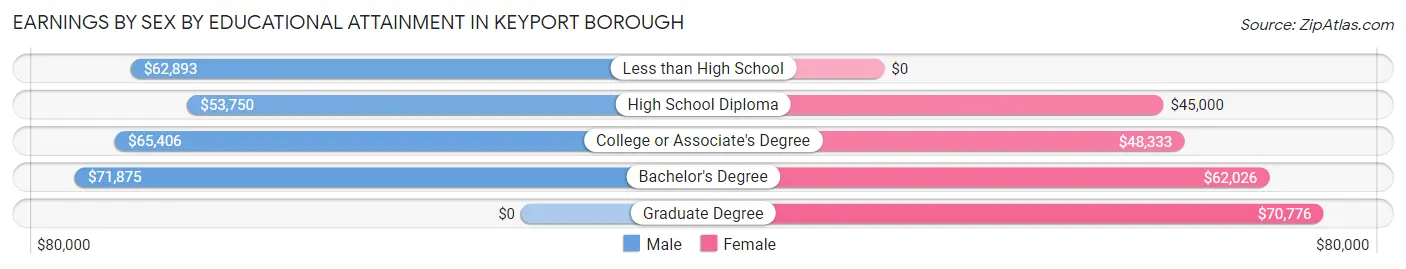
Earnings by Sex by Educational Attainment in Keyport borough
Average earnings in Keyport borough are $65,349 for men and $49,712 for women, a difference of 23.9%. Men with an educational attainment of bachelor's degree enjoy the highest average annual earnings of $71,875, while those with high school diploma education earn the least with $53,750. Women with an educational attainment of graduate degree earn the most with the average annual earnings of $70,776, while those with high school diploma education have the smallest earnings of $45,000.
| Educational Attainment | Male Income | Female Income |
| Less than High School | $62,893 | $0 |
| High School Diploma | $53,750 | $45,000 |
| College or Associate's Degree | $65,406 | $48,333 |
| Bachelor's Degree | $71,875 | $62,026 |
| Graduate Degree | - | - |
| Total | $65,349 | $49,712 |
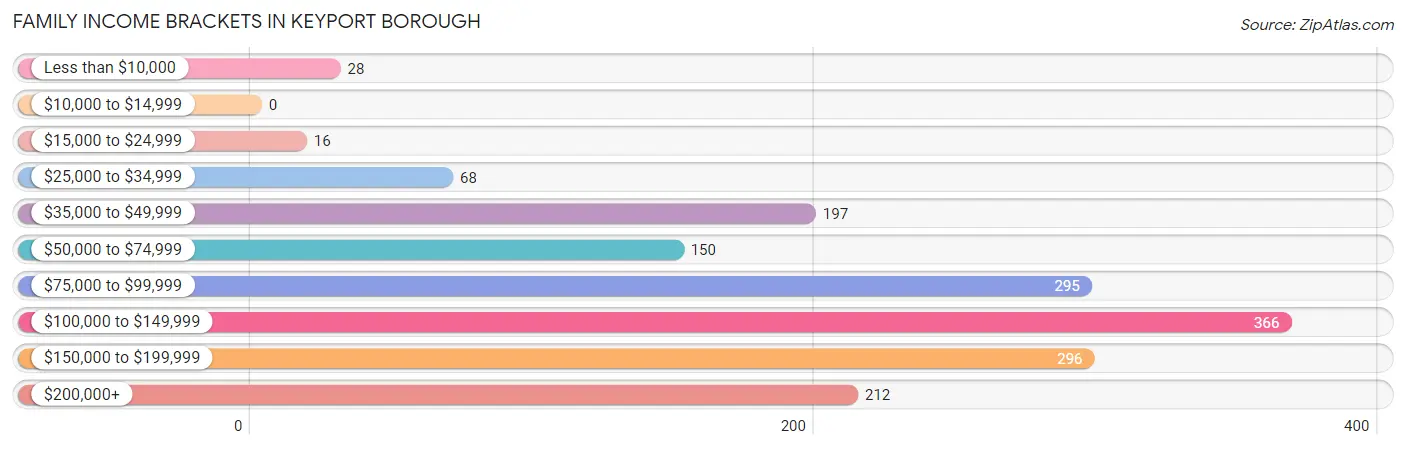
Family Income in Keyport borough
Family Income Brackets in Keyport borough
According to the Keyport borough family income data, there are 366 families falling into the $100,000 to $149,999 income range, which is the most common income bracket and makes up 22.5% of all families.
| Income Bracket | # Families | % Families |
| Less than $10,000 | 28 | 1.7% |
| $10,000 to $14,999 | 0 | 0.0% |
| $15,000 to $24,999 | 16 | 1.0% |
| $25,000 to $34,999 | 68 | 4.2% |
| $35,000 to $49,999 | 197 | 12.1% |
| $50,000 to $74,999 | 150 | 9.2% |
| $75,000 to $99,999 | 295 | 18.1% |
| $100,000 to $149,999 | 366 | 22.5% |
| $150,000 to $199,999 | 296 | 18.2% |
| $200,000+ | 212 | 13.0% |
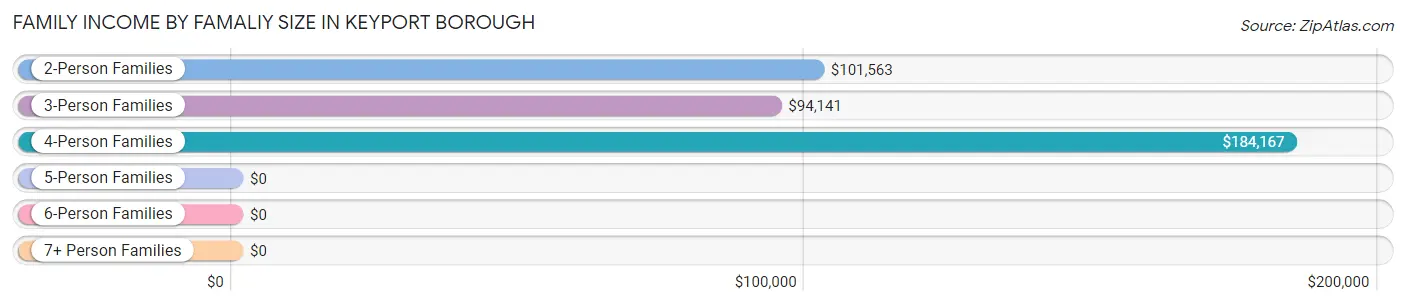
Family Income by Famaliy Size in Keyport borough
4-person families (234 | 14.4%) account for the highest median family income in Keyport borough with $184,167 per family, while 2-person families (631 | 38.8%) have the highest median income of $50,782 per family member.
| Income Bracket | # Families | Median Income |
| 2-Person Families | 631 (38.8%) | $101,563 |
| 3-Person Families | 549 (33.7%) | $94,141 |
| 4-Person Families | 234 (14.4%) | $184,167 |
| 5-Person Families | 162 (10.0%) | $0 |
| 6-Person Families | 13 (0.8%) | $0 |
| 7+ Person Families | 39 (2.4%) | $0 |
| Total | 1,628 (100.0%) | $104,537 |
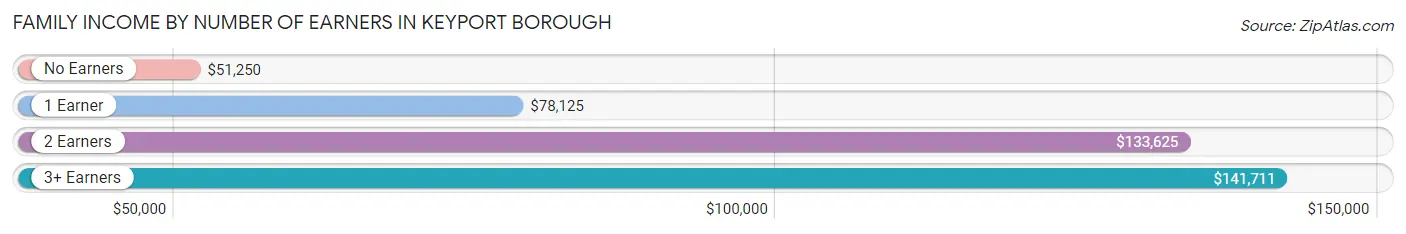
Family Income by Number of Earners in Keyport borough
The median family income in Keyport borough is $104,537, with families comprising 3+ earners (256) having the highest median family income of $141,711, while families with no earners (212) have the lowest median family income of $51,250, accounting for 15.7% and 13.0% of families, respectively.
| Number of Earners | # Families | Median Income |
| No Earners | 212 (13.0%) | $51,250 |
| 1 Earner | 493 (30.3%) | $78,125 |
| 2 Earners | 667 (41.0%) | $133,625 |
| 3+ Earners | 256 (15.7%) | $141,711 |
| Total | 1,628 (100.0%) | $104,537 |
Household Income in Keyport borough
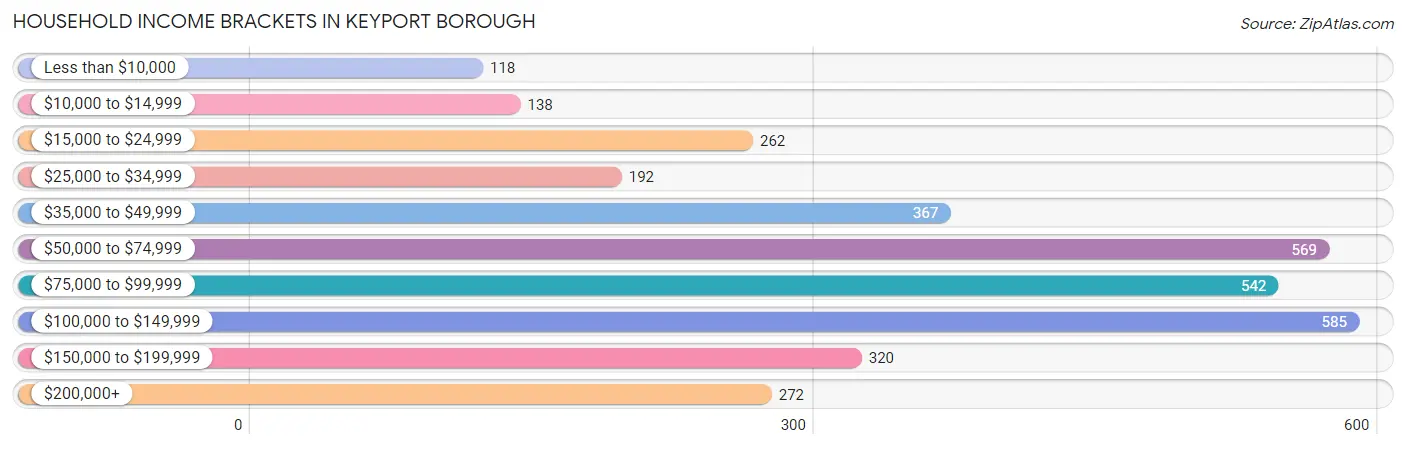
Household Income Brackets in Keyport borough
With 585 households falling in the category, the $100,000 to $149,999 income range is the most frequent in Keyport borough, accounting for 17.4% of all households. In contrast, only 118 households (3.5%) fall into the less than $10,000 income bracket, making it the least populous group.
| Income Bracket | # Households | % Households |
| Less than $10,000 | 118 | 3.5% |
| $10,000 to $14,999 | 138 | 4.1% |
| $15,000 to $24,999 | 262 | 7.8% |
| $25,000 to $34,999 | 192 | 5.7% |
| $35,000 to $49,999 | 367 | 10.9% |
| $50,000 to $74,999 | 569 | 16.9% |
| $75,000 to $99,999 | 542 | 16.1% |
| $100,000 to $149,999 | 585 | 17.4% |
| $150,000 to $199,999 | 320 | 9.5% |
| $200,000+ | 272 | 8.1% |
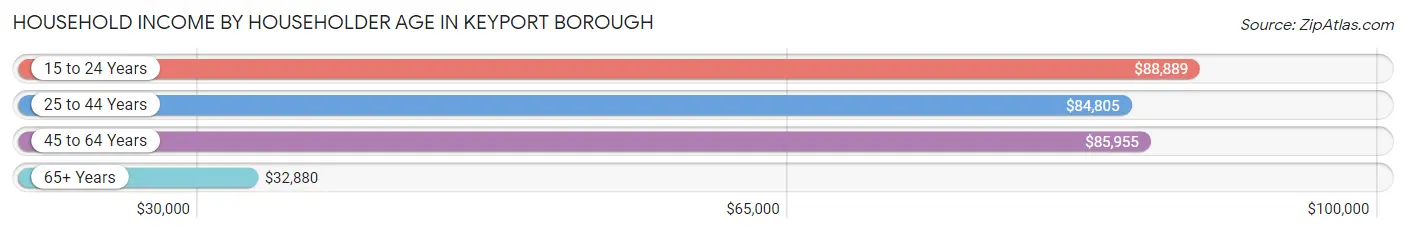
Household Income by Householder Age in Keyport borough
The median household income in Keyport borough is $75,709, with the highest median household income of $88,889 found in the 15 to 24 years age bracket for the primary householder. A total of 148 households (4.4%) fall into this category. Meanwhile, the 65+ years age bracket for the primary householder has the lowest median household income of $32,880, with 1,125 households (33.4%) in this group.
| Income Bracket | # Households | Median Income |
| 15 to 24 Years | 148 (4.4%) | $88,889 |
| 25 to 44 Years | 735 (21.8%) | $84,805 |
| 45 to 64 Years | 1,356 (40.3%) | $85,955 |
| 65+ Years | 1,125 (33.4%) | $32,880 |
| Total | 3,364 (100.0%) | $75,709 |
Poverty in Keyport borough
Income Below Poverty by Sex and Age in Keyport borough
With 3.5% poverty level for males and 11.4% for females among the residents of Keyport borough, 45 to 54 year old males and 65 to 74 year old females are the most vulnerable to poverty, with 33 males (9.1%) and 177 females (31.9%) in their respective age groups living below the poverty level.
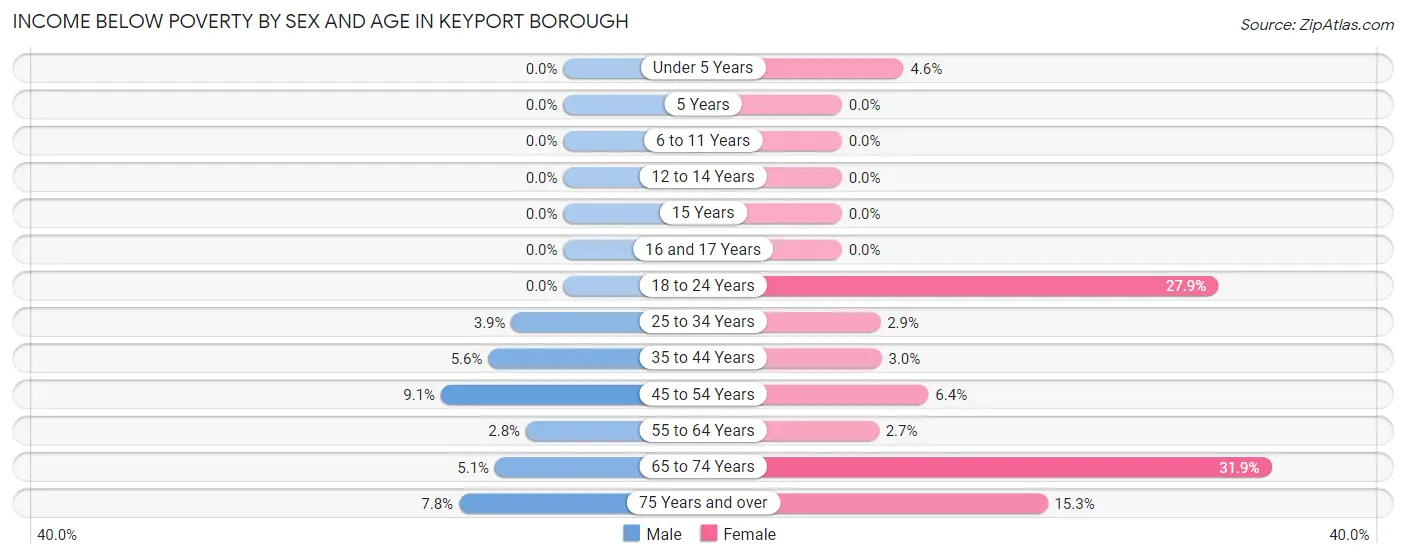
| Age Bracket | Male | Female |
| Under 5 Years | 0 (0.0%) | 11 (4.6%) |
| 5 Years | 0 (0.0%) | 0 (0.0%) |
| 6 to 11 Years | 0 (0.0%) | 0 (0.0%) |
| 12 to 14 Years | 0 (0.0%) | 0 (0.0%) |
| 15 Years | 0 (0.0%) | 0 (0.0%) |
| 16 and 17 Years | 0 (0.0%) | 0 (0.0%) |
| 18 to 24 Years | 0 (0.0%) | 105 (27.9%) |
| 25 to 34 Years | 15 (3.9%) | 12 (2.9%) |
| 35 to 44 Years | 23 (5.6%) | 10 (2.9%) |
| 45 to 54 Years | 33 (9.1%) | 40 (6.4%) |
| 55 to 64 Years | 16 (2.8%) | 16 (2.7%) |
| 65 to 74 Years | 22 (5.1%) | 177 (31.9%) |
| 75 Years and over | 10 (7.7%) | 60 (15.3%) |
| Total | 119 (3.5%) | 431 (11.4%) |
Income Above Poverty by Sex and Age in Keyport borough
According to the poverty statistics in Keyport borough, males aged under 5 years and females aged 5 years are the age groups that are most secure financially, with 100.0% of males and 100.0% of females in these age groups living above the poverty line.
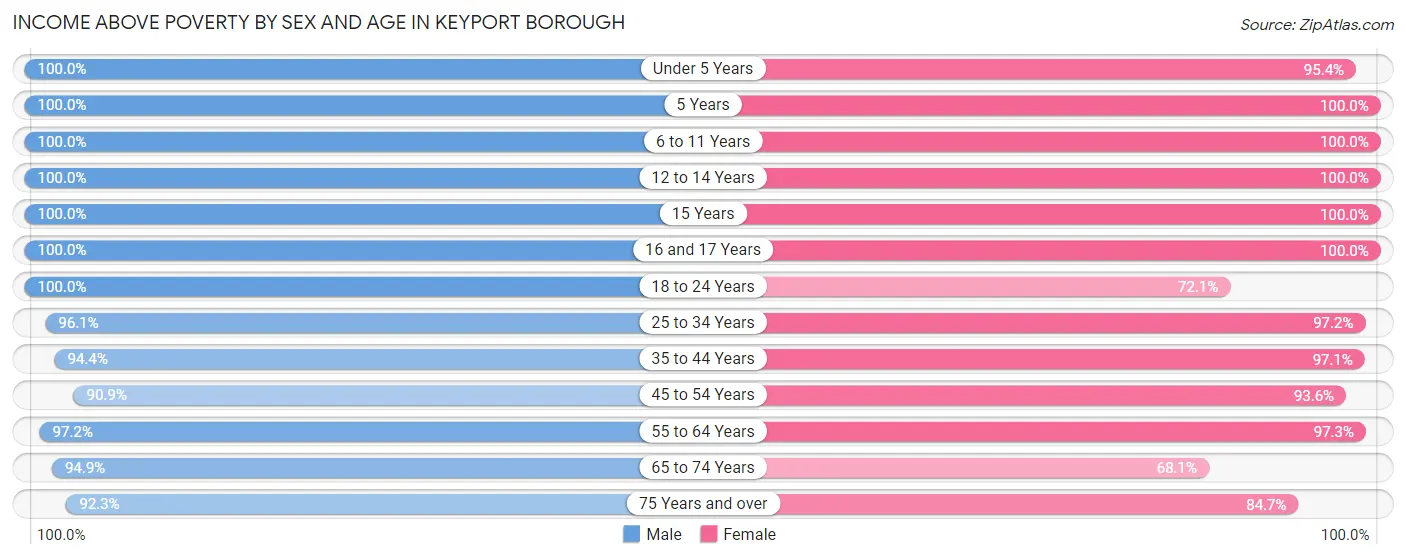
| Age Bracket | Male | Female |
| Under 5 Years | 306 (100.0%) | 229 (95.4%) |
| 5 Years | 71 (100.0%) | 9 (100.0%) |
| 6 to 11 Years | 229 (100.0%) | 157 (100.0%) |
| 12 to 14 Years | 81 (100.0%) | 29 (100.0%) |
| 15 Years | 13 (100.0%) | 32 (100.0%) |
| 16 and 17 Years | 89 (100.0%) | 24 (100.0%) |
| 18 to 24 Years | 317 (100.0%) | 271 (72.1%) |
| 25 to 34 Years | 374 (96.1%) | 409 (97.2%) |
| 35 to 44 Years | 390 (94.4%) | 329 (97.1%) |
| 45 to 54 Years | 330 (90.9%) | 582 (93.6%) |
| 55 to 64 Years | 559 (97.2%) | 567 (97.3%) |
| 65 to 74 Years | 411 (94.9%) | 378 (68.1%) |
| 75 Years and over | 119 (92.2%) | 333 (84.7%) |
| Total | 3,289 (96.5%) | 3,349 (88.6%) |
Income Below Poverty Among Married-Couple Families in Keyport borough
The poverty statistics for married-couple families in Keyport borough show that 0.8% or 10 of the total 1,281 families live below the poverty line. Families with no children have the highest poverty rate of 1.5%, comprising of 10 families. On the other hand, families with 1 or 2 children have the lowest poverty rate of 0.0%, which includes 0 families.
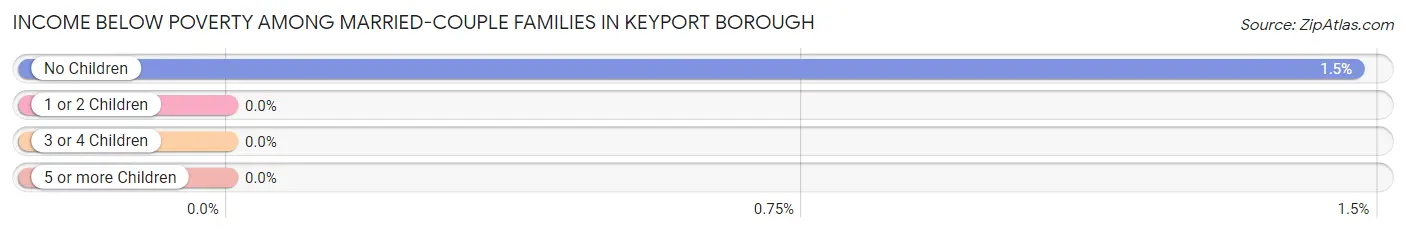
| Children | Above Poverty | Below Poverty |
| No Children | 670 (98.5%) | 10 (1.5%) |
| 1 or 2 Children | 535 (100.0%) | 0 (0.0%) |
| 3 or 4 Children | 48 (100.0%) | 0 (0.0%) |
| 5 or more Children | 18 (100.0%) | 0 (0.0%) |
| Total | 1,271 (99.2%) | 10 (0.8%) |
Income Below Poverty Among Single-Parent Households in Keyport borough
According to the poverty data in Keyport borough, 15.8% or 16 single-father households and 4.9% or 12 single-mother households are living below the poverty line. Among single-father households, those with no children have the highest poverty rate, with 16 households (35.6%) experiencing poverty. Likewise, among single-mother households, those with 1 or 2 children have the highest poverty rate, with 12 households (11.8%) falling below the poverty line.
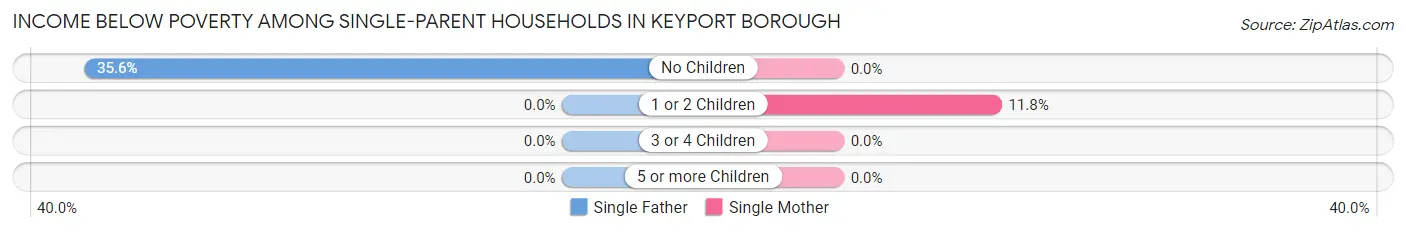
| Children | Single Father | Single Mother |
| No Children | 16 (35.6%) | 0 (0.0%) |
| 1 or 2 Children | 0 (0.0%) | 12 (11.8%) |
| 3 or 4 Children | 0 (0.0%) | 0 (0.0%) |
| 5 or more Children | 0 (0.0%) | 0 (0.0%) |
| Total | 16 (15.8%) | 12 (4.9%) |
Income Below Poverty Among Married-Couple vs Single-Parent Households in Keyport borough
The poverty data for Keyport borough shows that 10 of the married-couple family households (0.8%) and 28 of the single-parent households (8.1%) are living below the poverty level. Within the married-couple family households, those with no children have the highest poverty rate, with 10 households (1.5%) falling below the poverty line. Among the single-parent households, those with no children have the highest poverty rate, with 16 household (8.9%) living below poverty.
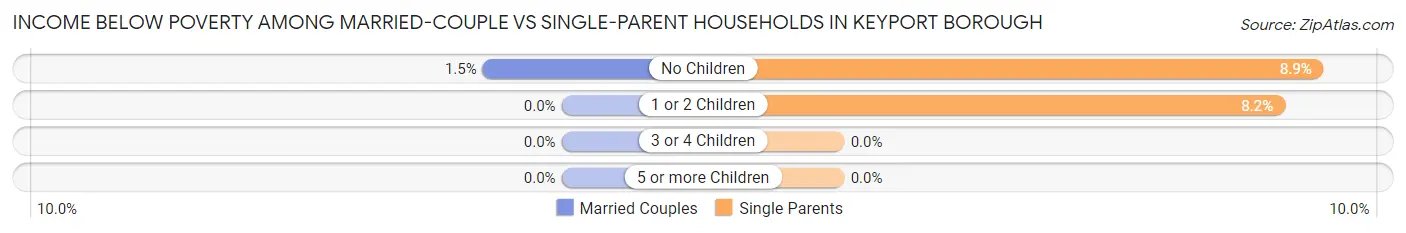
| Children | Married-Couple Families | Single-Parent Households |
| No Children | 10 (1.5%) | 16 (8.9%) |
| 1 or 2 Children | 0 (0.0%) | 12 (8.2%) |
| 3 or 4 Children | 0 (0.0%) | 0 (0.0%) |
| 5 or more Children | 0 (0.0%) | 0 (0.0%) |
| Total | 10 (0.8%) | 28 (8.1%) |
Race in Keyport borough
The most populous races in Keyport borough are White / Caucasian (5,771 | 80.3%), Hispanic or Latino (1,249 | 17.4%), and Two or more Races (634 | 8.8%).
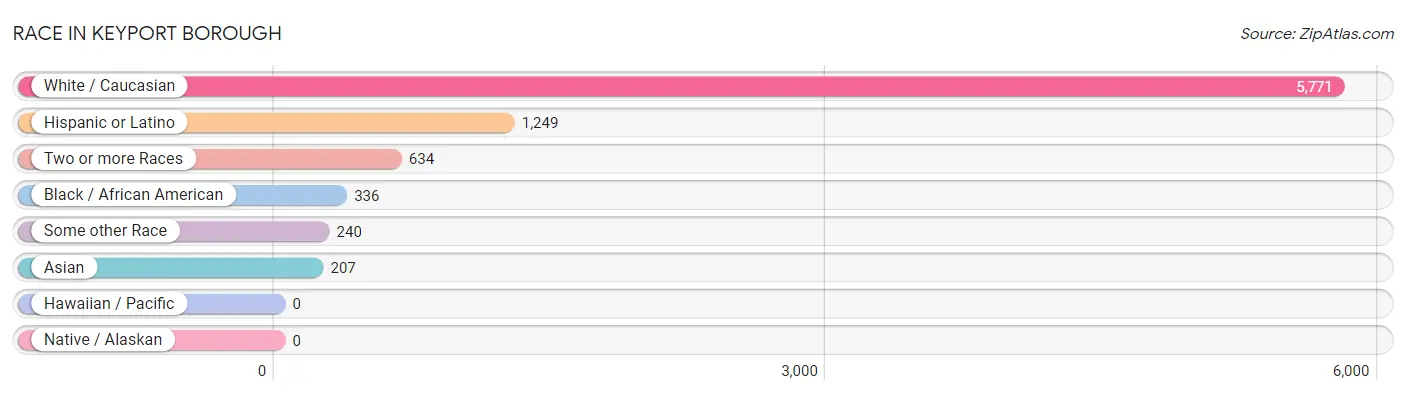
| Race | # Population | % Population |
| Asian | 207 | 2.9% |
| Black / African American | 336 | 4.7% |
| Hawaiian / Pacific | 0 | 0.0% |
| Hispanic or Latino | 1,249 | 17.4% |
| Native / Alaskan | 0 | 0.0% |
| White / Caucasian | 5,771 | 80.3% |
| Two or more Races | 634 | 8.8% |
| Some other Race | 240 | 3.3% |
| Total | 7,188 | 100.0% |
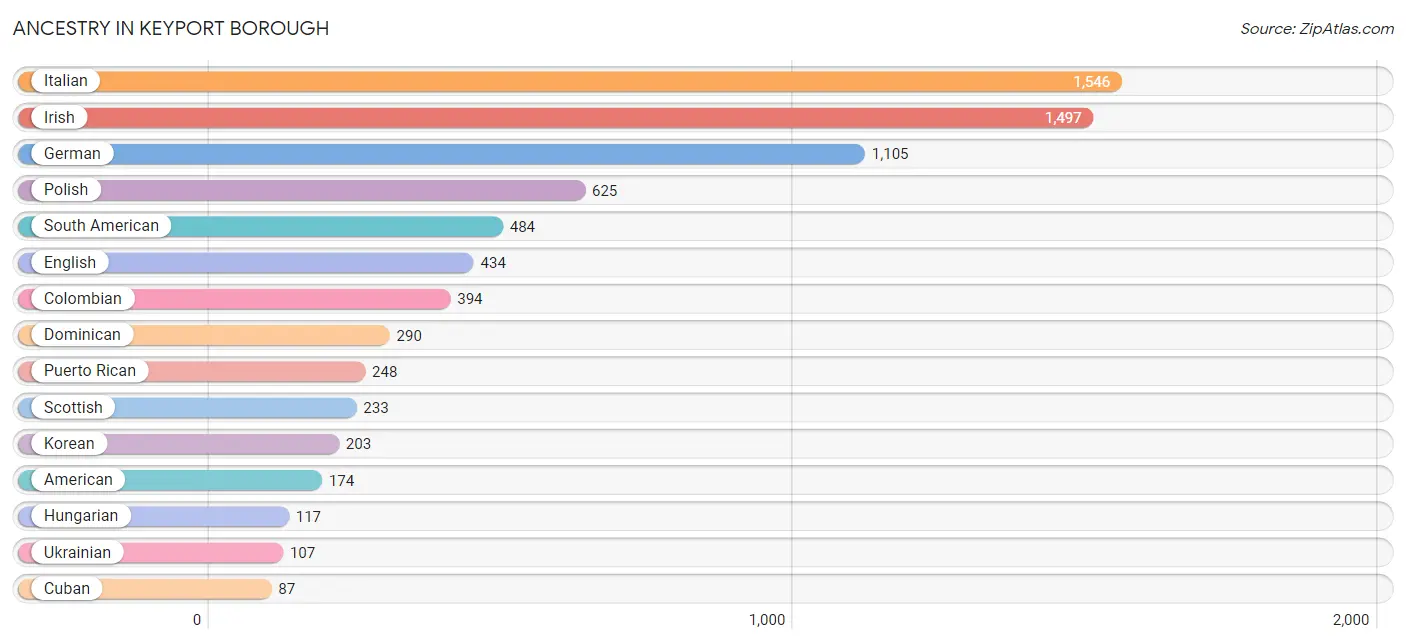
Ancestry in Keyport borough
The most populous ancestries reported in Keyport borough are Italian (1,546 | 21.5%), Irish (1,497 | 20.8%), German (1,105 | 15.4%), Polish (625 | 8.7%), and South American (484 | 6.7%), together accounting for 73.1% of all Keyport borough residents.
| Ancestry | # Population | % Population |
| American | 174 | 2.4% |
| Arab | 13 | 0.2% |
| Argentinean | 6 | 0.1% |
| Armenian | 23 | 0.3% |
| Basque | 13 | 0.2% |
| Burmese | 73 | 1.0% |
| Central American | 13 | 0.2% |
| Cherokee | 20 | 0.3% |
| Chilean | 13 | 0.2% |
| Colombian | 394 | 5.5% |
| Croatian | 19 | 0.3% |
| Cuban | 87 | 1.2% |
| Czechoslovakian | 19 | 0.3% |
| Danish | 46 | 0.6% |
| Dominican | 290 | 4.0% |
| Dutch | 81 | 1.1% |
| Eastern European | 39 | 0.5% |
| Ecuadorian | 55 | 0.8% |
| English | 434 | 6.0% |
| French | 76 | 1.1% |
| French Canadian | 15 | 0.2% |
| German | 1,105 | 15.4% |
| Greek | 30 | 0.4% |
| Hungarian | 117 | 1.6% |
| Indian (Asian) | 61 | 0.9% |
| Irish | 1,497 | 20.8% |
| Israeli | 35 | 0.5% |
| Italian | 1,546 | 21.5% |
| Korean | 203 | 2.8% |
| Lithuanian | 16 | 0.2% |
| Mexican | 66 | 0.9% |
| Norwegian | 42 | 0.6% |
| Palestinian | 13 | 0.2% |
| Panamanian | 13 | 0.2% |
| Peruvian | 16 | 0.2% |
| Polish | 625 | 8.7% |
| Portuguese | 45 | 0.6% |
| Puerto Rican | 248 | 3.5% |
| Puget Sound Salish | 29 | 0.4% |
| Russian | 36 | 0.5% |
| Scotch-Irish | 37 | 0.5% |
| Scottish | 233 | 3.2% |
| Slavic | 9 | 0.1% |
| Slovak | 19 | 0.3% |
| South American | 484 | 6.7% |
| Spaniard | 38 | 0.5% |
| Spanish | 23 | 0.3% |
| Swedish | 15 | 0.2% |
| Swiss | 25 | 0.4% |
| Thai | 59 | 0.8% |
| Ukrainian | 107 | 1.5% |
| Welsh | 35 | 0.5% | View All 52 Rows |
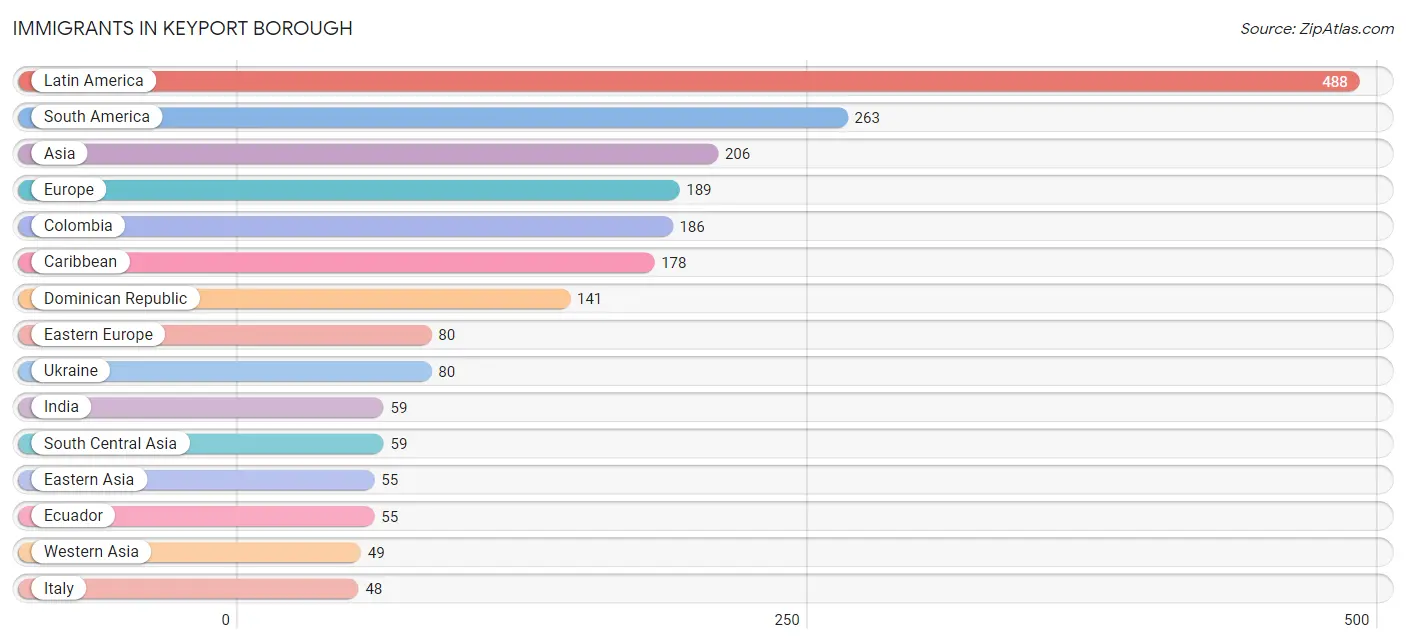
Immigrants in Keyport borough
The most numerous immigrant groups reported in Keyport borough came from Latin America (488 | 6.8%), South America (263 | 3.7%), Asia (206 | 2.9%), Europe (189 | 2.6%), and Colombia (186 | 2.6%), together accounting for 18.5% of all Keyport borough residents.
| Immigration Origin | # Population | % Population |
| Africa | 13 | 0.2% |
| Argentina | 6 | 0.1% |
| Asia | 206 | 2.9% |
| Caribbean | 178 | 2.5% |
| Central America | 47 | 0.6% |
| China | 28 | 0.4% |
| Colombia | 186 | 2.6% |
| Cuba | 37 | 0.5% |
| Dominican Republic | 141 | 2.0% |
| Eastern Asia | 55 | 0.8% |
| Eastern Europe | 80 | 1.1% |
| Ecuador | 55 | 0.8% |
| Egypt | 13 | 0.2% |
| Europe | 189 | 2.6% |
| Germany | 45 | 0.6% |
| India | 59 | 0.8% |
| Ireland | 16 | 0.2% |
| Israel | 35 | 0.5% |
| Italy | 48 | 0.7% |
| Korea | 27 | 0.4% |
| Latin America | 488 | 6.8% |
| Lebanon | 14 | 0.2% |
| Mexico | 34 | 0.5% |
| Northern Africa | 13 | 0.2% |
| Northern Europe | 16 | 0.2% |
| Panama | 13 | 0.2% |
| Peru | 16 | 0.2% |
| Philippines | 43 | 0.6% |
| South America | 263 | 3.7% |
| South Central Asia | 59 | 0.8% |
| South Eastern Asia | 43 | 0.6% |
| Southern Europe | 48 | 0.7% |
| Ukraine | 80 | 1.1% |
| Western Asia | 49 | 0.7% |
| Western Europe | 45 | 0.6% | View All 35 Rows |
Sex and Age in Keyport borough
Sex and Age in Keyport borough
The most populous age groups in Keyport borough are 65 to 69 Years (323 | 9.5%) for men and 50 to 54 Years (408 | 10.8%) for women.
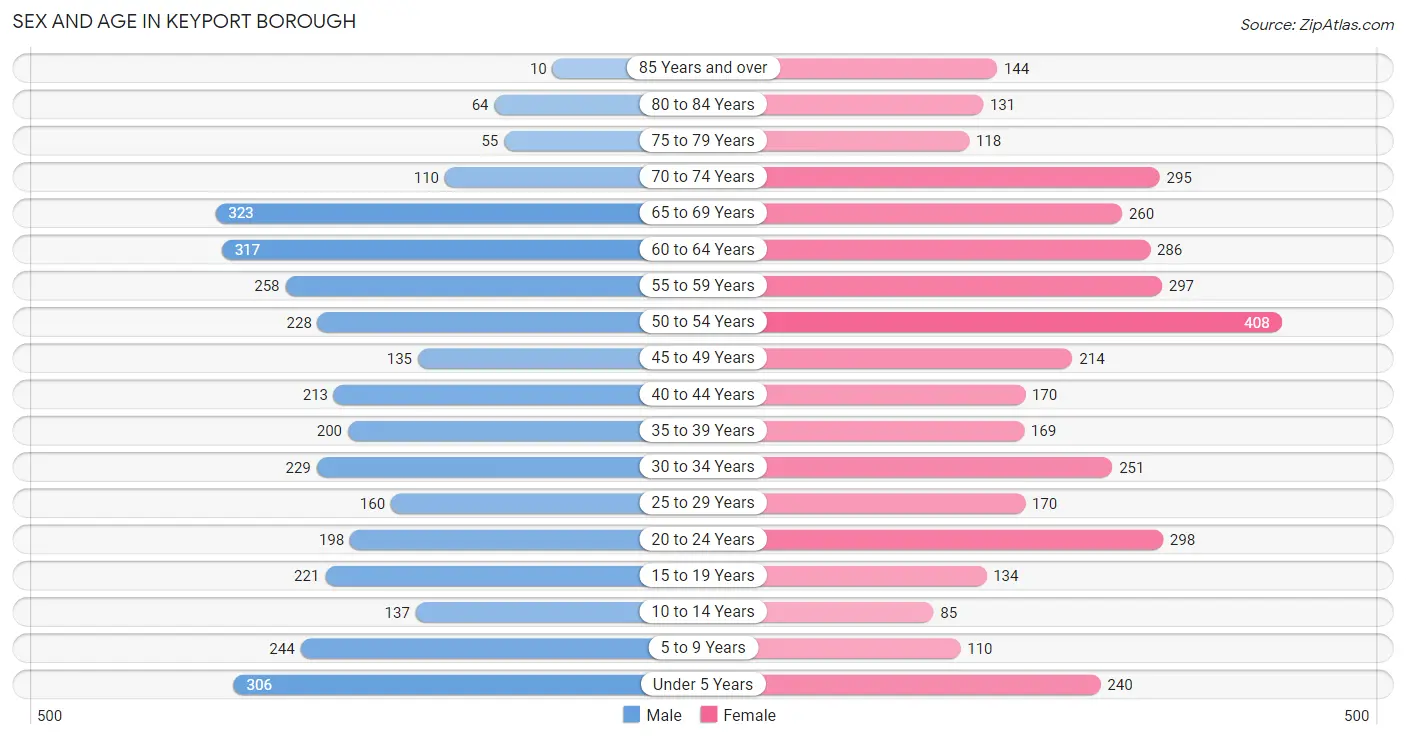
| Age Bracket | Male | Female |
| Under 5 Years | 306 (9.0%) | 240 (6.4%) |
| 5 to 9 Years | 244 (7.2%) | 110 (2.9%) |
| 10 to 14 Years | 137 (4.0%) | 85 (2.2%) |
| 15 to 19 Years | 221 (6.5%) | 134 (3.5%) |
| 20 to 24 Years | 198 (5.8%) | 298 (7.9%) |
| 25 to 29 Years | 160 (4.7%) | 170 (4.5%) |
| 30 to 34 Years | 229 (6.7%) | 251 (6.6%) |
| 35 to 39 Years | 200 (5.9%) | 169 (4.5%) |
| 40 to 44 Years | 213 (6.2%) | 170 (4.5%) |
| 45 to 49 Years | 135 (4.0%) | 214 (5.7%) |
| 50 to 54 Years | 228 (6.7%) | 408 (10.8%) |
| 55 to 59 Years | 258 (7.6%) | 297 (7.9%) |
| 60 to 64 Years | 317 (9.3%) | 286 (7.6%) |
| 65 to 69 Years | 323 (9.5%) | 260 (6.9%) |
| 70 to 74 Years | 110 (3.2%) | 295 (7.8%) |
| 75 to 79 Years | 55 (1.6%) | 118 (3.1%) |
| 80 to 84 Years | 64 (1.9%) | 131 (3.5%) |
| 85 Years and over | 10 (0.3%) | 144 (3.8%) |
| Total | 3,408 (100.0%) | 3,780 (100.0%) |
Families and Households in Keyport borough
Median Family Size in Keyport borough
The median family size in Keyport borough is 3.09 persons per family, with married-couple families (1,281 | 78.7%) accounting for the largest median family size of 3.19 persons per family. On the other hand, single female/mother families (246 | 15.1%) represent the smallest median family size with 2.59 persons per family.
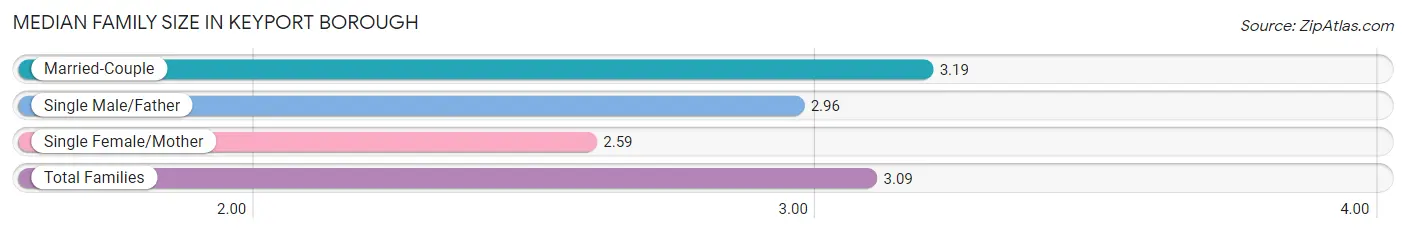
| Family Type | # Families | Family Size |
| Married-Couple | 1,281 (78.7%) | 3.19 |
| Single Male/Father | 101 (6.2%) | 2.96 |
| Single Female/Mother | 246 (15.1%) | 2.59 |
| Total Families | 1,628 (100.0%) | 3.09 |
Median Household Size in Keyport borough
The median household size in Keyport borough is 2.13 persons per household, with single male/father households (101 | 3.0%) accounting for the largest median household size of 3.47 persons per household. non-family households (1,736 | 51.6%) represent the smallest median household size with 1.10 persons per household.
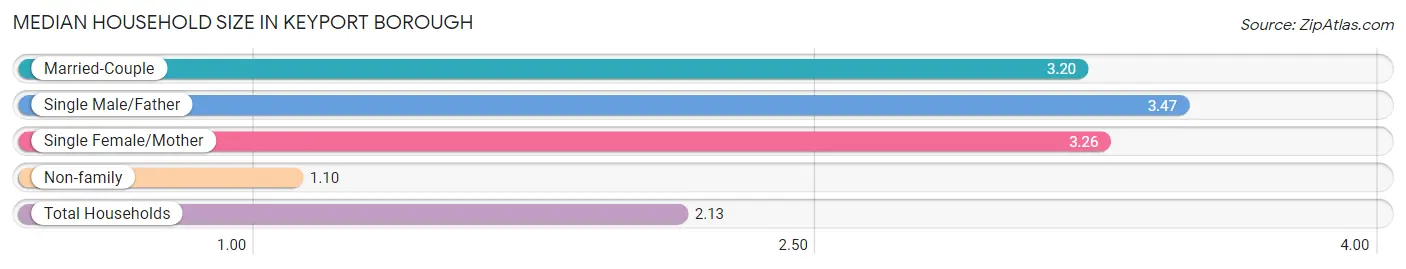
| Household Type | # Households | Household Size |
| Married-Couple | 1,281 (38.1%) | 3.20 |
| Single Male/Father | 101 (3.0%) | 3.47 |
| Single Female/Mother | 246 (7.3%) | 3.26 |
| Non-family | 1,736 (51.6%) | 1.10 |
| Total Households | 3,364 (100.0%) | 2.13 |
Household Size by Marriage Status in Keyport borough
Out of a total of 3,364 households in Keyport borough, 1,628 (48.4%) are family households, while 1,736 (51.6%) are nonfamily households. The most numerous type of family households are 3-person households, comprising 561, and the most common type of nonfamily households are 1-person households, comprising 1,555.
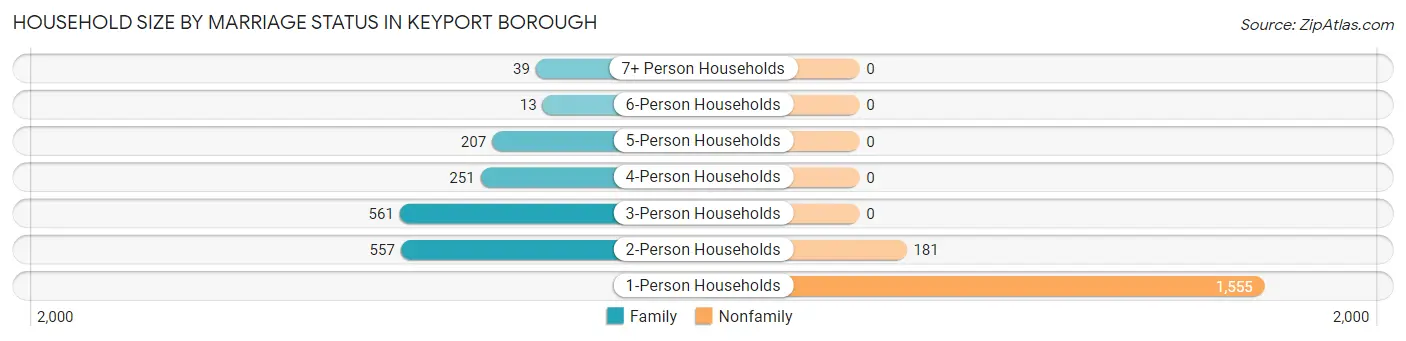
| Household Size | Family Households | Nonfamily Households |
| 1-Person Households | - | 1,555 (46.2%) |
| 2-Person Households | 557 (16.6%) | 181 (5.4%) |
| 3-Person Households | 561 (16.7%) | 0 (0.0%) |
| 4-Person Households | 251 (7.5%) | 0 (0.0%) |
| 5-Person Households | 207 (6.1%) | 0 (0.0%) |
| 6-Person Households | 13 (0.4%) | 0 (0.0%) |
| 7+ Person Households | 39 (1.2%) | 0 (0.0%) |
| Total | 1,628 (48.4%) | 1,736 (51.6%) |
Female Fertility in Keyport borough
Fertility by Age in Keyport borough
Average fertility rate in Keyport borough is 48.0 births per 1,000 women. Women in the age bracket of 20 to 34 years have the highest fertility rate with 65.0 births per 1,000 women. Women in the age bracket of 20 to 34 years acount for 66.2% of all women with births.
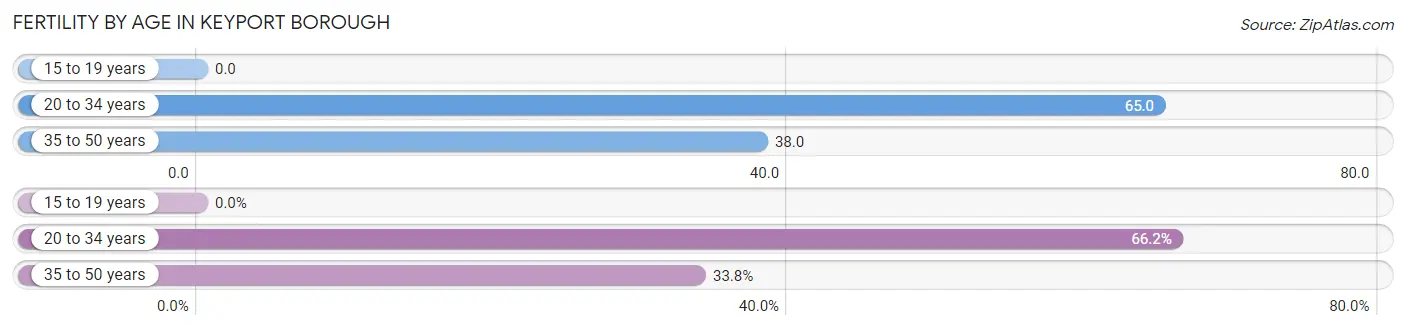
| Age Bracket | Women with Births | Births / 1,000 Women |
| 15 to 19 years | 0 (0.0%) | 0.0 |
| 20 to 34 years | 47 (66.2%) | 65.0 |
| 35 to 50 years | 24 (33.8%) | 38.0 |
| Total | 71 (100.0%) | 48.0 |
Fertility by Age by Marriage Status in Keyport borough
83.1% of women with births (71) in Keyport borough are married. The highest percentage of unmarried women with births falls into 20 to 34 years age bracket with 25.5% of them unmarried at the time of birth, while the lowest percentage of unmarried women with births belong to 35 to 50 years age bracket with 0.0% of them unmarried.
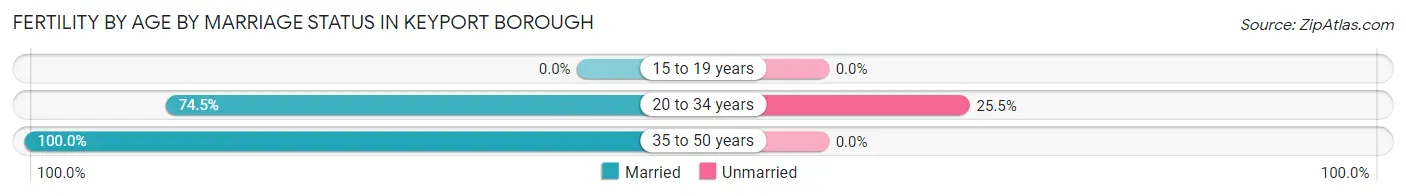
| Age Bracket | Married | Unmarried |
| 15 to 19 years | 0 (0.0%) | 0 (0.0%) |
| 20 to 34 years | 35 (74.5%) | 12 (25.5%) |
| 35 to 50 years | 24 (100.0%) | 0 (0.0%) |
| Total | 59 (83.1%) | 12 (16.9%) |
Fertility by Education in Keyport borough
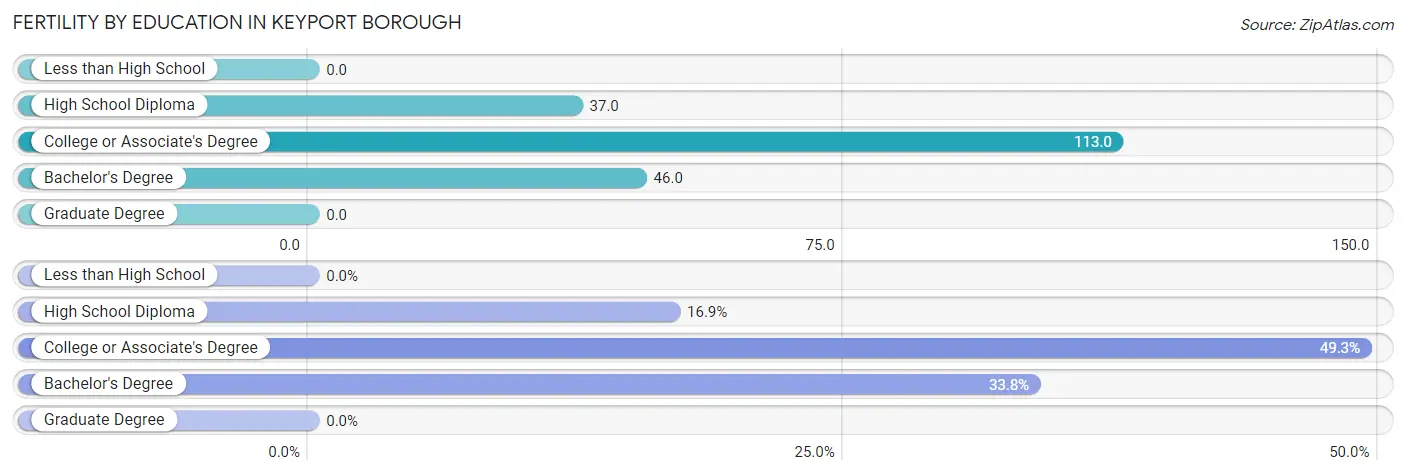
| Educational Attainment | Women with Births | Births / 1,000 Women |
| Less than High School | 0 (0.0%) | 0.0 |
| High School Diploma | 12 (16.9%) | 37.0 |
| College or Associate's Degree | 35 (49.3%) | 113.0 |
| Bachelor's Degree | 24 (33.8%) | 46.0 |
| Graduate Degree | 0 (0.0%) | 0.0 |
| Total | 71 (100.0%) | 48.0 |
Fertility by Education by Marriage Status in Keyport borough
16.9% of women with births in Keyport borough are unmarried. Women with the educational attainment of college or associate's degree are most likely to be married with 100.0% of them married at childbirth, while women with the educational attainment of high school diploma are least likely to be married with 100.0% of them unmarried at childbirth.
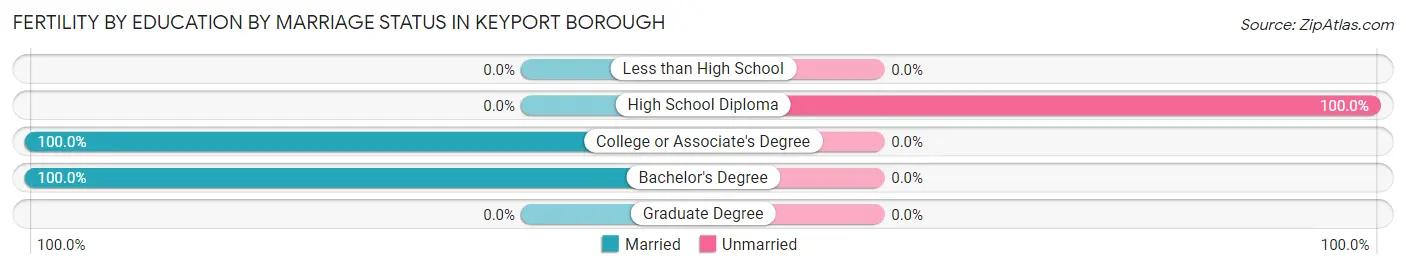
| Educational Attainment | Married | Unmarried |
| Less than High School | 0 (0.0%) | 0 (0.0%) |
| High School Diploma | 0 (0.0%) | 12 (100.0%) |
| College or Associate's Degree | 35 (100.0%) | 0 (0.0%) |
| Bachelor's Degree | 24 (100.0%) | 0 (0.0%) |
| Graduate Degree | 0 (0.0%) | 0 (0.0%) |
| Total | 59 (83.1%) | 12 (16.9%) |
Employment Characteristics in Keyport borough
Employment by Class of Employer in Keyport borough
Among the 3,475 employed individuals in Keyport borough, private company employees (2,658 | 76.5%), local government employees (319 | 9.2%), and not-for-profit organizations (238 | 6.9%) make up the most common classes of employment.
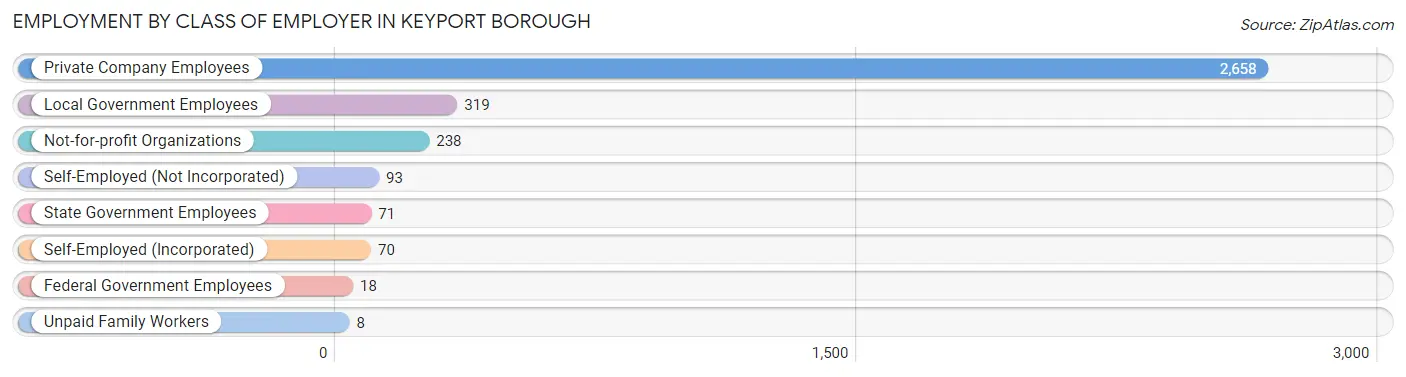
| Employer Class | # Employees | % Employees |
| Private Company Employees | 2,658 | 76.5% |
| Self-Employed (Incorporated) | 70 | 2.0% |
| Self-Employed (Not Incorporated) | 93 | 2.7% |
| Not-for-profit Organizations | 238 | 6.9% |
| Local Government Employees | 319 | 9.2% |
| State Government Employees | 71 | 2.0% |
| Federal Government Employees | 18 | 0.5% |
| Unpaid Family Workers | 8 | 0.2% |
| Total | 3,475 | 100.0% |
Employment Status by Age in Keyport borough
According to the labor force statistics for Keyport borough, out of the total population over 16 years of age (6,021), 64.8% or 3,902 individuals are in the labor force, with 10.4% or 406 of them unemployed. The age group with the highest labor force participation rate is 25 to 29 years, with 93.9% or 310 individuals in the labor force. Within the labor force, the 16 to 19 years age range has the highest percentage of unemployed individuals, with 34.5% or 58 of them being unemployed.
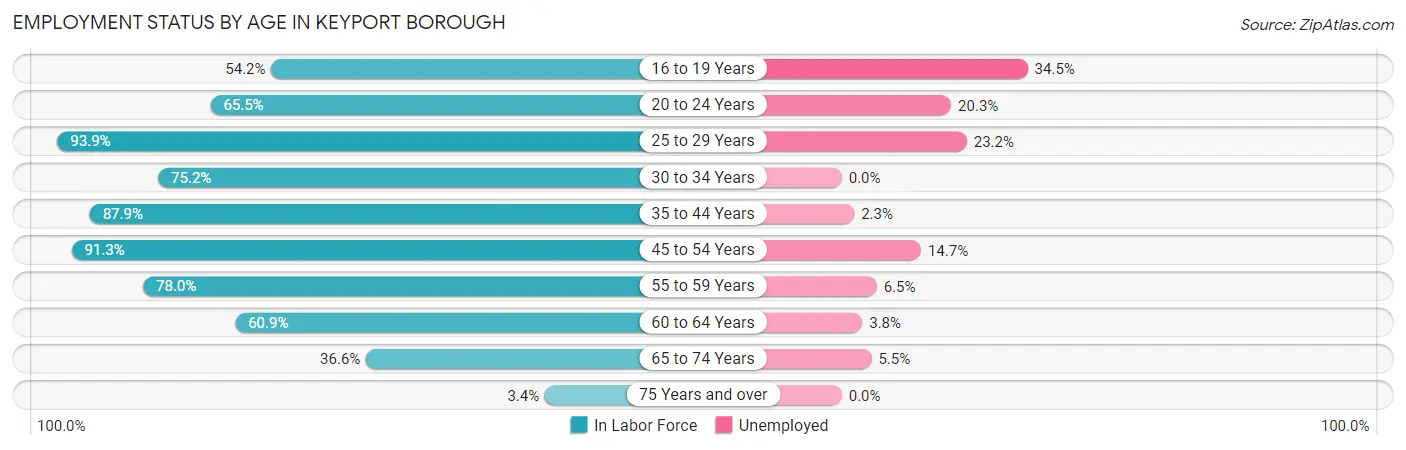
| Age Bracket | In Labor Force | Unemployed |
| 16 to 19 Years | 168 (54.2%) | 58 (34.5%) |
| 20 to 24 Years | 325 (65.5%) | 66 (20.3%) |
| 25 to 29 Years | 310 (93.9%) | 72 (23.2%) |
| 30 to 34 Years | 361 (75.2%) | 0 (0.0%) |
| 35 to 44 Years | 661 (87.9%) | 15 (2.3%) |
| 45 to 54 Years | 899 (91.3%) | 132 (14.7%) |
| 55 to 59 Years | 433 (78.0%) | 28 (6.5%) |
| 60 to 64 Years | 367 (60.9%) | 14 (3.8%) |
| 65 to 74 Years | 362 (36.6%) | 20 (5.5%) |
| 75 Years and over | 18 (3.4%) | 0 (0.0%) |
| Total | 3,902 (64.8%) | 406 (10.4%) |
Employment Status by Educational Attainment in Keyport borough
According to labor force statistics for Keyport borough, 81.8% of individuals (3,031) out of the total population between 25 and 64 years of age (3,705) are in the labor force, with 8.6% or 261 of them being unemployed. The group with the highest labor force participation rate are those with the educational attainment of college / associate degree, with 84.4% or 901 individuals in the labor force. Within the labor force, individuals with college / associate degree education have the highest percentage of unemployment, with 9.3% or 84 of them being unemployed.
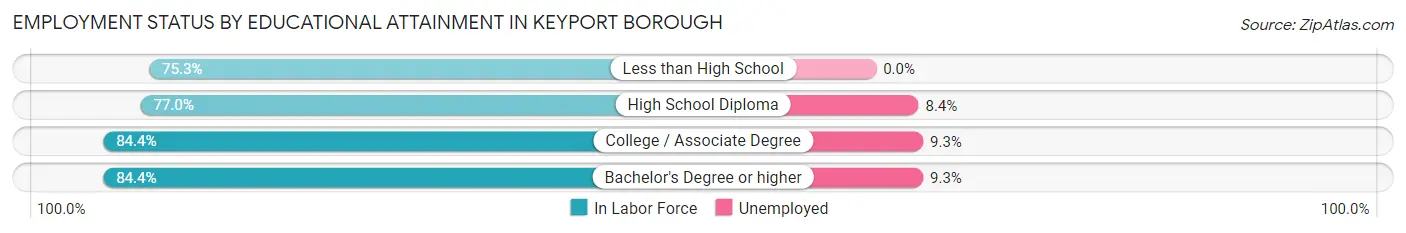
| Educational Attainment | In Labor Force | Unemployed |
| Less than High School | 146 (75.3%) | 0 (0.0%) |
| High School Diploma | 811 (77.0%) | 88 (8.4%) |
| College / Associate Degree | 901 (84.4%) | 99 (9.3%) |
| Bachelor's Degree or higher | 1,173 (84.4%) | 129 (9.3%) |
| Total | 3,031 (81.8%) | 319 (8.6%) |
Employment Occupations by Sex in Keyport borough
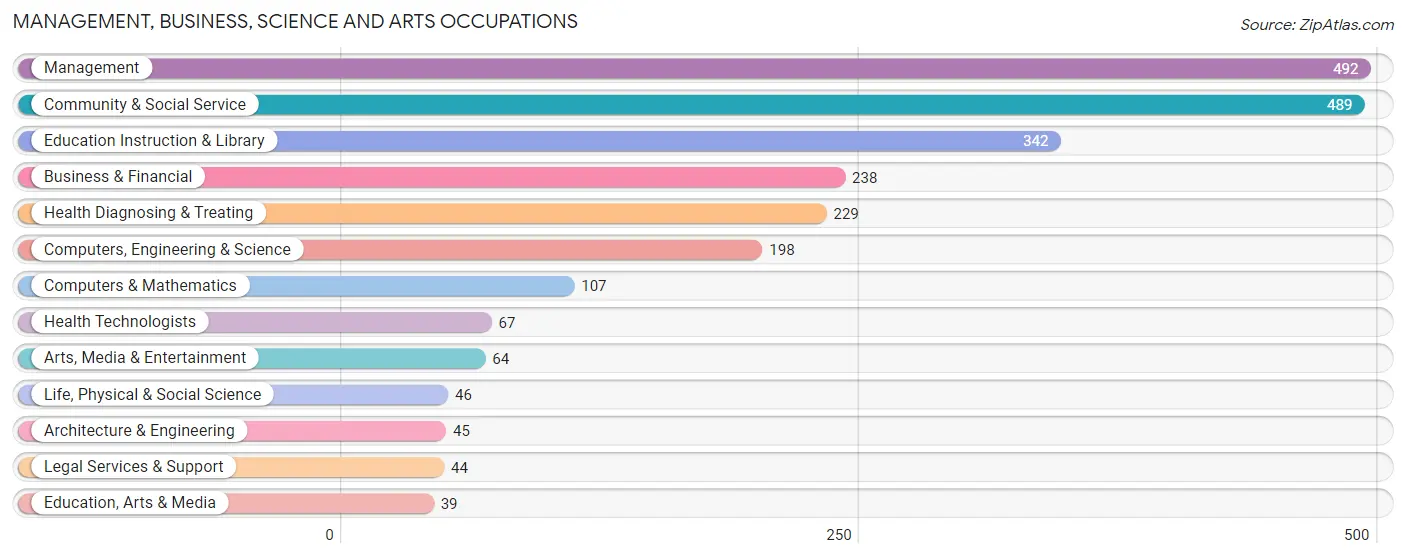
Management, Business, Science and Arts Occupations
The most common Management, Business, Science and Arts occupations in Keyport borough are Management (492 | 14.1%), Community & Social Service (489 | 14.0%), Education Instruction & Library (342 | 9.8%), Business & Financial (238 | 6.8%), and Health Diagnosing & Treating (229 | 6.5%).
Management, Business, Science and Arts Occupations by Sex
Within the Management, Business, Science and Arts occupations in Keyport borough, the most male-oriented occupations are Computers, Engineering & Science (100.0%), Computers & Mathematics (100.0%), and Architecture & Engineering (100.0%), while the most female-oriented occupations are Legal Services & Support (100.0%), Education Instruction & Library (89.5%), and Health Technologists (88.1%).
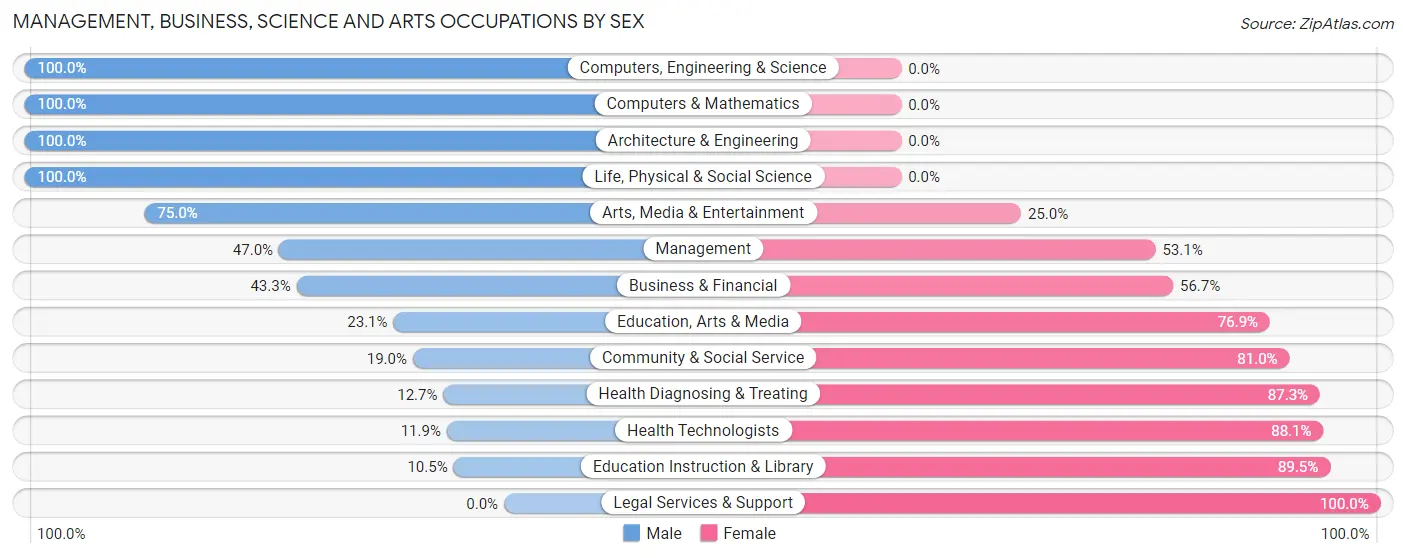
| Occupation | Male | Female |
| Management | 231 (46.9%) | 261 (53.0%) |
| Business & Financial | 103 (43.3%) | 135 (56.7%) |
| Computers, Engineering & Science | 198 (100.0%) | 0 (0.0%) |
| Computers & Mathematics | 107 (100.0%) | 0 (0.0%) |
| Architecture & Engineering | 45 (100.0%) | 0 (0.0%) |
| Life, Physical & Social Science | 46 (100.0%) | 0 (0.0%) |
| Community & Social Service | 93 (19.0%) | 396 (81.0%) |
| Education, Arts & Media | 9 (23.1%) | 30 (76.9%) |
| Legal Services & Support | 0 (0.0%) | 44 (100.0%) |
| Education Instruction & Library | 36 (10.5%) | 306 (89.5%) |
| Arts, Media & Entertainment | 48 (75.0%) | 16 (25.0%) |
| Health Diagnosing & Treating | 29 (12.7%) | 200 (87.3%) |
| Health Technologists | 8 (11.9%) | 59 (88.1%) |
| Total (Category) | 654 (39.7%) | 992 (60.3%) |
| Total (Overall) | 1,813 (51.8%) | 1,686 (48.2%) |
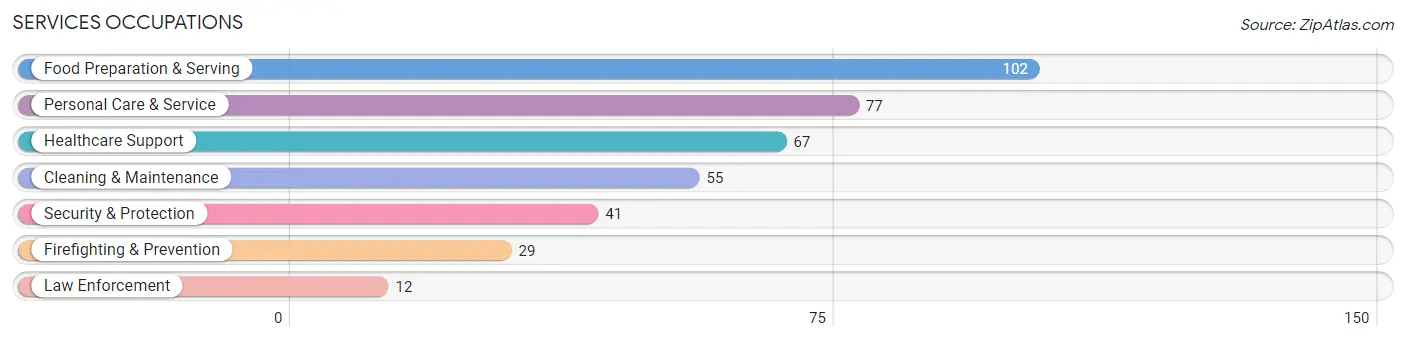
Services Occupations
The most common Services occupations in Keyport borough are Food Preparation & Serving (102 | 2.9%), Personal Care & Service (77 | 2.2%), Healthcare Support (67 | 1.9%), Cleaning & Maintenance (55 | 1.6%), and Security & Protection (41 | 1.2%).
Services Occupations by Sex
Within the Services occupations in Keyport borough, the most male-oriented occupations are Security & Protection (100.0%), Firefighting & Prevention (100.0%), and Law Enforcement (100.0%), while the most female-oriented occupations are Healthcare Support (88.1%), Personal Care & Service (67.5%), and Food Preparation & Serving (65.7%).
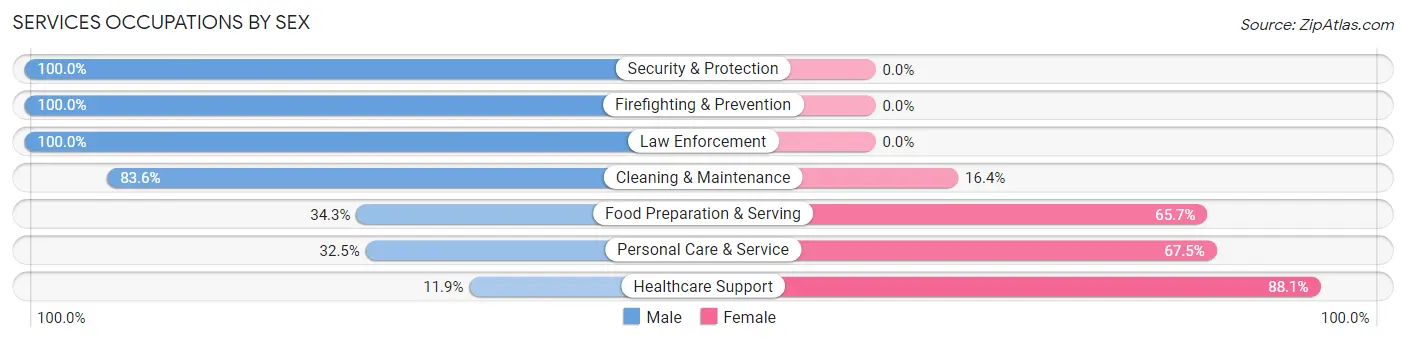
| Occupation | Male | Female |
| Healthcare Support | 8 (11.9%) | 59 (88.1%) |
| Security & Protection | 41 (100.0%) | 0 (0.0%) |
| Firefighting & Prevention | 29 (100.0%) | 0 (0.0%) |
| Law Enforcement | 12 (100.0%) | 0 (0.0%) |
| Food Preparation & Serving | 35 (34.3%) | 67 (65.7%) |
| Cleaning & Maintenance | 46 (83.6%) | 9 (16.4%) |
| Personal Care & Service | 25 (32.5%) | 52 (67.5%) |
| Total (Category) | 155 (45.3%) | 187 (54.7%) |
| Total (Overall) | 1,813 (51.8%) | 1,686 (48.2%) |
Sales and Office Occupations
The most common Sales and Office occupations in Keyport borough are Office & Administration (403 | 11.5%), and Sales & Related (242 | 6.9%).

Sales and Office Occupations by Sex
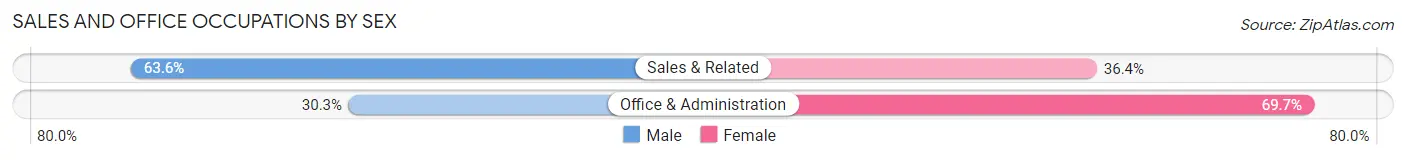
| Occupation | Male | Female |
| Sales & Related | 154 (63.6%) | 88 (36.4%) |
| Office & Administration | 122 (30.3%) | 281 (69.7%) |
| Total (Category) | 276 (42.8%) | 369 (57.2%) |
| Total (Overall) | 1,813 (51.8%) | 1,686 (48.2%) |
Natural Resources, Construction and Maintenance Occupations
The most common Natural Resources, Construction and Maintenance occupations in Keyport borough are Construction & Extraction (253 | 7.2%), and Installation, Maintenance & Repair (131 | 3.7%).
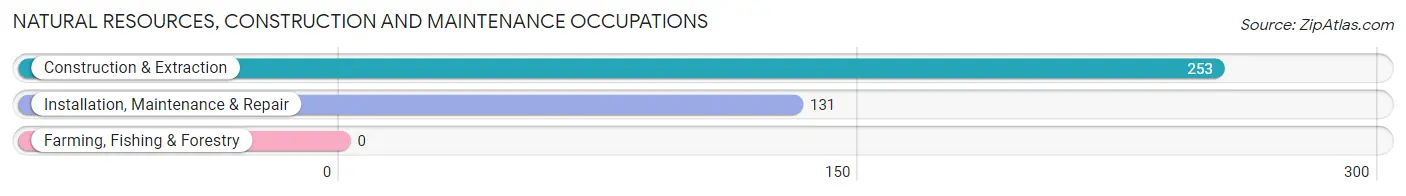
Natural Resources, Construction and Maintenance Occupations by Sex

| Occupation | Male | Female |
| Farming, Fishing & Forestry | 0 (0.0%) | 0 (0.0%) |
| Construction & Extraction | 253 (100.0%) | 0 (0.0%) |
| Installation, Maintenance & Repair | 114 (87.0%) | 17 (13.0%) |
| Total (Category) | 367 (95.6%) | 17 (4.4%) |
| Total (Overall) | 1,813 (51.8%) | 1,686 (48.2%) |
Production, Transportation and Moving Occupations
The most common Production, Transportation and Moving occupations in Keyport borough are Production (226 | 6.5%), Material Moving (139 | 4.0%), and Transportation (117 | 3.3%).
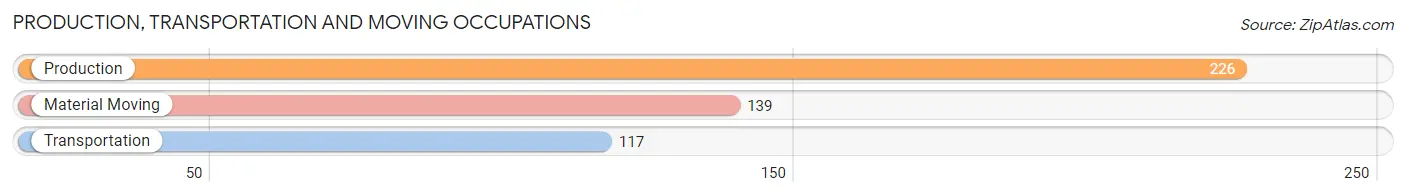
Production, Transportation and Moving Occupations by Sex
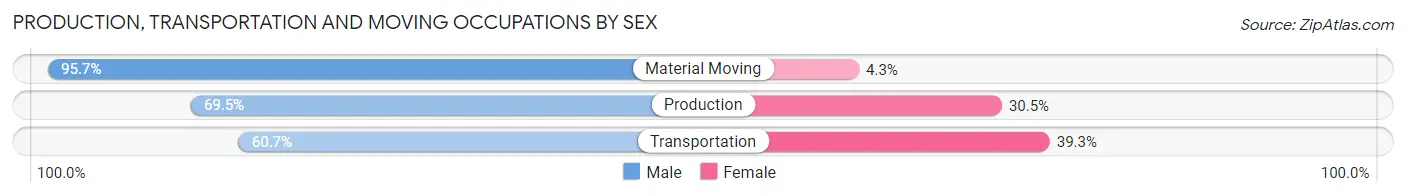
| Occupation | Male | Female |
| Production | 157 (69.5%) | 69 (30.5%) |
| Transportation | 71 (60.7%) | 46 (39.3%) |
| Material Moving | 133 (95.7%) | 6 (4.3%) |
| Total (Category) | 361 (74.9%) | 121 (25.1%) |
| Total (Overall) | 1,813 (51.8%) | 1,686 (48.2%) |
Employment Industries by Sex in Keyport borough
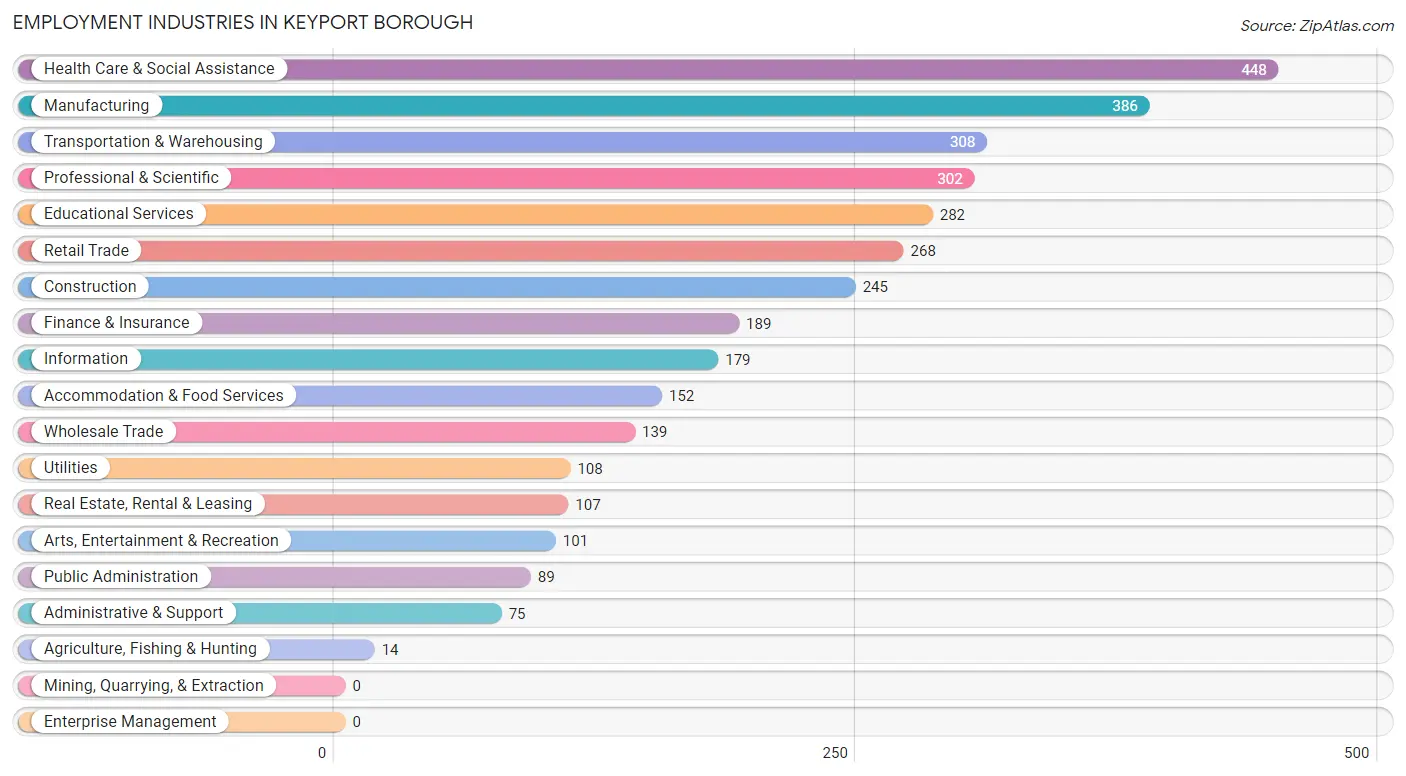
Employment Industries in Keyport borough
The major employment industries in Keyport borough include Health Care & Social Assistance (448 | 12.8%), Manufacturing (386 | 11.0%), Transportation & Warehousing (308 | 8.8%), Professional & Scientific (302 | 8.6%), and Educational Services (282 | 8.1%).
Employment Industries by Sex in Keyport borough
The Keyport borough industries that see more men than women are Agriculture, Fishing & Hunting (100.0%), Wholesale Trade (100.0%), and Utilities (86.1%), whereas the industries that tend to have a higher number of women are Health Care & Social Assistance (90.6%), Finance & Insurance (90.5%), and Administrative & Support (89.3%).
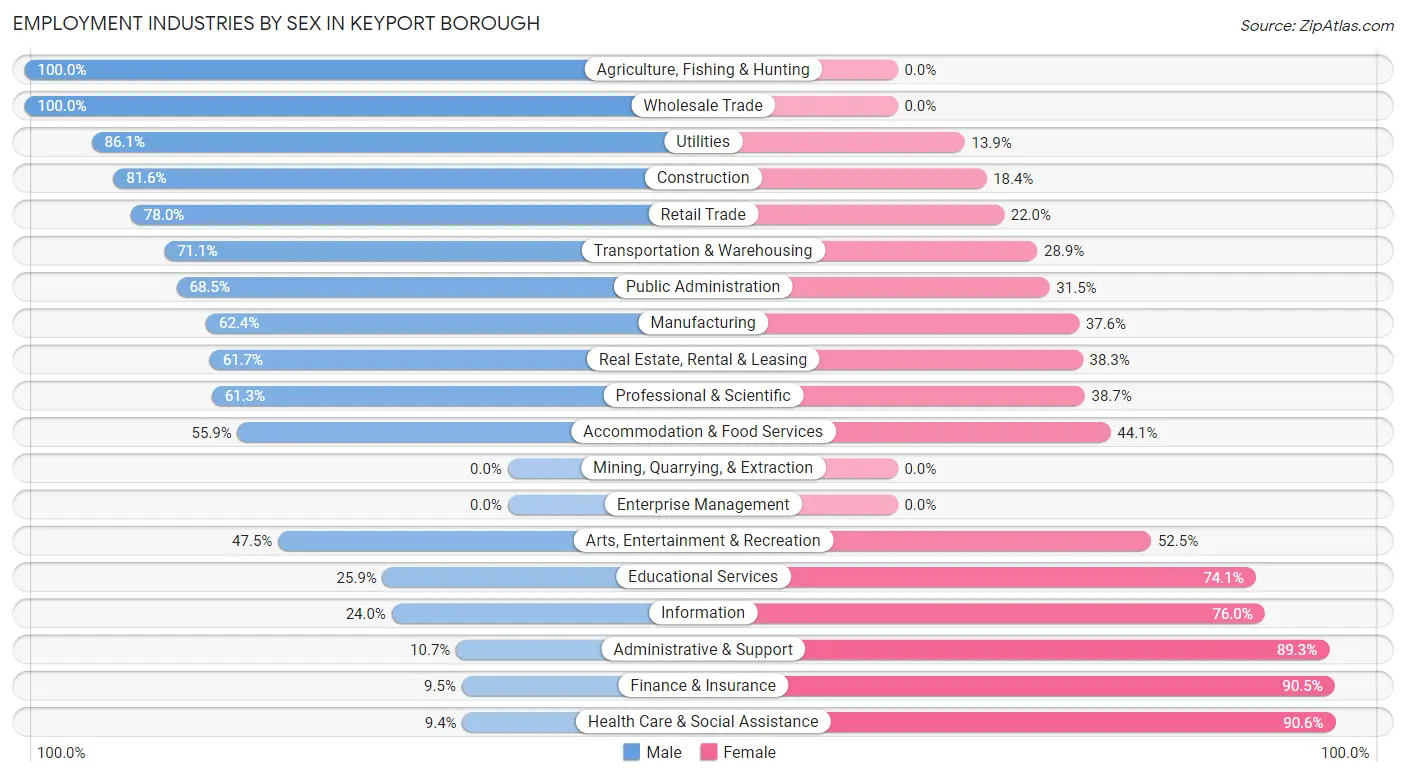
| Industry | Male | Female |
| Agriculture, Fishing & Hunting | 14 (100.0%) | 0 (0.0%) |
| Mining, Quarrying, & Extraction | 0 (0.0%) | 0 (0.0%) |
| Construction | 200 (81.6%) | 45 (18.4%) |
| Manufacturing | 241 (62.4%) | 145 (37.6%) |
| Wholesale Trade | 139 (100.0%) | 0 (0.0%) |
| Retail Trade | 209 (78.0%) | 59 (22.0%) |
| Transportation & Warehousing | 219 (71.1%) | 89 (28.9%) |
| Utilities | 93 (86.1%) | 15 (13.9%) |
| Information | 43 (24.0%) | 136 (76.0%) |
| Finance & Insurance | 18 (9.5%) | 171 (90.5%) |
| Real Estate, Rental & Leasing | 66 (61.7%) | 41 (38.3%) |
| Professional & Scientific | 185 (61.3%) | 117 (38.7%) |
| Enterprise Management | 0 (0.0%) | 0 (0.0%) |
| Administrative & Support | 8 (10.7%) | 67 (89.3%) |
| Educational Services | 73 (25.9%) | 209 (74.1%) |
| Health Care & Social Assistance | 42 (9.4%) | 406 (90.6%) |
| Arts, Entertainment & Recreation | 48 (47.5%) | 53 (52.5%) |
| Accommodation & Food Services | 85 (55.9%) | 67 (44.1%) |
| Public Administration | 61 (68.5%) | 28 (31.5%) |
| Total | 1,813 (51.8%) | 1,686 (48.2%) |
Education in Keyport borough
School Enrollment in Keyport borough
The most common levels of schooling among the 1,382 students in Keyport borough are college / undergraduate (379 | 27.4%), elementary school (297 | 21.5%), and high school (205 | 14.8%).
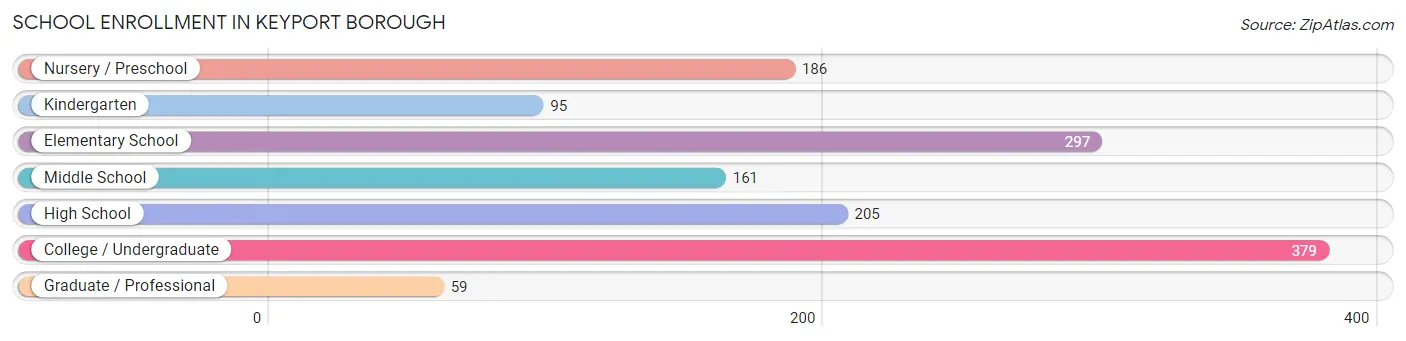
| School Level | # Students | % Students |
| Nursery / Preschool | 186 | 13.5% |
| Kindergarten | 95 | 6.9% |
| Elementary School | 297 | 21.5% |
| Middle School | 161 | 11.7% |
| High School | 205 | 14.8% |
| College / Undergraduate | 379 | 27.4% |
| Graduate / Professional | 59 | 4.3% |
| Total | 1,382 | 100.0% |
School Enrollment by Age by Funding Source in Keyport borough
Out of a total of 1,382 students who are enrolled in schools in Keyport borough, 474 (34.3%) attend a private institution, while the remaining 908 (65.7%) are enrolled in public schools. The age group of 35 years and over has the highest likelihood of being enrolled in private schools, with 20 (71.4% in the age bracket) enrolled. Conversely, the age group of 10 to 14 year olds has the lowest likelihood of being enrolled in a private school, with 198 (89.2% in the age bracket) attending a public institution.
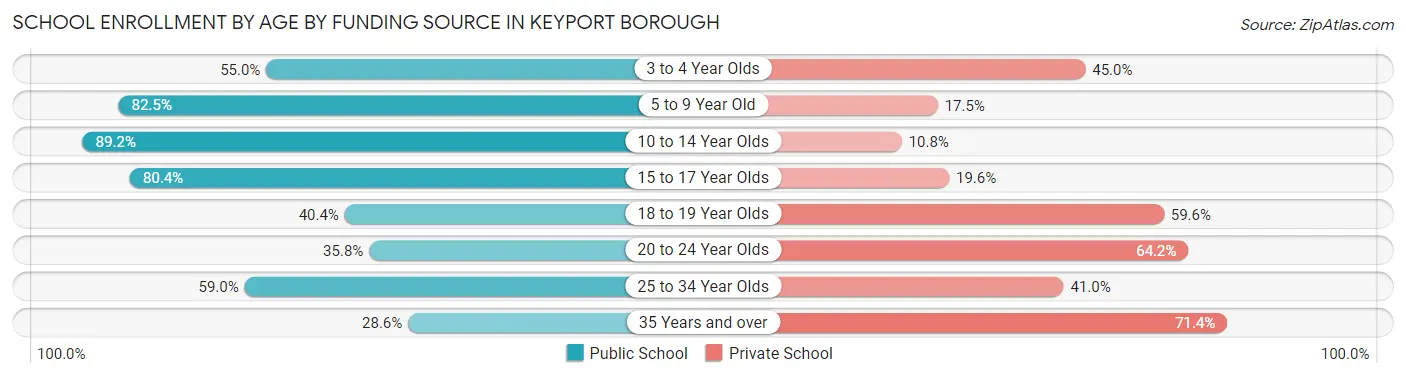
| Age Bracket | Public School | Private School |
| 3 to 4 Year Olds | 99 (55.0%) | 81 (45.0%) |
| 5 to 9 Year Old | 292 (82.5%) | 62 (17.5%) |
| 10 to 14 Year Olds | 198 (89.2%) | 24 (10.8%) |
| 15 to 17 Year Olds | 127 (80.4%) | 31 (19.6%) |
| 18 to 19 Year Olds | 63 (40.4%) | 93 (59.6%) |
| 20 to 24 Year Olds | 72 (35.8%) | 129 (64.2%) |
| 25 to 34 Year Olds | 49 (59.0%) | 34 (41.0%) |
| 35 Years and over | 8 (28.6%) | 20 (71.4%) |
| Total | 908 (65.7%) | 474 (34.3%) |
Educational Attainment by Field of Study in Keyport borough
Business (357 | 19.0%), science & technology (310 | 16.5%), literature & languages (254 | 13.5%), communications (210 | 11.2%), and arts & humanities (137 | 7.3%) are the most common fields of study among 1,878 individuals in Keyport borough who have obtained a bachelor's degree or higher.
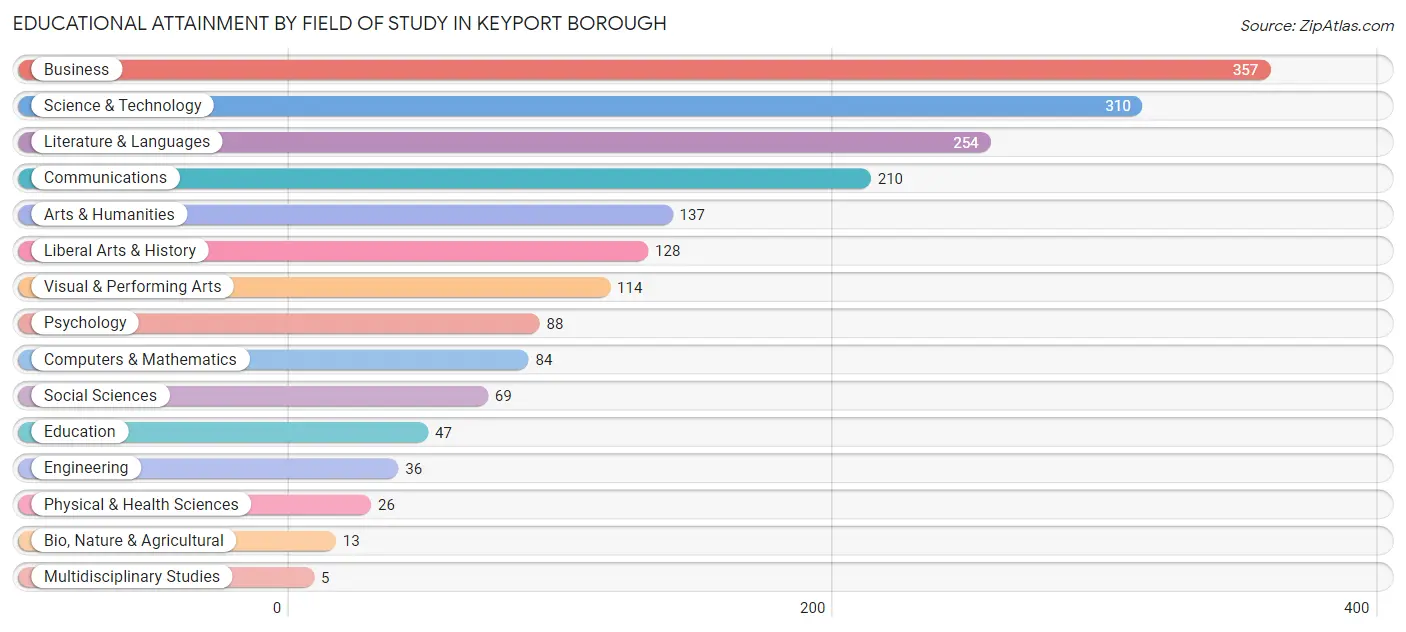
| Field of Study | # Graduates | % Graduates |
| Computers & Mathematics | 84 | 4.5% |
| Bio, Nature & Agricultural | 13 | 0.7% |
| Physical & Health Sciences | 26 | 1.4% |
| Psychology | 88 | 4.7% |
| Social Sciences | 69 | 3.7% |
| Engineering | 36 | 1.9% |
| Multidisciplinary Studies | 5 | 0.3% |
| Science & Technology | 310 | 16.5% |
| Business | 357 | 19.0% |
| Education | 47 | 2.5% |
| Literature & Languages | 254 | 13.5% |
| Liberal Arts & History | 128 | 6.8% |
| Visual & Performing Arts | 114 | 6.1% |
| Communications | 210 | 11.2% |
| Arts & Humanities | 137 | 7.3% |
| Total | 1,878 | 100.0% |
Transportation & Commute in Keyport borough
Vehicle Availability by Sex in Keyport borough
The most prevalent vehicle ownership categories in Keyport borough are males with 2 vehicles (629, accounting for 34.9%) and females with 2 vehicles (602, making up 37.6%).
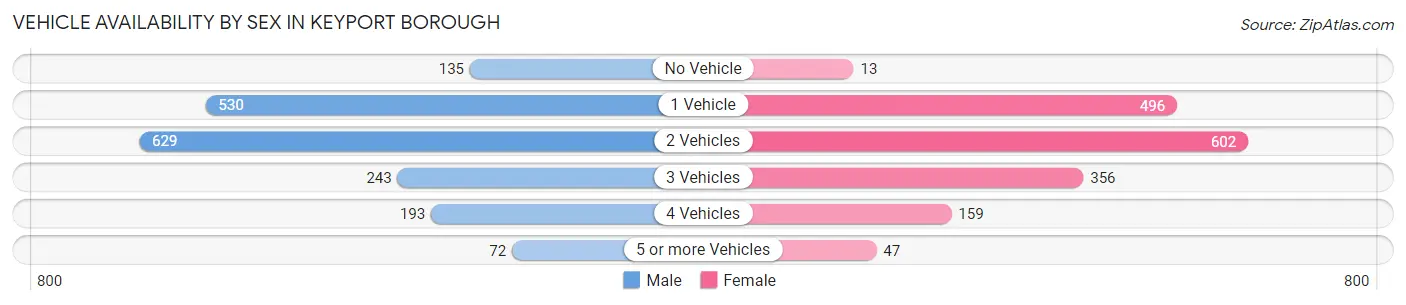
| Vehicles Available | Male | Female |
| No Vehicle | 135 (7.5%) | 13 (0.8%) |
| 1 Vehicle | 530 (29.4%) | 496 (29.6%) |
| 2 Vehicles | 629 (34.9%) | 602 (36.0%) |
| 3 Vehicles | 243 (13.5%) | 356 (21.3%) |
| 4 Vehicles | 193 (10.7%) | 159 (9.5%) |
| 5 or more Vehicles | 72 (4.0%) | 47 (2.8%) |
| Total | 1,802 (100.0%) | 1,673 (100.0%) |
Commute Time in Keyport borough
The most frequently occuring commute durations in Keyport borough are 10 to 14 minutes (476 commuters, 15.0%), 20 to 24 minutes (375 commuters, 11.8%), and 45 to 59 minutes (371 commuters, 11.7%).
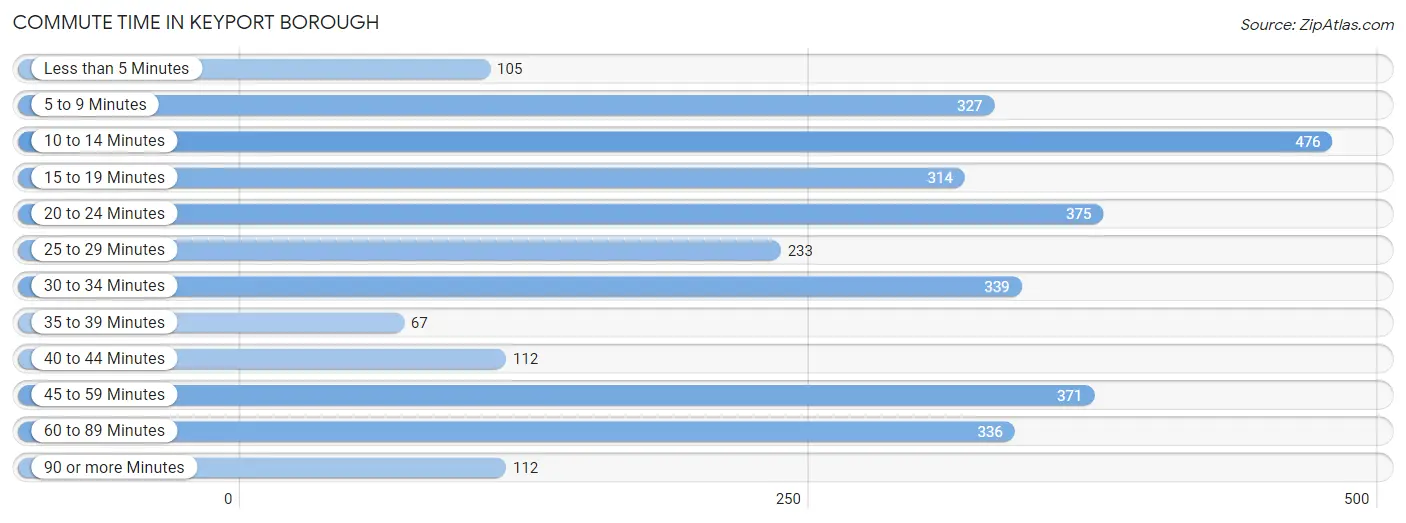
| Commute Time | # Commuters | % Commuters |
| Less than 5 Minutes | 105 | 3.3% |
| 5 to 9 Minutes | 327 | 10.3% |
| 10 to 14 Minutes | 476 | 15.0% |
| 15 to 19 Minutes | 314 | 9.9% |
| 20 to 24 Minutes | 375 | 11.8% |
| 25 to 29 Minutes | 233 | 7.4% |
| 30 to 34 Minutes | 339 | 10.7% |
| 35 to 39 Minutes | 67 | 2.1% |
| 40 to 44 Minutes | 112 | 3.5% |
| 45 to 59 Minutes | 371 | 11.7% |
| 60 to 89 Minutes | 336 | 10.6% |
| 90 or more Minutes | 112 | 3.5% |
Commute Time by Sex in Keyport borough
The most common commute times in Keyport borough are 60 to 89 minutes (286 commuters, 16.9%) for males and 10 to 14 minutes (232 commuters, 15.7%) for females.
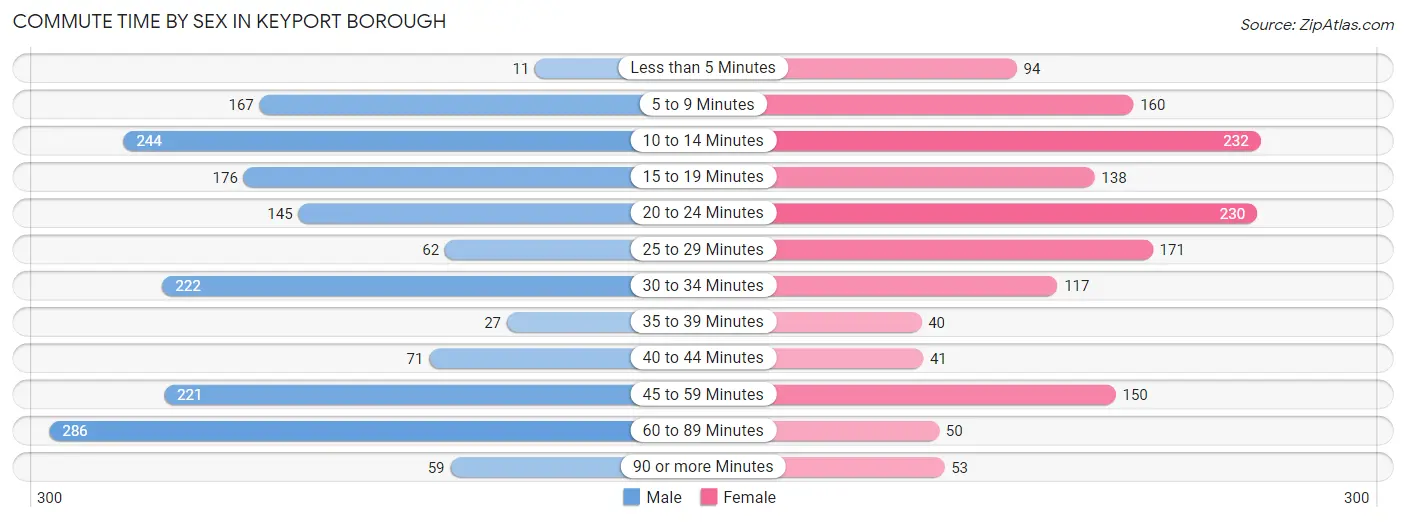
| Commute Time | Male | Female |
| Less than 5 Minutes | 11 (0.6%) | 94 (6.4%) |
| 5 to 9 Minutes | 167 (9.9%) | 160 (10.8%) |
| 10 to 14 Minutes | 244 (14.4%) | 232 (15.7%) |
| 15 to 19 Minutes | 176 (10.4%) | 138 (9.3%) |
| 20 to 24 Minutes | 145 (8.6%) | 230 (15.6%) |
| 25 to 29 Minutes | 62 (3.7%) | 171 (11.6%) |
| 30 to 34 Minutes | 222 (13.1%) | 117 (7.9%) |
| 35 to 39 Minutes | 27 (1.6%) | 40 (2.7%) |
| 40 to 44 Minutes | 71 (4.2%) | 41 (2.8%) |
| 45 to 59 Minutes | 221 (13.1%) | 150 (10.2%) |
| 60 to 89 Minutes | 286 (16.9%) | 50 (3.4%) |
| 90 or more Minutes | 59 (3.5%) | 53 (3.6%) |
Time of Departure to Work by Sex in Keyport borough
The most frequent times of departure to work in Keyport borough are 12:00 AM to 4:59 AM (231, 13.7%) for males and 8:00 AM to 8:29 AM (228, 15.4%) for females.
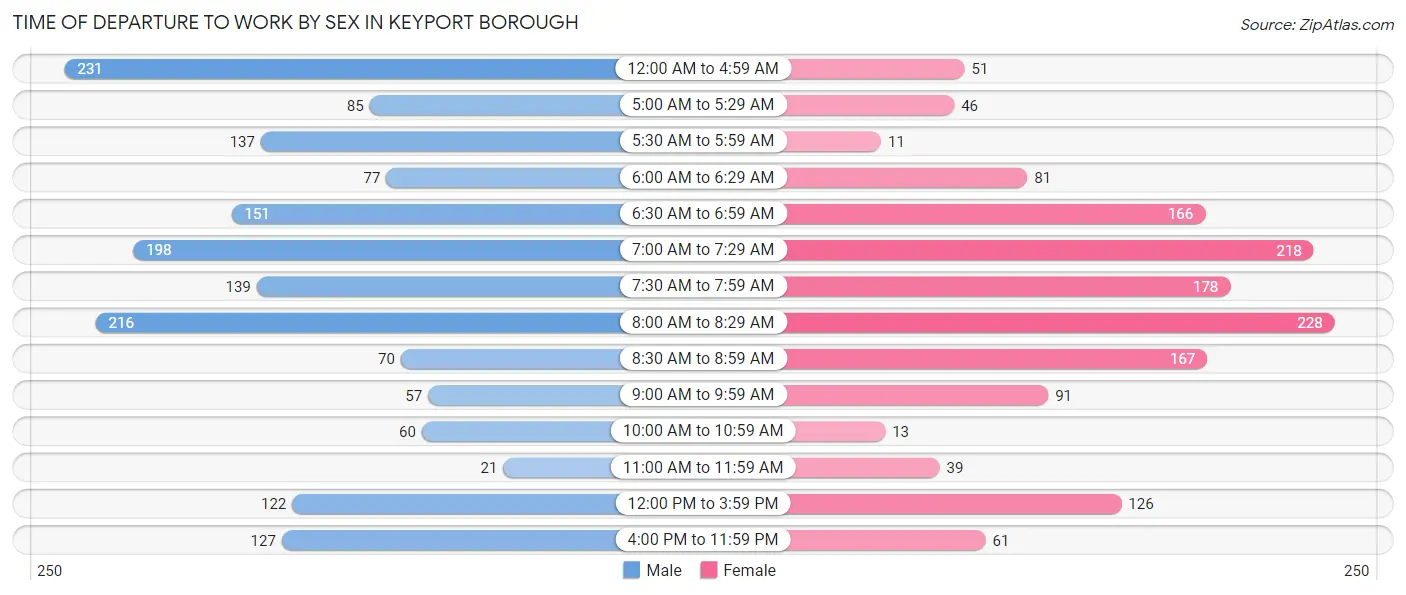
| Time of Departure | Male | Female |
| 12:00 AM to 4:59 AM | 231 (13.7%) | 51 (3.5%) |
| 5:00 AM to 5:29 AM | 85 (5.0%) | 46 (3.1%) |
| 5:30 AM to 5:59 AM | 137 (8.1%) | 11 (0.7%) |
| 6:00 AM to 6:29 AM | 77 (4.5%) | 81 (5.5%) |
| 6:30 AM to 6:59 AM | 151 (8.9%) | 166 (11.3%) |
| 7:00 AM to 7:29 AM | 198 (11.7%) | 218 (14.8%) |
| 7:30 AM to 7:59 AM | 139 (8.2%) | 178 (12.1%) |
| 8:00 AM to 8:29 AM | 216 (12.8%) | 228 (15.4%) |
| 8:30 AM to 8:59 AM | 70 (4.1%) | 167 (11.3%) |
| 9:00 AM to 9:59 AM | 57 (3.4%) | 91 (6.2%) |
| 10:00 AM to 10:59 AM | 60 (3.5%) | 13 (0.9%) |
| 11:00 AM to 11:59 AM | 21 (1.2%) | 39 (2.6%) |
| 12:00 PM to 3:59 PM | 122 (7.2%) | 126 (8.5%) |
| 4:00 PM to 11:59 PM | 127 (7.5%) | 61 (4.1%) |
| Total | 1,691 (100.0%) | 1,476 (100.0%) |
Housing Occupancy in Keyport borough
Occupancy by Ownership in Keyport borough
Of the total 3,364 dwellings in Keyport borough, owner-occupied units account for 1,878 (55.8%), while renter-occupied units make up 1,486 (44.2%).
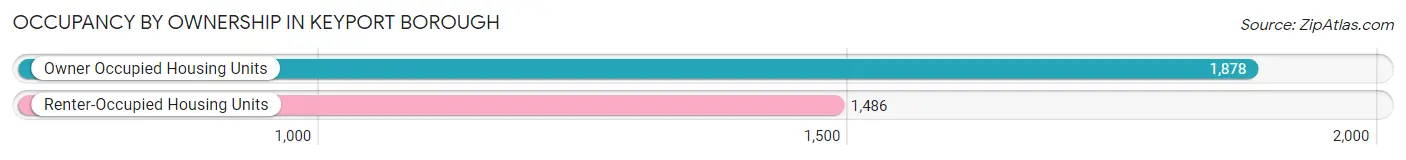
| Occupancy | # Housing Units | % Housing Units |
| Owner Occupied Housing Units | 1,878 | 55.8% |
| Renter-Occupied Housing Units | 1,486 | 44.2% |
| Total Occupied Housing Units | 3,364 | 100.0% |
Occupancy by Household Size in Keyport borough
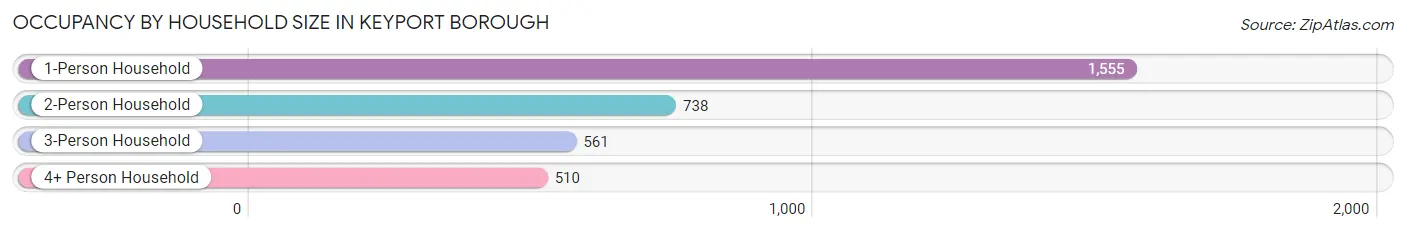
| Household Size | # Housing Units | % Housing Units |
| 1-Person Household | 1,555 | 46.2% |
| 2-Person Household | 738 | 21.9% |
| 3-Person Household | 561 | 16.7% |
| 4+ Person Household | 510 | 15.2% |
| Total Housing Units | 3,364 | 100.0% |
Occupancy by Ownership by Household Size in Keyport borough
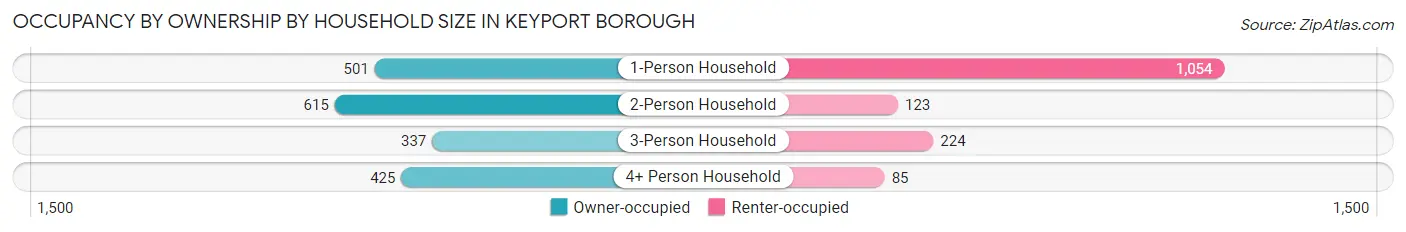
| Household Size | Owner-occupied | Renter-occupied |
| 1-Person Household | 501 (32.2%) | 1,054 (67.8%) |
| 2-Person Household | 615 (83.3%) | 123 (16.7%) |
| 3-Person Household | 337 (60.1%) | 224 (39.9%) |
| 4+ Person Household | 425 (83.3%) | 85 (16.7%) |
| Total Housing Units | 1,878 (55.8%) | 1,486 (44.2%) |
Occupancy by Educational Attainment in Keyport borough
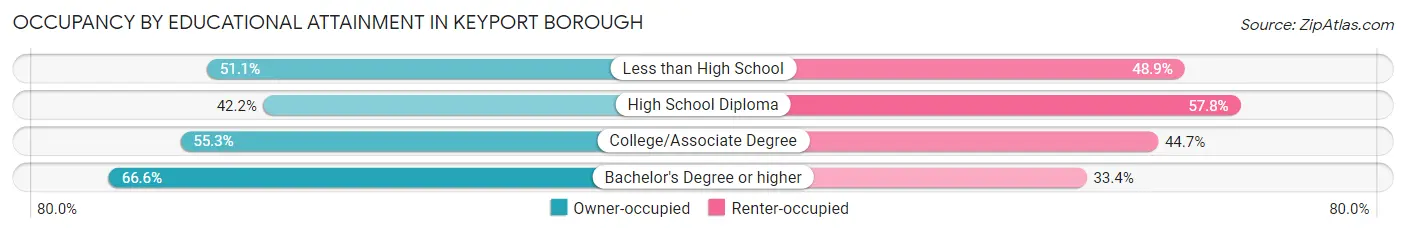
| Household Size | Owner-occupied | Renter-occupied |
| Less than High School | 117 (51.1%) | 112 (48.9%) |
| High School Diploma | 375 (42.2%) | 513 (57.8%) |
| College/Associate Degree | 543 (55.3%) | 439 (44.7%) |
| Bachelor's Degree or higher | 843 (66.6%) | 422 (33.4%) |
Occupancy by Age of Householder in Keyport borough
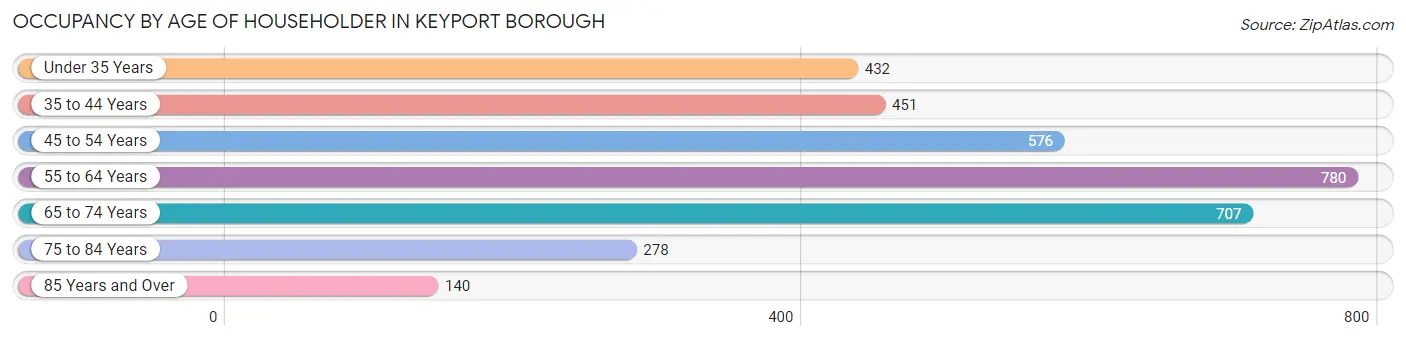
| Age Bracket | # Households | % Households |
| Under 35 Years | 432 | 12.8% |
| 35 to 44 Years | 451 | 13.4% |
| 45 to 54 Years | 576 | 17.1% |
| 55 to 64 Years | 780 | 23.2% |
| 65 to 74 Years | 707 | 21.0% |
| 75 to 84 Years | 278 | 8.3% |
| 85 Years and Over | 140 | 4.2% |
| Total | 3,364 | 100.0% |
Housing Finances in Keyport borough
Median Income by Occupancy in Keyport borough
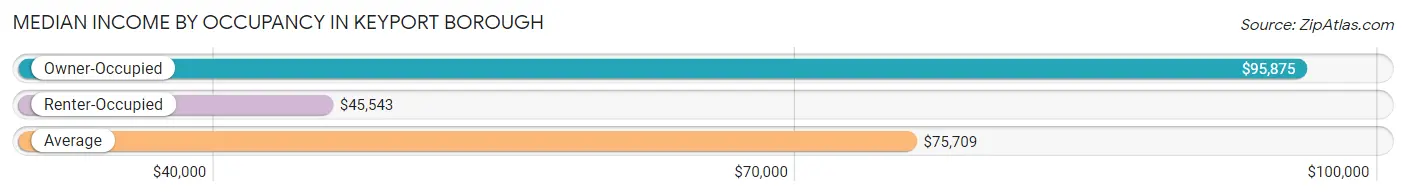
| Occupancy Type | # Households | Median Income |
| Owner-Occupied | 1,878 (55.8%) | $95,875 |
| Renter-Occupied | 1,486 (44.2%) | $45,543 |
| Average | 3,364 (100.0%) | $75,709 |
Occupancy by Householder Income Bracket in Keyport borough
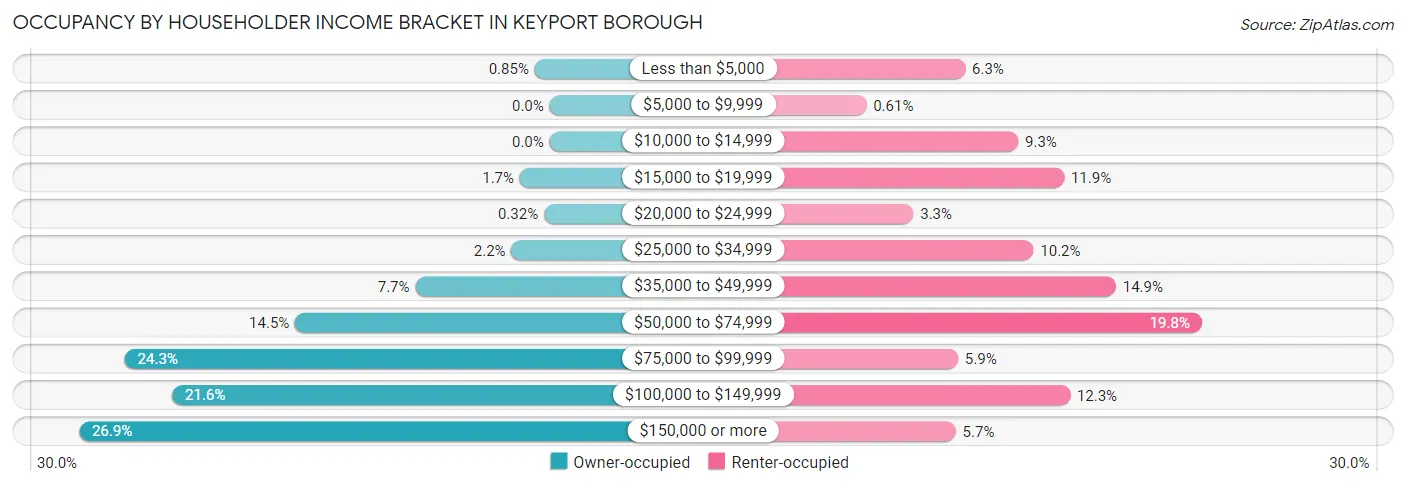
| Income Bracket | Owner-occupied | Renter-occupied |
| Less than $5,000 | 16 (0.9%) | 93 (6.3%) |
| $5,000 to $9,999 | 0 (0.0%) | 9 (0.6%) |
| $10,000 to $14,999 | 0 (0.0%) | 138 (9.3%) |
| $15,000 to $19,999 | 32 (1.7%) | 177 (11.9%) |
| $20,000 to $24,999 | 6 (0.3%) | 49 (3.3%) |
| $25,000 to $34,999 | 41 (2.2%) | 151 (10.2%) |
| $35,000 to $49,999 | 144 (7.7%) | 221 (14.9%) |
| $50,000 to $74,999 | 273 (14.5%) | 294 (19.8%) |
| $75,000 to $99,999 | 456 (24.3%) | 87 (5.9%) |
| $100,000 to $149,999 | 405 (21.6%) | 182 (12.2%) |
| $150,000 or more | 505 (26.9%) | 85 (5.7%) |
| Total | 1,878 (100.0%) | 1,486 (100.0%) |
Monthly Housing Cost Tiers in Keyport borough
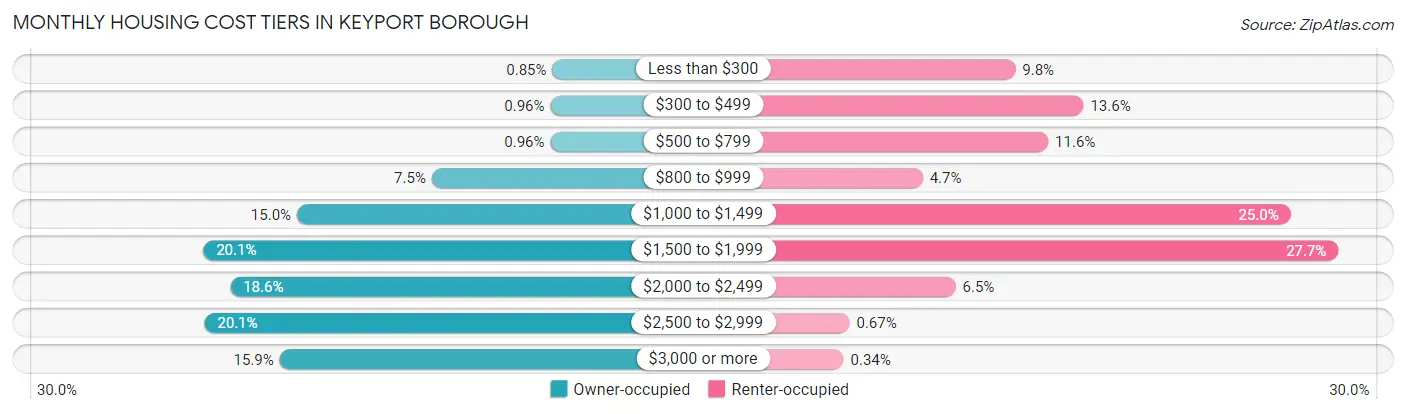
| Monthly Cost | Owner-occupied | Renter-occupied |
| Less than $300 | 16 (0.9%) | 146 (9.8%) |
| $300 to $499 | 18 (1.0%) | 202 (13.6%) |
| $500 to $799 | 18 (1.0%) | 173 (11.6%) |
| $800 to $999 | 141 (7.5%) | 70 (4.7%) |
| $1,000 to $1,499 | 281 (15.0%) | 372 (25.0%) |
| $1,500 to $1,999 | 378 (20.1%) | 411 (27.7%) |
| $2,000 to $2,499 | 350 (18.6%) | 97 (6.5%) |
| $2,500 to $2,999 | 377 (20.1%) | 10 (0.7%) |
| $3,000 or more | 299 (15.9%) | 5 (0.3%) |
| Total | 1,878 (100.0%) | 1,486 (100.0%) |
Physical Housing Characteristics in Keyport borough
Housing Structures in Keyport borough
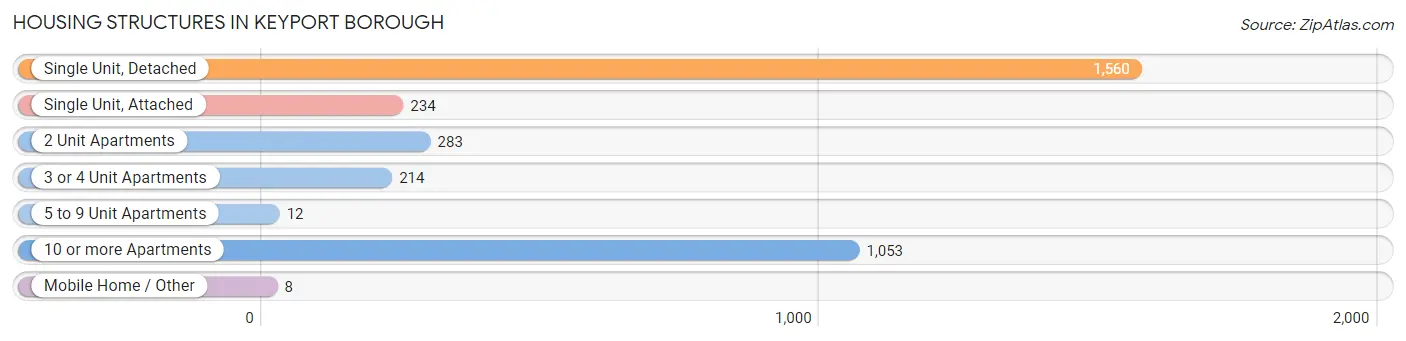
| Structure Type | # Housing Units | % Housing Units |
| Single Unit, Detached | 1,560 | 46.4% |
| Single Unit, Attached | 234 | 7.0% |
| 2 Unit Apartments | 283 | 8.4% |
| 3 or 4 Unit Apartments | 214 | 6.4% |
| 5 to 9 Unit Apartments | 12 | 0.4% |
| 10 or more Apartments | 1,053 | 31.3% |
| Mobile Home / Other | 8 | 0.2% |
| Total | 3,364 | 100.0% |
Housing Structures by Occupancy in Keyport borough
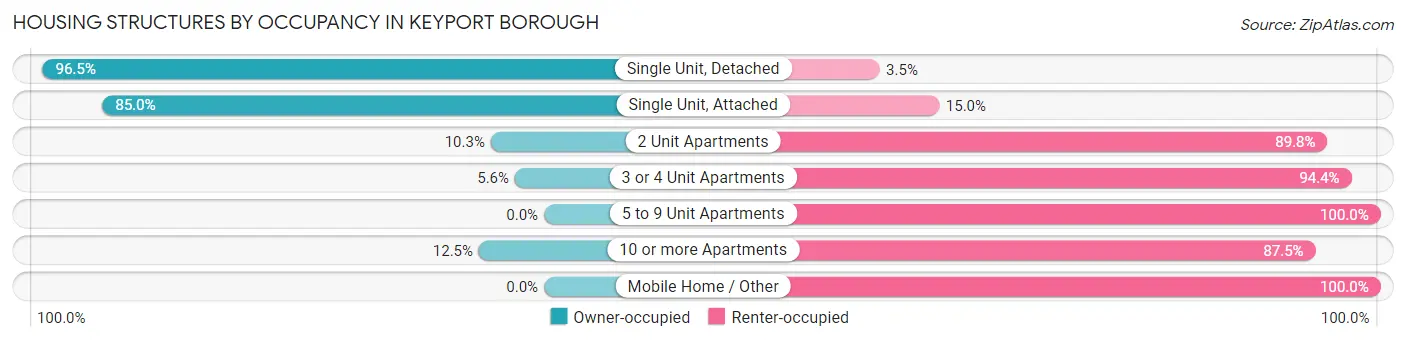
| Structure Type | Owner-occupied | Renter-occupied |
| Single Unit, Detached | 1,506 (96.5%) | 54 (3.5%) |
| Single Unit, Attached | 199 (85.0%) | 35 (15.0%) |
| 2 Unit Apartments | 29 (10.2%) | 254 (89.7%) |
| 3 or 4 Unit Apartments | 12 (5.6%) | 202 (94.4%) |
| 5 to 9 Unit Apartments | 0 (0.0%) | 12 (100.0%) |
| 10 or more Apartments | 132 (12.5%) | 921 (87.5%) |
| Mobile Home / Other | 0 (0.0%) | 8 (100.0%) |
| Total | 1,878 (55.8%) | 1,486 (44.2%) |
Housing Structures by Number of Rooms in Keyport borough
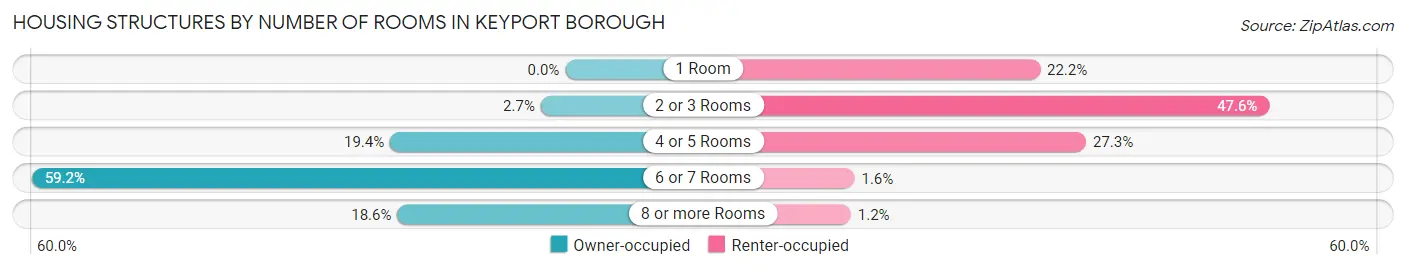
| Number of Rooms | Owner-occupied | Renter-occupied |
| 1 Room | 0 (0.0%) | 330 (22.2%) |
| 2 or 3 Rooms | 51 (2.7%) | 708 (47.6%) |
| 4 or 5 Rooms | 365 (19.4%) | 406 (27.3%) |
| 6 or 7 Rooms | 1,112 (59.2%) | 24 (1.6%) |
| 8 or more Rooms | 350 (18.6%) | 18 (1.2%) |
| Total | 1,878 (100.0%) | 1,486 (100.0%) |
Housing Structure by Heating Type in Keyport borough
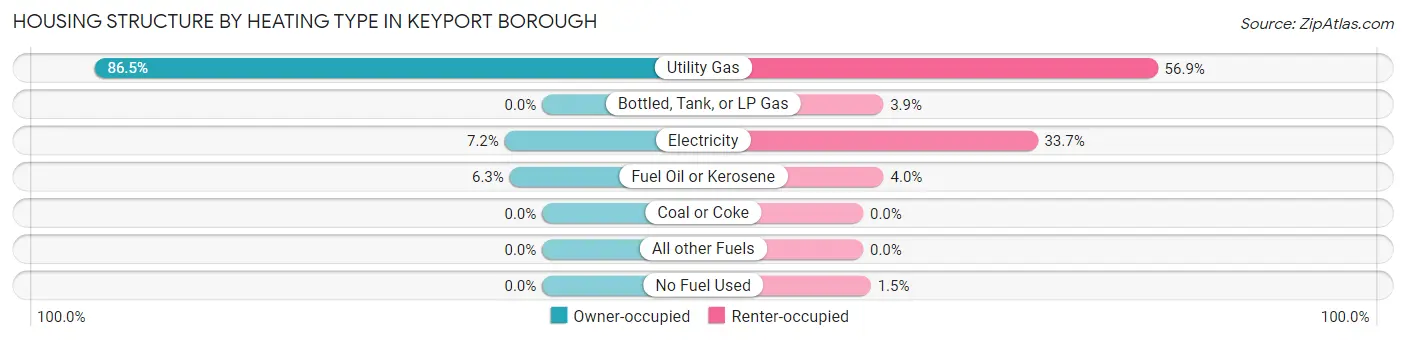
| Heating Type | Owner-occupied | Renter-occupied |
| Utility Gas | 1,624 (86.5%) | 846 (56.9%) |
| Bottled, Tank, or LP Gas | 0 (0.0%) | 58 (3.9%) |
| Electricity | 136 (7.2%) | 501 (33.7%) |
| Fuel Oil or Kerosene | 118 (6.3%) | 59 (4.0%) |
| Coal or Coke | 0 (0.0%) | 0 (0.0%) |
| All other Fuels | 0 (0.0%) | 0 (0.0%) |
| No Fuel Used | 0 (0.0%) | 22 (1.5%) |
| Total | 1,878 (100.0%) | 1,486 (100.0%) |
Household Vehicle Usage in Keyport borough
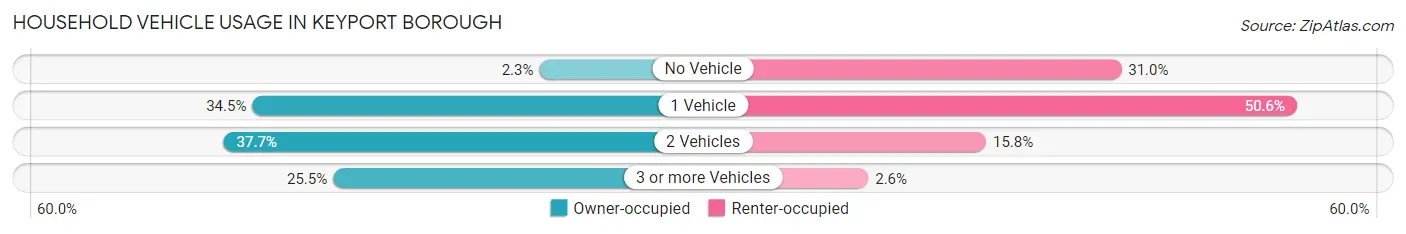
| Vehicles per Household | Owner-occupied | Renter-occupied |
| No Vehicle | 44 (2.3%) | 460 (31.0%) |
| 1 Vehicle | 648 (34.5%) | 752 (50.6%) |
| 2 Vehicles | 708 (37.7%) | 235 (15.8%) |
| 3 or more Vehicles | 478 (25.5%) | 39 (2.6%) |
| Total | 1,878 (100.0%) | 1,486 (100.0%) |
Real Estate & Mortgages in Keyport borough
Real Estate and Mortgage Overview in Keyport borough
| Characteristic | Without Mortgage | With Mortgage |
| Housing Units | 465 | 1,413 |
| Median Property Value | $340,200 | $358,500 |
| Median Household Income | $85,354 | $426 |
| Monthly Housing Costs | $1,156 | $299 |
| Real Estate Taxes | $8,790 | $12 |
Property Value by Mortgage Status in Keyport borough
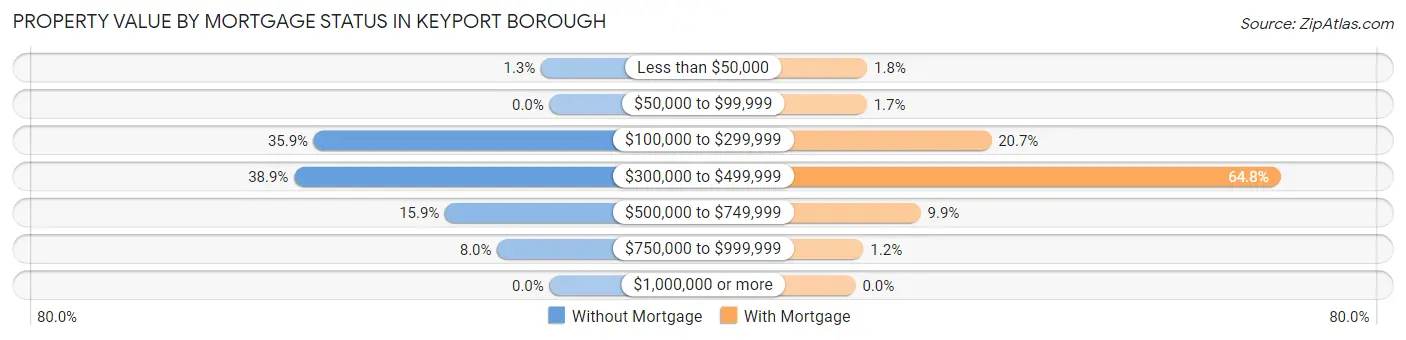
| Property Value | Without Mortgage | With Mortgage |
| Less than $50,000 | 6 (1.3%) | 25 (1.8%) |
| $50,000 to $99,999 | 0 (0.0%) | 24 (1.7%) |
| $100,000 to $299,999 | 167 (35.9%) | 292 (20.7%) |
| $300,000 to $499,999 | 181 (38.9%) | 915 (64.8%) |
| $500,000 to $749,999 | 74 (15.9%) | 140 (9.9%) |
| $750,000 to $999,999 | 37 (8.0%) | 17 (1.2%) |
| $1,000,000 or more | 0 (0.0%) | 0 (0.0%) |
| Total | 465 (100.0%) | 1,413 (100.0%) |
Household Income by Mortgage Status in Keyport borough
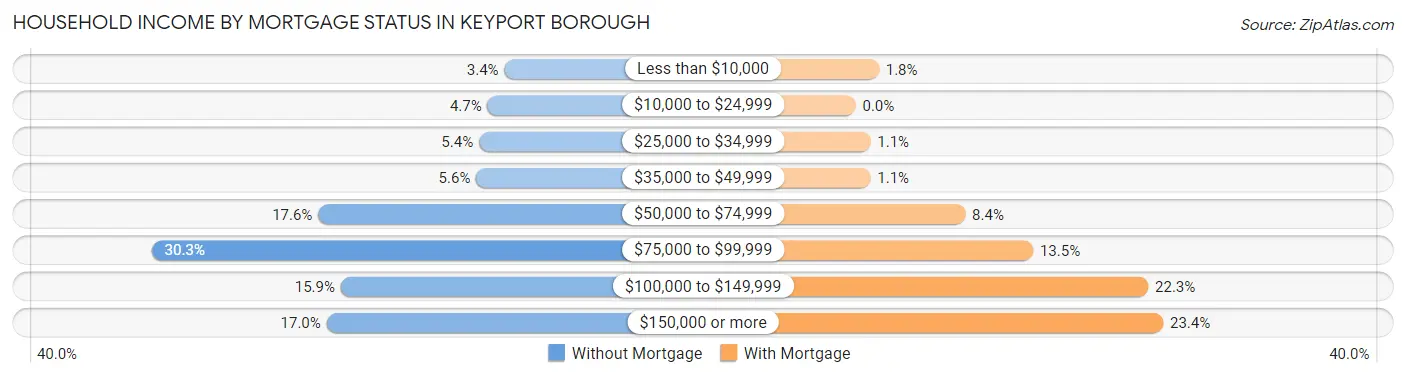
| Household Income | Without Mortgage | With Mortgage |
| Less than $10,000 | 16 (3.4%) | 25 (1.8%) |
| $10,000 to $24,999 | 22 (4.7%) | 0 (0.0%) |
| $25,000 to $34,999 | 25 (5.4%) | 16 (1.1%) |
| $35,000 to $49,999 | 26 (5.6%) | 16 (1.1%) |
| $50,000 to $74,999 | 82 (17.6%) | 118 (8.4%) |
| $75,000 to $99,999 | 141 (30.3%) | 191 (13.5%) |
| $100,000 to $149,999 | 74 (15.9%) | 315 (22.3%) |
| $150,000 or more | 79 (17.0%) | 331 (23.4%) |
| Total | 465 (100.0%) | 1,413 (100.0%) |
Property Value to Household Income Ratio in Keyport borough
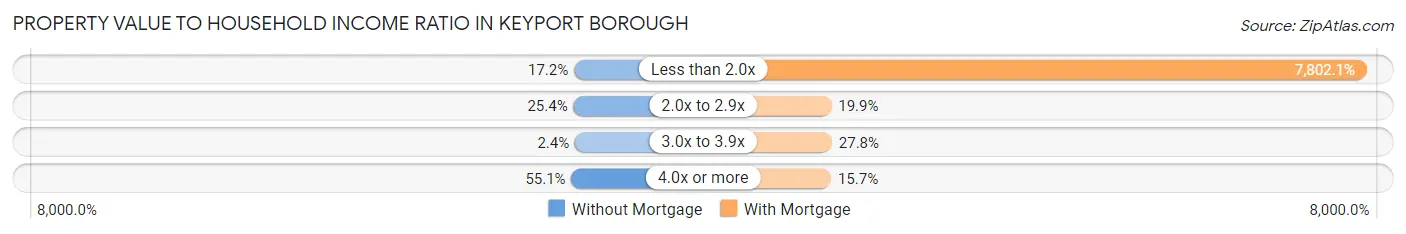
| Value-to-Income Ratio | Without Mortgage | With Mortgage |
| Less than 2.0x | 80 (17.2%) | 110,243 (7,802.0%) |
| 2.0x to 2.9x | 118 (25.4%) | 281 (19.9%) |
| 3.0x to 3.9x | 11 (2.4%) | 393 (27.8%) |
| 4.0x or more | 256 (55.0%) | 222 (15.7%) |
| Total | 465 (100.0%) | 1,413 (100.0%) |
Real Estate Taxes by Mortgage Status in Keyport borough
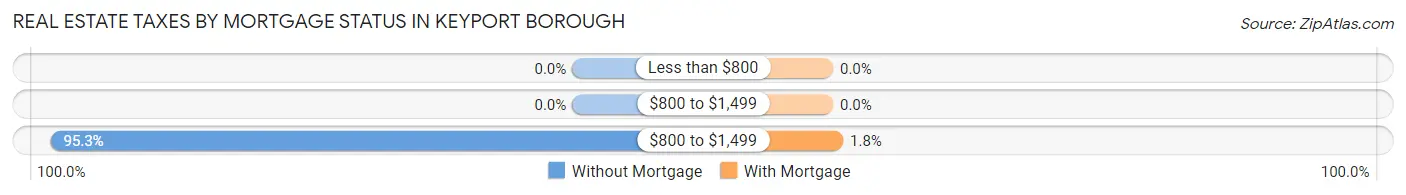
| Property Taxes | Without Mortgage | With Mortgage |
| Less than $800 | 0 (0.0%) | 0 (0.0%) |
| $800 to $1,499 | 0 (0.0%) | 0 (0.0%) |
| $800 to $1,499 | 443 (95.3%) | 26 (1.8%) |
| Total | 465 (100.0%) | 1,413 (100.0%) |
Health & Disability in Keyport borough
Health Insurance Coverage by Age in Keyport borough
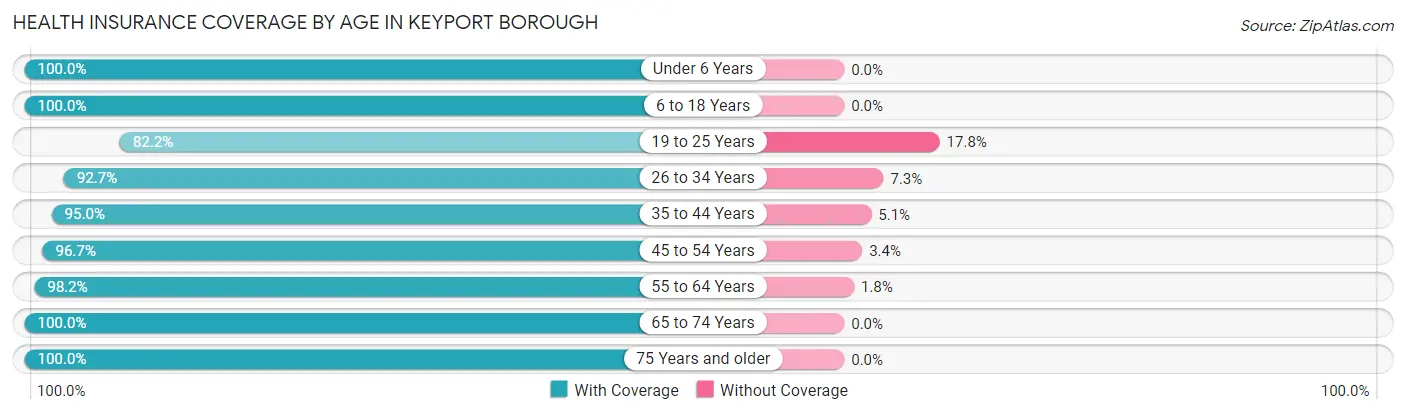
| Age Bracket | With Coverage | Without Coverage |
| Under 6 Years | 626 (100.0%) | 0 (0.0%) |
| 6 to 18 Years | 701 (100.0%) | 0 (0.0%) |
| 19 to 25 Years | 601 (82.2%) | 130 (17.8%) |
| 26 to 34 Years | 672 (92.7%) | 53 (7.3%) |
| 35 to 44 Years | 714 (95.0%) | 38 (5.1%) |
| 45 to 54 Years | 952 (96.7%) | 33 (3.4%) |
| 55 to 64 Years | 1,137 (98.2%) | 21 (1.8%) |
| 65 to 74 Years | 988 (100.0%) | 0 (0.0%) |
| 75 Years and older | 522 (100.0%) | 0 (0.0%) |
| Total | 6,913 (96.2%) | 275 (3.8%) |
Health Insurance Coverage by Citizenship Status in Keyport borough
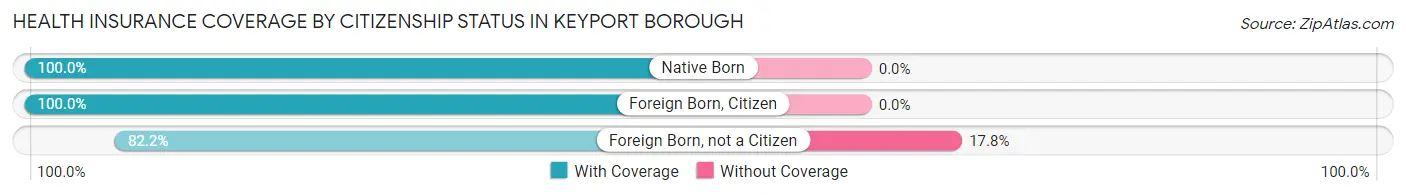
| Citizenship Status | With Coverage | Without Coverage |
| Native Born | 626 (100.0%) | 0 (0.0%) |
| Foreign Born, Citizen | 701 (100.0%) | 0 (0.0%) |
| Foreign Born, not a Citizen | 601 (82.2%) | 130 (17.8%) |
Health Insurance Coverage by Household Income in Keyport borough
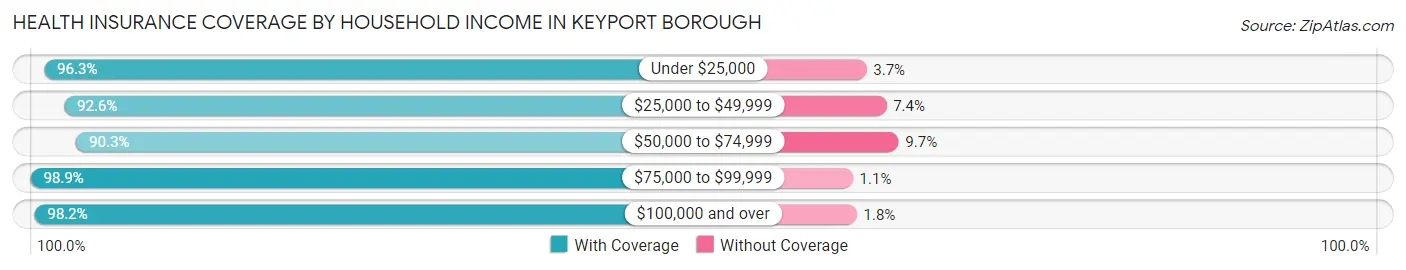
| Household Income | With Coverage | Without Coverage |
| Under $25,000 | 527 (96.3%) | 20 (3.7%) |
| $25,000 to $49,999 | 1,052 (92.6%) | 84 (7.4%) |
| $50,000 to $74,999 | 915 (90.3%) | 98 (9.7%) |
| $75,000 to $99,999 | 1,174 (98.9%) | 13 (1.1%) |
| $100,000 and over | 3,210 (98.2%) | 60 (1.8%) |
Public vs Private Health Insurance Coverage by Age in Keyport borough
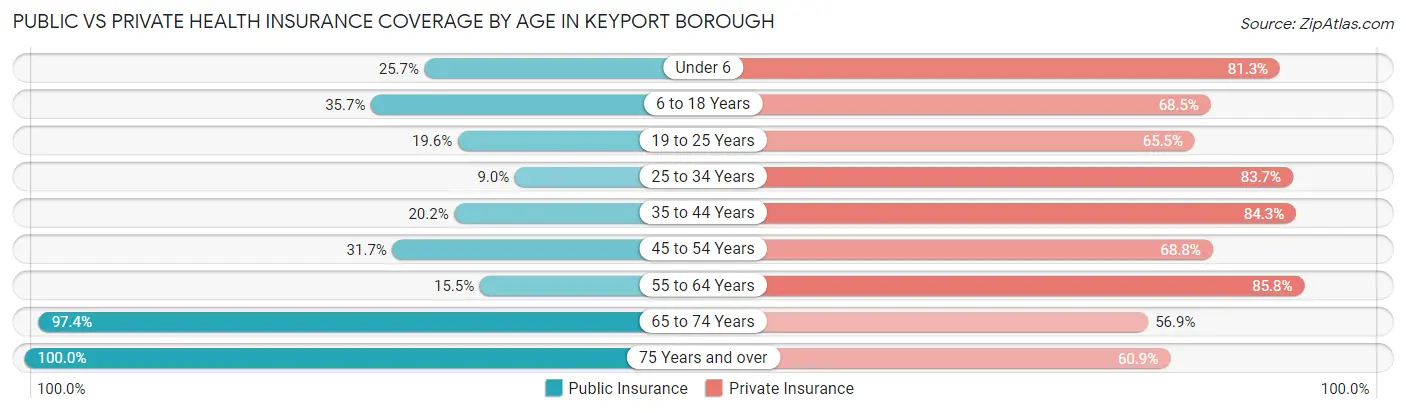
| Age Bracket | Public Insurance | Private Insurance |
| Under 6 | 161 (25.7%) | 509 (81.3%) |
| 6 to 18 Years | 250 (35.7%) | 480 (68.5%) |
| 19 to 25 Years | 143 (19.6%) | 479 (65.5%) |
| 25 to 34 Years | 65 (9.0%) | 607 (83.7%) |
| 35 to 44 Years | 152 (20.2%) | 634 (84.3%) |
| 45 to 54 Years | 312 (31.7%) | 678 (68.8%) |
| 55 to 64 Years | 179 (15.5%) | 994 (85.8%) |
| 65 to 74 Years | 962 (97.4%) | 562 (56.9%) |
| 75 Years and over | 522 (100.0%) | 318 (60.9%) |
| Total | 2,746 (38.2%) | 5,261 (73.2%) |
Disability Status by Sex by Age in Keyport borough
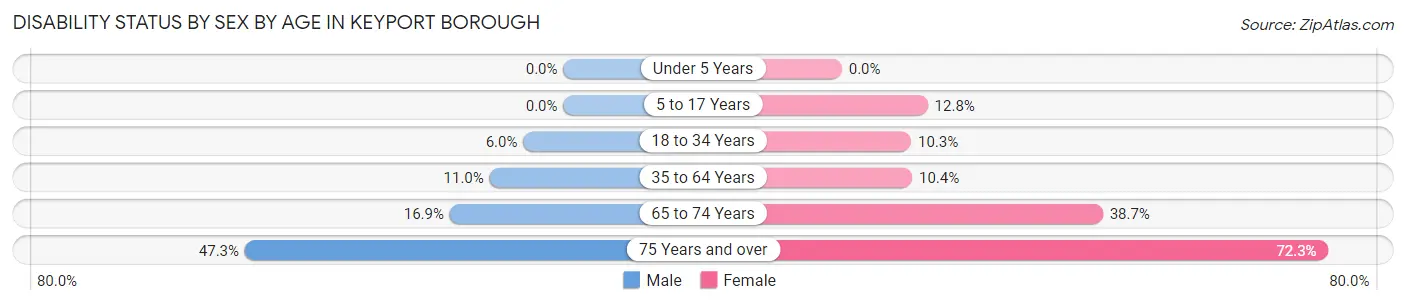
| Age Bracket | Male | Female |
| Under 5 Years | 0 (0.0%) | 0 (0.0%) |
| 5 to 17 Years | 0 (0.0%) | 32 (12.8%) |
| 18 to 34 Years | 42 (5.9%) | 82 (10.3%) |
| 35 to 64 Years | 148 (11.0%) | 161 (10.4%) |
| 65 to 74 Years | 73 (16.9%) | 215 (38.7%) |
| 75 Years and over | 61 (47.3%) | 284 (72.3%) |
Disability Class by Sex by Age in Keyport borough
Disability Class: Hearing Difficulty
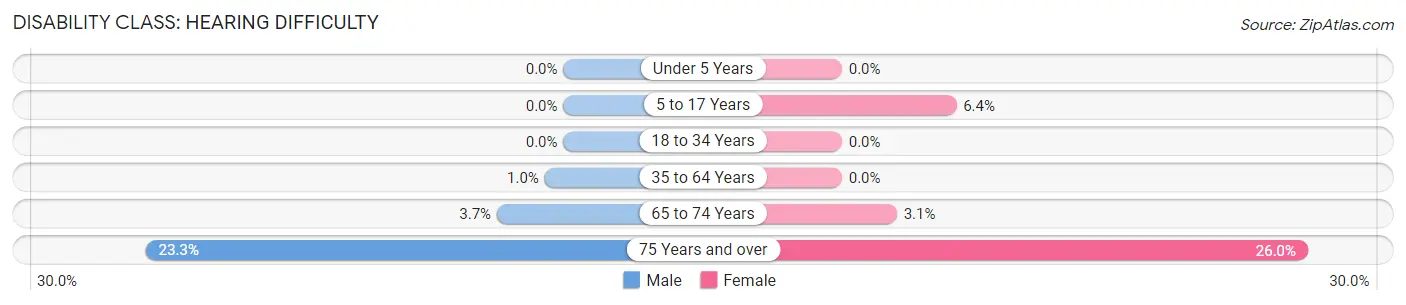
| Age Bracket | Male | Female |
| Under 5 Years | 0 (0.0%) | 0 (0.0%) |
| 5 to 17 Years | 0 (0.0%) | 16 (6.4%) |
| 18 to 34 Years | 0 (0.0%) | 0 (0.0%) |
| 35 to 64 Years | 14 (1.0%) | 0 (0.0%) |
| 65 to 74 Years | 16 (3.7%) | 17 (3.1%) |
| 75 Years and over | 30 (23.3%) | 102 (26.0%) |
Disability Class: Vision Difficulty
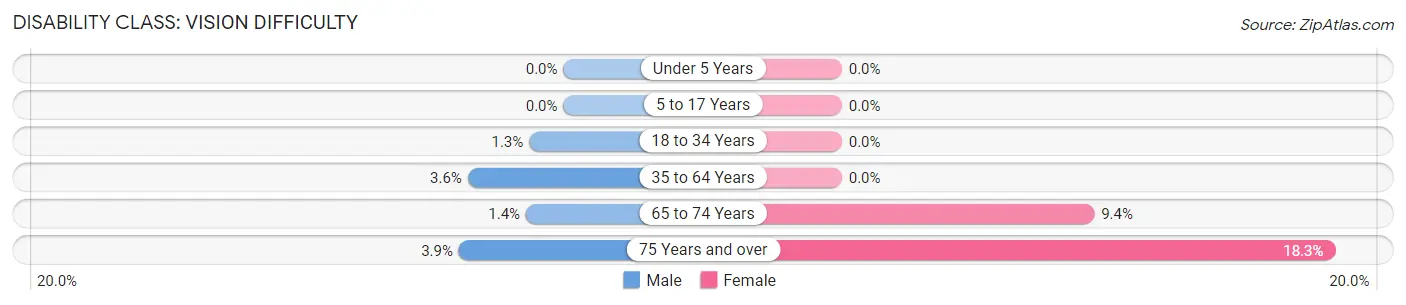
| Age Bracket | Male | Female |
| Under 5 Years | 0 (0.0%) | 0 (0.0%) |
| 5 to 17 Years | 0 (0.0%) | 0 (0.0%) |
| 18 to 34 Years | 9 (1.3%) | 0 (0.0%) |
| 35 to 64 Years | 48 (3.5%) | 0 (0.0%) |
| 65 to 74 Years | 6 (1.4%) | 52 (9.4%) |
| 75 Years and over | 5 (3.9%) | 72 (18.3%) |
Disability Class: Cognitive Difficulty
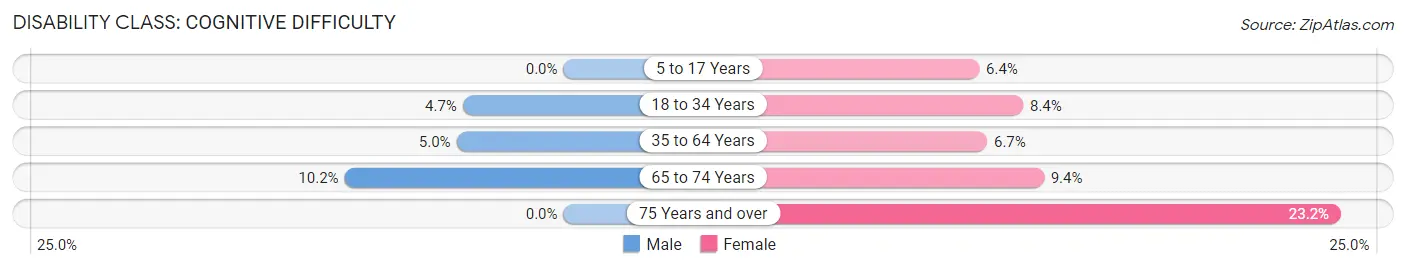
| Age Bracket | Male | Female |
| 5 to 17 Years | 0 (0.0%) | 16 (6.4%) |
| 18 to 34 Years | 33 (4.7%) | 67 (8.4%) |
| 35 to 64 Years | 67 (5.0%) | 104 (6.7%) |
| 65 to 74 Years | 44 (10.2%) | 52 (9.4%) |
| 75 Years and over | 0 (0.0%) | 91 (23.2%) |
Disability Class: Ambulatory Difficulty
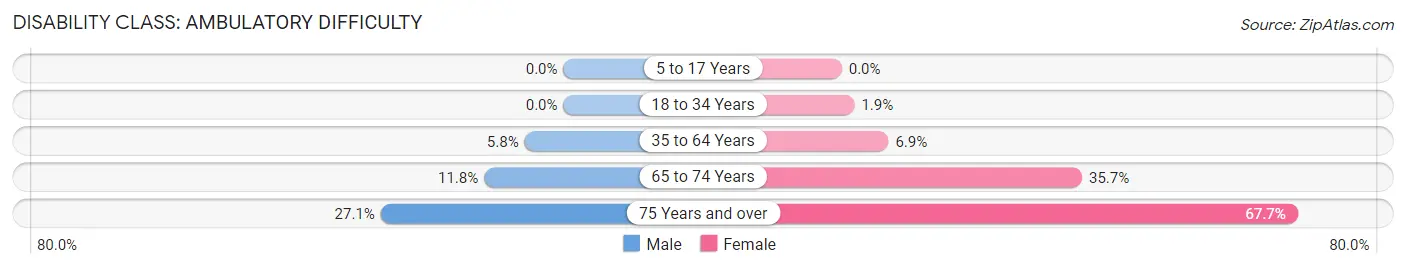
| Age Bracket | Male | Female |
| 5 to 17 Years | 0 (0.0%) | 0 (0.0%) |
| 18 to 34 Years | 0 (0.0%) | 15 (1.9%) |
| 35 to 64 Years | 78 (5.8%) | 107 (6.9%) |
| 65 to 74 Years | 51 (11.8%) | 198 (35.7%) |
| 75 Years and over | 35 (27.1%) | 266 (67.7%) |
Disability Class: Self-Care Difficulty
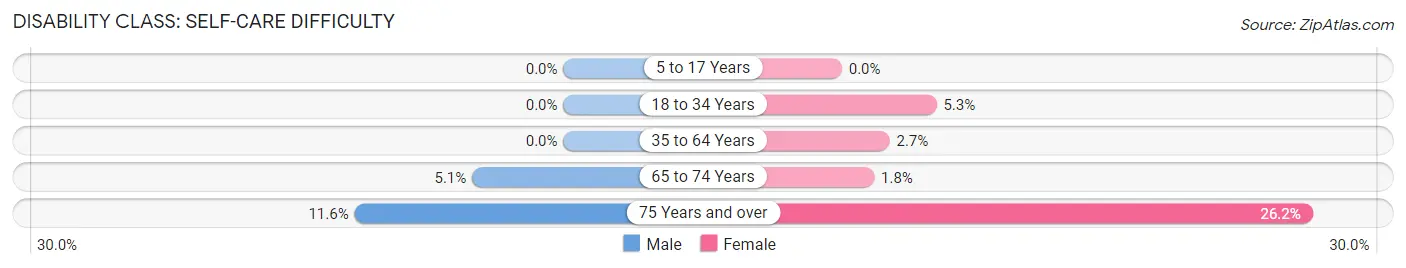
| Age Bracket | Male | Female |
| 5 to 17 Years | 0 (0.0%) | 0 (0.0%) |
| 18 to 34 Years | 0 (0.0%) | 42 (5.3%) |
| 35 to 64 Years | 0 (0.0%) | 41 (2.7%) |
| 65 to 74 Years | 22 (5.1%) | 10 (1.8%) |
| 75 Years and over | 15 (11.6%) | 103 (26.2%) |
Technology Access in Keyport borough
Computing Device Access in Keyport borough
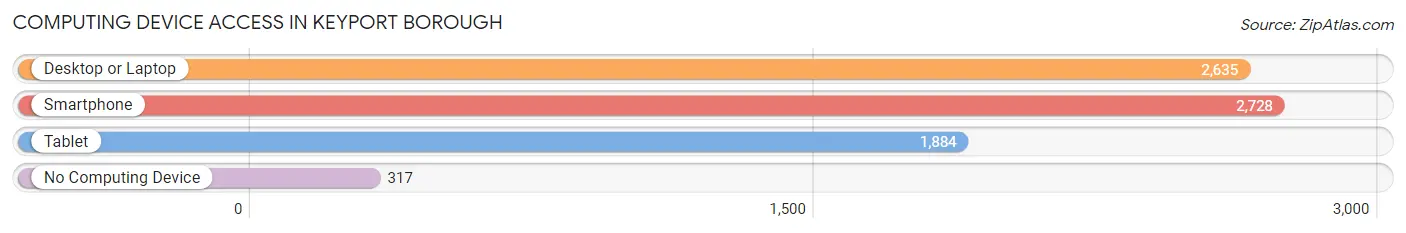
| Device Type | # Households | % Households |
| Desktop or Laptop | 2,635 | 78.3% |
| Smartphone | 2,728 | 81.1% |
| Tablet | 1,884 | 56.0% |
| No Computing Device | 317 | 9.4% |
| Total | 3,364 | 100.0% |
Internet Access in Keyport borough
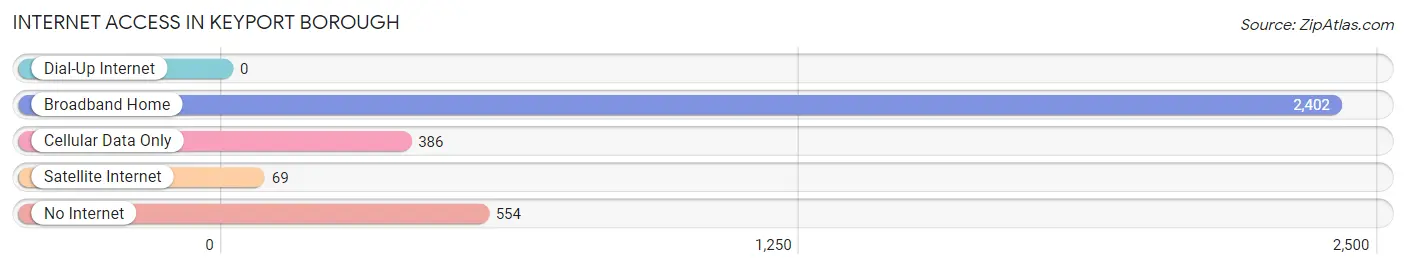
| Internet Type | # Households | % Households |
| Dial-Up Internet | 0 | 0.0% |
| Broadband Home | 2,402 | 71.4% |
| Cellular Data Only | 386 | 11.5% |
| Satellite Internet | 69 | 2.1% |
| No Internet | 554 | 16.5% |
| Total | 3,364 | 100.0% |
Keyport borough Summary
Keyport Borough is a small borough located in Monmouth County, New Jersey. It is situated on the Raritan Bay, and is part of the Bayshore region of the state. The borough is home to a population of approximately 7,000 people, and is a popular destination for tourists and locals alike.
History
Keyport Borough was originally part of the Matawan Township, which was established in 1798. In 1870, the area was incorporated as a separate borough, and was named after the nearby Keyport Harbor. The harbor was named after the Dutch word “Kijper”, which means “key”.
The borough was a popular destination for vacationers in the late 19th and early 20th centuries. It was home to several resorts, including the Keyport Beach Hotel, which was built in 1891. The hotel was destroyed by a fire in 1915, but was rebuilt and reopened in 1916.
The borough was also home to a thriving fishing industry. In the early 20th century, the area was home to several fish canneries, which processed and canned fish for sale. The canneries were eventually closed in the 1950s, due to the decline of the fishing industry.
Geography
Keyport Borough is located in Monmouth County, New Jersey. It is situated on the Raritan Bay, and is part of the Bayshore region of the state. The borough is bordered by Matawan Township to the north, Hazlet Township to the east, Union Beach to the south, and the Raritan Bay to the west.
The borough covers an area of 1.3 square miles, and is home to a population of approximately 7,000 people. The borough is located approximately 25 miles south of New York City, and is easily accessible by car or public transportation.
Economy
Keyport Borough is home to a variety of businesses and industries. The borough is home to several retail stores, restaurants, and other businesses. The borough is also home to several manufacturing companies, including a plastics manufacturer and a metal fabrication company.
The borough is also home to a thriving tourism industry. The borough is home to several popular attractions, including the Keyport Beach Hotel, the Keyport Fishing Pier, and the Keyport Yacht Club. The borough is also home to several marinas, which provide docking and storage for boats.
Demographics
As of the 2010 census, Keyport Borough had a population of 7,240 people. The racial makeup of the borough was 87.3% White, 5.2% African American, 0.3% Native American, 2.2% Asian, and 4.0% from other races. Hispanic or Latino of any race were 8.7% of the population.
The median household income in Keyport Borough was $62,917, and the median family income was $76,917. The per capita income was $30,917. About 5.2% of families and 7.2% of the population were below the poverty line, including 8.7% of those under age 18 and 5.2% of those age 65 or over.
Common Questions
What is Per Capita Income in Keyport borough?
Per Capita income in Keyport borough is $43,755.
What is the Median Family Income in Keyport borough?
Median Family Income in Keyport borough is $104,537.
What is the Median Household income in Keyport borough?
Median Household Income in Keyport borough is $75,709.
What is Income or Wage Gap in Keyport borough?
Income or Wage Gap in Keyport borough is 25.0%.
Women in Keyport borough earn 75.0 cents for every dollar earned by a man.
What is Inequality or Gini Index in Keyport borough?
Inequality or Gini Index in Keyport borough is 0.42.
What is the Total Population of Keyport borough?
Total Population of Keyport borough is 7,188.
What is the Total Male Population of Keyport borough?
Total Male Population of Keyport borough is 3,408.
What is the Total Female Population of Keyport borough?
Total Female Population of Keyport borough is 3,780.
What is the Ratio of Males per 100 Females in Keyport borough?
There are 90.16 Males per 100 Females in Keyport borough.
What is the Ratio of Females per 100 Males in Keyport borough?
There are 110.92 Females per 100 Males in Keyport borough.
What is the Median Population Age in Keyport borough?
Median Population Age in Keyport borough is 46.5 Years.
What is the Average Family Size in Keyport borough
Average Family Size in Keyport borough is 3.1 People.
What is the Average Household Size in Keyport borough
Average Household Size in Keyport borough is 2.1 People.
How Large is the Labor Force in Keyport borough?
There are 3,902 People in the Labor Forcein in Keyport borough.
What is the Percentage of People in the Labor Force in Keyport borough?
64.8% of People are in the Labor Force in Keyport borough.
What is the Unemployment Rate in Keyport borough?
Unemployment Rate in Keyport borough is 10.4%.