Lambertville, NJ Map & Demographics
Lambertville Map
Lambertville Overview
$85,160
PER CAPITA INCOME
$152,024
AVG FAMILY INCOME
$102,482
AVG HOUSEHOLD INCOME
7.5%
WAGE / INCOME GAP [ % ]
92.5¢/ $1
WAGE / INCOME GAP [ $ ]
0.49
INEQUALITY / GINI INDEX
4,127
TOTAL POPULATION
1,969
MALE POPULATION
2,158
FEMALE POPULATION
91.24
MALES / 100 FEMALES
109.60
FEMALES / 100 MALES
54.8
MEDIAN AGE
2.8
AVG FAMILY SIZE
2.0
AVG HOUSEHOLD SIZE
2,710
LABOR FORCE [ PEOPLE ]
73.0%
PERCENT IN LABOR FORCE
5.8%
UNEMPLOYMENT RATE
Lambertville Zip Codes
Lambertville Area Codes
Income in Lambertville
Income Overview in Lambertville
Per Capita Income in Lambertville is $85,160, while median incomes of families and households are $152,024 and $102,482 respectively.
| Characteristic | Number | Measure |
| Per Capita Income | 4,127 | $85,160 |
| Median Family Income | 930 | $152,024 |
| Mean Family Income | 930 | $179,142 |
| Median Household Income | 2,012 | $102,482 |
| Mean Household Income | 2,012 | $176,658 |
| Income Deficit | 930 | $0 |
| Wage / Income Gap (%) | 4,127 | 7.53% |
| Wage / Income Gap ($) | 4,127 | 92.47¢ per $1 |
| Gini / Inequality Index | 4,127 | 0.49 |
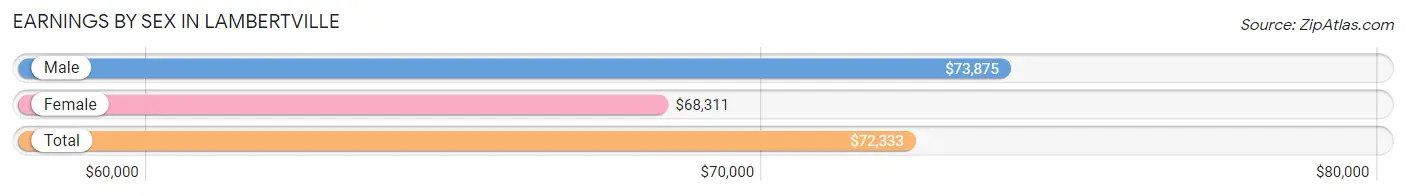
Earnings by Sex in Lambertville
Average Earnings in Lambertville are $72,333, $73,875 for men and $68,311 for women, a difference of 7.5%.
| Sex | Number | Average Earnings |
| Male | 1,357 (49.7%) | $73,875 |
| Female | 1,372 (50.3%) | $68,311 |
| Total | 2,729 (100.0%) | $72,333 |
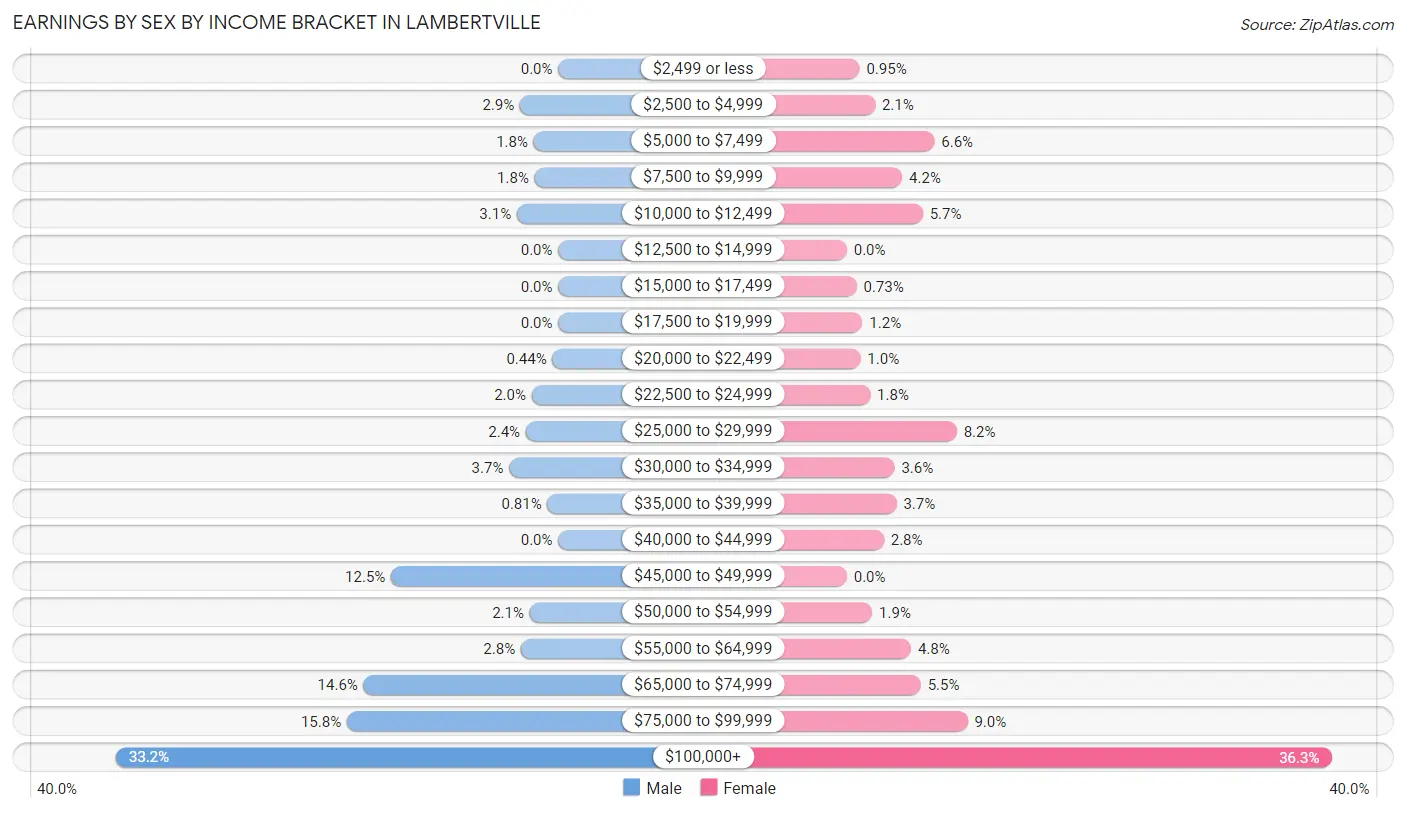
Earnings by Sex by Income Bracket in Lambertville
The most common earnings brackets in Lambertville are $100,000+ for men (450 | 33.2%) and $100,000+ for women (498 | 36.3%).
| Income | Male | Female |
| $2,499 or less | 0 (0.0%) | 13 (0.9%) |
| $2,500 to $4,999 | 39 (2.9%) | 29 (2.1%) |
| $5,000 to $7,499 | 25 (1.8%) | 90 (6.6%) |
| $7,500 to $9,999 | 24 (1.8%) | 57 (4.2%) |
| $10,000 to $12,499 | 42 (3.1%) | 78 (5.7%) |
| $12,500 to $14,999 | 0 (0.0%) | 0 (0.0%) |
| $15,000 to $17,499 | 0 (0.0%) | 10 (0.7%) |
| $17,500 to $19,999 | 0 (0.0%) | 16 (1.2%) |
| $20,000 to $22,499 | 6 (0.4%) | 14 (1.0%) |
| $22,500 to $24,999 | 27 (2.0%) | 24 (1.8%) |
| $25,000 to $29,999 | 33 (2.4%) | 113 (8.2%) |
| $30,000 to $34,999 | 50 (3.7%) | 49 (3.6%) |
| $35,000 to $39,999 | 11 (0.8%) | 51 (3.7%) |
| $40,000 to $44,999 | 0 (0.0%) | 38 (2.8%) |
| $45,000 to $49,999 | 170 (12.5%) | 0 (0.0%) |
| $50,000 to $54,999 | 29 (2.1%) | 26 (1.9%) |
| $55,000 to $64,999 | 38 (2.8%) | 66 (4.8%) |
| $65,000 to $74,999 | 198 (14.6%) | 76 (5.5%) |
| $75,000 to $99,999 | 215 (15.8%) | 124 (9.0%) |
| $100,000+ | 450 (33.2%) | 498 (36.3%) |
| Total | 1,357 (100.0%) | 1,372 (100.0%) |
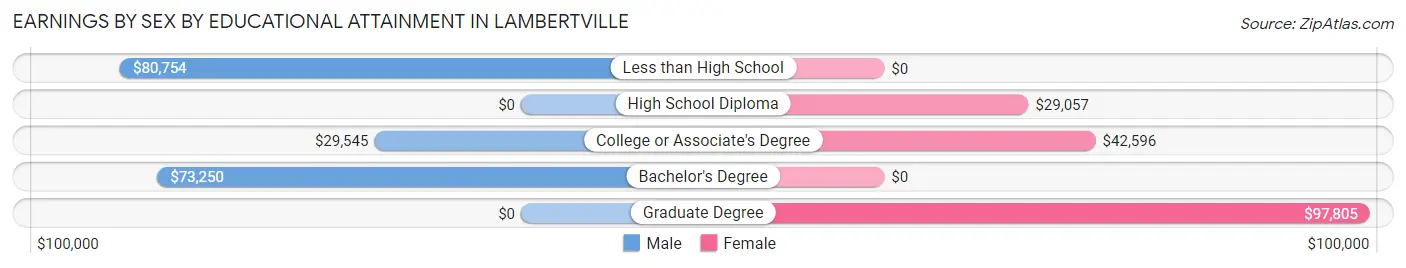
Earnings by Sex by Educational Attainment in Lambertville
Average earnings in Lambertville are $80,246 for men and $75,259 for women, a difference of 6.2%. Men with an educational attainment of less than high school enjoy the highest average annual earnings of $80,754, while those with college or associate's degree education earn the least with $29,545. Women with an educational attainment of graduate degree earn the most with the average annual earnings of $97,805, while those with high school diploma education have the smallest earnings of $29,057.
| Educational Attainment | Male Income | Female Income |
| Less than High School | $80,754 | $0 |
| High School Diploma | - | - |
| College or Associate's Degree | $29,545 | $42,596 |
| Bachelor's Degree | $73,250 | $0 |
| Graduate Degree | - | - |
| Total | $80,246 | $75,259 |
Family Income in Lambertville
Family Income Brackets in Lambertville
According to the Lambertville family income data, there are 248 families falling into the $150,000 to $199,999 income range, which is the most common income bracket and makes up 26.7% of all families.
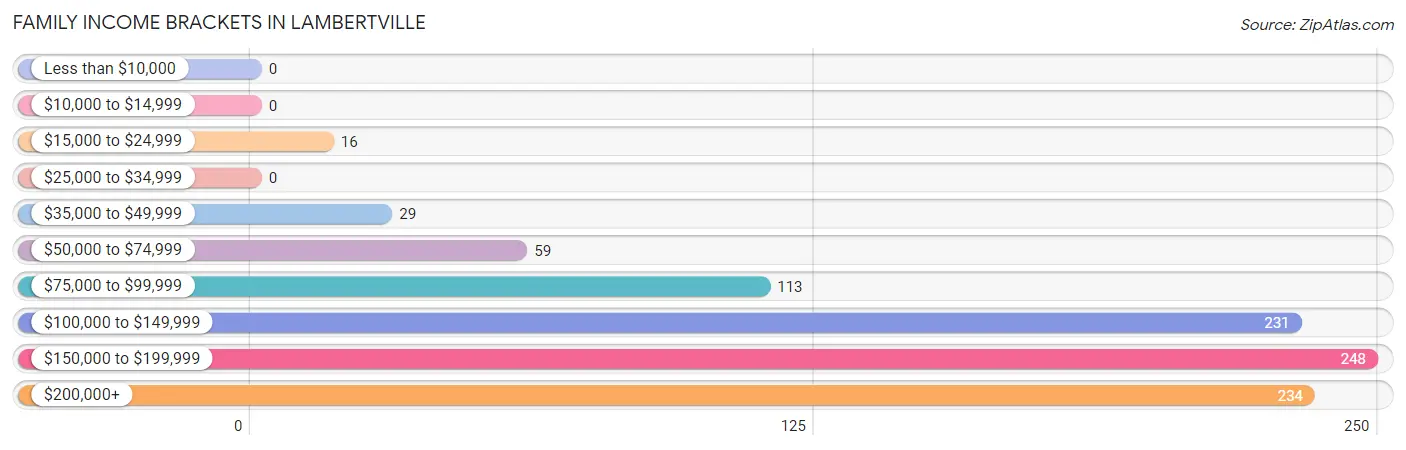
| Income Bracket | # Families | % Families |
| Less than $10,000 | 0 | 0.0% |
| $10,000 to $14,999 | 0 | 0.0% |
| $15,000 to $24,999 | 16 | 1.7% |
| $25,000 to $34,999 | 0 | 0.0% |
| $35,000 to $49,999 | 29 | 3.1% |
| $50,000 to $74,999 | 59 | 6.3% |
| $75,000 to $99,999 | 113 | 12.2% |
| $100,000 to $149,999 | 231 | 24.8% |
| $150,000 to $199,999 | 248 | 26.7% |
| $200,000+ | 234 | 25.2% |
Family Income by Famaliy Size in Lambertville
3-person families (118 | 12.7%) account for the highest median family income in Lambertville with $243,382 per family, while 3-person families (118 | 12.7%) have the highest median income of $81,127 per family member.
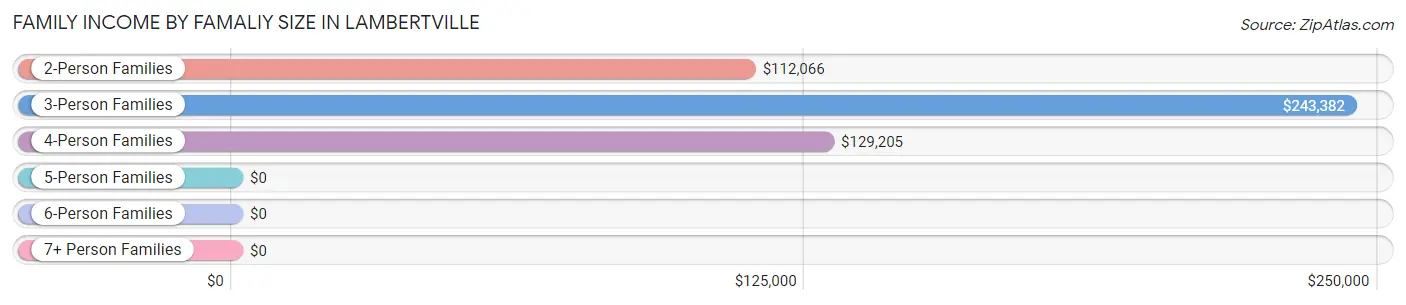
| Income Bracket | # Families | Median Income |
| 2-Person Families | 599 (64.4%) | $112,066 |
| 3-Person Families | 118 (12.7%) | $243,382 |
| 4-Person Families | 213 (22.9%) | $129,205 |
| 5-Person Families | 0 (0.0%) | $0 |
| 6-Person Families | 0 (0.0%) | $0 |
| 7+ Person Families | 0 (0.0%) | $0 |
| Total | 930 (100.0%) | $152,024 |
Family Income by Number of Earners in Lambertville
The median family income in Lambertville is $152,024, with families comprising 2 earners (419) having the highest median family income of $189,688, while families with no earners (109) have the lowest median family income of $100,912, accounting for 45.1% and 11.7% of families, respectively.
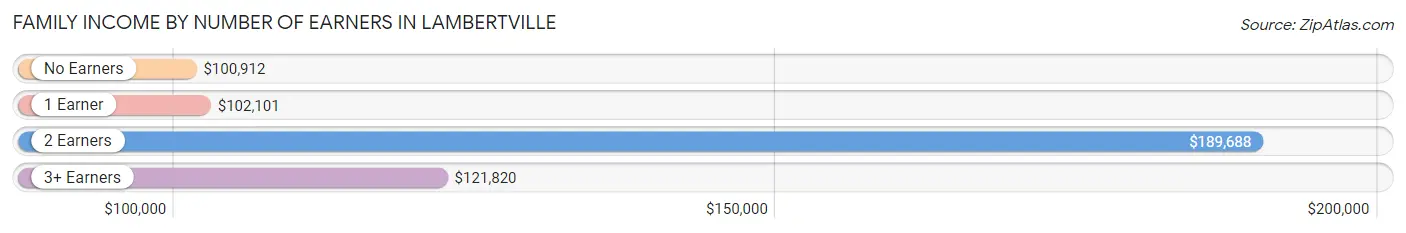
| Number of Earners | # Families | Median Income |
| No Earners | 109 (11.7%) | $100,912 |
| 1 Earner | 247 (26.6%) | $102,101 |
| 2 Earners | 419 (45.1%) | $189,688 |
| 3+ Earners | 155 (16.7%) | $121,820 |
| Total | 930 (100.0%) | $152,024 |
Household Income in Lambertville
Household Income Brackets in Lambertville
With 515 households falling in the category, the $200,000+ income range is the most frequent in Lambertville, accounting for 25.6% of all households. In contrast, only 28 households (1.4%) fall into the less than $10,000 income bracket, making it the least populous group.
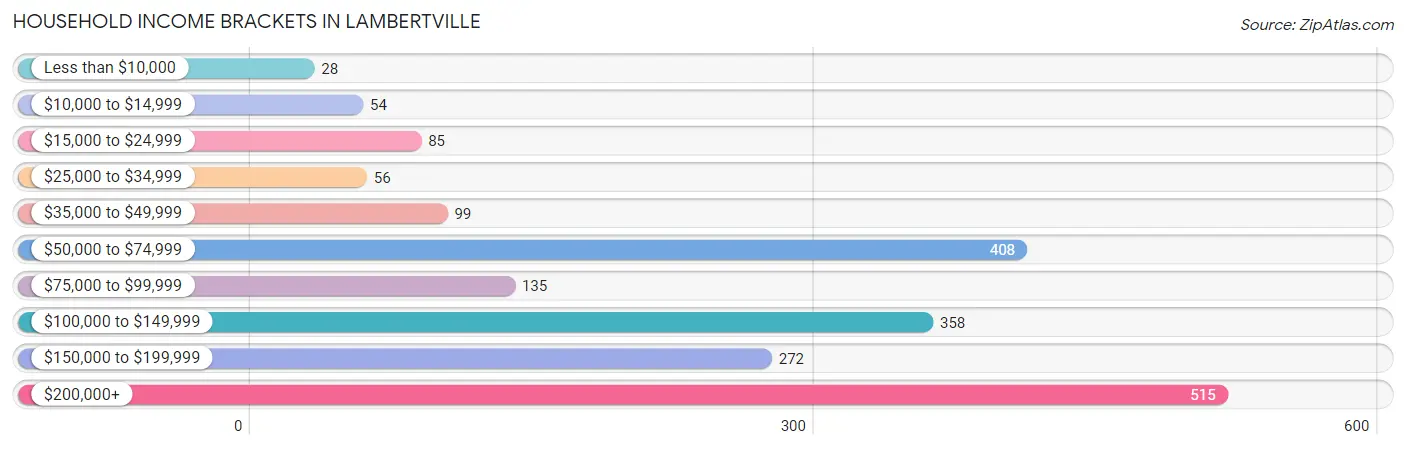
| Income Bracket | # Households | % Households |
| Less than $10,000 | 28 | 1.4% |
| $10,000 to $14,999 | 54 | 2.7% |
| $15,000 to $24,999 | 85 | 4.2% |
| $25,000 to $34,999 | 56 | 2.8% |
| $35,000 to $49,999 | 99 | 4.9% |
| $50,000 to $74,999 | 408 | 20.3% |
| $75,000 to $99,999 | 135 | 6.7% |
| $100,000 to $149,999 | 358 | 17.8% |
| $150,000 to $199,999 | 272 | 13.5% |
| $200,000+ | 515 | 25.6% |
Household Income by Householder Age in Lambertville
The median household income in Lambertville is $102,482, with the highest median household income of $156,346 found in the 45 to 64 years age bracket for the primary householder. A total of 894 households (44.4%) fall into this category.
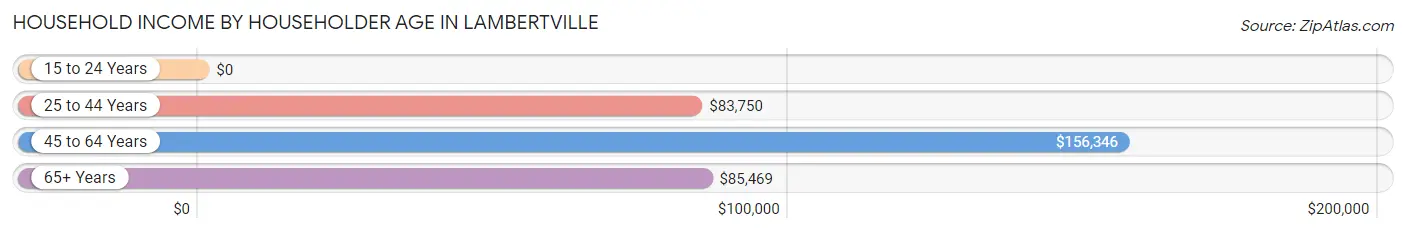
| Income Bracket | # Households | Median Income |
| 15 to 24 Years | 0 (0.0%) | $0 |
| 25 to 44 Years | 488 (24.2%) | $83,750 |
| 45 to 64 Years | 894 (44.4%) | $156,346 |
| 65+ Years | 630 (31.3%) | $85,469 |
| Total | 2,012 (100.0%) | $102,482 |
Poverty in Lambertville
Income Below Poverty by Sex and Age in Lambertville
With 4.2% poverty level for males and 3.1% for females among the residents of Lambertville, 18 to 24 year old males and 35 to 44 year old females are the most vulnerable to poverty, with 45 males (84.9%) and 36 females (12.0%) in their respective age groups living below the poverty level.
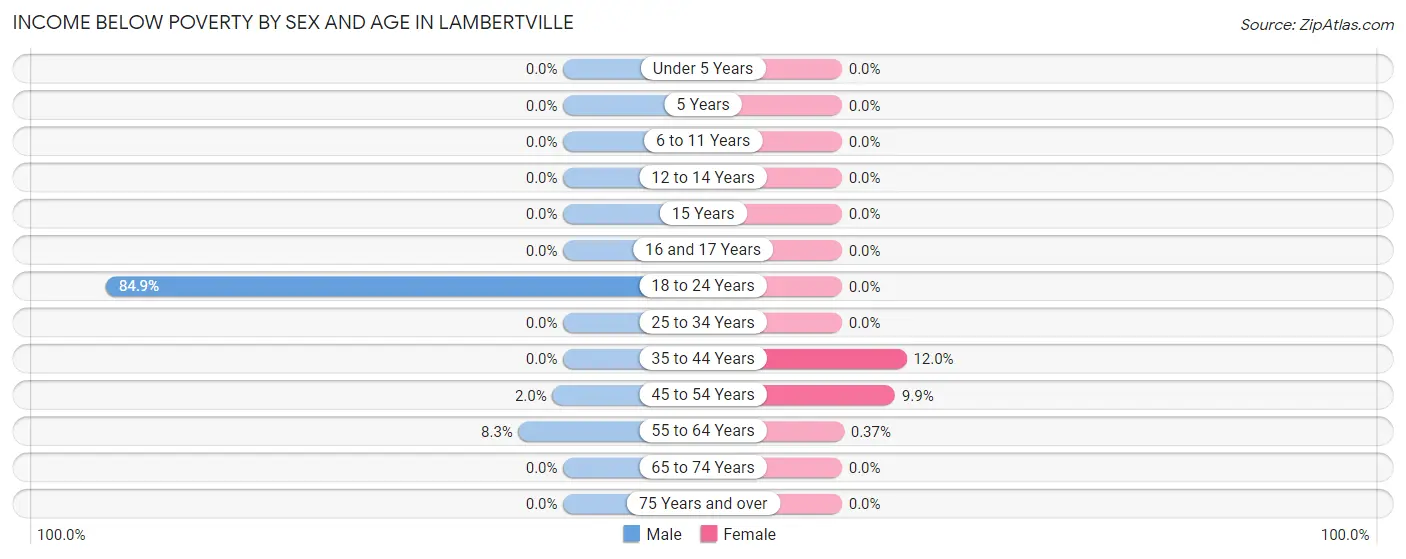
| Age Bracket | Male | Female |
| Under 5 Years | 0 (0.0%) | 0 (0.0%) |
| 5 Years | 0 (0.0%) | 0 (0.0%) |
| 6 to 11 Years | 0 (0.0%) | 0 (0.0%) |
| 12 to 14 Years | 0 (0.0%) | 0 (0.0%) |
| 15 Years | 0 (0.0%) | 0 (0.0%) |
| 16 and 17 Years | 0 (0.0%) | 0 (0.0%) |
| 18 to 24 Years | 45 (84.9%) | 0 (0.0%) |
| 25 to 34 Years | 0 (0.0%) | 0 (0.0%) |
| 35 to 44 Years | 0 (0.0%) | 36 (12.0%) |
| 45 to 54 Years | 4 (2.0%) | 29 (9.9%) |
| 55 to 64 Years | 34 (8.3%) | 2 (0.4%) |
| 65 to 74 Years | 0 (0.0%) | 0 (0.0%) |
| 75 Years and over | 0 (0.0%) | 0 (0.0%) |
| Total | 83 (4.2%) | 67 (3.1%) |
Income Above Poverty by Sex and Age in Lambertville
According to the poverty statistics in Lambertville, males aged under 5 years and females aged under 5 years are the age groups that are most secure financially, with 100.0% of males and 100.0% of females in these age groups living above the poverty line.
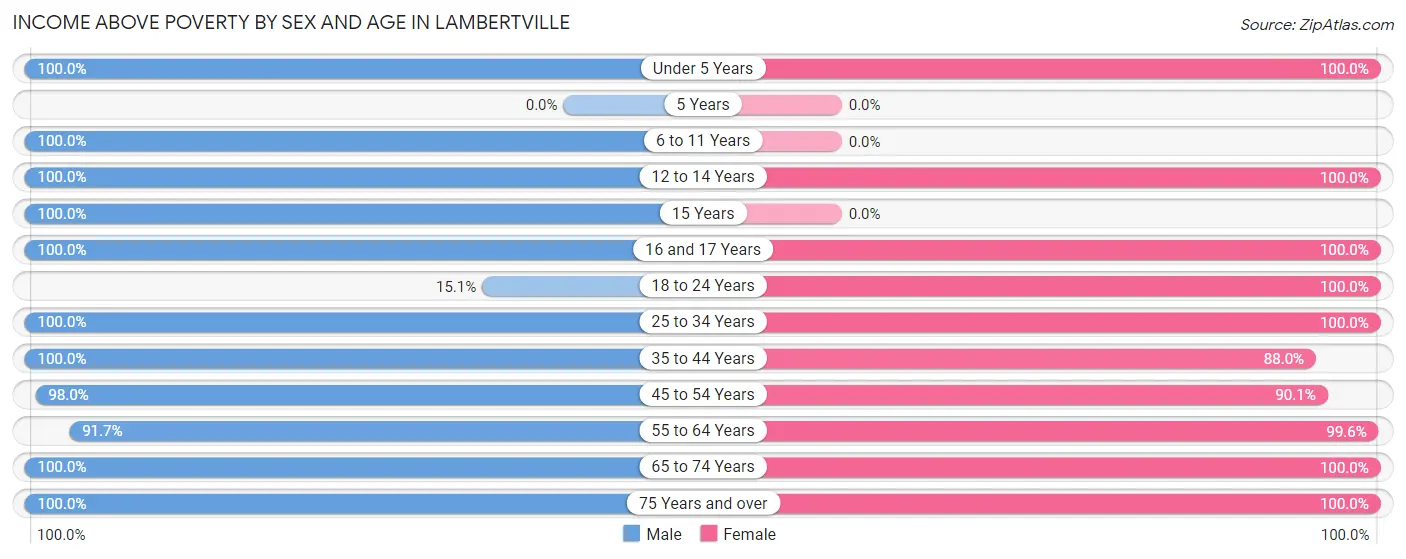
| Age Bracket | Male | Female |
| Under 5 Years | 37 (100.0%) | 153 (100.0%) |
| 5 Years | 0 (0.0%) | 0 (0.0%) |
| 6 to 11 Years | 71 (100.0%) | 0 (0.0%) |
| 12 to 14 Years | 52 (100.0%) | 62 (100.0%) |
| 15 Years | 29 (100.0%) | 0 (0.0%) |
| 16 and 17 Years | 44 (100.0%) | 93 (100.0%) |
| 18 to 24 Years | 8 (15.1%) | 87 (100.0%) |
| 25 to 34 Years | 284 (100.0%) | 143 (100.0%) |
| 35 to 44 Years | 160 (100.0%) | 264 (88.0%) |
| 45 to 54 Years | 195 (98.0%) | 265 (90.1%) |
| 55 to 64 Years | 376 (91.7%) | 538 (99.6%) |
| 65 to 74 Years | 585 (100.0%) | 302 (100.0%) |
| 75 Years and over | 35 (100.0%) | 184 (100.0%) |
| Total | 1,876 (95.8%) | 2,091 (96.9%) |
Income Below Poverty Among Married-Couple Families in Lambertville
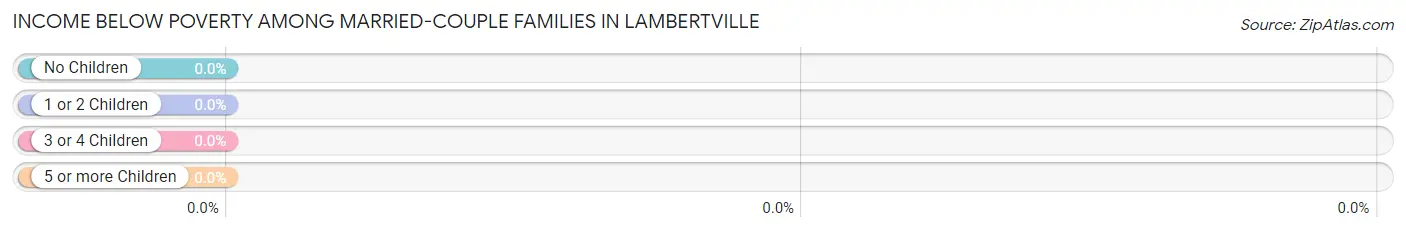
| Children | Above Poverty | Below Poverty |
| No Children | 576 (100.0%) | 0 (0.0%) |
| 1 or 2 Children | 241 (100.0%) | 0 (0.0%) |
| 3 or 4 Children | 0 (0.0%) | 0 (0.0%) |
| 5 or more Children | 0 (0.0%) | 0 (0.0%) |
| Total | 817 (100.0%) | 0 (0.0%) |
Income Below Poverty Among Single-Parent Households in Lambertville
| Children | Single Father | Single Mother |
| No Children | 0 (0.0%) | 0 (0.0%) |
| 1 or 2 Children | 0 (0.0%) | 0 (0.0%) |
| 3 or 4 Children | 0 (0.0%) | 0 (0.0%) |
| 5 or more Children | 0 (0.0%) | 0 (0.0%) |
| Total | 0 (0.0%) | 0 (0.0%) |
Income Below Poverty Among Married-Couple vs Single-Parent Households in Lambertville
| Children | Married-Couple Families | Single-Parent Households |
| No Children | 0 (0.0%) | 0 (0.0%) |
| 1 or 2 Children | 0 (0.0%) | 0 (0.0%) |
| 3 or 4 Children | 0 (0.0%) | 0 (0.0%) |
| 5 or more Children | 0 (0.0%) | 0 (0.0%) |
| Total | 0 (0.0%) | 0 (0.0%) |
Race in Lambertville
The most populous races in Lambertville are White / Caucasian (3,720 | 90.1%), Hispanic or Latino (571 | 13.8%), and Two or more Races (238 | 5.8%).
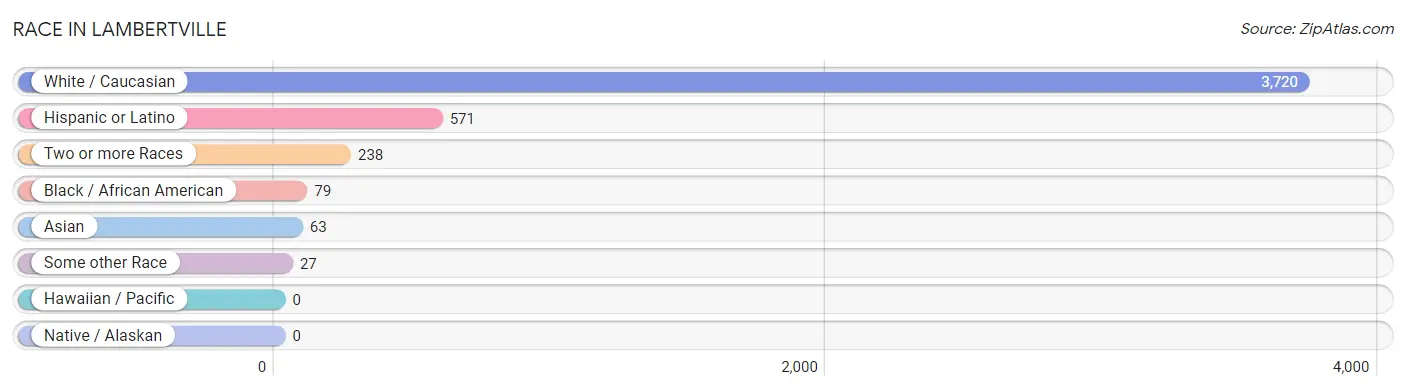
| Race | # Population | % Population |
| Asian | 63 | 1.5% |
| Black / African American | 79 | 1.9% |
| Hawaiian / Pacific | 0 | 0.0% |
| Hispanic or Latino | 571 | 13.8% |
| Native / Alaskan | 0 | 0.0% |
| White / Caucasian | 3,720 | 90.1% |
| Two or more Races | 238 | 5.8% |
| Some other Race | 27 | 0.6% |
| Total | 4,127 | 100.0% |
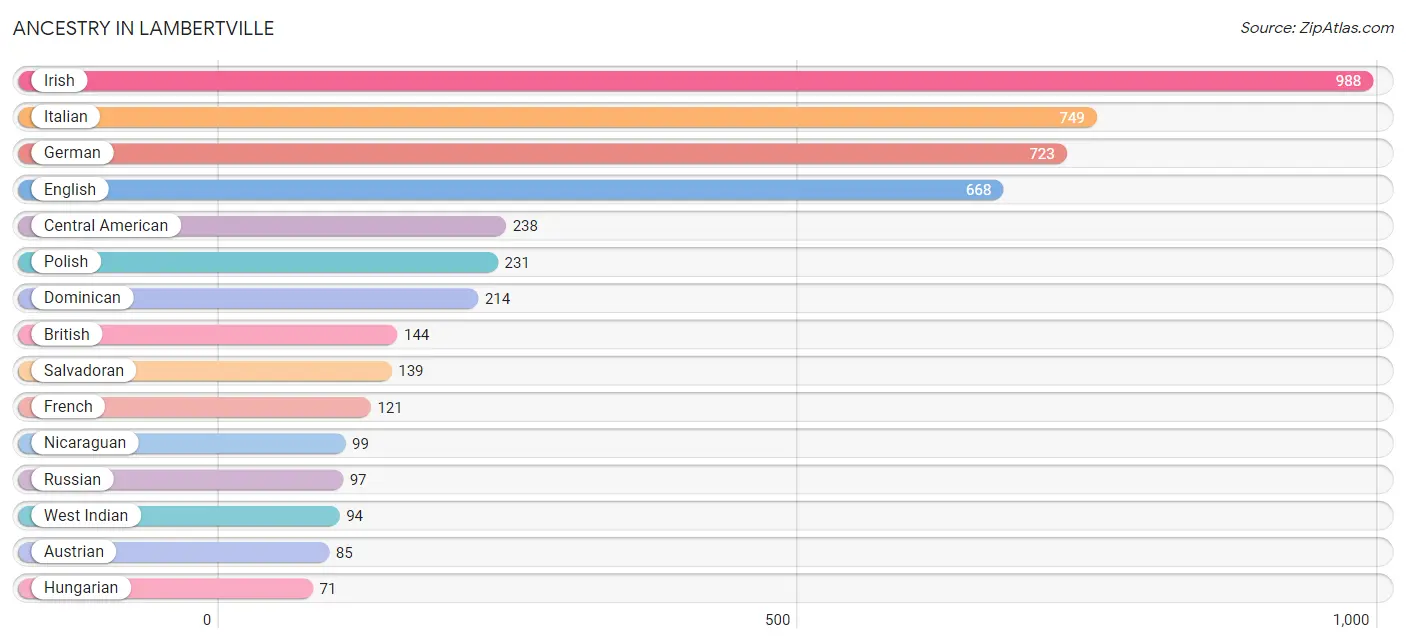
Ancestry in Lambertville
The most populous ancestries reported in Lambertville are Irish (988 | 23.9%), Italian (749 | 18.1%), German (723 | 17.5%), English (668 | 16.2%), and Central American (238 | 5.8%), together accounting for 81.6% of all Lambertville residents.
| Ancestry | # Population | % Population |
| American | 42 | 1.0% |
| Arab | 44 | 1.1% |
| Armenian | 17 | 0.4% |
| Austrian | 85 | 2.1% |
| Belgian | 12 | 0.3% |
| British | 144 | 3.5% |
| Central American | 238 | 5.8% |
| Croatian | 11 | 0.3% |
| Cuban | 50 | 1.2% |
| Czech | 15 | 0.4% |
| Czechoslovakian | 11 | 0.3% |
| Dominican | 214 | 5.2% |
| Dutch | 56 | 1.4% |
| Eastern European | 8 | 0.2% |
| English | 668 | 16.2% |
| European | 31 | 0.7% |
| Finnish | 2 | 0.1% |
| French | 121 | 2.9% |
| German | 723 | 17.5% |
| Ghanaian | 18 | 0.4% |
| Greek | 20 | 0.5% |
| Hungarian | 71 | 1.7% |
| Indian (Asian) | 70 | 1.7% |
| Irish | 988 | 23.9% |
| Italian | 749 | 18.1% |
| Latvian | 10 | 0.2% |
| Lebanese | 10 | 0.2% |
| Lithuanian | 17 | 0.4% |
| Nicaraguan | 99 | 2.4% |
| Northern European | 28 | 0.7% |
| Polish | 231 | 5.6% |
| Puerto Rican | 69 | 1.7% |
| Russian | 97 | 2.4% |
| Salvadoran | 139 | 3.4% |
| Scotch-Irish | 14 | 0.3% |
| Scottish | 56 | 1.4% |
| Slavic | 9 | 0.2% |
| Slovak | 14 | 0.3% |
| Slovene | 58 | 1.4% |
| South African | 17 | 0.4% |
| Subsaharan African | 35 | 0.9% |
| Swiss | 29 | 0.7% |
| Syrian | 34 | 0.8% |
| Turkish | 34 | 0.8% |
| Ukrainian | 60 | 1.5% |
| Welsh | 45 | 1.1% |
| West Indian | 94 | 2.3% | View All 47 Rows |
Immigrants in Lambertville
The most numerous immigrant groups reported in Lambertville came from Latin America (231 | 5.6%), Caribbean (136 | 3.3%), Europe (134 | 3.3%), Dominican Republic (120 | 2.9%), and England (102 | 2.5%), together accounting for 17.5% of all Lambertville residents.
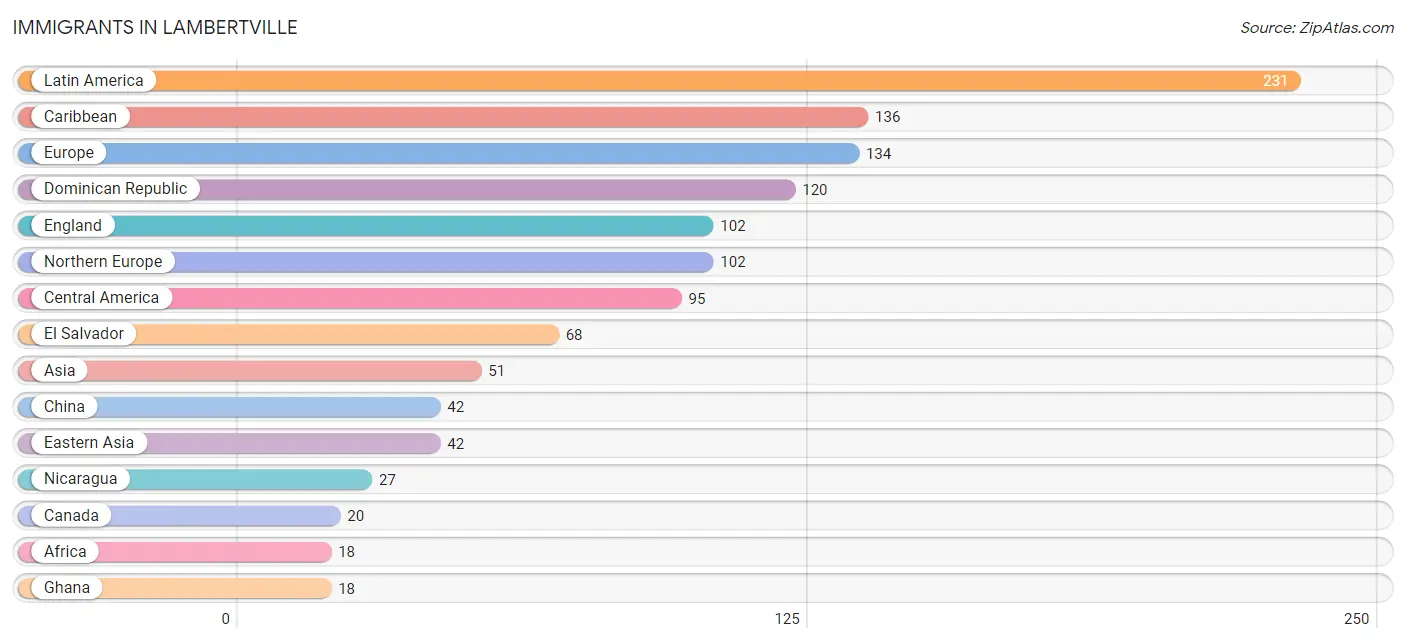
| Immigration Origin | # Population | % Population |
| Africa | 18 | 0.4% |
| Asia | 51 | 1.2% |
| Canada | 20 | 0.5% |
| Caribbean | 136 | 3.3% |
| Central America | 95 | 2.3% |
| China | 42 | 1.0% |
| Cuba | 16 | 0.4% |
| Dominican Republic | 120 | 2.9% |
| Eastern Asia | 42 | 1.0% |
| El Salvador | 68 | 1.7% |
| England | 102 | 2.5% |
| Europe | 134 | 3.3% |
| Ghana | 18 | 0.4% |
| Italy | 18 | 0.4% |
| Latin America | 231 | 5.6% |
| Netherlands | 14 | 0.3% |
| Nicaragua | 27 | 0.6% |
| Northern Europe | 102 | 2.5% |
| Singapore | 9 | 0.2% |
| South Eastern Asia | 9 | 0.2% |
| Southern Europe | 18 | 0.4% |
| Western Africa | 18 | 0.4% |
| Western Europe | 14 | 0.3% | View All 23 Rows |
Sex and Age in Lambertville
Sex and Age in Lambertville
The most populous age groups in Lambertville are 70 to 74 Years (346 | 17.6%) for men and 60 to 64 Years (376 | 17.4%) for women.
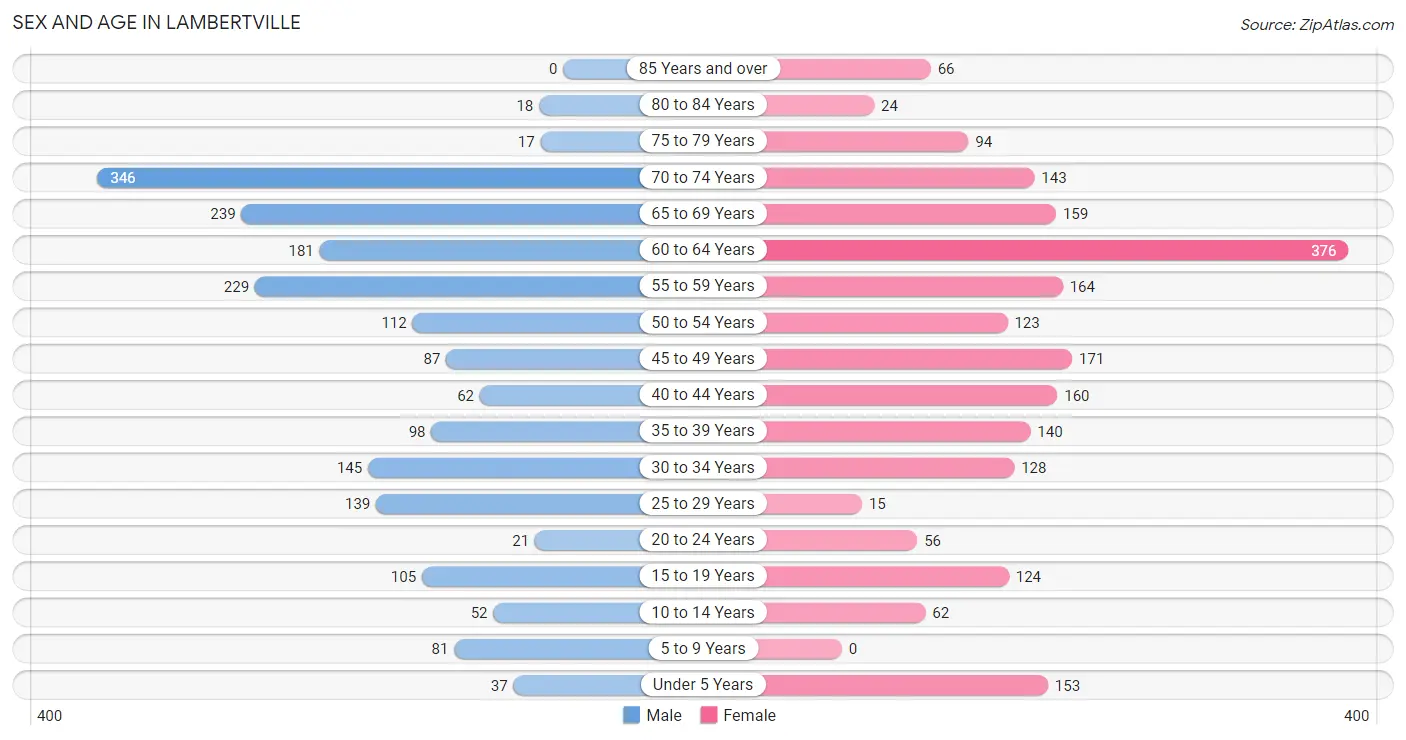
| Age Bracket | Male | Female |
| Under 5 Years | 37 (1.9%) | 153 (7.1%) |
| 5 to 9 Years | 81 (4.1%) | 0 (0.0%) |
| 10 to 14 Years | 52 (2.6%) | 62 (2.9%) |
| 15 to 19 Years | 105 (5.3%) | 124 (5.8%) |
| 20 to 24 Years | 21 (1.1%) | 56 (2.6%) |
| 25 to 29 Years | 139 (7.1%) | 15 (0.7%) |
| 30 to 34 Years | 145 (7.4%) | 128 (5.9%) |
| 35 to 39 Years | 98 (5.0%) | 140 (6.5%) |
| 40 to 44 Years | 62 (3.2%) | 160 (7.4%) |
| 45 to 49 Years | 87 (4.4%) | 171 (7.9%) |
| 50 to 54 Years | 112 (5.7%) | 123 (5.7%) |
| 55 to 59 Years | 229 (11.6%) | 164 (7.6%) |
| 60 to 64 Years | 181 (9.2%) | 376 (17.4%) |
| 65 to 69 Years | 239 (12.1%) | 159 (7.4%) |
| 70 to 74 Years | 346 (17.6%) | 143 (6.6%) |
| 75 to 79 Years | 17 (0.9%) | 94 (4.4%) |
| 80 to 84 Years | 18 (0.9%) | 24 (1.1%) |
| 85 Years and over | 0 (0.0%) | 66 (3.1%) |
| Total | 1,969 (100.0%) | 2,158 (100.0%) |
Families and Households in Lambertville
Median Family Size in Lambertville
The median family size in Lambertville is 2.76 persons per family, with single male/father families (6 | 0.6%) accounting for the largest median family size of 3.33 persons per family. On the other hand, single female/mother families (107 | 11.5%) represent the smallest median family size with 2.57 persons per family.
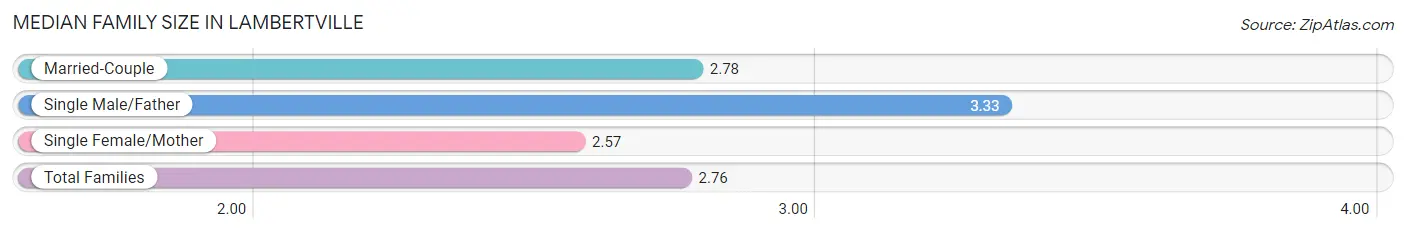
| Family Type | # Families | Family Size |
| Married-Couple | 817 (87.8%) | 2.78 |
| Single Male/Father | 6 (0.6%) | 3.33 |
| Single Female/Mother | 107 (11.5%) | 2.57 |
| Total Families | 930 (100.0%) | 2.76 |
Median Household Size in Lambertville
The median household size in Lambertville is 2.04 persons per household, with single male/father households (6 | 0.3%) accounting for the largest median household size of 3.33 persons per household. non-family households (1,082 | 53.8%) represent the smallest median household size with 1.32 persons per household.
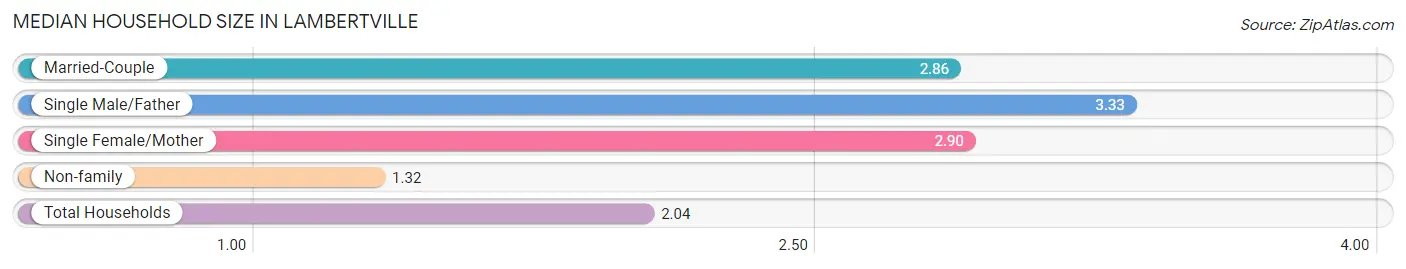
| Household Type | # Households | Household Size |
| Married-Couple | 817 (40.6%) | 2.86 |
| Single Male/Father | 6 (0.3%) | 3.33 |
| Single Female/Mother | 107 (5.3%) | 2.90 |
| Non-family | 1,082 (53.8%) | 1.32 |
| Total Households | 2,012 (100.0%) | 2.04 |
Household Size by Marriage Status in Lambertville
Out of a total of 2,012 households in Lambertville, 930 (46.2%) are family households, while 1,082 (53.8%) are nonfamily households. The most numerous type of family households are 2-person households, comprising 564, and the most common type of nonfamily households are 1-person households, comprising 714.
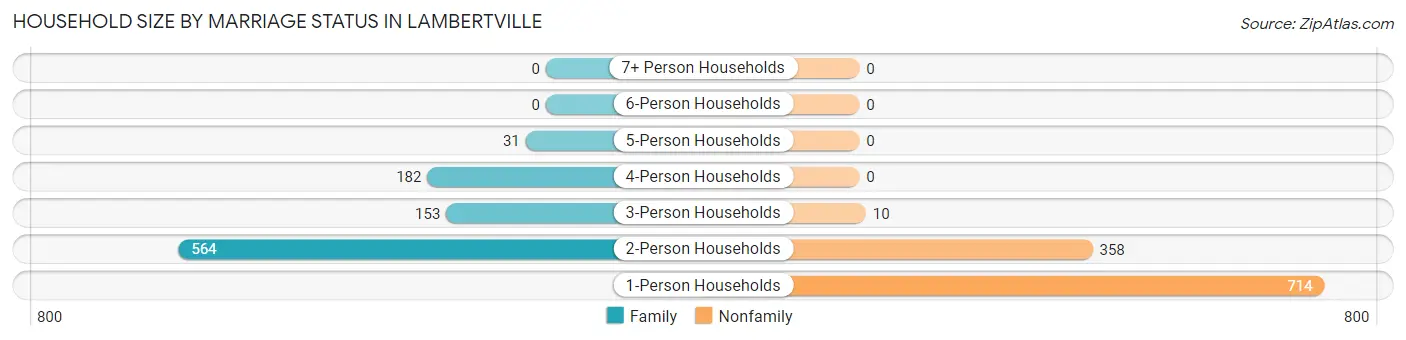
| Household Size | Family Households | Nonfamily Households |
| 1-Person Households | - | 714 (35.5%) |
| 2-Person Households | 564 (28.0%) | 358 (17.8%) |
| 3-Person Households | 153 (7.6%) | 10 (0.5%) |
| 4-Person Households | 182 (9.0%) | 0 (0.0%) |
| 5-Person Households | 31 (1.5%) | 0 (0.0%) |
| 6-Person Households | 0 (0.0%) | 0 (0.0%) |
| 7+ Person Households | 0 (0.0%) | 0 (0.0%) |
| Total | 930 (46.2%) | 1,082 (53.8%) |
Female Fertility in Lambertville
Fertility by Age in Lambertville
Average fertility rate in Lambertville is 31.0 births per 1,000 women. Women in the age bracket of 20 to 34 years have the highest fertility rate with 126.0 births per 1,000 women. Women in the age bracket of 20 to 34 years acount for 100.0% of all women with births.
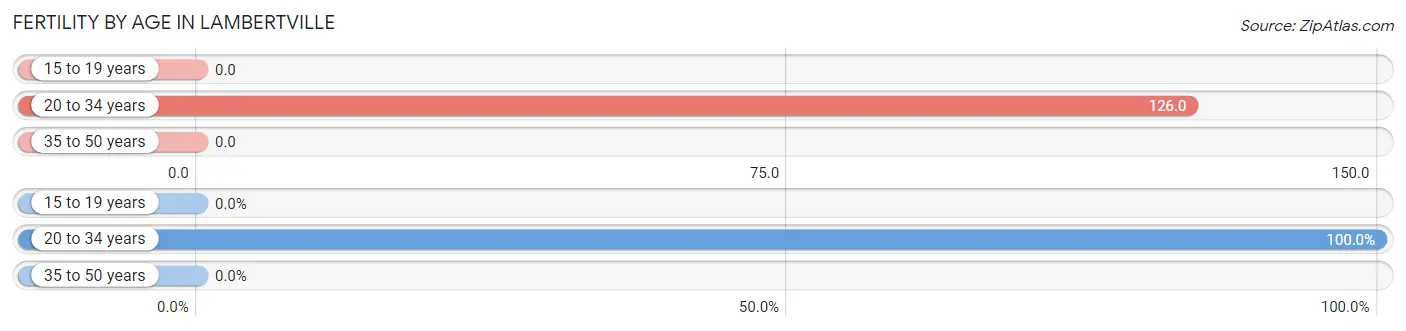
| Age Bracket | Women with Births | Births / 1,000 Women |
| 15 to 19 years | 0 (0.0%) | 0.0 |
| 20 to 34 years | 25 (100.0%) | 126.0 |
| 35 to 50 years | 0 (0.0%) | 0.0 |
| Total | 25 (100.0%) | 31.0 |
Fertility by Age by Marriage Status in Lambertville
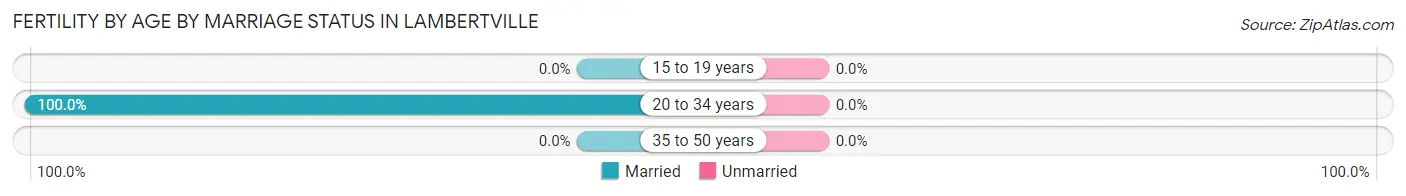
| Age Bracket | Married | Unmarried |
| 15 to 19 years | 0 (0.0%) | 0 (0.0%) |
| 20 to 34 years | 25 (100.0%) | 0 (0.0%) |
| 35 to 50 years | 0 (0.0%) | 0 (0.0%) |
| Total | 25 (100.0%) | 0 (0.0%) |
Fertility by Education in Lambertville
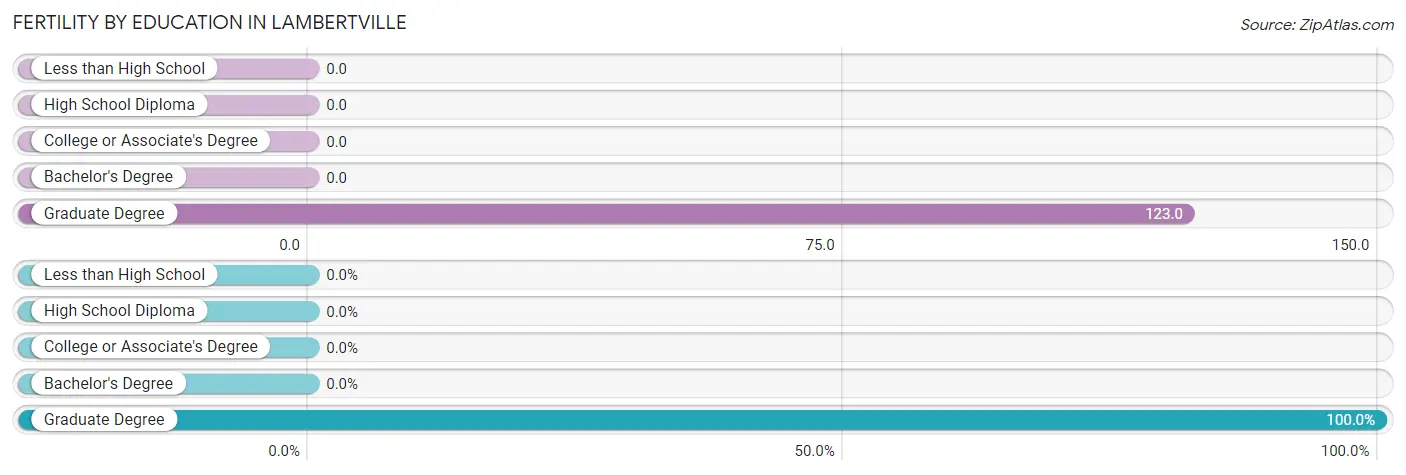
| Educational Attainment | Women with Births | Births / 1,000 Women |
| Less than High School | 0 (0.0%) | 0.0 |
| High School Diploma | 0 (0.0%) | 0.0 |
| College or Associate's Degree | 0 (0.0%) | 0.0 |
| Bachelor's Degree | 0 (0.0%) | 0.0 |
| Graduate Degree | 25 (100.0%) | 123.0 |
| Total | 25 (100.0%) | 31.0 |
Fertility by Education by Marriage Status in Lambertville
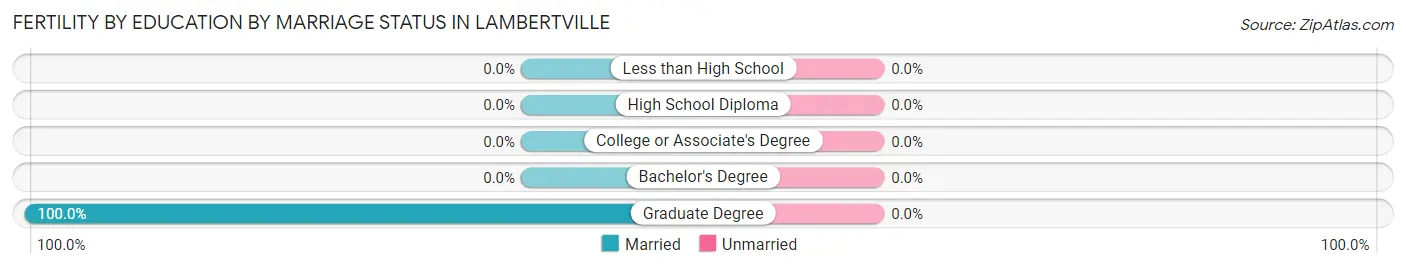
| Educational Attainment | Married | Unmarried |
| Less than High School | 0 (0.0%) | 0 (0.0%) |
| High School Diploma | 0 (0.0%) | 0 (0.0%) |
| College or Associate's Degree | 0 (0.0%) | 0 (0.0%) |
| Bachelor's Degree | 0 (0.0%) | 0 (0.0%) |
| Graduate Degree | 25 (100.0%) | 0 (0.0%) |
| Total | 25 (100.0%) | 0 (0.0%) |
Employment Characteristics in Lambertville
Employment by Class of Employer in Lambertville
Among the 2,527 employed individuals in Lambertville, private company employees (1,546 | 61.2%), self-employed (not incorporated) (288 | 11.4%), and not-for-profit organizations (274 | 10.8%) make up the most common classes of employment.
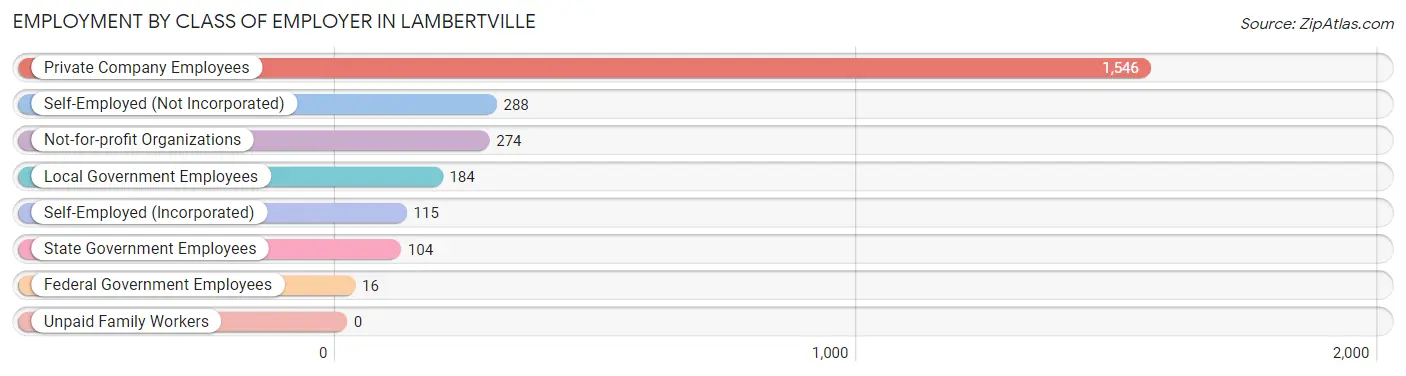
| Employer Class | # Employees | % Employees |
| Private Company Employees | 1,546 | 61.2% |
| Self-Employed (Incorporated) | 115 | 4.5% |
| Self-Employed (Not Incorporated) | 288 | 11.4% |
| Not-for-profit Organizations | 274 | 10.8% |
| Local Government Employees | 184 | 7.3% |
| State Government Employees | 104 | 4.1% |
| Federal Government Employees | 16 | 0.6% |
| Unpaid Family Workers | 0 | 0.0% |
| Total | 2,527 | 100.0% |
Employment Status by Age in Lambertville
According to the labor force statistics for Lambertville, out of the total population over 16 years of age (3,713), 73.0% or 2,710 individuals are in the labor force, with 5.8% or 157 of them unemployed. The age group with the highest labor force participation rate is 25 to 29 years, with 100.0% or 154 individuals in the labor force. Within the labor force, the 16 to 19 years age range has the highest percentage of unemployed individuals, with 74.6% or 91 of them being unemployed.
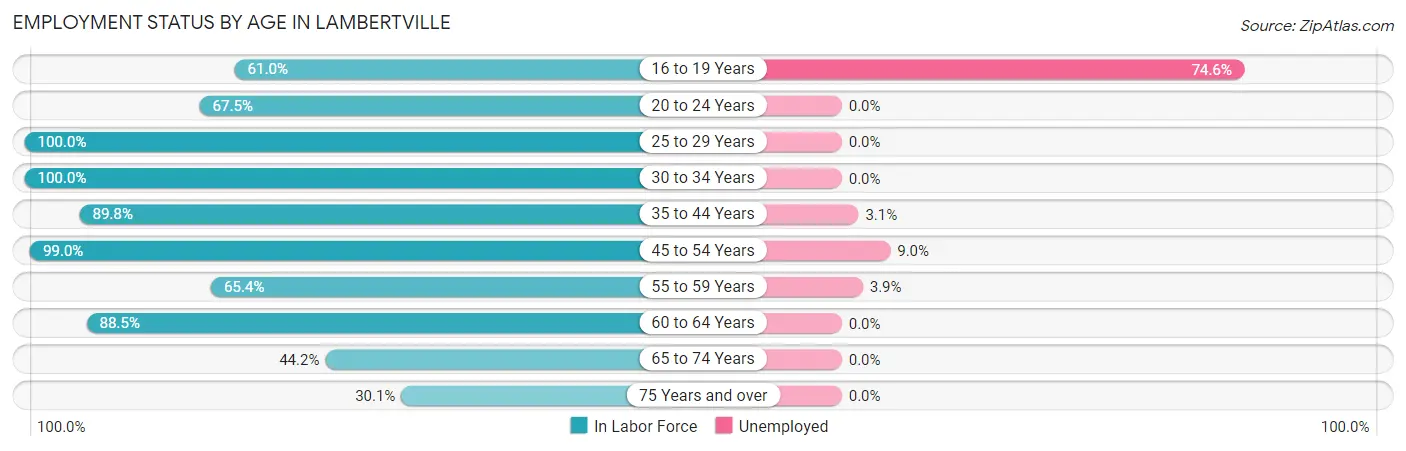
| Age Bracket | In Labor Force | Unemployed |
| 16 to 19 Years | 122 (61.0%) | 91 (74.6%) |
| 20 to 24 Years | 52 (67.5%) | 0 (0.0%) |
| 25 to 29 Years | 154 (100.0%) | 0 (0.0%) |
| 30 to 34 Years | 273 (100.0%) | 0 (0.0%) |
| 35 to 44 Years | 413 (89.8%) | 13 (3.1%) |
| 45 to 54 Years | 488 (99.0%) | 44 (9.0%) |
| 55 to 59 Years | 257 (65.4%) | 10 (3.9%) |
| 60 to 64 Years | 493 (88.5%) | 0 (0.0%) |
| 65 to 74 Years | 392 (44.2%) | 0 (0.0%) |
| 75 Years and over | 66 (30.1%) | 0 (0.0%) |
| Total | 2,710 (73.0%) | 157 (5.8%) |
Employment Status by Educational Attainment in Lambertville
According to labor force statistics for Lambertville, 89.2% of individuals (2,078) out of the total population between 25 and 64 years of age (2,330) are in the labor force, with 3.2% or 66 of them being unemployed. The group with the highest labor force participation rate are those with the educational attainment of bachelor's degree or higher, with 94.1% or 1,515 individuals in the labor force. Within the labor force, individuals with high school diploma education have the highest percentage of unemployment, with 6.9% or 15 of them being unemployed.
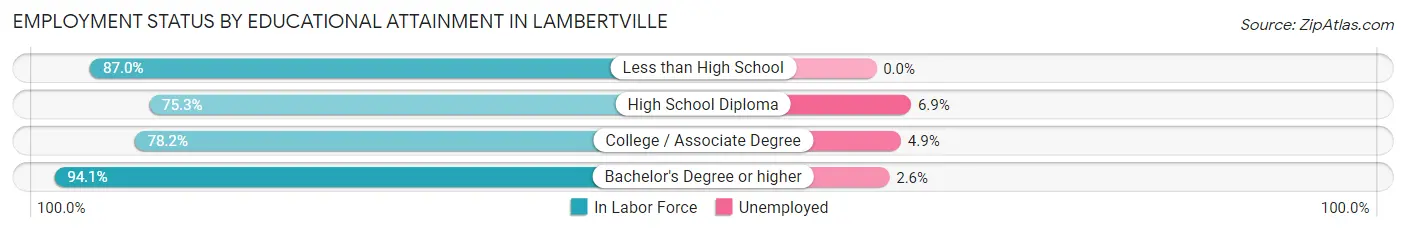
| Educational Attainment | In Labor Force | Unemployed |
| Less than High School | 80 (87.0%) | 0 (0.0%) |
| High School Diploma | 217 (75.3%) | 20 (6.9%) |
| College / Associate Degree | 266 (78.2%) | 17 (4.9%) |
| Bachelor's Degree or higher | 1,515 (94.1%) | 42 (2.6%) |
| Total | 2,078 (89.2%) | 75 (3.2%) |
Employment Occupations by Sex in Lambertville
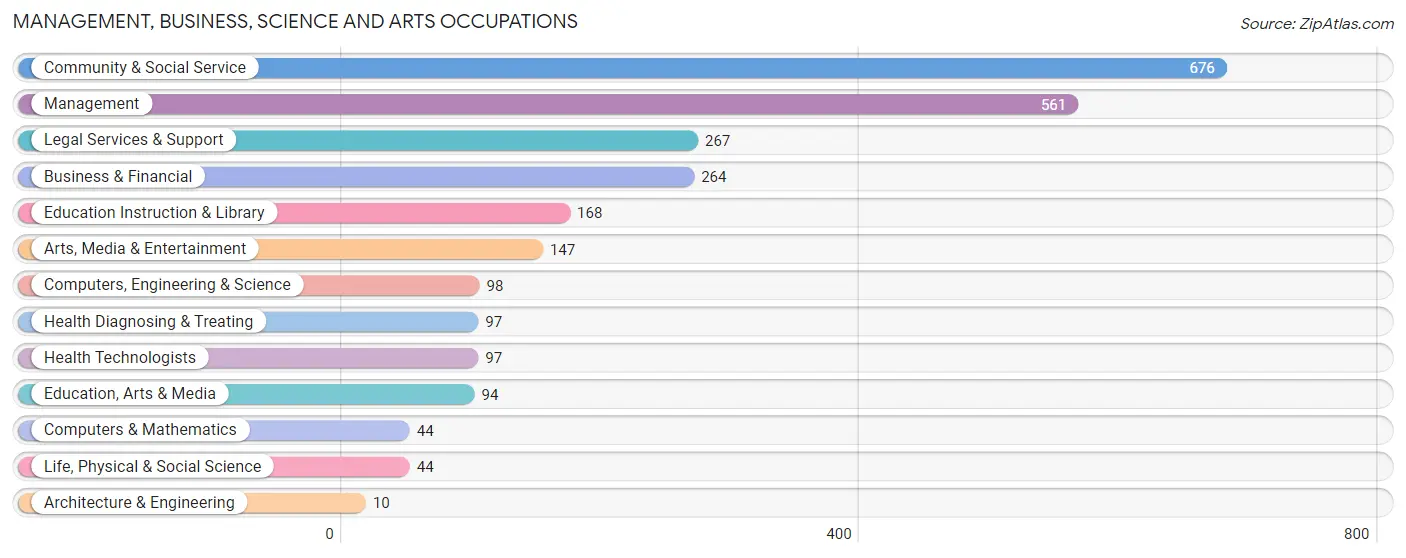
Management, Business, Science and Arts Occupations
The most common Management, Business, Science and Arts occupations in Lambertville are Community & Social Service (676 | 26.5%), Management (561 | 22.0%), Legal Services & Support (267 | 10.5%), Business & Financial (264 | 10.3%), and Education Instruction & Library (168 | 6.6%).
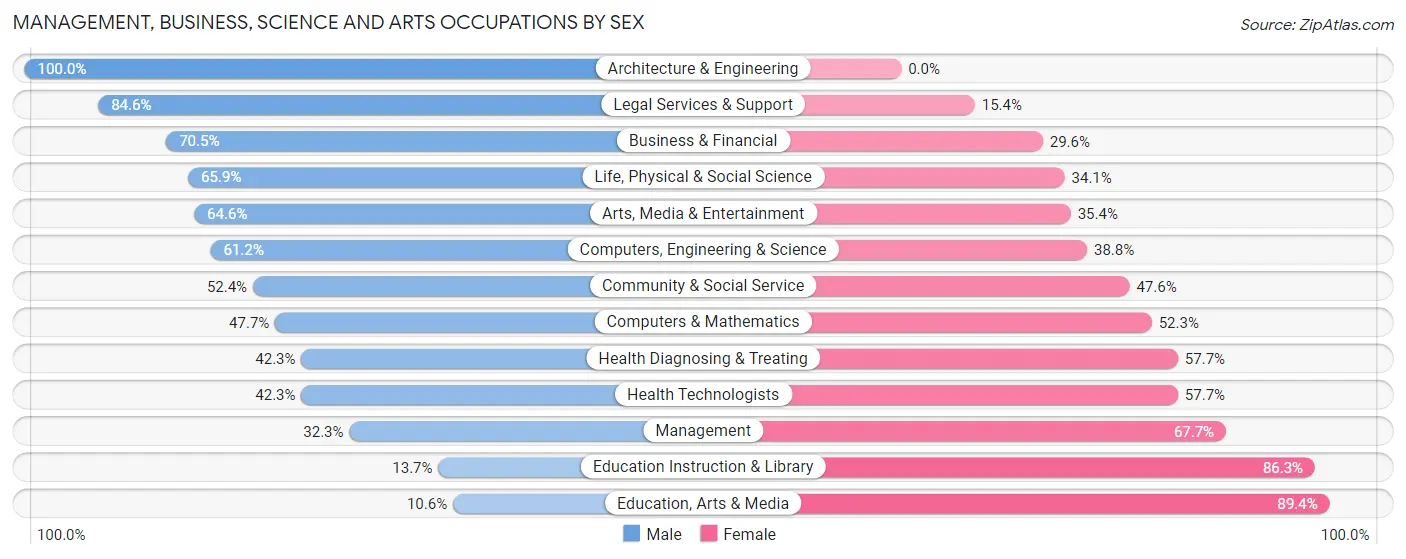
Management, Business, Science and Arts Occupations by Sex
Within the Management, Business, Science and Arts occupations in Lambertville, the most male-oriented occupations are Architecture & Engineering (100.0%), Legal Services & Support (84.6%), and Business & Financial (70.5%), while the most female-oriented occupations are Education, Arts & Media (89.4%), Education Instruction & Library (86.3%), and Management (67.7%).
| Occupation | Male | Female |
| Management | 181 (32.3%) | 380 (67.7%) |
| Business & Financial | 186 (70.5%) | 78 (29.5%) |
| Computers, Engineering & Science | 60 (61.2%) | 38 (38.8%) |
| Computers & Mathematics | 21 (47.7%) | 23 (52.3%) |
| Architecture & Engineering | 10 (100.0%) | 0 (0.0%) |
| Life, Physical & Social Science | 29 (65.9%) | 15 (34.1%) |
| Community & Social Service | 354 (52.4%) | 322 (47.6%) |
| Education, Arts & Media | 10 (10.6%) | 84 (89.4%) |
| Legal Services & Support | 226 (84.6%) | 41 (15.4%) |
| Education Instruction & Library | 23 (13.7%) | 145 (86.3%) |
| Arts, Media & Entertainment | 95 (64.6%) | 52 (35.4%) |
| Health Diagnosing & Treating | 41 (42.3%) | 56 (57.7%) |
| Health Technologists | 41 (42.3%) | 56 (57.7%) |
| Total (Category) | 822 (48.5%) | 874 (51.5%) |
| Total (Overall) | 1,266 (49.6%) | 1,286 (50.4%) |
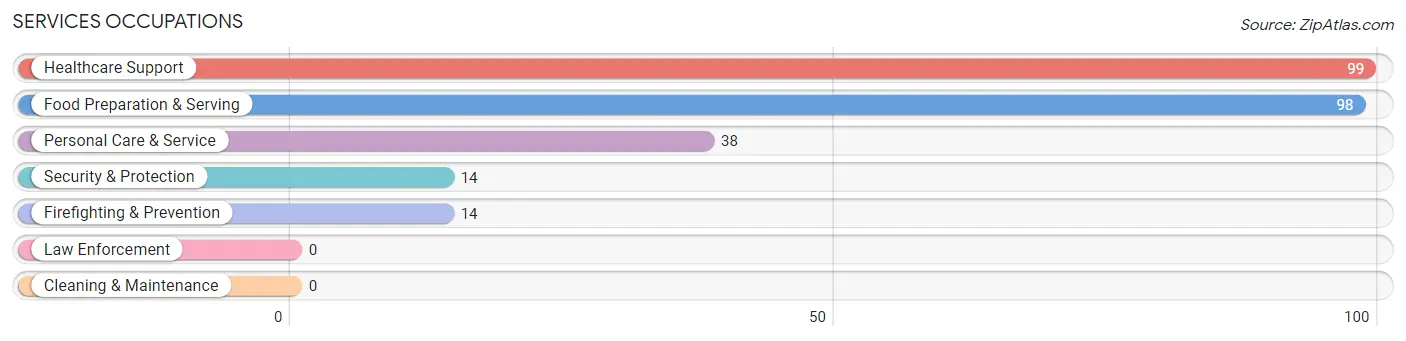
Services Occupations
The most common Services occupations in Lambertville are Healthcare Support (99 | 3.9%), Food Preparation & Serving (98 | 3.8%), Personal Care & Service (38 | 1.5%), Security & Protection (14 | 0.5%), and Firefighting & Prevention (14 | 0.5%).
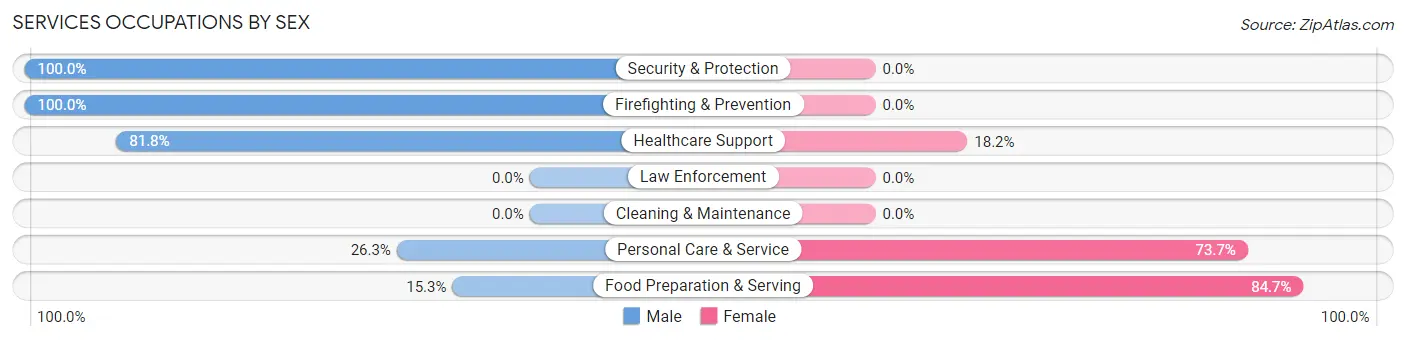
Services Occupations by Sex
Within the Services occupations in Lambertville, the most male-oriented occupations are Security & Protection (100.0%), Firefighting & Prevention (100.0%), and Healthcare Support (81.8%), while the most female-oriented occupations are Food Preparation & Serving (84.7%), Personal Care & Service (73.7%), and Healthcare Support (18.2%).
| Occupation | Male | Female |
| Healthcare Support | 81 (81.8%) | 18 (18.2%) |
| Security & Protection | 14 (100.0%) | 0 (0.0%) |
| Firefighting & Prevention | 14 (100.0%) | 0 (0.0%) |
| Law Enforcement | 0 (0.0%) | 0 (0.0%) |
| Food Preparation & Serving | 15 (15.3%) | 83 (84.7%) |
| Cleaning & Maintenance | 0 (0.0%) | 0 (0.0%) |
| Personal Care & Service | 10 (26.3%) | 28 (73.7%) |
| Total (Category) | 120 (48.2%) | 129 (51.8%) |
| Total (Overall) | 1,266 (49.6%) | 1,286 (50.4%) |
Sales and Office Occupations
The most common Sales and Office occupations in Lambertville are Sales & Related (268 | 10.5%), and Office & Administration (147 | 5.8%).

Sales and Office Occupations by Sex
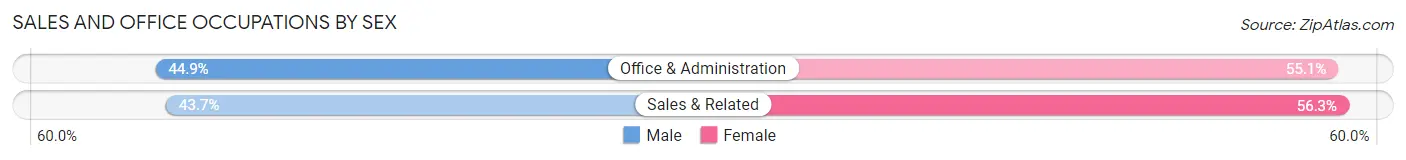
| Occupation | Male | Female |
| Sales & Related | 117 (43.7%) | 151 (56.3%) |
| Office & Administration | 66 (44.9%) | 81 (55.1%) |
| Total (Category) | 183 (44.1%) | 232 (55.9%) |
| Total (Overall) | 1,266 (49.6%) | 1,286 (50.4%) |
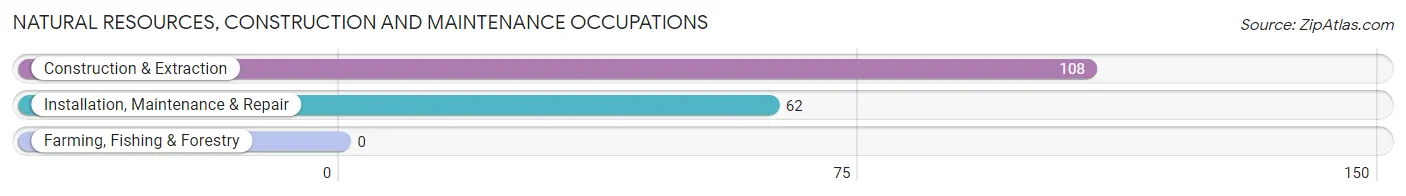
Natural Resources, Construction and Maintenance Occupations
The most common Natural Resources, Construction and Maintenance occupations in Lambertville are Construction & Extraction (108 | 4.2%), and Installation, Maintenance & Repair (62 | 2.4%).
Natural Resources, Construction and Maintenance Occupations by Sex
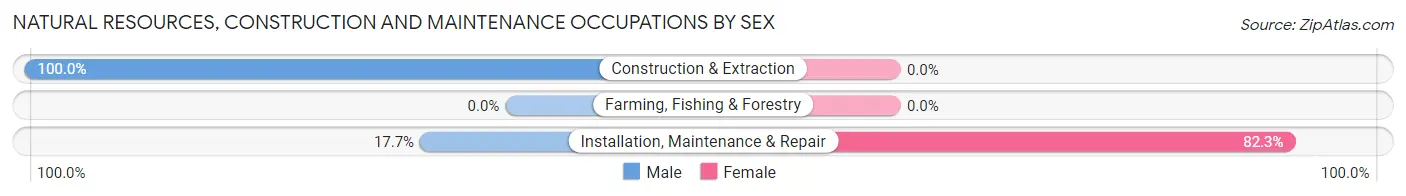
| Occupation | Male | Female |
| Farming, Fishing & Forestry | 0 (0.0%) | 0 (0.0%) |
| Construction & Extraction | 108 (100.0%) | 0 (0.0%) |
| Installation, Maintenance & Repair | 11 (17.7%) | 51 (82.3%) |
| Total (Category) | 119 (70.0%) | 51 (30.0%) |
| Total (Overall) | 1,266 (49.6%) | 1,286 (50.4%) |
Production, Transportation and Moving Occupations
The most common Production, Transportation and Moving occupations in Lambertville are Production (12 | 0.5%), and Transportation (10 | 0.4%).
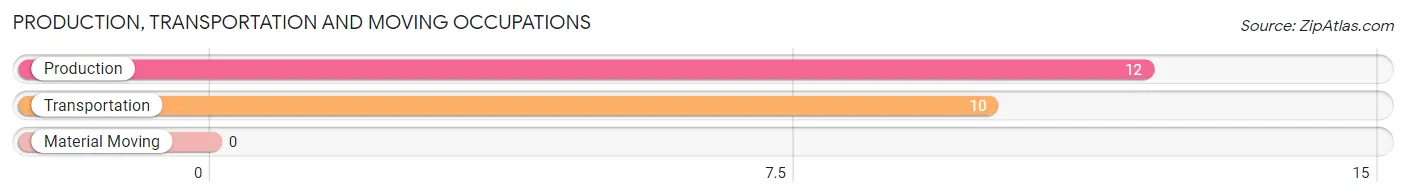
Production, Transportation and Moving Occupations by Sex
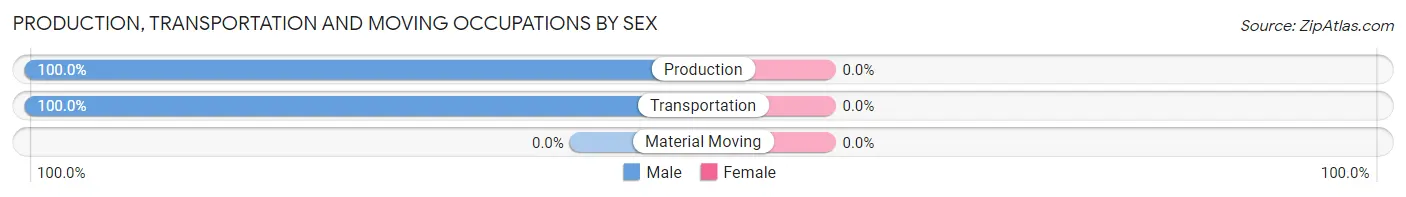
| Occupation | Male | Female |
| Production | 12 (100.0%) | 0 (0.0%) |
| Transportation | 10 (100.0%) | 0 (0.0%) |
| Material Moving | 0 (0.0%) | 0 (0.0%) |
| Total (Category) | 22 (100.0%) | 0 (0.0%) |
| Total (Overall) | 1,266 (49.6%) | 1,286 (50.4%) |
Employment Industries by Sex in Lambertville
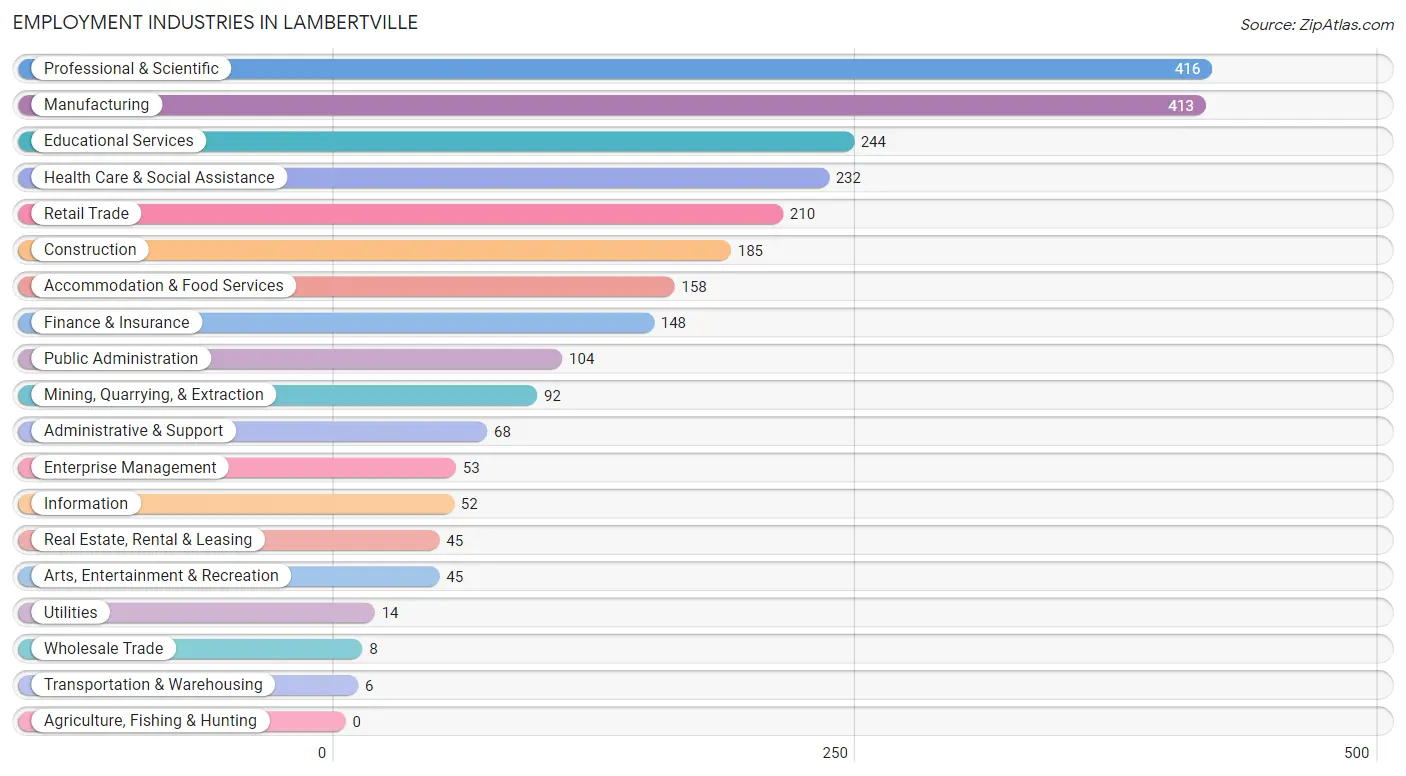
Employment Industries in Lambertville
The major employment industries in Lambertville include Professional & Scientific (416 | 16.3%), Manufacturing (413 | 16.2%), Educational Services (244 | 9.6%), Health Care & Social Assistance (232 | 9.1%), and Retail Trade (210 | 8.2%).
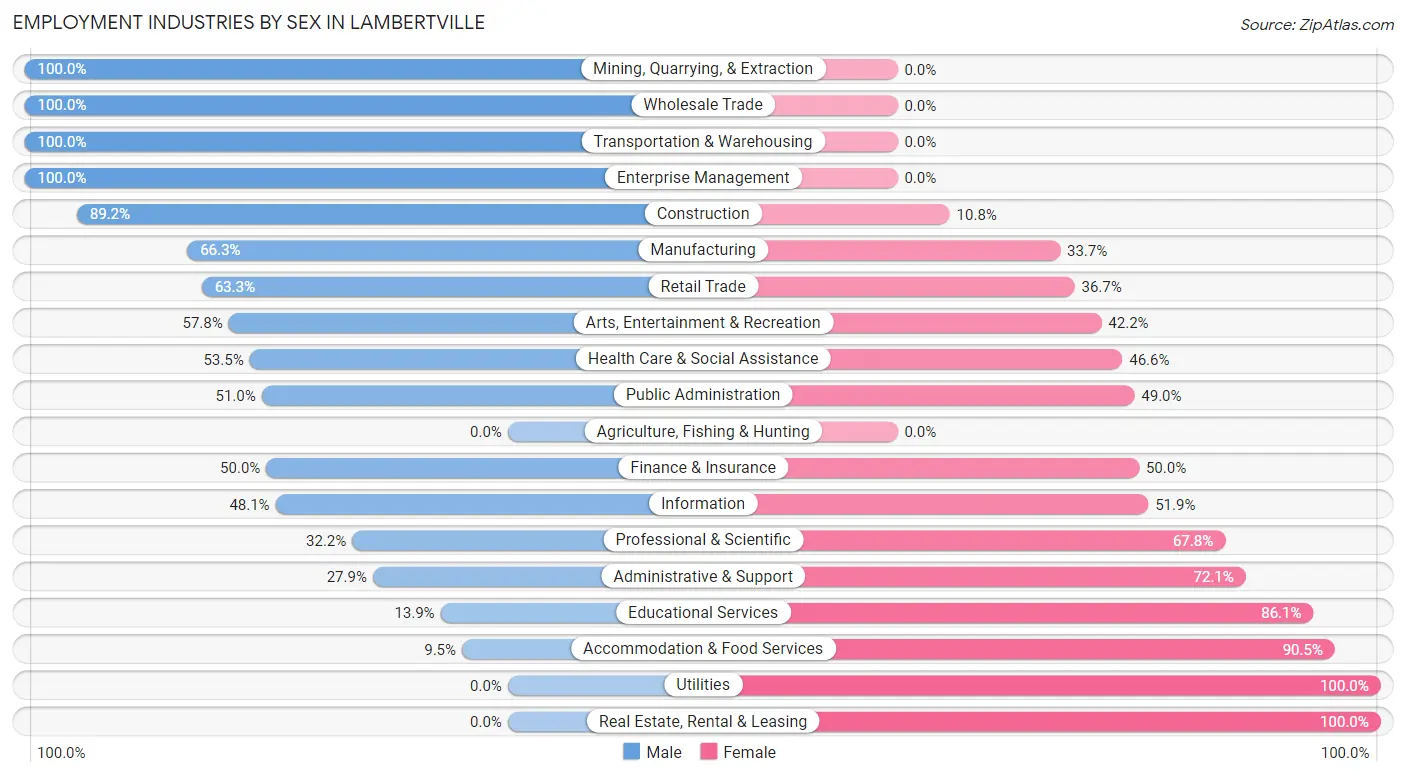
Employment Industries by Sex in Lambertville
The Lambertville industries that see more men than women are Mining, Quarrying, & Extraction (100.0%), Wholesale Trade (100.0%), and Transportation & Warehousing (100.0%), whereas the industries that tend to have a higher number of women are Utilities (100.0%), Real Estate, Rental & Leasing (100.0%), and Accommodation & Food Services (90.5%).
| Industry | Male | Female |
| Agriculture, Fishing & Hunting | 0 (0.0%) | 0 (0.0%) |
| Mining, Quarrying, & Extraction | 92 (100.0%) | 0 (0.0%) |
| Construction | 165 (89.2%) | 20 (10.8%) |
| Manufacturing | 274 (66.3%) | 139 (33.7%) |
| Wholesale Trade | 8 (100.0%) | 0 (0.0%) |
| Retail Trade | 133 (63.3%) | 77 (36.7%) |
| Transportation & Warehousing | 6 (100.0%) | 0 (0.0%) |
| Utilities | 0 (0.0%) | 14 (100.0%) |
| Information | 25 (48.1%) | 27 (51.9%) |
| Finance & Insurance | 74 (50.0%) | 74 (50.0%) |
| Real Estate, Rental & Leasing | 0 (0.0%) | 45 (100.0%) |
| Professional & Scientific | 134 (32.2%) | 282 (67.8%) |
| Enterprise Management | 53 (100.0%) | 0 (0.0%) |
| Administrative & Support | 19 (27.9%) | 49 (72.1%) |
| Educational Services | 34 (13.9%) | 210 (86.1%) |
| Health Care & Social Assistance | 124 (53.4%) | 108 (46.6%) |
| Arts, Entertainment & Recreation | 26 (57.8%) | 19 (42.2%) |
| Accommodation & Food Services | 15 (9.5%) | 143 (90.5%) |
| Public Administration | 53 (51.0%) | 51 (49.0%) |
| Total | 1,266 (49.6%) | 1,286 (50.4%) |
Education in Lambertville
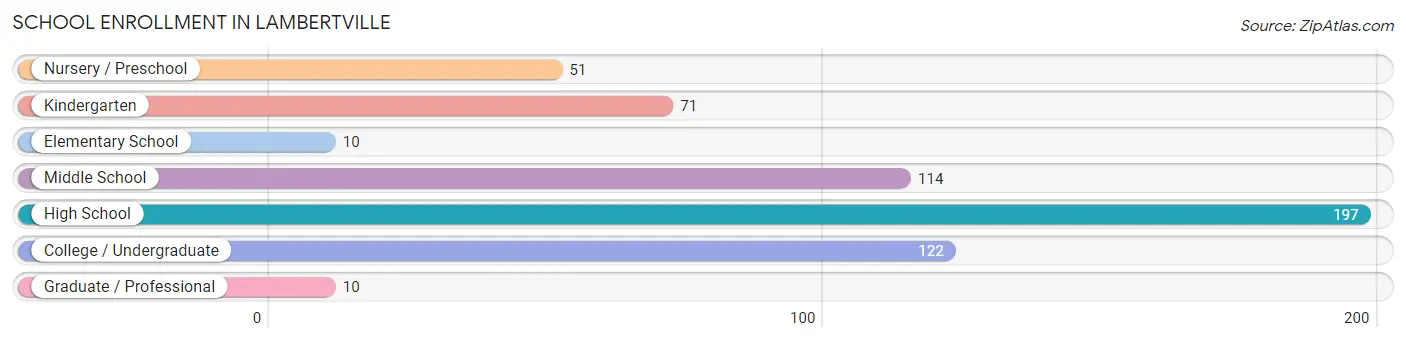
School Enrollment in Lambertville
The most common levels of schooling among the 575 students in Lambertville are high school (197 | 34.3%), college / undergraduate (122 | 21.2%), and middle school (114 | 19.8%).
| School Level | # Students | % Students |
| Nursery / Preschool | 51 | 8.9% |
| Kindergarten | 71 | 12.3% |
| Elementary School | 10 | 1.7% |
| Middle School | 114 | 19.8% |
| High School | 197 | 34.3% |
| College / Undergraduate | 122 | 21.2% |
| Graduate / Professional | 10 | 1.7% |
| Total | 575 | 100.0% |
School Enrollment by Age by Funding Source in Lambertville
Out of a total of 575 students who are enrolled in schools in Lambertville, 68 (11.8%) attend a private institution, while the remaining 507 (88.2%) are enrolled in public schools. The age group of 10 to 14 year olds has the highest likelihood of being enrolled in private schools, with 39 (34.2% in the age bracket) enrolled. Conversely, the age group of 3 to 4 year olds has the lowest likelihood of being enrolled in a private school, with 51 (100.0% in the age bracket) attending a public institution.
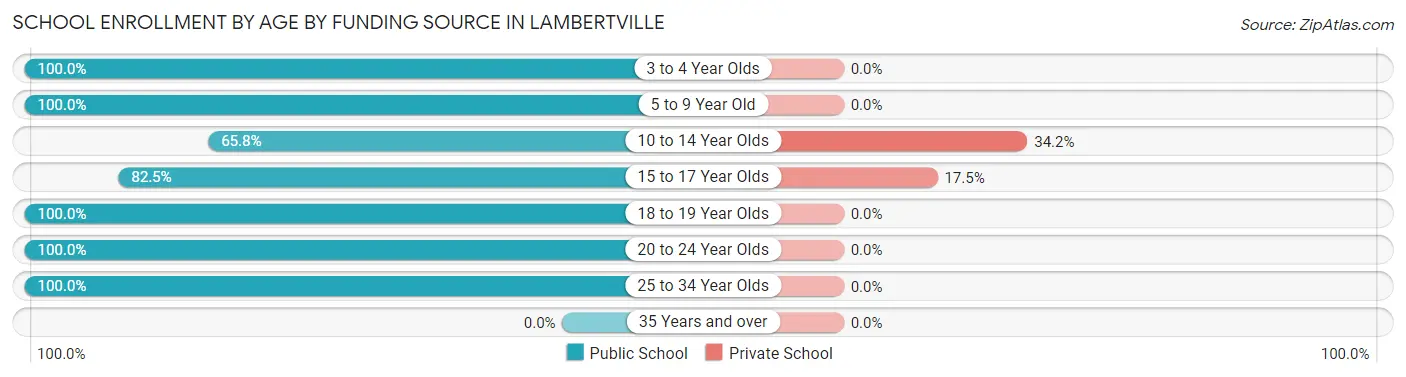
| Age Bracket | Public School | Private School |
| 3 to 4 Year Olds | 51 (100.0%) | 0 (0.0%) |
| 5 to 9 Year Old | 81 (100.0%) | 0 (0.0%) |
| 10 to 14 Year Olds | 75 (65.8%) | 39 (34.2%) |
| 15 to 17 Year Olds | 137 (82.5%) | 29 (17.5%) |
| 18 to 19 Year Olds | 63 (100.0%) | 0 (0.0%) |
| 20 to 24 Year Olds | 69 (100.0%) | 0 (0.0%) |
| 25 to 34 Year Olds | 31 (100.0%) | 0 (0.0%) |
| 35 Years and over | 0 (0.0%) | 0 (0.0%) |
| Total | 507 (88.2%) | 68 (11.8%) |
Educational Attainment by Field of Study in Lambertville
Business (576 | 24.2%), arts & humanities (232 | 9.8%), education (220 | 9.2%), liberal arts & history (213 | 8.9%), and literature & languages (211 | 8.9%) are the most common fields of study among 2,380 individuals in Lambertville who have obtained a bachelor's degree or higher.
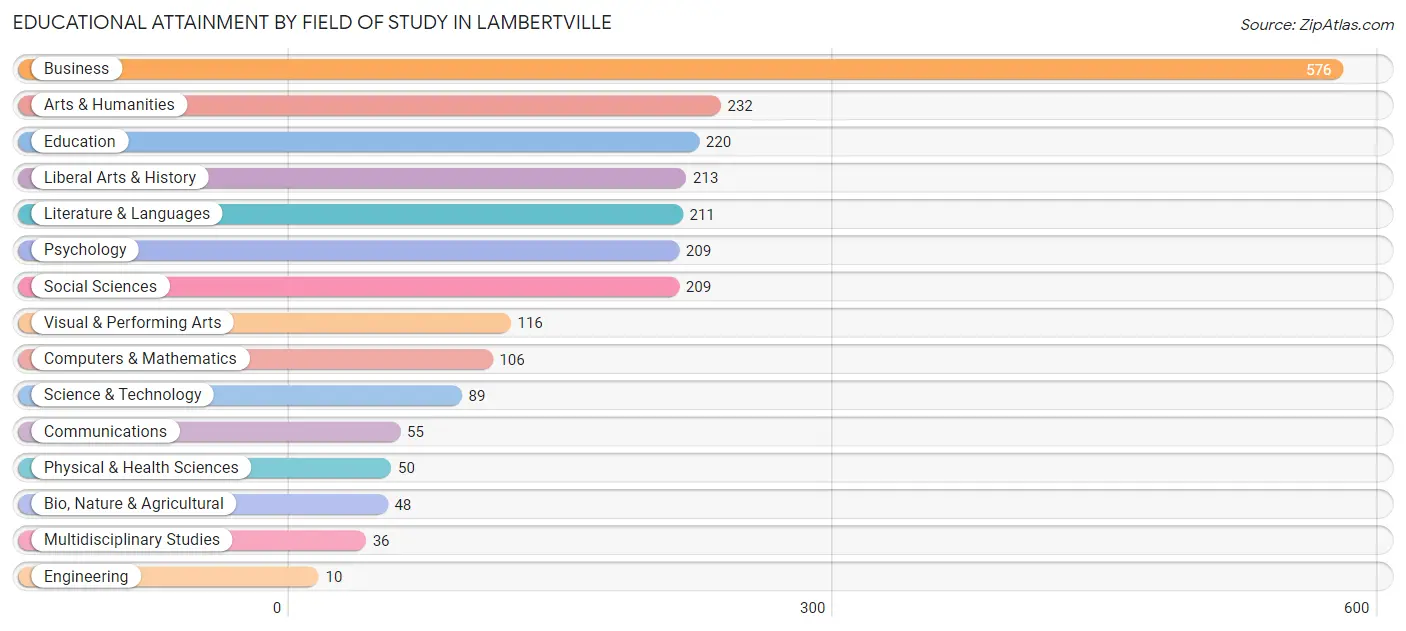
| Field of Study | # Graduates | % Graduates |
| Computers & Mathematics | 106 | 4.4% |
| Bio, Nature & Agricultural | 48 | 2.0% |
| Physical & Health Sciences | 50 | 2.1% |
| Psychology | 209 | 8.8% |
| Social Sciences | 209 | 8.8% |
| Engineering | 10 | 0.4% |
| Multidisciplinary Studies | 36 | 1.5% |
| Science & Technology | 89 | 3.7% |
| Business | 576 | 24.2% |
| Education | 220 | 9.2% |
| Literature & Languages | 211 | 8.9% |
| Liberal Arts & History | 213 | 8.9% |
| Visual & Performing Arts | 116 | 4.9% |
| Communications | 55 | 2.3% |
| Arts & Humanities | 232 | 9.8% |
| Total | 2,380 | 100.0% |
Transportation & Commute in Lambertville
Vehicle Availability by Sex in Lambertville
The most prevalent vehicle ownership categories in Lambertville are males with 2 vehicles (640, accounting for 50.5%) and females with 2 vehicles (525, making up 50.7%).
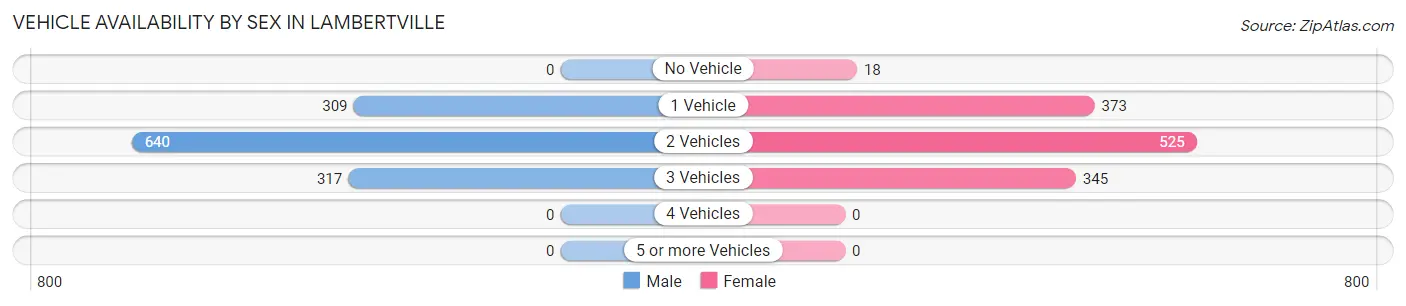
| Vehicles Available | Male | Female |
| No Vehicle | 0 (0.0%) | 18 (1.4%) |
| 1 Vehicle | 309 (24.4%) | 373 (29.6%) |
| 2 Vehicles | 640 (50.5%) | 525 (41.6%) |
| 3 Vehicles | 317 (25.0%) | 345 (27.4%) |
| 4 Vehicles | 0 (0.0%) | 0 (0.0%) |
| 5 or more Vehicles | 0 (0.0%) | 0 (0.0%) |
| Total | 1,266 (100.0%) | 1,261 (100.0%) |
Commute Time in Lambertville
The most frequently occuring commute durations in Lambertville are 60 to 89 minutes (265 commuters, 13.4%), 35 to 39 minutes (256 commuters, 13.0%), and 15 to 19 minutes (249 commuters, 12.6%).
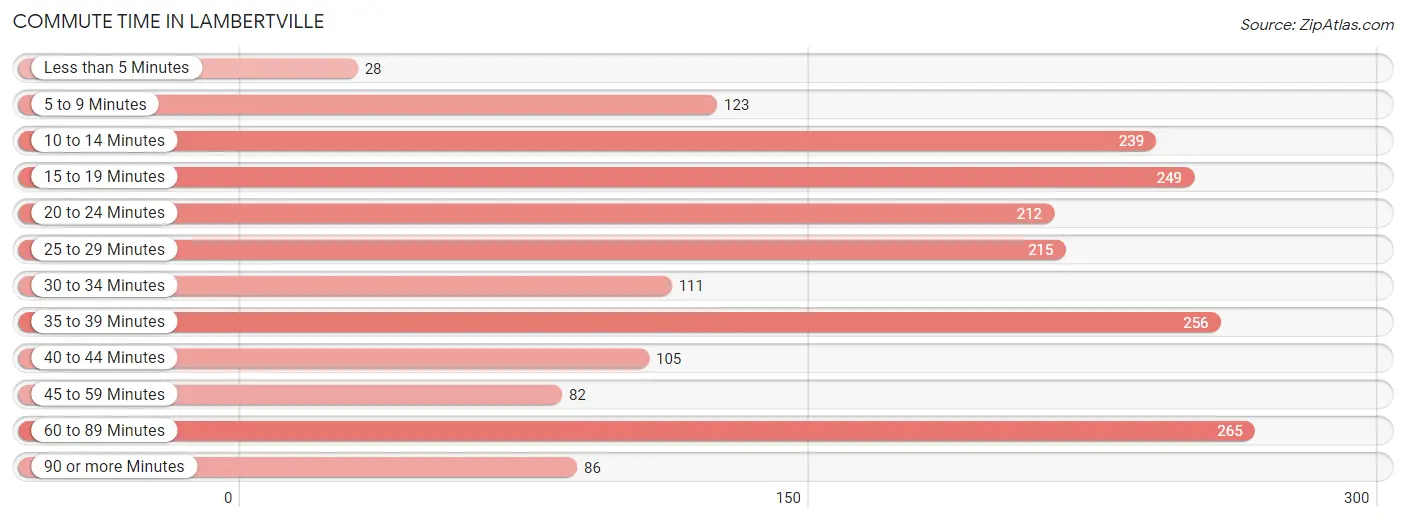
| Commute Time | # Commuters | % Commuters |
| Less than 5 Minutes | 28 | 1.4% |
| 5 to 9 Minutes | 123 | 6.2% |
| 10 to 14 Minutes | 239 | 12.1% |
| 15 to 19 Minutes | 249 | 12.6% |
| 20 to 24 Minutes | 212 | 10.8% |
| 25 to 29 Minutes | 215 | 10.9% |
| 30 to 34 Minutes | 111 | 5.6% |
| 35 to 39 Minutes | 256 | 13.0% |
| 40 to 44 Minutes | 105 | 5.3% |
| 45 to 59 Minutes | 82 | 4.2% |
| 60 to 89 Minutes | 265 | 13.4% |
| 90 or more Minutes | 86 | 4.4% |
Commute Time by Sex in Lambertville
The most common commute times in Lambertville are 60 to 89 minutes (247 commuters, 25.2%) for males and 10 to 14 minutes (221 commuters, 22.3%) for females.
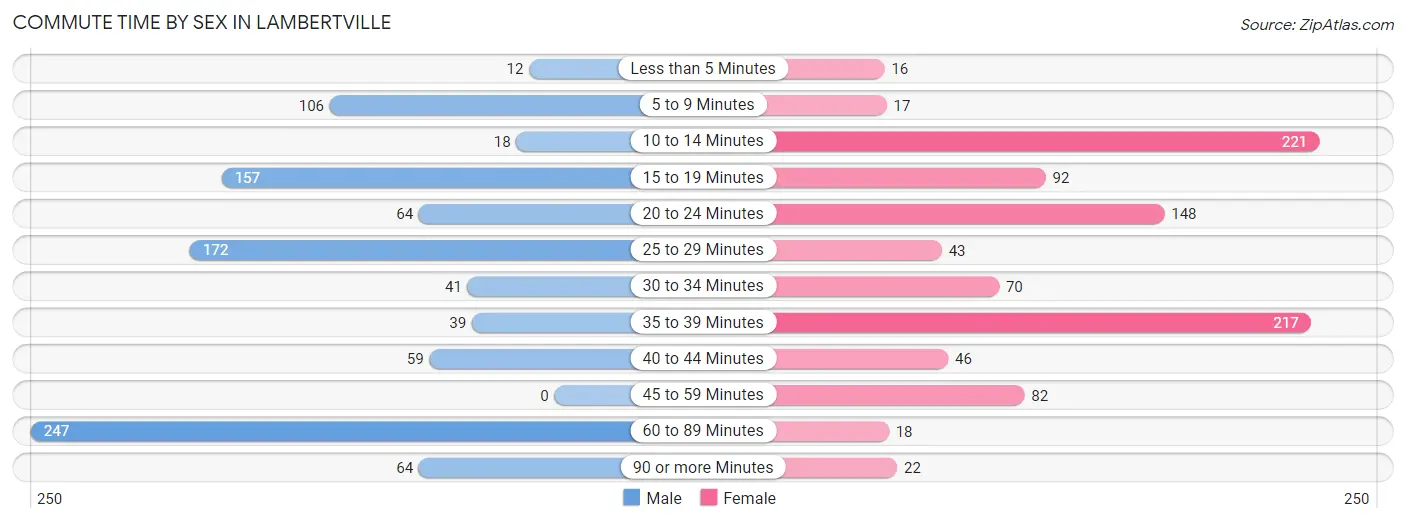
| Commute Time | Male | Female |
| Less than 5 Minutes | 12 (1.2%) | 16 (1.6%) |
| 5 to 9 Minutes | 106 (10.8%) | 17 (1.7%) |
| 10 to 14 Minutes | 18 (1.8%) | 221 (22.3%) |
| 15 to 19 Minutes | 157 (16.0%) | 92 (9.3%) |
| 20 to 24 Minutes | 64 (6.5%) | 148 (14.9%) |
| 25 to 29 Minutes | 172 (17.6%) | 43 (4.3%) |
| 30 to 34 Minutes | 41 (4.2%) | 70 (7.1%) |
| 35 to 39 Minutes | 39 (4.0%) | 217 (21.9%) |
| 40 to 44 Minutes | 59 (6.0%) | 46 (4.6%) |
| 45 to 59 Minutes | 0 (0.0%) | 82 (8.3%) |
| 60 to 89 Minutes | 247 (25.2%) | 18 (1.8%) |
| 90 or more Minutes | 64 (6.5%) | 22 (2.2%) |
Time of Departure to Work by Sex in Lambertville
The most frequent times of departure to work in Lambertville are 8:00 AM to 8:29 AM (222, 22.7%) for males and 7:00 AM to 7:29 AM (452, 45.6%) for females.
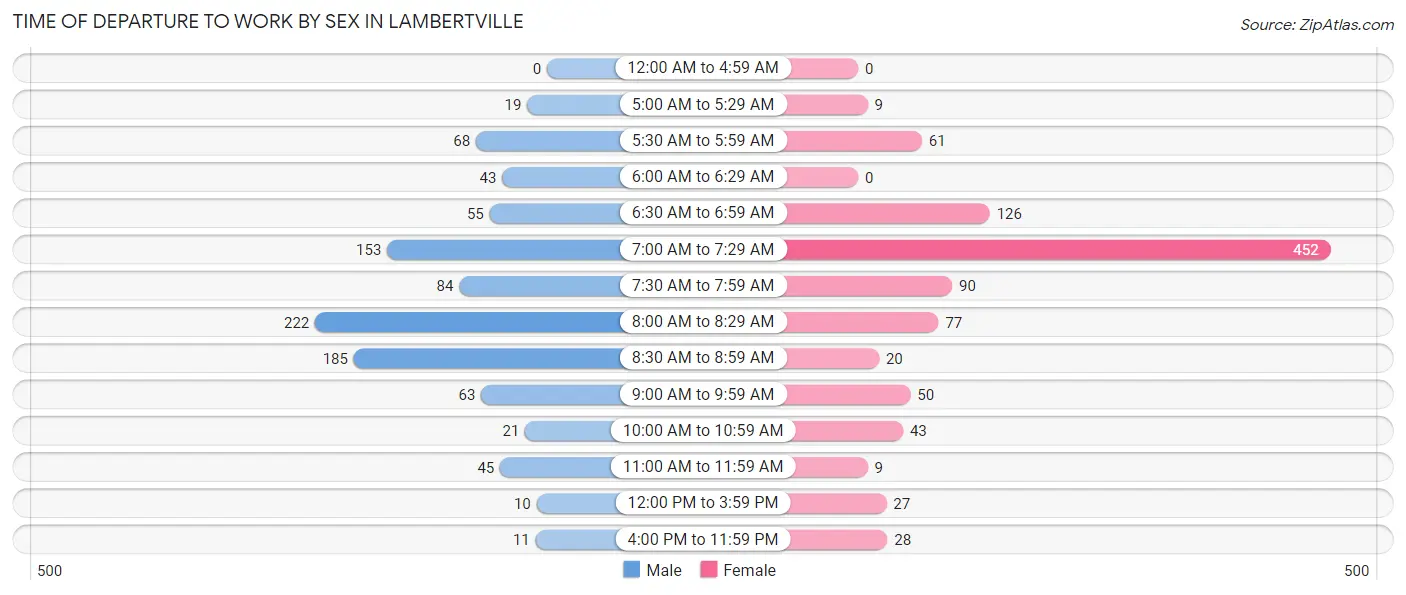
| Time of Departure | Male | Female |
| 12:00 AM to 4:59 AM | 0 (0.0%) | 0 (0.0%) |
| 5:00 AM to 5:29 AM | 19 (1.9%) | 9 (0.9%) |
| 5:30 AM to 5:59 AM | 68 (7.0%) | 61 (6.1%) |
| 6:00 AM to 6:29 AM | 43 (4.4%) | 0 (0.0%) |
| 6:30 AM to 6:59 AM | 55 (5.6%) | 126 (12.7%) |
| 7:00 AM to 7:29 AM | 153 (15.6%) | 452 (45.6%) |
| 7:30 AM to 7:59 AM | 84 (8.6%) | 90 (9.1%) |
| 8:00 AM to 8:29 AM | 222 (22.7%) | 77 (7.8%) |
| 8:30 AM to 8:59 AM | 185 (18.9%) | 20 (2.0%) |
| 9:00 AM to 9:59 AM | 63 (6.4%) | 50 (5.0%) |
| 10:00 AM to 10:59 AM | 21 (2.1%) | 43 (4.3%) |
| 11:00 AM to 11:59 AM | 45 (4.6%) | 9 (0.9%) |
| 12:00 PM to 3:59 PM | 10 (1.0%) | 27 (2.7%) |
| 4:00 PM to 11:59 PM | 11 (1.1%) | 28 (2.8%) |
| Total | 979 (100.0%) | 992 (100.0%) |
Housing Occupancy in Lambertville
Occupancy by Ownership in Lambertville
Of the total 2,012 dwellings in Lambertville, owner-occupied units account for 1,418 (70.5%), while renter-occupied units make up 594 (29.5%).
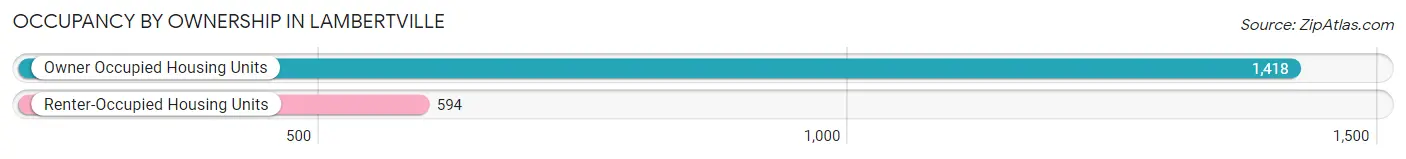
| Occupancy | # Housing Units | % Housing Units |
| Owner Occupied Housing Units | 1,418 | 70.5% |
| Renter-Occupied Housing Units | 594 | 29.5% |
| Total Occupied Housing Units | 2,012 | 100.0% |
Occupancy by Household Size in Lambertville
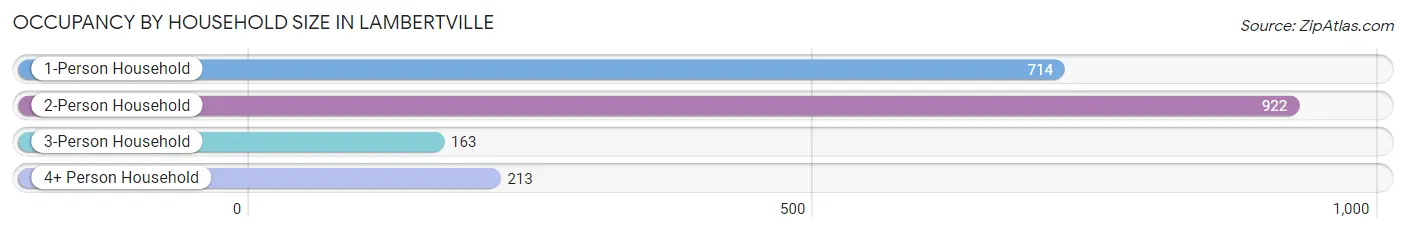
| Household Size | # Housing Units | % Housing Units |
| 1-Person Household | 714 | 35.5% |
| 2-Person Household | 922 | 45.8% |
| 3-Person Household | 163 | 8.1% |
| 4+ Person Household | 213 | 10.6% |
| Total Housing Units | 2,012 | 100.0% |
Occupancy by Ownership by Household Size in Lambertville
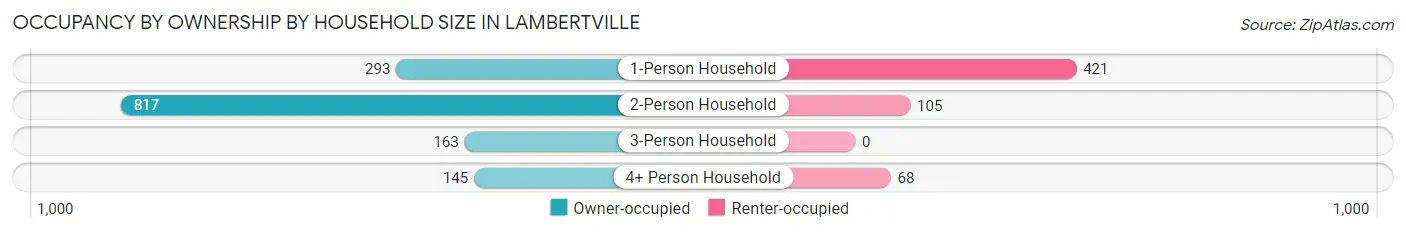
| Household Size | Owner-occupied | Renter-occupied |
| 1-Person Household | 293 (41.0%) | 421 (59.0%) |
| 2-Person Household | 817 (88.6%) | 105 (11.4%) |
| 3-Person Household | 163 (100.0%) | 0 (0.0%) |
| 4+ Person Household | 145 (68.1%) | 68 (31.9%) |
| Total Housing Units | 1,418 (70.5%) | 594 (29.5%) |
Occupancy by Educational Attainment in Lambertville
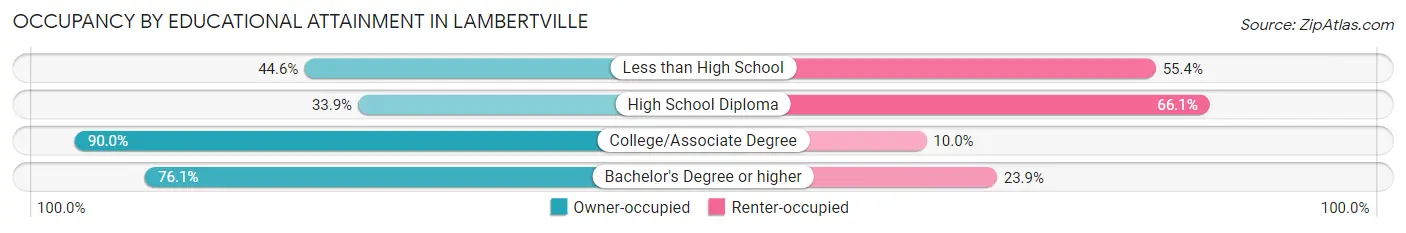
| Household Size | Owner-occupied | Renter-occupied |
| Less than High School | 78 (44.6%) | 97 (55.4%) |
| High School Diploma | 78 (33.9%) | 152 (66.1%) |
| College/Associate Degree | 253 (90.0%) | 28 (10.0%) |
| Bachelor's Degree or higher | 1,009 (76.1%) | 317 (23.9%) |
Occupancy by Age of Householder in Lambertville
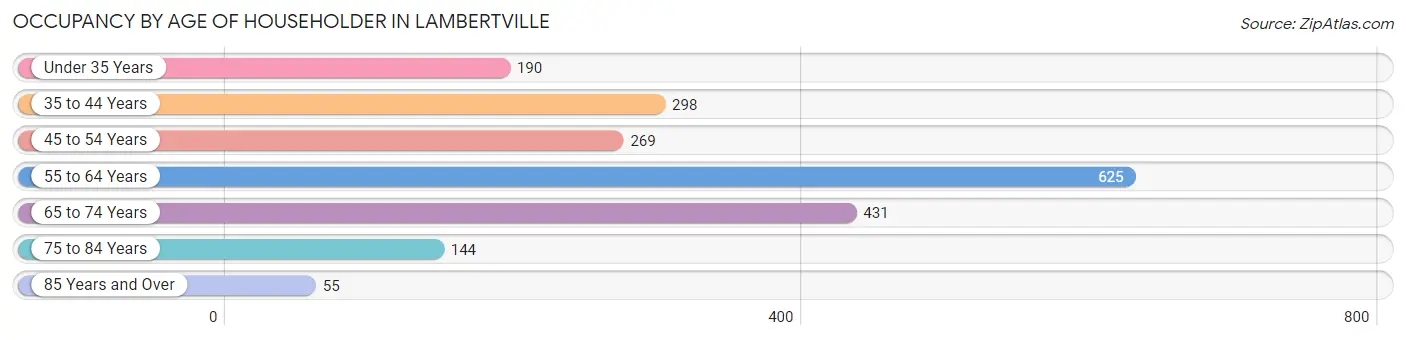
| Age Bracket | # Households | % Households |
| Under 35 Years | 190 | 9.4% |
| 35 to 44 Years | 298 | 14.8% |
| 45 to 54 Years | 269 | 13.4% |
| 55 to 64 Years | 625 | 31.1% |
| 65 to 74 Years | 431 | 21.4% |
| 75 to 84 Years | 144 | 7.2% |
| 85 Years and Over | 55 | 2.7% |
| Total | 2,012 | 100.0% |
Housing Finances in Lambertville
Median Income by Occupancy in Lambertville
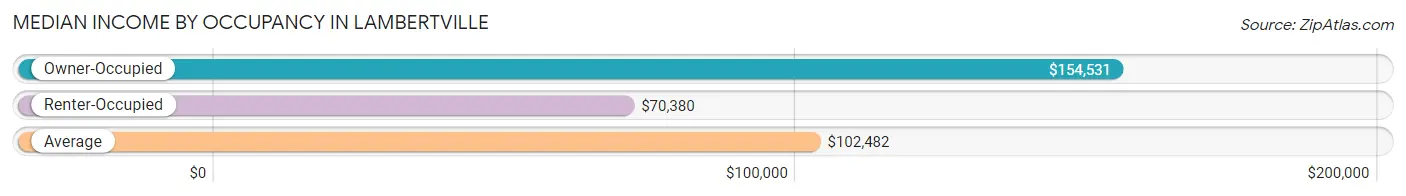
| Occupancy Type | # Households | Median Income |
| Owner-Occupied | 1,418 (70.5%) | $154,531 |
| Renter-Occupied | 594 (29.5%) | $70,380 |
| Average | 2,012 (100.0%) | $102,482 |
Occupancy by Householder Income Bracket in Lambertville
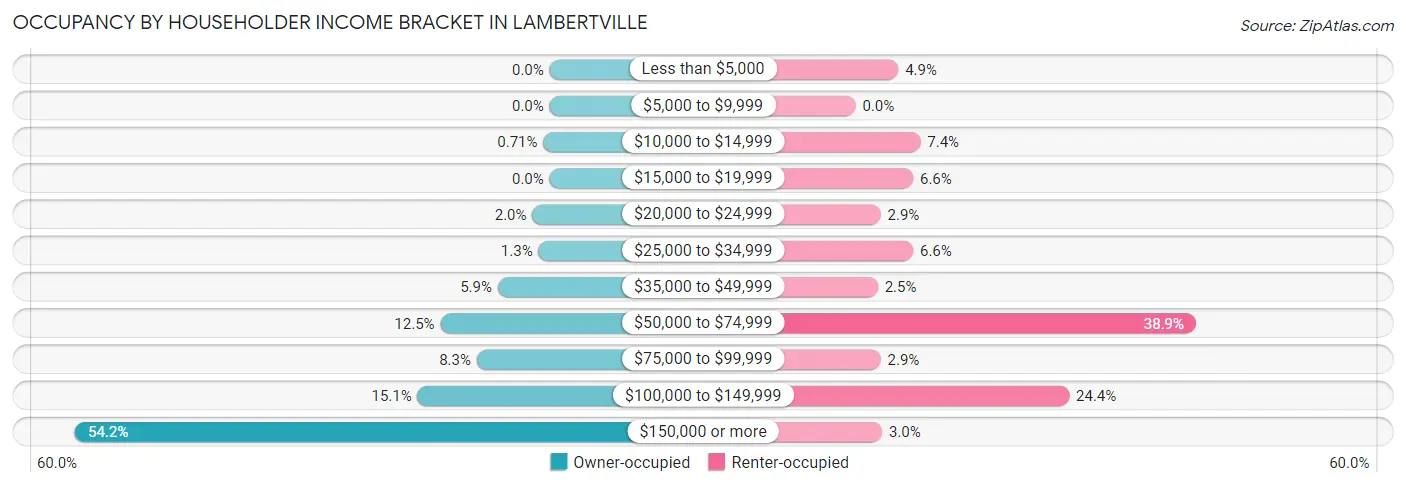
| Income Bracket | Owner-occupied | Renter-occupied |
| Less than $5,000 | 0 (0.0%) | 29 (4.9%) |
| $5,000 to $9,999 | 0 (0.0%) | 0 (0.0%) |
| $10,000 to $14,999 | 10 (0.7%) | 44 (7.4%) |
| $15,000 to $19,999 | 0 (0.0%) | 39 (6.6%) |
| $20,000 to $24,999 | 28 (2.0%) | 17 (2.9%) |
| $25,000 to $34,999 | 18 (1.3%) | 39 (6.6%) |
| $35,000 to $49,999 | 84 (5.9%) | 15 (2.5%) |
| $50,000 to $74,999 | 177 (12.5%) | 231 (38.9%) |
| $75,000 to $99,999 | 118 (8.3%) | 17 (2.9%) |
| $100,000 to $149,999 | 214 (15.1%) | 145 (24.4%) |
| $150,000 or more | 769 (54.2%) | 18 (3.0%) |
| Total | 1,418 (100.0%) | 594 (100.0%) |
Monthly Housing Cost Tiers in Lambertville
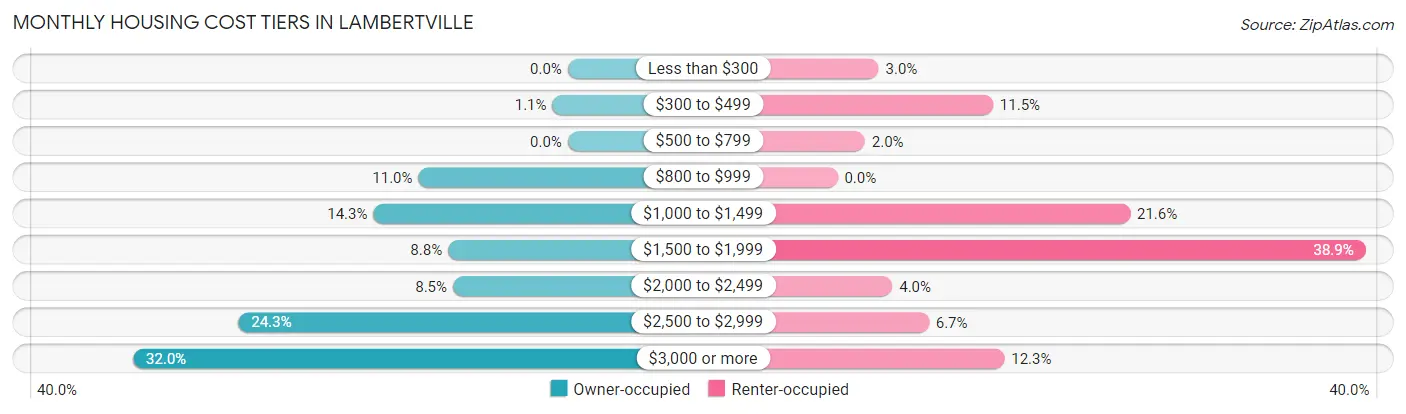
| Monthly Cost | Owner-occupied | Renter-occupied |
| Less than $300 | 0 (0.0%) | 18 (3.0%) |
| $300 to $499 | 16 (1.1%) | 68 (11.5%) |
| $500 to $799 | 0 (0.0%) | 12 (2.0%) |
| $800 to $999 | 156 (11.0%) | 0 (0.0%) |
| $1,000 to $1,499 | 203 (14.3%) | 128 (21.5%) |
| $1,500 to $1,999 | 125 (8.8%) | 231 (38.9%) |
| $2,000 to $2,499 | 120 (8.5%) | 24 (4.0%) |
| $2,500 to $2,999 | 344 (24.3%) | 40 (6.7%) |
| $3,000 or more | 454 (32.0%) | 73 (12.3%) |
| Total | 1,418 (100.0%) | 594 (100.0%) |
Physical Housing Characteristics in Lambertville
Housing Structures in Lambertville
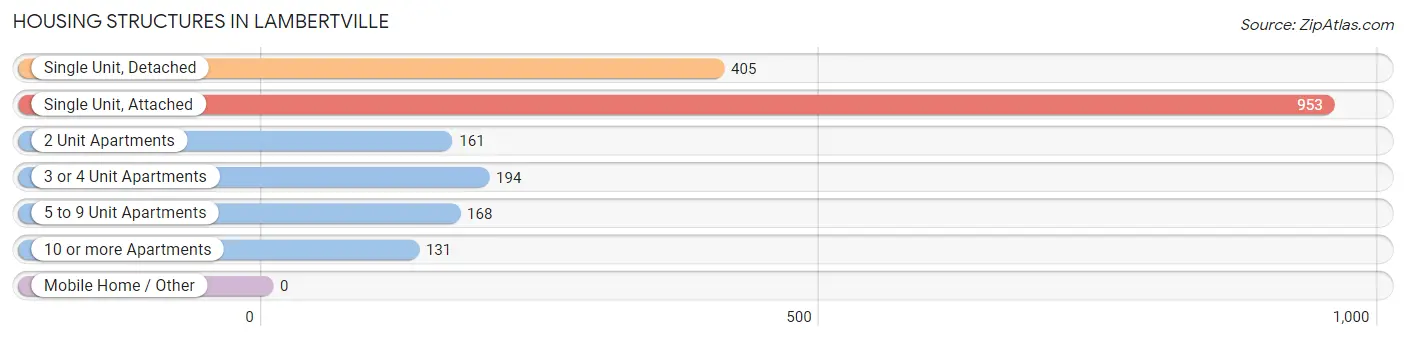
| Structure Type | # Housing Units | % Housing Units |
| Single Unit, Detached | 405 | 20.1% |
| Single Unit, Attached | 953 | 47.4% |
| 2 Unit Apartments | 161 | 8.0% |
| 3 or 4 Unit Apartments | 194 | 9.6% |
| 5 to 9 Unit Apartments | 168 | 8.4% |
| 10 or more Apartments | 131 | 6.5% |
| Mobile Home / Other | 0 | 0.0% |
| Total | 2,012 | 100.0% |
Housing Structures by Occupancy in Lambertville
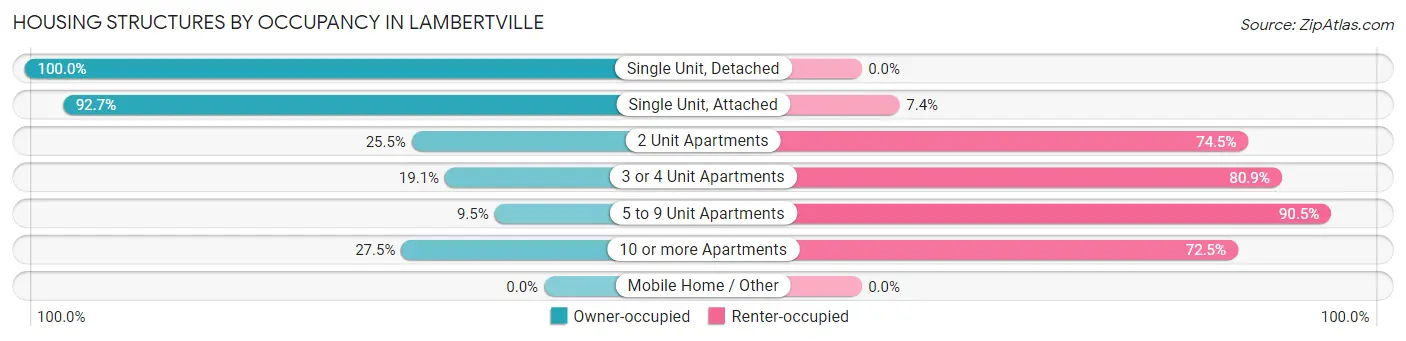
| Structure Type | Owner-occupied | Renter-occupied |
| Single Unit, Detached | 405 (100.0%) | 0 (0.0%) |
| Single Unit, Attached | 883 (92.6%) | 70 (7.3%) |
| 2 Unit Apartments | 41 (25.5%) | 120 (74.5%) |
| 3 or 4 Unit Apartments | 37 (19.1%) | 157 (80.9%) |
| 5 to 9 Unit Apartments | 16 (9.5%) | 152 (90.5%) |
| 10 or more Apartments | 36 (27.5%) | 95 (72.5%) |
| Mobile Home / Other | 0 (0.0%) | 0 (0.0%) |
| Total | 1,418 (70.5%) | 594 (29.5%) |
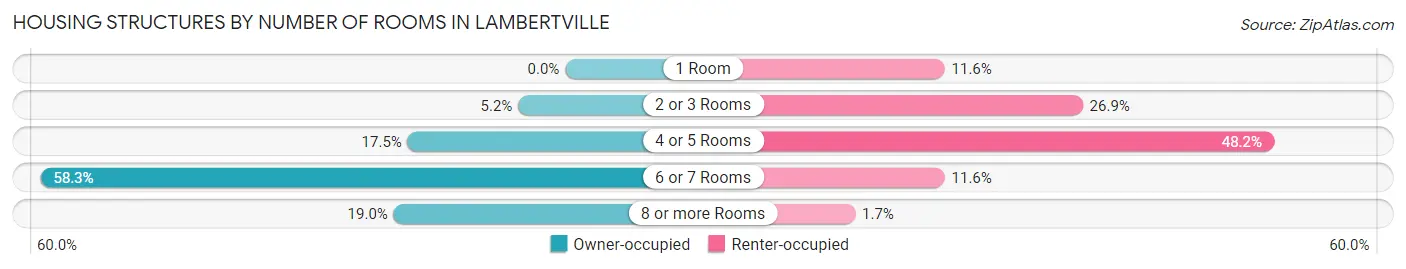
Housing Structures by Number of Rooms in Lambertville
| Number of Rooms | Owner-occupied | Renter-occupied |
| 1 Room | 0 (0.0%) | 69 (11.6%) |
| 2 or 3 Rooms | 74 (5.2%) | 160 (26.9%) |
| 4 or 5 Rooms | 248 (17.5%) | 286 (48.1%) |
| 6 or 7 Rooms | 826 (58.3%) | 69 (11.6%) |
| 8 or more Rooms | 270 (19.0%) | 10 (1.7%) |
| Total | 1,418 (100.0%) | 594 (100.0%) |
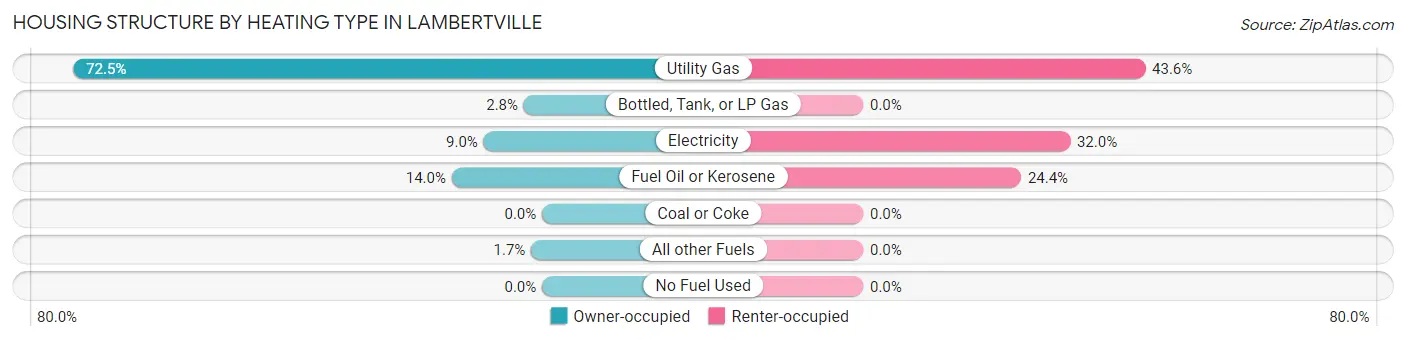
Housing Structure by Heating Type in Lambertville
| Heating Type | Owner-occupied | Renter-occupied |
| Utility Gas | 1,028 (72.5%) | 259 (43.6%) |
| Bottled, Tank, or LP Gas | 40 (2.8%) | 0 (0.0%) |
| Electricity | 128 (9.0%) | 190 (32.0%) |
| Fuel Oil or Kerosene | 198 (14.0%) | 145 (24.4%) |
| Coal or Coke | 0 (0.0%) | 0 (0.0%) |
| All other Fuels | 24 (1.7%) | 0 (0.0%) |
| No Fuel Used | 0 (0.0%) | 0 (0.0%) |
| Total | 1,418 (100.0%) | 594 (100.0%) |
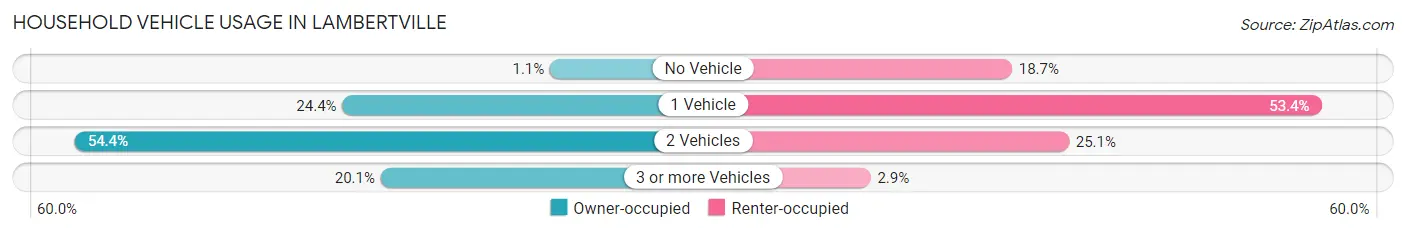
Household Vehicle Usage in Lambertville
| Vehicles per Household | Owner-occupied | Renter-occupied |
| No Vehicle | 16 (1.1%) | 111 (18.7%) |
| 1 Vehicle | 346 (24.4%) | 317 (53.4%) |
| 2 Vehicles | 771 (54.4%) | 149 (25.1%) |
| 3 or more Vehicles | 285 (20.1%) | 17 (2.9%) |
| Total | 1,418 (100.0%) | 594 (100.0%) |
Real Estate & Mortgages in Lambertville
Real Estate and Mortgage Overview in Lambertville
| Characteristic | Without Mortgage | With Mortgage |
| Housing Units | 372 | 1,046 |
| Median Property Value | $439,700 | $569,900 |
| Median Household Income | $95,536 | $654 |
| Monthly Housing Costs | $1,022 | $454 |
| Real Estate Taxes | $7,883 | $0 |
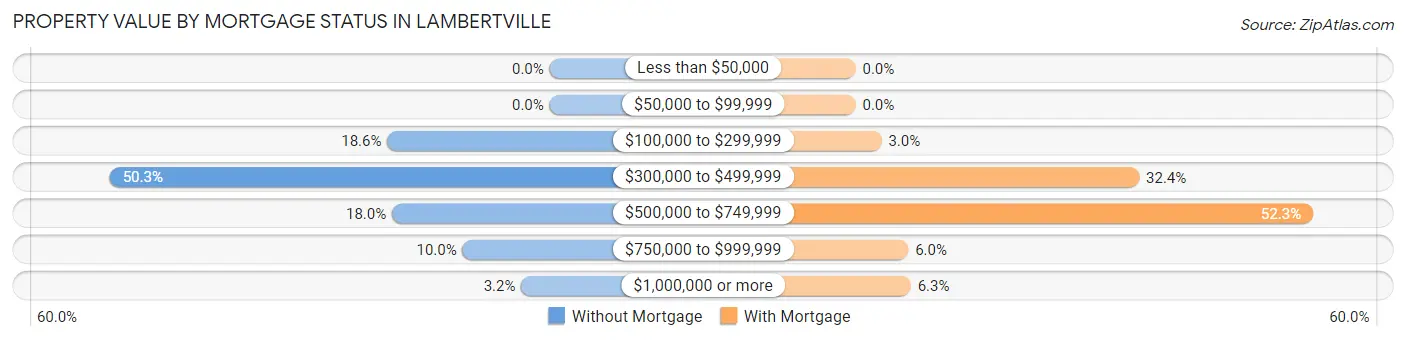
Property Value by Mortgage Status in Lambertville
| Property Value | Without Mortgage | With Mortgage |
| Less than $50,000 | 0 (0.0%) | 0 (0.0%) |
| $50,000 to $99,999 | 0 (0.0%) | 0 (0.0%) |
| $100,000 to $299,999 | 69 (18.5%) | 31 (3.0%) |
| $300,000 to $499,999 | 187 (50.3%) | 339 (32.4%) |
| $500,000 to $749,999 | 67 (18.0%) | 547 (52.3%) |
| $750,000 to $999,999 | 37 (10.0%) | 63 (6.0%) |
| $1,000,000 or more | 12 (3.2%) | 66 (6.3%) |
| Total | 372 (100.0%) | 1,046 (100.0%) |
Household Income by Mortgage Status in Lambertville
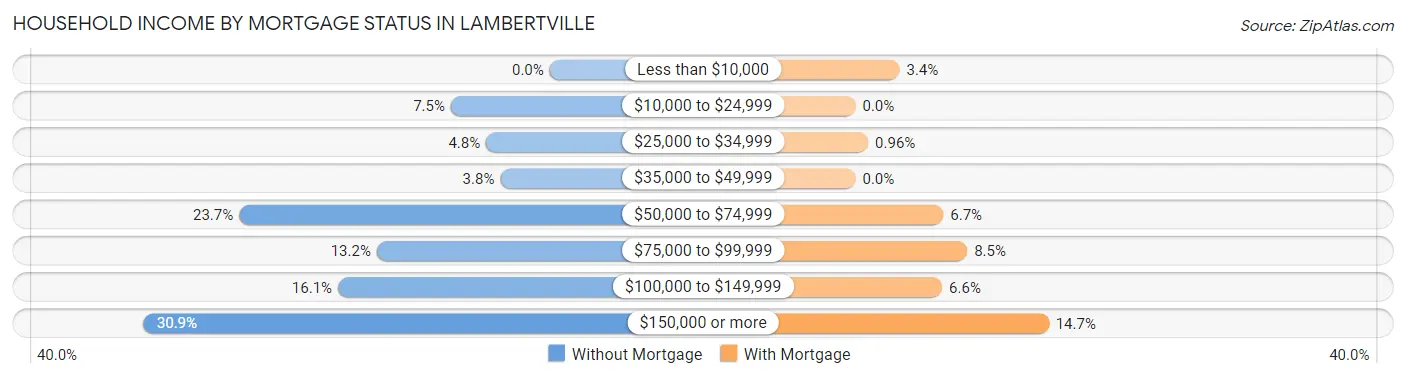
| Household Income | Without Mortgage | With Mortgage |
| Less than $10,000 | 0 (0.0%) | 35 (3.4%) |
| $10,000 to $24,999 | 28 (7.5%) | 0 (0.0%) |
| $25,000 to $34,999 | 18 (4.8%) | 10 (1.0%) |
| $35,000 to $49,999 | 14 (3.8%) | 0 (0.0%) |
| $50,000 to $74,999 | 88 (23.7%) | 70 (6.7%) |
| $75,000 to $99,999 | 49 (13.2%) | 89 (8.5%) |
| $100,000 to $149,999 | 60 (16.1%) | 69 (6.6%) |
| $150,000 or more | 115 (30.9%) | 154 (14.7%) |
| Total | 372 (100.0%) | 1,046 (100.0%) |
Property Value to Household Income Ratio in Lambertville
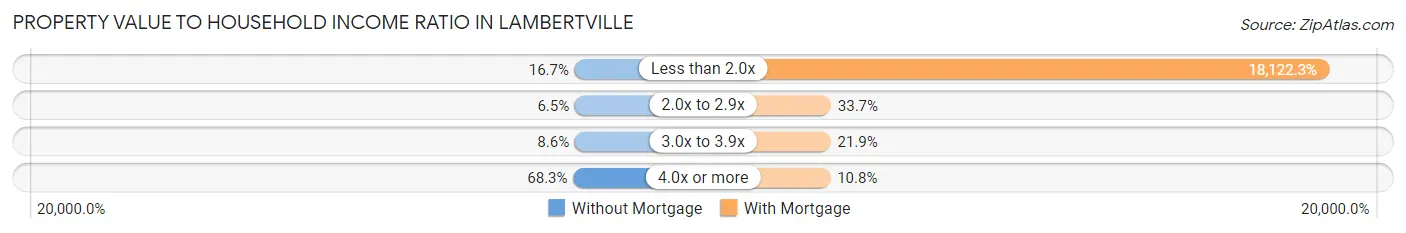
| Value-to-Income Ratio | Without Mortgage | With Mortgage |
| Less than 2.0x | 62 (16.7%) | 189,559 (18,122.3%) |
| 2.0x to 2.9x | 24 (6.5%) | 352 (33.7%) |
| 3.0x to 3.9x | 32 (8.6%) | 229 (21.9%) |
| 4.0x or more | 254 (68.3%) | 113 (10.8%) |
| Total | 372 (100.0%) | 1,046 (100.0%) |
Real Estate Taxes by Mortgage Status in Lambertville

| Property Taxes | Without Mortgage | With Mortgage |
| Less than $800 | 0 (0.0%) | 0 (0.0%) |
| $800 to $1,499 | 0 (0.0%) | 0 (0.0%) |
| $800 to $1,499 | 372 (100.0%) | 15 (1.4%) |
| Total | 372 (100.0%) | 1,046 (100.0%) |
Health & Disability in Lambertville
Health Insurance Coverage by Age in Lambertville
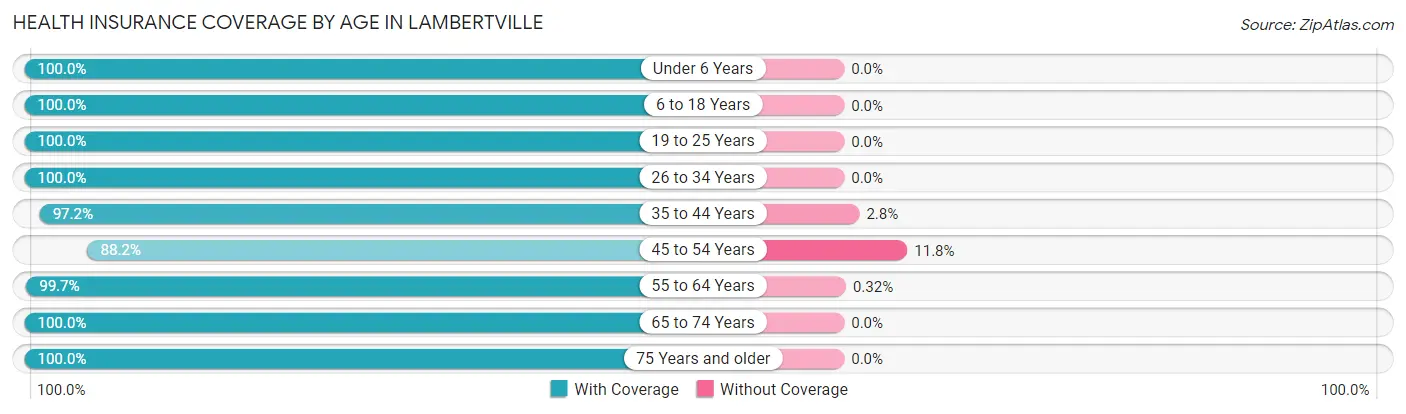
| Age Bracket | With Coverage | Without Coverage |
| Under 6 Years | 190 (100.0%) | 0 (0.0%) |
| 6 to 18 Years | 424 (100.0%) | 0 (0.0%) |
| 19 to 25 Years | 77 (100.0%) | 0 (0.0%) |
| 26 to 34 Years | 427 (100.0%) | 0 (0.0%) |
| 35 to 44 Years | 447 (97.2%) | 13 (2.8%) |
| 45 to 54 Years | 435 (88.2%) | 58 (11.8%) |
| 55 to 64 Years | 947 (99.7%) | 3 (0.3%) |
| 65 to 74 Years | 887 (100.0%) | 0 (0.0%) |
| 75 Years and older | 219 (100.0%) | 0 (0.0%) |
| Total | 4,053 (98.2%) | 74 (1.8%) |
Health Insurance Coverage by Citizenship Status in Lambertville
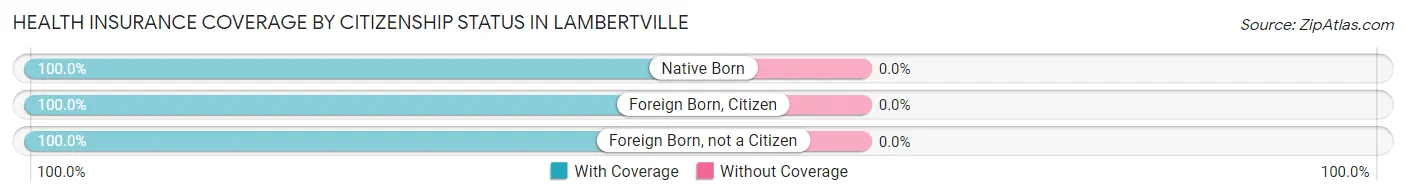
| Citizenship Status | With Coverage | Without Coverage |
| Native Born | 190 (100.0%) | 0 (0.0%) |
| Foreign Born, Citizen | 424 (100.0%) | 0 (0.0%) |
| Foreign Born, not a Citizen | 77 (100.0%) | 0 (0.0%) |
Health Insurance Coverage by Household Income in Lambertville
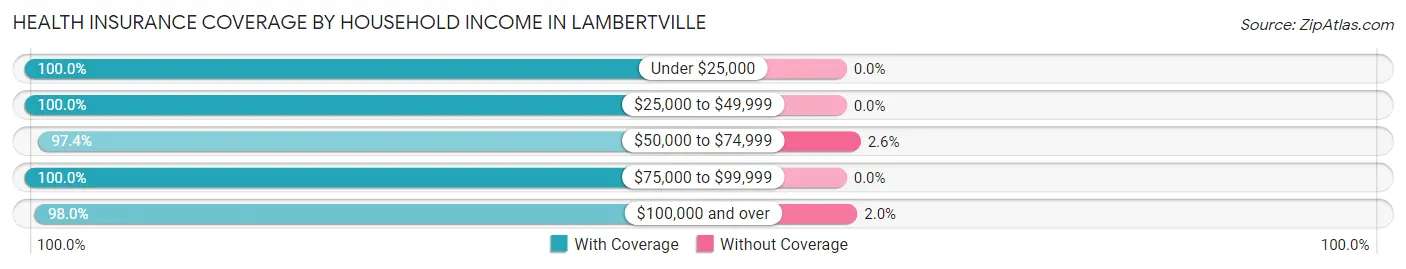
| Household Income | With Coverage | Without Coverage |
| Under $25,000 | 186 (100.0%) | 0 (0.0%) |
| $25,000 to $49,999 | 205 (100.0%) | 0 (0.0%) |
| $50,000 to $74,999 | 485 (97.4%) | 13 (2.6%) |
| $75,000 to $99,999 | 272 (100.0%) | 0 (0.0%) |
| $100,000 and over | 2,878 (98.0%) | 58 (2.0%) |
Public vs Private Health Insurance Coverage by Age in Lambertville
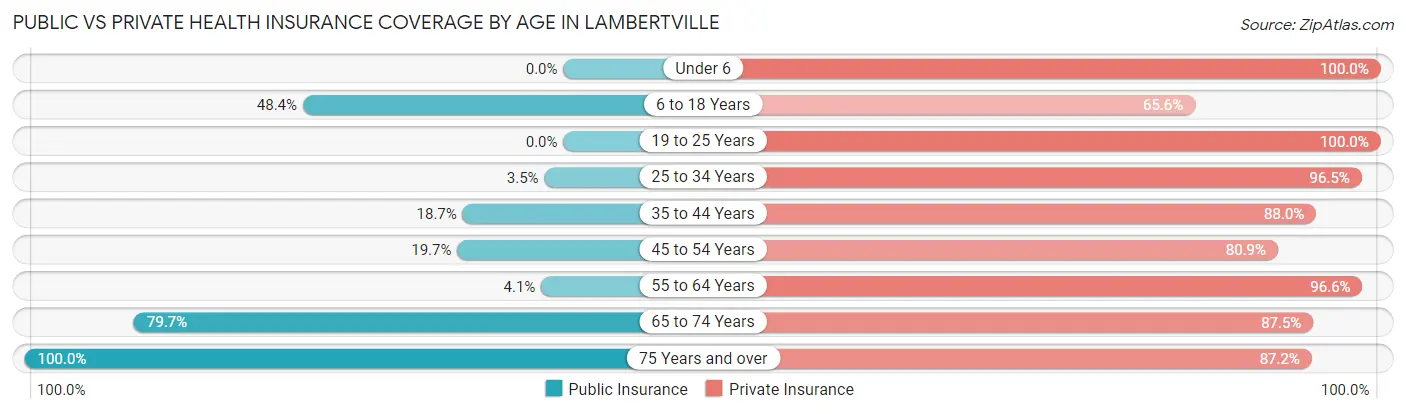
| Age Bracket | Public Insurance | Private Insurance |
| Under 6 | 0 (0.0%) | 190 (100.0%) |
| 6 to 18 Years | 205 (48.3%) | 278 (65.6%) |
| 19 to 25 Years | 0 (0.0%) | 77 (100.0%) |
| 25 to 34 Years | 15 (3.5%) | 412 (96.5%) |
| 35 to 44 Years | 86 (18.7%) | 405 (88.0%) |
| 45 to 54 Years | 97 (19.7%) | 399 (80.9%) |
| 55 to 64 Years | 39 (4.1%) | 918 (96.6%) |
| 65 to 74 Years | 707 (79.7%) | 776 (87.5%) |
| 75 Years and over | 219 (100.0%) | 191 (87.2%) |
| Total | 1,368 (33.2%) | 3,646 (88.3%) |
Disability Status by Sex by Age in Lambertville
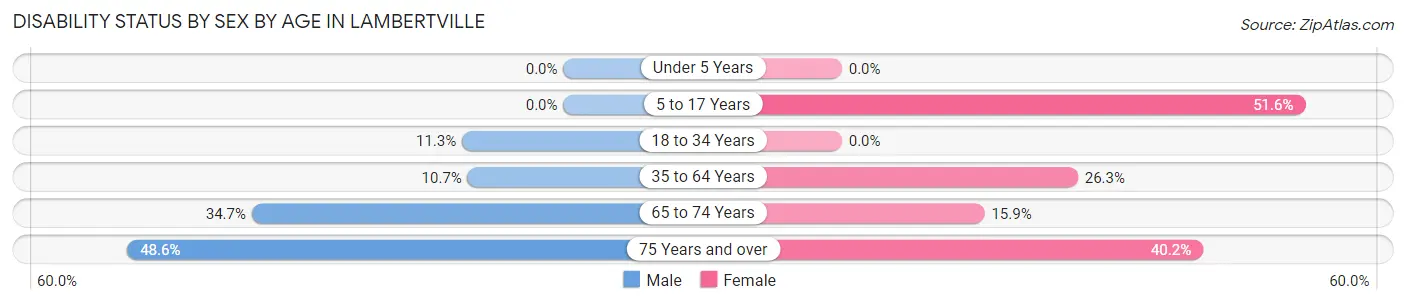
| Age Bracket | Male | Female |
| Under 5 Years | 0 (0.0%) | 0 (0.0%) |
| 5 to 17 Years | 0 (0.0%) | 80 (51.6%) |
| 18 to 34 Years | 38 (11.3%) | 0 (0.0%) |
| 35 to 64 Years | 82 (10.7%) | 298 (26.3%) |
| 65 to 74 Years | 203 (34.7%) | 48 (15.9%) |
| 75 Years and over | 17 (48.6%) | 74 (40.2%) |
Disability Class by Sex by Age in Lambertville
Disability Class: Hearing Difficulty
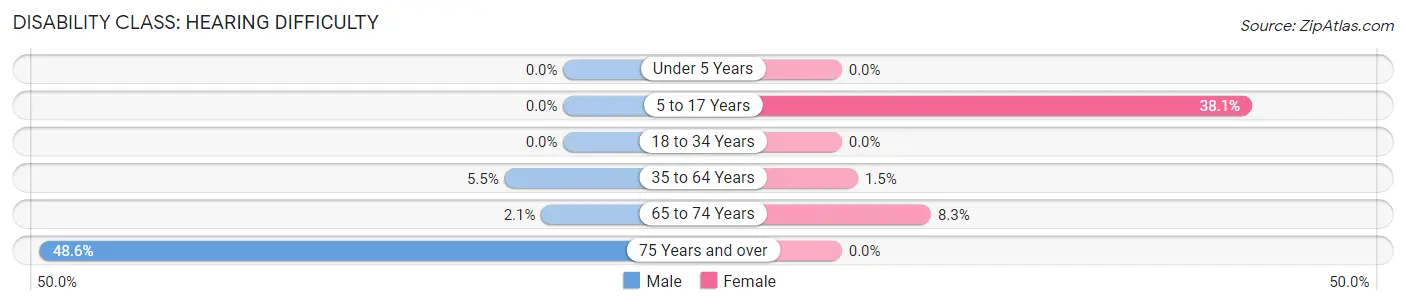
| Age Bracket | Male | Female |
| Under 5 Years | 0 (0.0%) | 0 (0.0%) |
| 5 to 17 Years | 0 (0.0%) | 59 (38.1%) |
| 18 to 34 Years | 0 (0.0%) | 0 (0.0%) |
| 35 to 64 Years | 42 (5.5%) | 17 (1.5%) |
| 65 to 74 Years | 12 (2.1%) | 25 (8.3%) |
| 75 Years and over | 17 (48.6%) | 0 (0.0%) |
Disability Class: Vision Difficulty
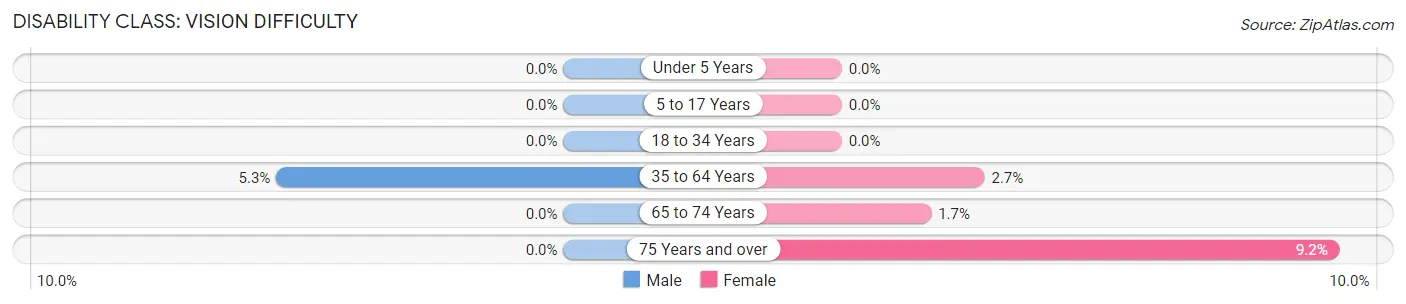
| Age Bracket | Male | Female |
| Under 5 Years | 0 (0.0%) | 0 (0.0%) |
| 5 to 17 Years | 0 (0.0%) | 0 (0.0%) |
| 18 to 34 Years | 0 (0.0%) | 0 (0.0%) |
| 35 to 64 Years | 41 (5.3%) | 30 (2.6%) |
| 65 to 74 Years | 0 (0.0%) | 5 (1.7%) |
| 75 Years and over | 0 (0.0%) | 17 (9.2%) |
Disability Class: Cognitive Difficulty
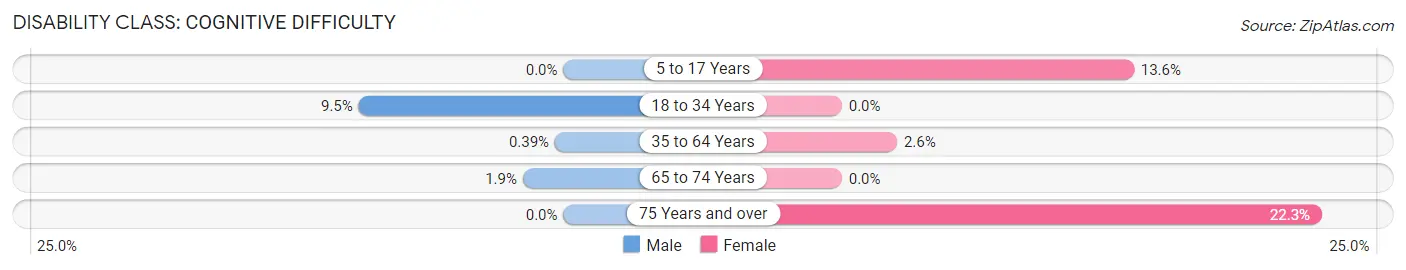
| Age Bracket | Male | Female |
| 5 to 17 Years | 0 (0.0%) | 21 (13.6%) |
| 18 to 34 Years | 32 (9.5%) | 0 (0.0%) |
| 35 to 64 Years | 3 (0.4%) | 29 (2.6%) |
| 65 to 74 Years | 11 (1.9%) | 0 (0.0%) |
| 75 Years and over | 0 (0.0%) | 41 (22.3%) |
Disability Class: Ambulatory Difficulty
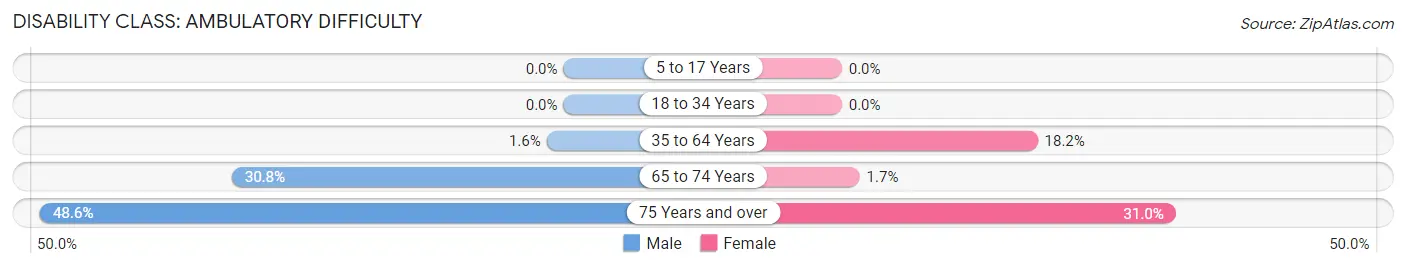
| Age Bracket | Male | Female |
| 5 to 17 Years | 0 (0.0%) | 0 (0.0%) |
| 18 to 34 Years | 0 (0.0%) | 0 (0.0%) |
| 35 to 64 Years | 12 (1.6%) | 206 (18.2%) |
| 65 to 74 Years | 180 (30.8%) | 5 (1.7%) |
| 75 Years and over | 17 (48.6%) | 57 (31.0%) |
Disability Class: Self-Care Difficulty
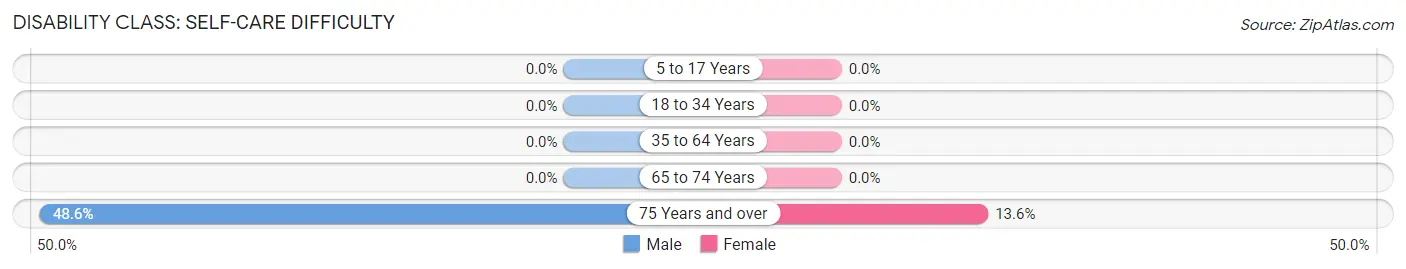
| Age Bracket | Male | Female |
| 5 to 17 Years | 0 (0.0%) | 0 (0.0%) |
| 18 to 34 Years | 0 (0.0%) | 0 (0.0%) |
| 35 to 64 Years | 0 (0.0%) | 0 (0.0%) |
| 65 to 74 Years | 0 (0.0%) | 0 (0.0%) |
| 75 Years and over | 17 (48.6%) | 25 (13.6%) |
Technology Access in Lambertville
Computing Device Access in Lambertville
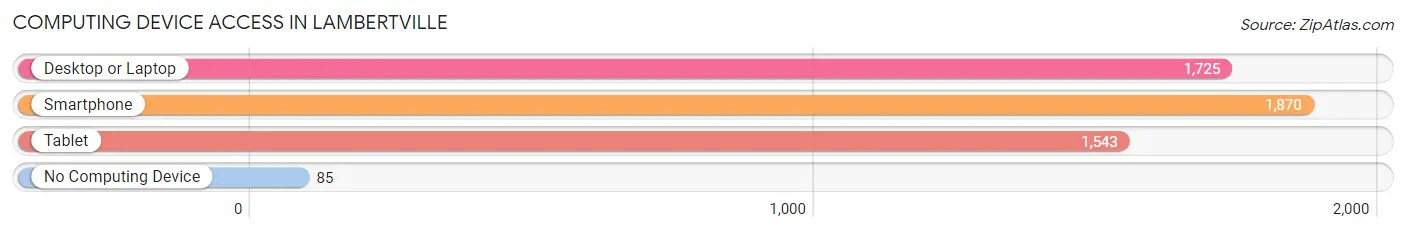
| Device Type | # Households | % Households |
| Desktop or Laptop | 1,725 | 85.7% |
| Smartphone | 1,870 | 92.9% |
| Tablet | 1,543 | 76.7% |
| No Computing Device | 85 | 4.2% |
| Total | 2,012 | 100.0% |
Internet Access in Lambertville
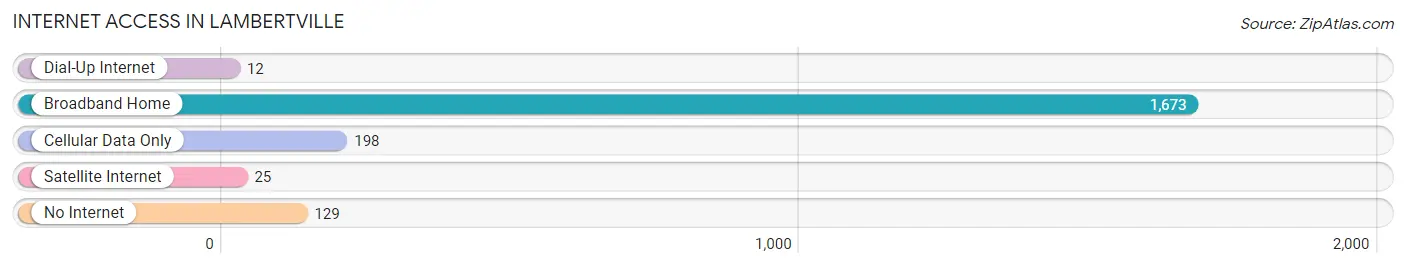
| Internet Type | # Households | % Households |
| Dial-Up Internet | 12 | 0.6% |
| Broadband Home | 1,673 | 83.2% |
| Cellular Data Only | 198 | 9.8% |
| Satellite Internet | 25 | 1.2% |
| No Internet | 129 | 6.4% |
| Total | 2,012 | 100.0% |
Lambertville Summary
Lambertville is a city located in Hunterdon County, New Jersey, United States. It is situated along the Delaware River, just across from New Hope, Pennsylvania. The city is known for its quaint downtown area, which is home to many antique shops, art galleries, and restaurants. As of the 2010 United States Census, the city had a total population of 3,906, reflecting an increase of 805 (+25.9%) from the 3,101 counted in the 2000 Census, which had in turn increased by 599 (+23.8%) from the 2,502 counted in the 1990 Census.
History
Lambertville was originally known as Coryell's Ferry, named after the Coryell family who ran a ferry across the Delaware River to New Hope, Pennsylvania. The town was renamed Lambertville in 1814 in honor of John Lambert, a local landowner.
In the early 19th century, Lambertville was a center of industry, with several mills and factories located along the Delaware River. The town was also a major stop on the Delaware and Raritan Canal, which connected the Delaware River to the Raritan River. The canal was used to transport coal, lumber, and other goods.
In the late 19th century, Lambertville became a popular tourist destination, with many visitors coming to enjoy the town's picturesque setting and its many shops and restaurants. The town's popularity as a tourist destination has continued to this day.
Geography
Lambertville is located at 40°21'17" North, 74°57'45" West (40.354722, -74.962500). According to the United States Census Bureau, the city has a total area of 2.2 square miles (5.7 km2), all of it land.
Economy
Lambertville is a popular tourist destination, with many visitors coming to enjoy the town's picturesque setting and its many shops and restaurants. The city is also home to several small businesses, including antique shops, art galleries, and specialty stores.
The city is also home to several large employers, including the Hunterdon Medical Center, a hospital and medical center; the Lambertville Public School District; and the Hunterdon County government.
Demographics
As of the 2010 United States Census, there were 3,906 people, 1,717 households, and 990 families residing in the city. The population density was 1,764.2 per square mile (683.2/km2). There were 1,845 housing units at an average density of 830.2 per square mile (320.7/km2). The racial makeup of the city was 91.2% White, 2.2% African American, 0.2% Native American, 2.2% Asian, 0.0% Pacific Islander, 2.2% from other races, and 2.2% from two or more races. Hispanic or Latino of any race were 8.2% of the population.
There were 1,717 households, out of which 24.2% had children under the age of 18 living with them, 44.2% were married couples living together, 10.2% had a female householder with no husband present, and 41.2% were non-families. 34.2% of all households were made up of individuals, and 12.2% had someone living alone who was 65 years of age or older. The average household size was 2.26 and the average family size was 2.93.
In the city, the population was spread out, with 20.2% under the age of 18, 7.2% from 18 to 24, 30.2% from 25 to 44, 27.2% from 45 to 64, and 15.2% who were 65 years of age or older. The median age was 40 years. For every 100 females, there were 91.2 males. For every 100 females age 18 and over, there were 88.2 males.
The median income for a household in the city was $50,972, and the median income for a family was $63,125. Males had a median income of $45,972 versus $35,625 for females. The per capita income for the city was $27,972. About 4.2% of families and 6.2% of the population were below the poverty line, including 8.2% of those under age 18 and 5.2% of those age 65 or over.
Common Questions
What is Per Capita Income in Lambertville?
Per Capita income in Lambertville is $85,160.
What is the Median Family Income in Lambertville?
Median Family Income in Lambertville is $152,024.
What is the Median Household income in Lambertville?
Median Household Income in Lambertville is $102,482.
What is Income or Wage Gap in Lambertville?
Income or Wage Gap in Lambertville is 7.5%.
Women in Lambertville earn 92.5 cents for every dollar earned by a man.
What is Inequality or Gini Index in Lambertville?
Inequality or Gini Index in Lambertville is 0.49.
What is the Total Population of Lambertville?
Total Population of Lambertville is 4,127.
What is the Total Male Population of Lambertville?
Total Male Population of Lambertville is 1,969.
What is the Total Female Population of Lambertville?
Total Female Population of Lambertville is 2,158.
What is the Ratio of Males per 100 Females in Lambertville?
There are 91.24 Males per 100 Females in Lambertville.
What is the Ratio of Females per 100 Males in Lambertville?
There are 109.60 Females per 100 Males in Lambertville.
What is the Median Population Age in Lambertville?
Median Population Age in Lambertville is 54.8 Years.
What is the Average Family Size in Lambertville
Average Family Size in Lambertville is 2.8 People.
What is the Average Household Size in Lambertville
Average Household Size in Lambertville is 2.0 People.
How Large is the Labor Force in Lambertville?
There are 2,710 People in the Labor Forcein in Lambertville.
What is the Percentage of People in the Labor Force in Lambertville?
73.0% of People are in the Labor Force in Lambertville.
What is the Unemployment Rate in Lambertville?
Unemployment Rate in Lambertville is 5.8%.