Perth Amboy, NJ Map & Demographics
Perth Amboy Map
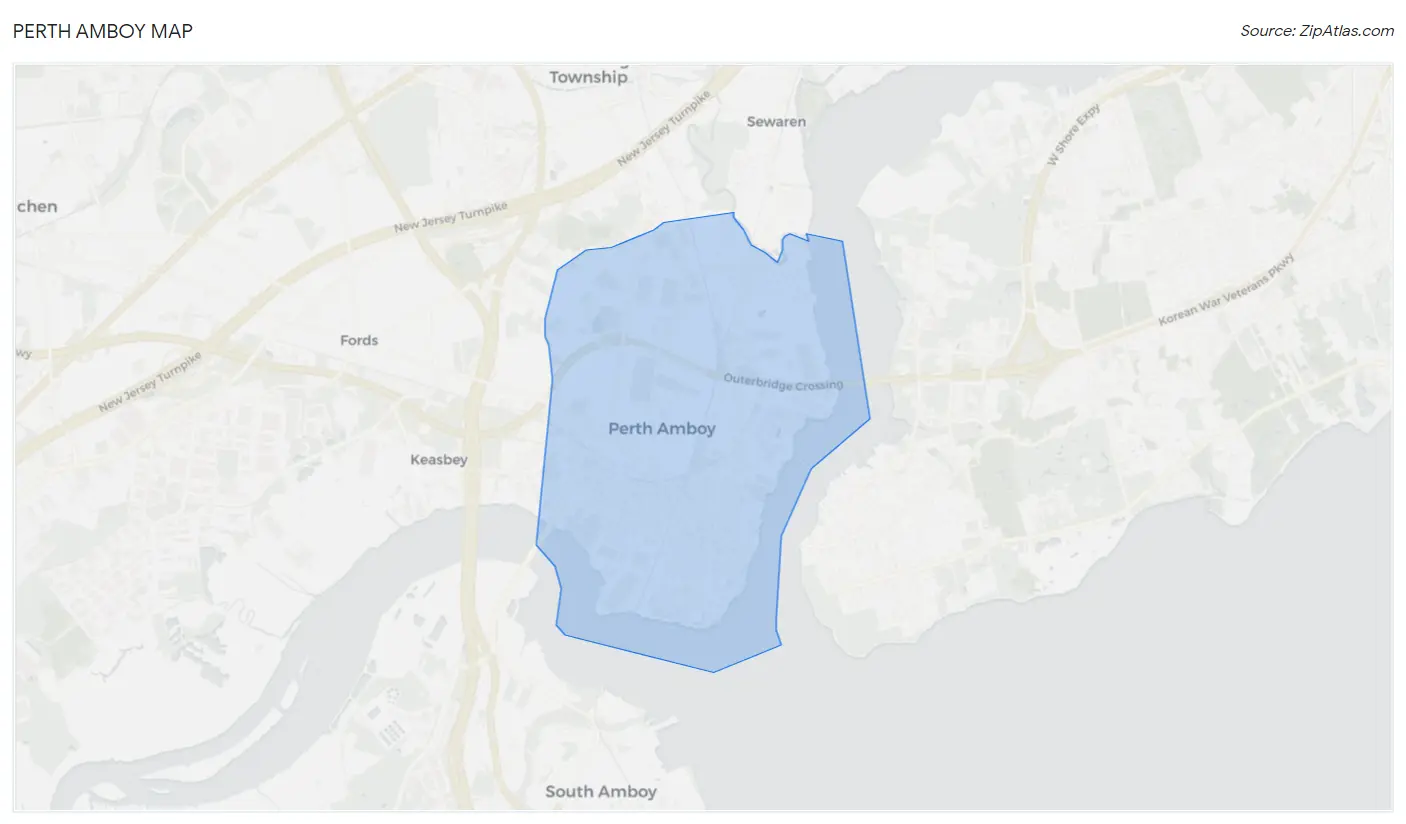
Perth Amboy Overview
$25,853
PER CAPITA INCOME
$55,129
AVG FAMILY INCOME
$56,239
AVG HOUSEHOLD INCOME
29.6%
WAGE / INCOME GAP [ % ]
70.4¢/ $1
WAGE / INCOME GAP [ $ ]
$9,962
FAMILY INCOME DEFICIT
0.45
INEQUALITY / GINI INDEX
55,226
TOTAL POPULATION
27,133
MALE POPULATION
28,093
FEMALE POPULATION
96.58
MALES / 100 FEMALES
103.54
FEMALES / 100 MALES
36.0
MEDIAN AGE
3.4
AVG FAMILY SIZE
3.0
AVG HOUSEHOLD SIZE
28,766
LABOR FORCE [ PEOPLE ]
65.0%
PERCENT IN LABOR FORCE
11.3%
UNEMPLOYMENT RATE
Perth Amboy Zip Codes
Income in Perth Amboy
Income Overview in Perth Amboy
Per Capita Income in Perth Amboy is $25,853, while median incomes of families and households are $55,129 and $56,239 respectively.
| Characteristic | Number | Measure |
| Per Capita Income | 55,226 | $25,853 |
| Median Family Income | 13,187 | $55,129 |
| Mean Family Income | 13,187 | $77,279 |
| Median Household Income | 18,409 | $56,239 |
| Mean Household Income | 18,409 | $76,359 |
| Income Deficit | 13,187 | $9,962 |
| Wage / Income Gap (%) | 55,226 | 29.56% |
| Wage / Income Gap ($) | 55,226 | 70.44¢ per $1 |
| Gini / Inequality Index | 55,226 | 0.45 |
Earnings by Sex in Perth Amboy
Average Earnings in Perth Amboy are $31,535, $36,584 for men and $25,770 for women, a difference of 29.6%.
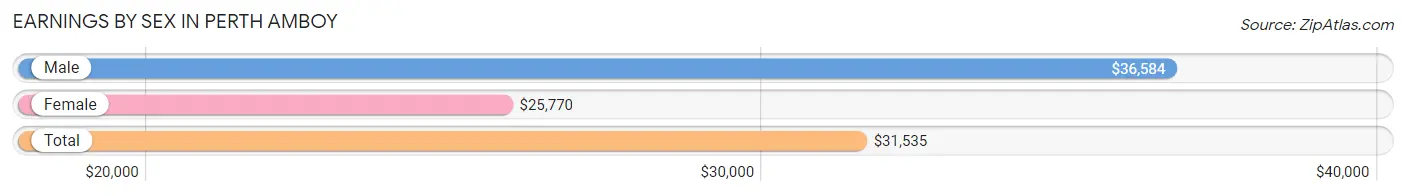
| Sex | Number | Average Earnings |
| Male | 15,164 (53.2%) | $36,584 |
| Female | 13,346 (46.8%) | $25,770 |
| Total | 28,510 (100.0%) | $31,535 |
Earnings by Sex by Income Bracket in Perth Amboy
The most common earnings brackets in Perth Amboy are $30,000 to $34,999 for men (1,555 | 10.2%) and $25,000 to $29,999 for women (1,310 | 9.8%).
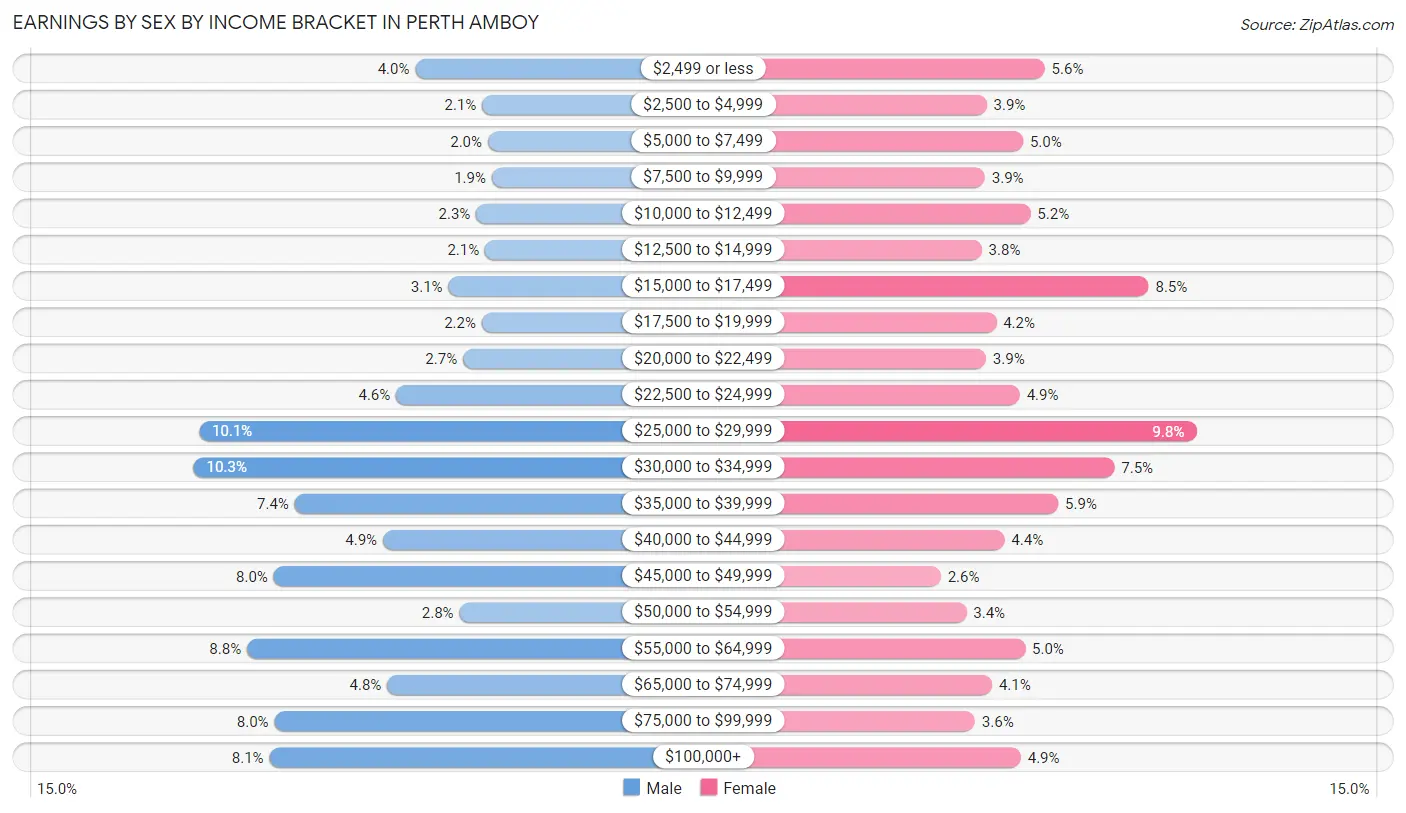
| Income | Male | Female |
| $2,499 or less | 609 (4.0%) | 742 (5.6%) |
| $2,500 to $4,999 | 324 (2.1%) | 524 (3.9%) |
| $5,000 to $7,499 | 301 (2.0%) | 661 (5.0%) |
| $7,500 to $9,999 | 283 (1.9%) | 518 (3.9%) |
| $10,000 to $12,499 | 351 (2.3%) | 688 (5.2%) |
| $12,500 to $14,999 | 313 (2.1%) | 506 (3.8%) |
| $15,000 to $17,499 | 469 (3.1%) | 1,132 (8.5%) |
| $17,500 to $19,999 | 326 (2.1%) | 560 (4.2%) |
| $20,000 to $22,499 | 407 (2.7%) | 522 (3.9%) |
| $22,500 to $24,999 | 691 (4.6%) | 649 (4.9%) |
| $25,000 to $29,999 | 1,531 (10.1%) | 1,310 (9.8%) |
| $30,000 to $34,999 | 1,555 (10.2%) | 1,003 (7.5%) |
| $35,000 to $39,999 | 1,124 (7.4%) | 793 (5.9%) |
| $40,000 to $44,999 | 747 (4.9%) | 591 (4.4%) |
| $45,000 to $49,999 | 1,213 (8.0%) | 352 (2.6%) |
| $50,000 to $54,999 | 421 (2.8%) | 448 (3.4%) |
| $55,000 to $64,999 | 1,327 (8.7%) | 669 (5.0%) |
| $65,000 to $74,999 | 730 (4.8%) | 545 (4.1%) |
| $75,000 to $99,999 | 1,210 (8.0%) | 480 (3.6%) |
| $100,000+ | 1,232 (8.1%) | 653 (4.9%) |
| Total | 15,164 (100.0%) | 13,346 (100.0%) |
Earnings by Sex by Educational Attainment in Perth Amboy
Average earnings in Perth Amboy are $42,404 for men and $28,717 for women, a difference of 32.3%. Men with an educational attainment of graduate degree enjoy the highest average annual earnings of $80,012, while those with less than high school education earn the least with $36,153. Women with an educational attainment of graduate degree earn the most with the average annual earnings of $72,726, while those with less than high school education have the smallest earnings of $22,342.
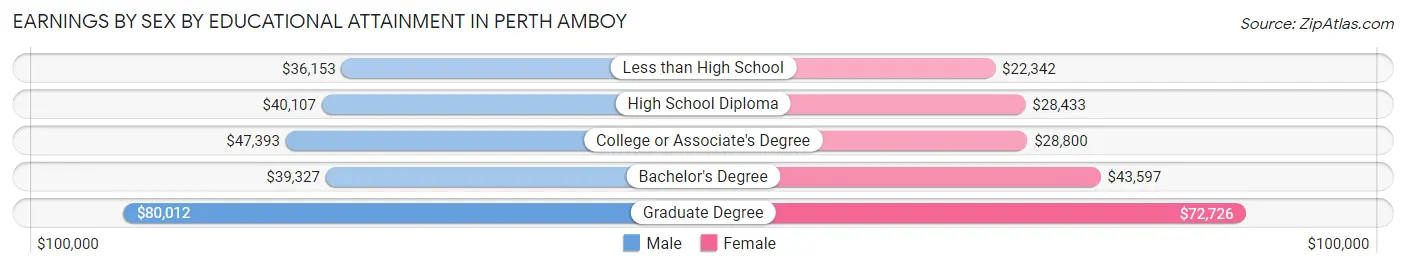
| Educational Attainment | Male Income | Female Income |
| Less than High School | $36,153 | $22,342 |
| High School Diploma | $40,107 | $28,433 |
| College or Associate's Degree | $47,393 | $28,800 |
| Bachelor's Degree | $39,327 | $43,597 |
| Graduate Degree | $80,012 | $72,726 |
| Total | $42,404 | $28,717 |
Family Income in Perth Amboy
Family Income Brackets in Perth Amboy
According to the Perth Amboy family income data, there are 2,479 families falling into the $35,000 to $49,999 income range, which is the most common income bracket and makes up 18.8% of all families. Conversely, the $10,000 to $14,999 income bracket is the least frequent group with only 422 families (3.2%) belonging to this category.
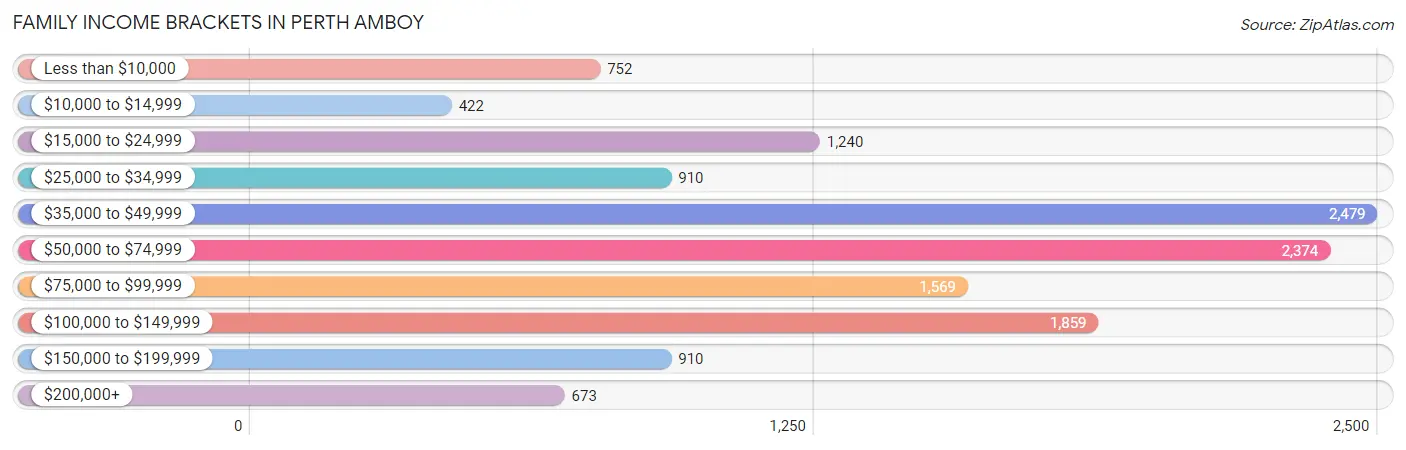
| Income Bracket | # Families | % Families |
| Less than $10,000 | 752 | 5.7% |
| $10,000 to $14,999 | 422 | 3.2% |
| $15,000 to $24,999 | 1,240 | 9.4% |
| $25,000 to $34,999 | 910 | 6.9% |
| $35,000 to $49,999 | 2,479 | 18.8% |
| $50,000 to $74,999 | 2,374 | 18.0% |
| $75,000 to $99,999 | 1,569 | 11.9% |
| $100,000 to $149,999 | 1,859 | 14.1% |
| $150,000 to $199,999 | 910 | 6.9% |
| $200,000+ | 673 | 5.1% |
Family Income by Famaliy Size in Perth Amboy
7+ person families (393 | 3.0%) account for the highest median family income in Perth Amboy with $133,652 per family, while 2-person families (4,316 | 32.7%) have the highest median income of $23,722 per family member.
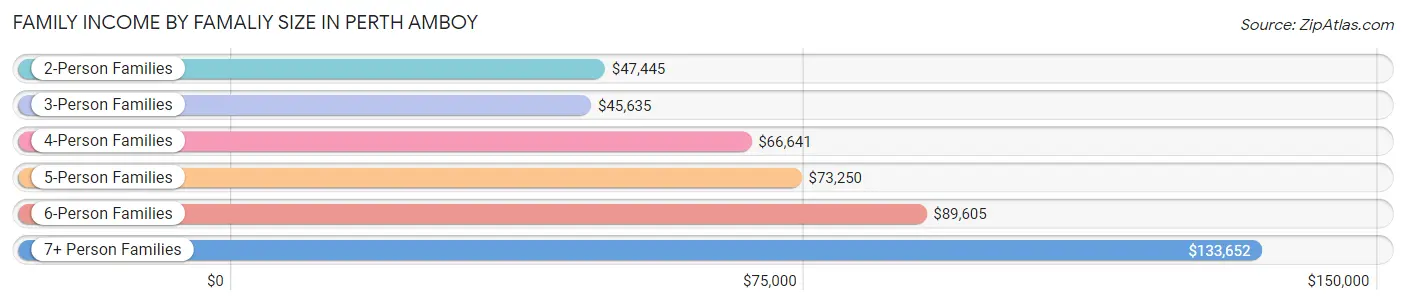
| Income Bracket | # Families | Median Income |
| 2-Person Families | 4,316 (32.7%) | $47,445 |
| 3-Person Families | 3,972 (30.1%) | $45,635 |
| 4-Person Families | 2,379 (18.0%) | $66,641 |
| 5-Person Families | 1,719 (13.0%) | $73,250 |
| 6-Person Families | 408 (3.1%) | $89,605 |
| 7+ Person Families | 393 (3.0%) | $133,652 |
| Total | 13,187 (100.0%) | $55,129 |
Family Income by Number of Earners in Perth Amboy
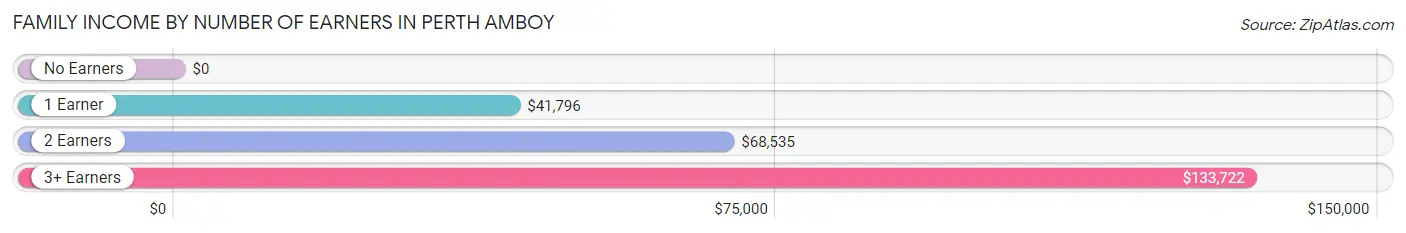
| Number of Earners | # Families | Median Income |
| No Earners | 1,442 (10.9%) | $0 |
| 1 Earner | 5,168 (39.2%) | $41,796 |
| 2 Earners | 4,216 (32.0%) | $68,535 |
| 3+ Earners | 2,361 (17.9%) | $133,722 |
| Total | 13,187 (100.0%) | $55,129 |
Household Income in Perth Amboy
Household Income Brackets in Perth Amboy
With 2,890 households falling in the category, the $35,000 to $49,999 income range is the most frequent in Perth Amboy, accounting for 15.7% of all households. In contrast, only 902 households (4.9%) fall into the $200,000+ income bracket, making it the least populous group.
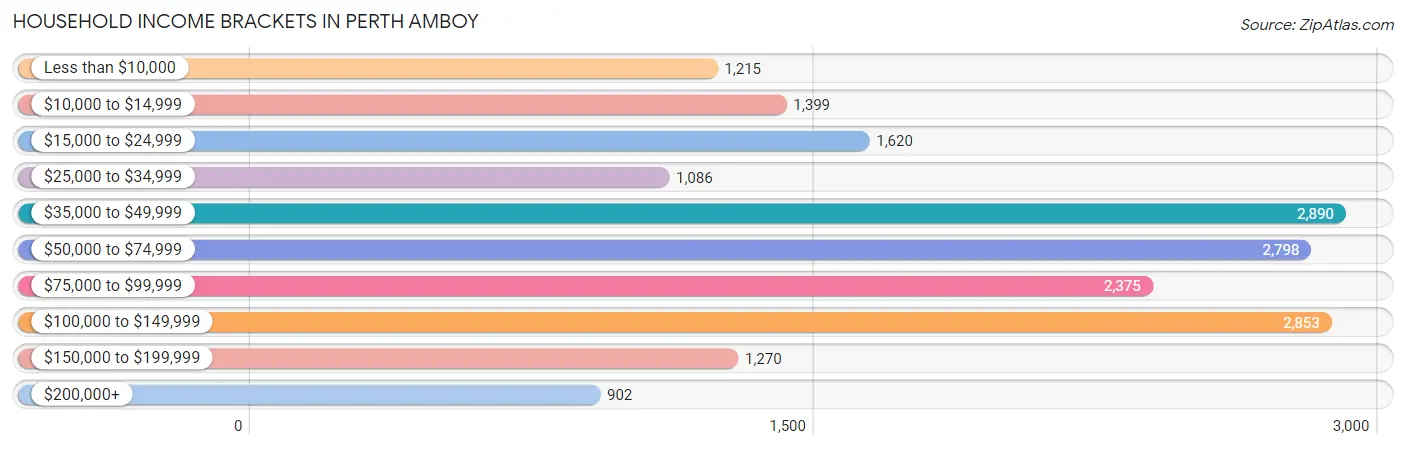
| Income Bracket | # Households | % Households |
| Less than $10,000 | 1,215 | 6.6% |
| $10,000 to $14,999 | 1,399 | 7.6% |
| $15,000 to $24,999 | 1,620 | 8.8% |
| $25,000 to $34,999 | 1,086 | 5.9% |
| $35,000 to $49,999 | 2,890 | 15.7% |
| $50,000 to $74,999 | 2,798 | 15.2% |
| $75,000 to $99,999 | 2,375 | 12.9% |
| $100,000 to $149,999 | 2,853 | 15.5% |
| $150,000 to $199,999 | 1,270 | 6.9% |
| $200,000+ | 902 | 4.9% |
Household Income by Householder Age in Perth Amboy
The median household income in Perth Amboy is $56,239, with the highest median household income of $64,761 found in the 25 to 44 years age bracket for the primary householder. A total of 6,173 households (33.5%) fall into this category. Meanwhile, the 65+ years age bracket for the primary householder has the lowest median household income of $39,203, with 3,757 households (20.4%) in this group.
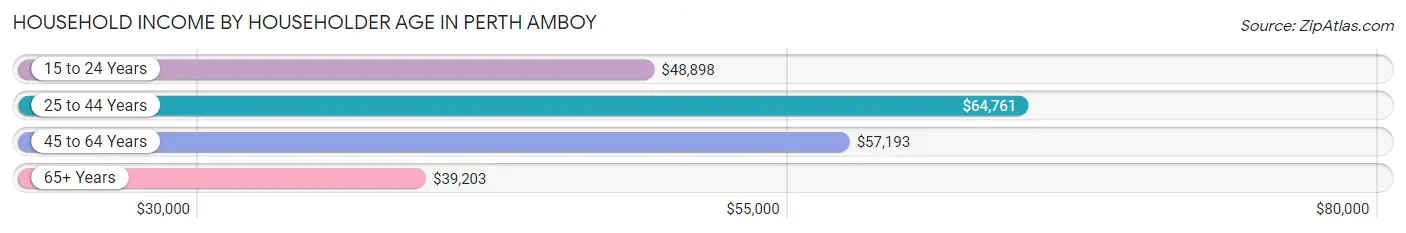
| Income Bracket | # Households | Median Income |
| 15 to 24 Years | 606 (3.3%) | $48,898 |
| 25 to 44 Years | 6,173 (33.5%) | $64,761 |
| 45 to 64 Years | 7,873 (42.8%) | $57,193 |
| 65+ Years | 3,757 (20.4%) | $39,203 |
| Total | 18,409 (100.0%) | $56,239 |
Poverty in Perth Amboy
Income Below Poverty by Sex and Age in Perth Amboy
With 14.7% poverty level for males and 24.6% for females among the residents of Perth Amboy, 5 year old males and 12 to 14 year old females are the most vulnerable to poverty, with 154 males (50.3%) and 399 females (37.5%) in their respective age groups living below the poverty level.
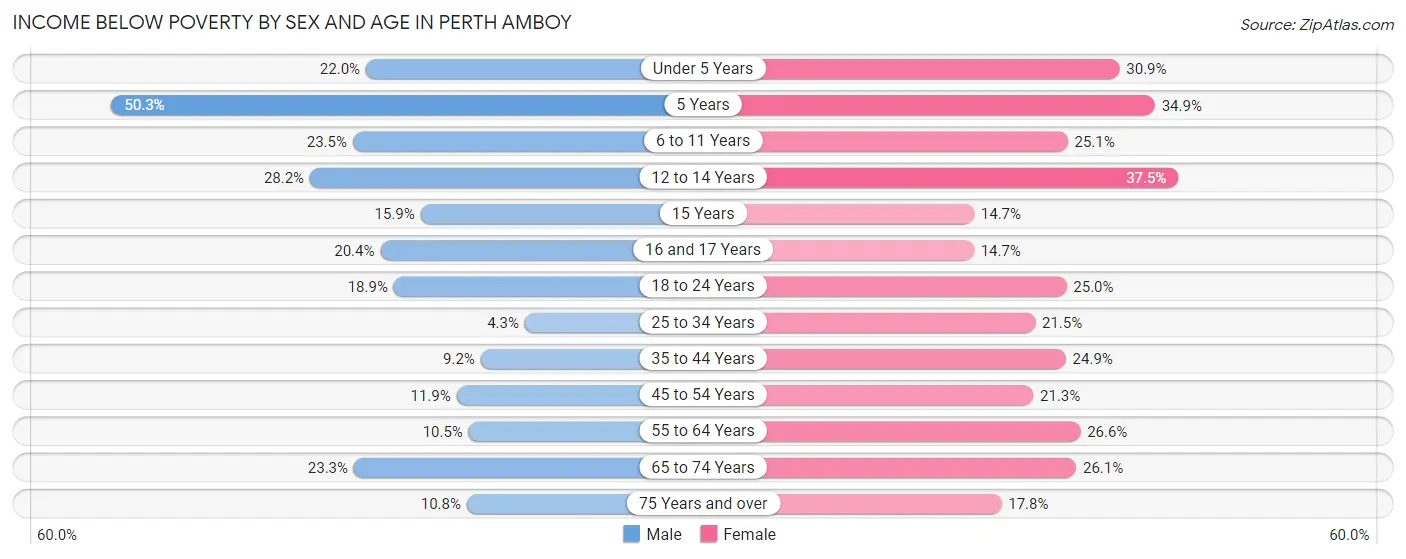
| Age Bracket | Male | Female |
| Under 5 Years | 406 (22.0%) | 587 (30.9%) |
| 5 Years | 154 (50.3%) | 115 (34.8%) |
| 6 to 11 Years | 368 (23.4%) | 566 (25.1%) |
| 12 to 14 Years | 311 (28.2%) | 399 (37.5%) |
| 15 Years | 38 (15.9%) | 25 (14.7%) |
| 16 and 17 Years | 232 (20.4%) | 104 (14.7%) |
| 18 to 24 Years | 599 (18.9%) | 737 (25.0%) |
| 25 to 34 Years | 172 (4.3%) | 830 (21.5%) |
| 35 to 44 Years | 361 (9.2%) | 888 (24.9%) |
| 45 to 54 Years | 459 (11.9%) | 850 (21.3%) |
| 55 to 64 Years | 310 (10.5%) | 900 (26.6%) |
| 65 to 74 Years | 443 (23.3%) | 549 (26.1%) |
| 75 Years and over | 100 (10.7%) | 259 (17.8%) |
| Total | 3,953 (14.7%) | 6,809 (24.6%) |
Income Above Poverty by Sex and Age in Perth Amboy
According to the poverty statistics in Perth Amboy, males aged 25 to 34 years and females aged 16 and 17 years are the age groups that are most secure financially, with 95.7% of males and 85.3% of females in these age groups living above the poverty line.
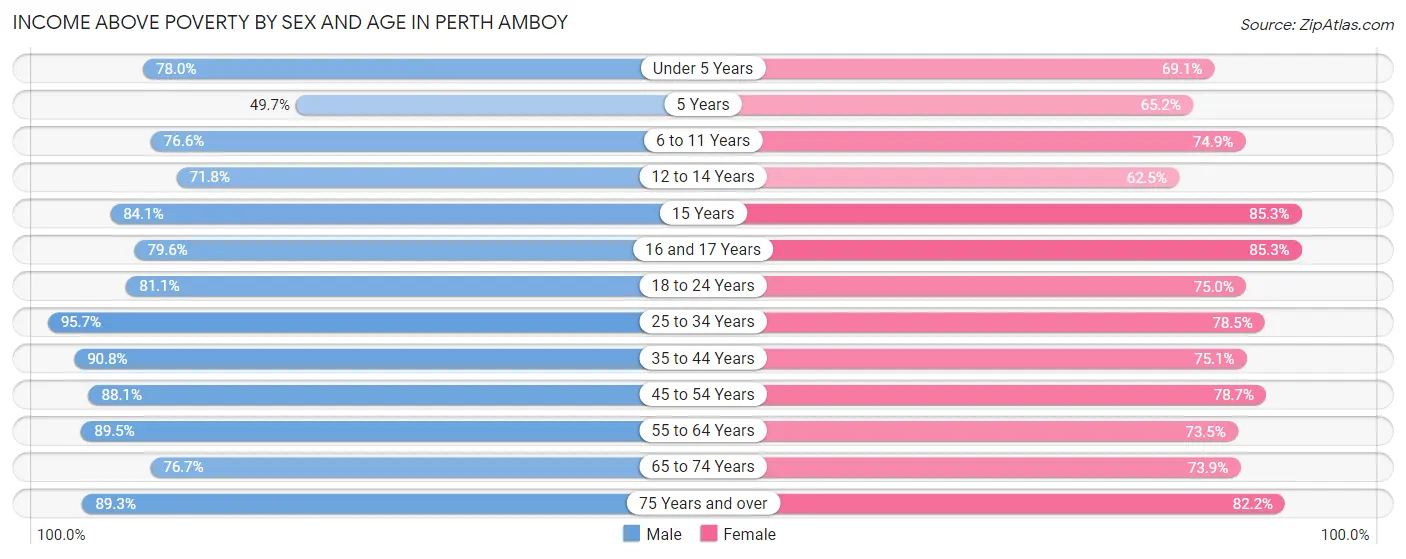
| Age Bracket | Male | Female |
| Under 5 Years | 1,440 (78.0%) | 1,312 (69.1%) |
| 5 Years | 152 (49.7%) | 215 (65.1%) |
| 6 to 11 Years | 1,201 (76.5%) | 1,685 (74.9%) |
| 12 to 14 Years | 791 (71.8%) | 666 (62.5%) |
| 15 Years | 201 (84.1%) | 145 (85.3%) |
| 16 and 17 Years | 906 (79.6%) | 604 (85.3%) |
| 18 to 24 Years | 2,572 (81.1%) | 2,210 (75.0%) |
| 25 to 34 Years | 3,837 (95.7%) | 3,027 (78.5%) |
| 35 to 44 Years | 3,558 (90.8%) | 2,674 (75.1%) |
| 45 to 54 Years | 3,400 (88.1%) | 3,138 (78.7%) |
| 55 to 64 Years | 2,631 (89.5%) | 2,490 (73.5%) |
| 65 to 74 Years | 1,456 (76.7%) | 1,555 (73.9%) |
| 75 Years and over | 830 (89.2%) | 1,199 (82.2%) |
| Total | 22,975 (85.3%) | 20,920 (75.4%) |
Income Below Poverty Among Married-Couple Families in Perth Amboy
The poverty statistics for married-couple families in Perth Amboy show that 7.8% or 491 of the total 6,287 families live below the poverty line. Families with 1 or 2 children have the highest poverty rate of 12.4%, comprising of 291 families. On the other hand, families with 5 or more children have the lowest poverty rate of 0.0%, which includes 0 families.
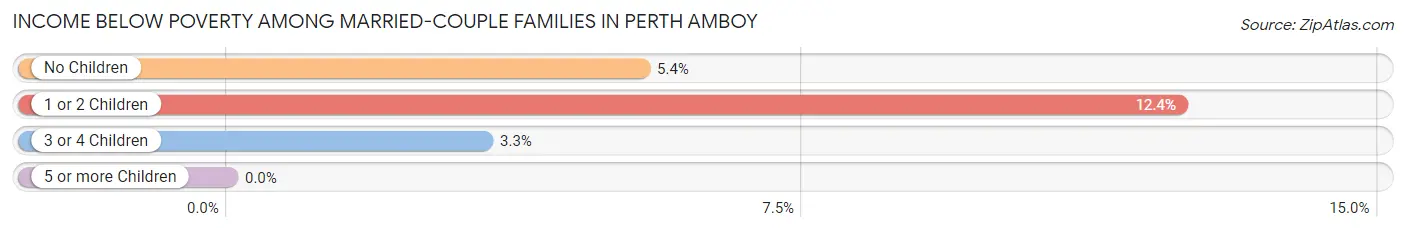
| Children | Above Poverty | Below Poverty |
| No Children | 3,221 (94.6%) | 183 (5.4%) |
| 1 or 2 Children | 2,055 (87.6%) | 291 (12.4%) |
| 3 or 4 Children | 493 (96.7%) | 17 (3.3%) |
| 5 or more Children | 27 (100.0%) | 0 (0.0%) |
| Total | 5,796 (92.2%) | 491 (7.8%) |
Income Below Poverty Among Single-Parent Households in Perth Amboy
According to the poverty data in Perth Amboy, 2.9% or 59 single-father households and 37.2% or 1,804 single-mother households are living below the poverty line. Among single-father households, those with no children have the highest poverty rate, with 46 households (4.7%) experiencing poverty. Likewise, among single-mother households, those with 3 or 4 children have the highest poverty rate, with 196 households (52.4%) falling below the poverty line.
| Children | Single Father | Single Mother |
| No Children | 46 (4.7%) | 311 (19.7%) |
| 1 or 2 Children | 13 (1.3%) | 1,297 (44.8%) |
| 3 or 4 Children | 0 (0.0%) | 196 (52.4%) |
| 5 or more Children | 0 (0.0%) | 0 (0.0%) |
| Total | 59 (2.9%) | 1,804 (37.2%) |
Income Below Poverty Among Married-Couple vs Single-Parent Households in Perth Amboy
The poverty data for Perth Amboy shows that 491 of the married-couple family households (7.8%) and 1,863 of the single-parent households (27.0%) are living below the poverty level. Within the married-couple family households, those with 1 or 2 children have the highest poverty rate, with 291 households (12.4%) falling below the poverty line. Among the single-parent households, those with 3 or 4 children have the highest poverty rate, with 196 household (41.5%) living below poverty.
| Children | Married-Couple Families | Single-Parent Households |
| No Children | 183 (5.4%) | 357 (14.0%) |
| 1 or 2 Children | 291 (12.4%) | 1,310 (33.8%) |
| 3 or 4 Children | 17 (3.3%) | 196 (41.5%) |
| 5 or more Children | 0 (0.0%) | 0 (0.0%) |
| Total | 491 (7.8%) | 1,863 (27.0%) |
Race in Perth Amboy
The most populous races in Perth Amboy are Hispanic or Latino (43,513 | 78.8%), White / Caucasian (25,015 | 45.3%), and Some other Race (16,690 | 30.2%).
| Race | # Population | % Population |
| Asian | 807 | 1.5% |
| Black / African American | 4,256 | 7.7% |
| Hawaiian / Pacific | 21 | 0.0% |
| Hispanic or Latino | 43,513 | 78.8% |
| Native / Alaskan | 1,091 | 2.0% |
| White / Caucasian | 25,015 | 45.3% |
| Two or more Races | 7,346 | 13.3% |
| Some other Race | 16,690 | 30.2% |
| Total | 55,226 | 100.0% |
Ancestry in Perth Amboy
The most populous ancestries reported in Perth Amboy are Dominican (22,596 | 40.9%), Puerto Rican (9,253 | 16.8%), Mexican (3,950 | 7.1%), South American (3,503 | 6.3%), and American (3,041 | 5.5%), together accounting for 76.7% of all Perth Amboy residents.
| Ancestry | # Population | % Population |
| African | 131 | 0.2% |
| American | 3,041 | 5.5% |
| Arab | 210 | 0.4% |
| Argentinean | 395 | 0.7% |
| Austrian | 19 | 0.0% |
| Barbadian | 11 | 0.0% |
| Bhutanese | 15 | 0.0% |
| British | 50 | 0.1% |
| British West Indian | 225 | 0.4% |
| Burmese | 8 | 0.0% |
| Carpatho Rusyn | 10 | 0.0% |
| Central American | 2,016 | 3.6% |
| Central American Indian | 763 | 1.4% |
| Cherokee | 23 | 0.0% |
| Colombian | 650 | 1.2% |
| Costa Rican | 190 | 0.3% |
| Cuban | 961 | 1.7% |
| Czech | 8 | 0.0% |
| Danish | 34 | 0.1% |
| Delaware | 5 | 0.0% |
| Dominican | 22,596 | 40.9% |
| Dutch | 26 | 0.1% |
| Dutch West Indian | 21 | 0.0% |
| Eastern European | 31 | 0.1% |
| Ecuadorian | 837 | 1.5% |
| Egyptian | 210 | 0.4% |
| English | 161 | 0.3% |
| French | 50 | 0.1% |
| German | 361 | 0.6% |
| Greek | 176 | 0.3% |
| Guamanian / Chamorro | 21 | 0.0% |
| Guatemalan | 466 | 0.8% |
| Haitian | 40 | 0.1% |
| Honduran | 474 | 0.9% |
| Hungarian | 307 | 0.6% |
| Indian (Asian) | 339 | 0.6% |
| Indonesian | 35 | 0.1% |
| Iranian | 46 | 0.1% |
| Irish | 726 | 1.3% |
| Italian | 541 | 1.0% |
| Jamaican | 360 | 0.6% |
| Korean | 151 | 0.3% |
| Lithuanian | 25 | 0.1% |
| Mexican | 3,950 | 7.1% |
| Mexican American Indian | 204 | 0.4% |
| Nicaraguan | 30 | 0.1% |
| Nigerian | 56 | 0.1% |
| Norwegian | 11 | 0.0% |
| Pakistani | 22 | 0.0% |
| Panamanian | 207 | 0.4% |
| Peruvian | 1,552 | 2.8% |
| Polish | 870 | 1.6% |
| Portuguese | 157 | 0.3% |
| Puerto Rican | 9,253 | 16.8% |
| Romanian | 30 | 0.1% |
| Russian | 107 | 0.2% |
| Salvadoran | 649 | 1.2% |
| Scotch-Irish | 5 | 0.0% |
| Scottish | 13 | 0.0% |
| Slavic | 5 | 0.0% |
| Slovak | 87 | 0.2% |
| South American | 3,503 | 6.3% |
| South American Indian | 11 | 0.0% |
| Spaniard | 351 | 0.6% |
| Spanish | 38 | 0.1% |
| Sri Lankan | 105 | 0.2% |
| Subsaharan African | 223 | 0.4% |
| Swedish | 15 | 0.0% |
| Thai | 287 | 0.5% |
| Ukrainian | 169 | 0.3% |
| Uruguayan | 4 | 0.0% |
| Venezuelan | 65 | 0.1% |
| Welsh | 13 | 0.0% |
| West Indian | 68 | 0.1% | View All 74 Rows |
Immigrants in Perth Amboy
The most numerous immigrant groups reported in Perth Amboy came from Latin America (23,983 | 43.4%), Caribbean (17,810 | 32.3%), Dominican Republic (16,800 | 30.4%), Central America (3,580 | 6.5%), and South America (2,593 | 4.7%), together accounting for 117.3% of all Perth Amboy residents.
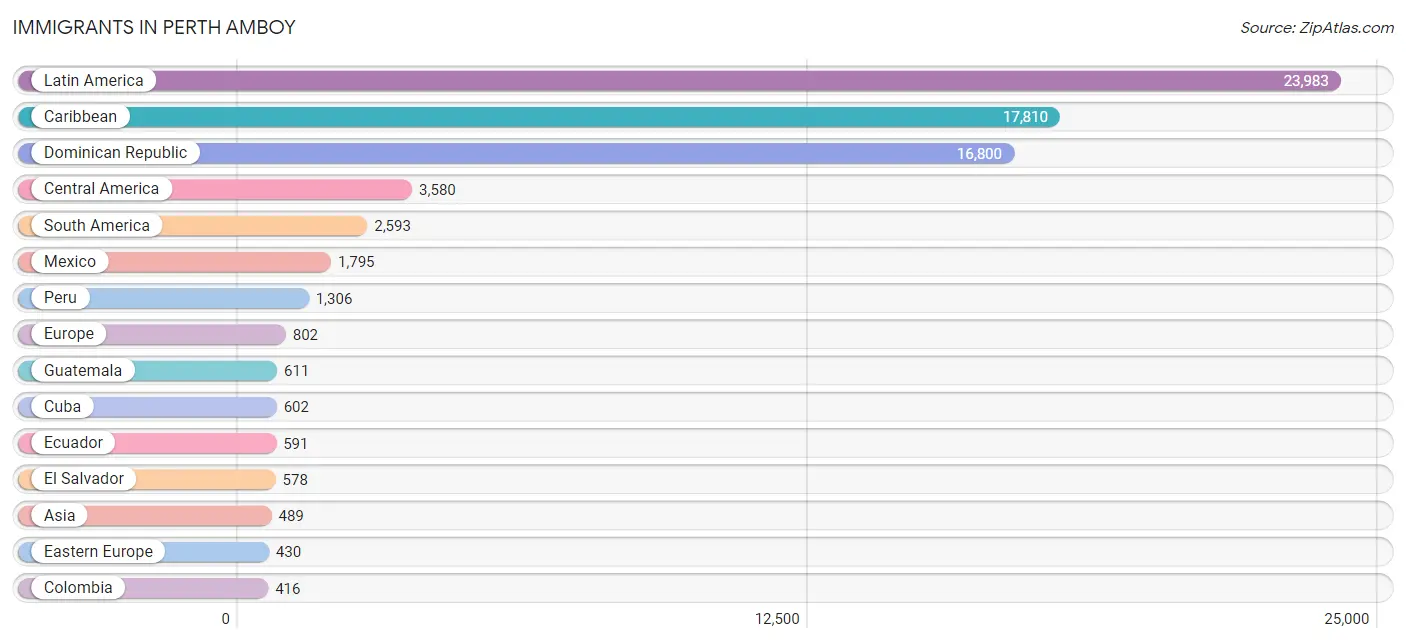
| Immigration Origin | # Population | % Population |
| Africa | 246 | 0.4% |
| Argentina | 213 | 0.4% |
| Asia | 489 | 0.9% |
| Australia | 6 | 0.0% |
| Barbados | 11 | 0.0% |
| Belgium | 12 | 0.0% |
| Brazil | 47 | 0.1% |
| Caribbean | 17,810 | 32.3% |
| Central America | 3,580 | 6.5% |
| China | 60 | 0.1% |
| Colombia | 416 | 0.7% |
| Costa Rica | 47 | 0.1% |
| Cuba | 602 | 1.1% |
| Dominica | 69 | 0.1% |
| Dominican Republic | 16,800 | 30.4% |
| Eastern Asia | 67 | 0.1% |
| Eastern Europe | 430 | 0.8% |
| Ecuador | 591 | 1.1% |
| Egypt | 117 | 0.2% |
| El Salvador | 578 | 1.1% |
| Europe | 802 | 1.5% |
| Fiji | 74 | 0.1% |
| Germany | 30 | 0.1% |
| Ghana | 66 | 0.1% |
| Greece | 68 | 0.1% |
| Grenada | 34 | 0.1% |
| Guatemala | 611 | 1.1% |
| Haiti | 56 | 0.1% |
| Honduras | 415 | 0.7% |
| Hong Kong | 22 | 0.0% |
| Hungary | 53 | 0.1% |
| India | 91 | 0.2% |
| Iran | 46 | 0.1% |
| Italy | 46 | 0.1% |
| Jamaica | 176 | 0.3% |
| Korea | 7 | 0.0% |
| Latin America | 23,983 | 43.4% |
| Latvia | 11 | 0.0% |
| Malaysia | 43 | 0.1% |
| Mexico | 1,795 | 3.3% |
| Moldova | 13 | 0.0% |
| Morocco | 14 | 0.0% |
| Nicaragua | 30 | 0.1% |
| Northern Africa | 131 | 0.2% |
| Northern Europe | 68 | 0.1% |
| Oceania | 80 | 0.1% |
| Panama | 104 | 0.2% |
| Peru | 1,306 | 2.4% |
| Philippines | 151 | 0.3% |
| Poland | 318 | 0.6% |
| Portugal | 94 | 0.2% |
| Romania | 5 | 0.0% |
| Russia | 18 | 0.0% |
| South America | 2,593 | 4.7% |
| South Central Asia | 137 | 0.3% |
| South Eastern Asia | 270 | 0.5% |
| Southern Europe | 262 | 0.5% |
| Spain | 54 | 0.1% |
| Taiwan | 9 | 0.0% |
| Ukraine | 12 | 0.0% |
| Venezuela | 20 | 0.0% |
| Vietnam | 41 | 0.1% |
| Western Africa | 115 | 0.2% |
| Western Asia | 15 | 0.0% |
| Western Europe | 42 | 0.1% | View All 65 Rows |
Sex and Age in Perth Amboy
Sex and Age in Perth Amboy
The most populous age groups in Perth Amboy are 20 to 24 Years (2,289 | 8.4%) for men and 25 to 29 Years (2,208 | 7.9%) for women.
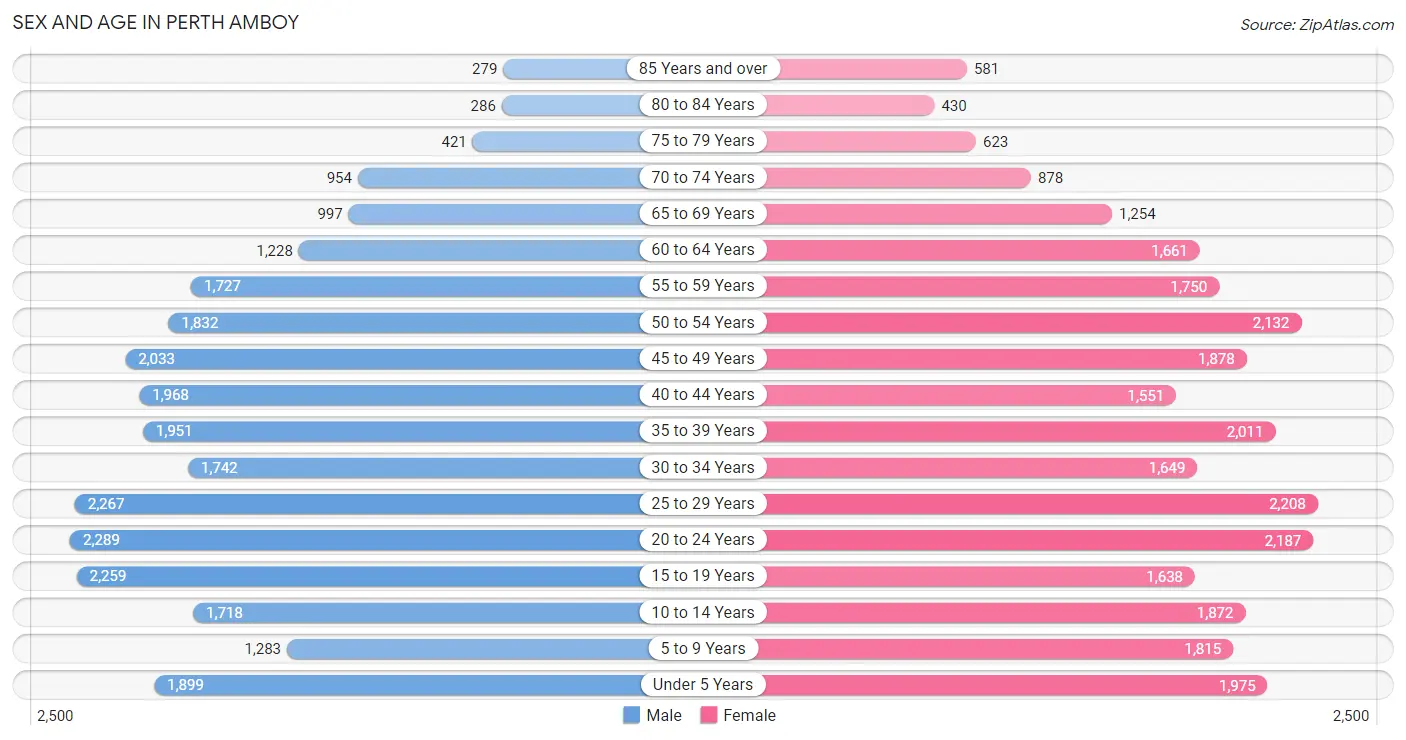
| Age Bracket | Male | Female |
| Under 5 Years | 1,899 (7.0%) | 1,975 (7.0%) |
| 5 to 9 Years | 1,283 (4.7%) | 1,815 (6.5%) |
| 10 to 14 Years | 1,718 (6.3%) | 1,872 (6.7%) |
| 15 to 19 Years | 2,259 (8.3%) | 1,638 (5.8%) |
| 20 to 24 Years | 2,289 (8.4%) | 2,187 (7.8%) |
| 25 to 29 Years | 2,267 (8.4%) | 2,208 (7.9%) |
| 30 to 34 Years | 1,742 (6.4%) | 1,649 (5.9%) |
| 35 to 39 Years | 1,951 (7.2%) | 2,011 (7.2%) |
| 40 to 44 Years | 1,968 (7.2%) | 1,551 (5.5%) |
| 45 to 49 Years | 2,033 (7.5%) | 1,878 (6.7%) |
| 50 to 54 Years | 1,832 (6.8%) | 2,132 (7.6%) |
| 55 to 59 Years | 1,727 (6.4%) | 1,750 (6.2%) |
| 60 to 64 Years | 1,228 (4.5%) | 1,661 (5.9%) |
| 65 to 69 Years | 997 (3.7%) | 1,254 (4.5%) |
| 70 to 74 Years | 954 (3.5%) | 878 (3.1%) |
| 75 to 79 Years | 421 (1.5%) | 623 (2.2%) |
| 80 to 84 Years | 286 (1.1%) | 430 (1.5%) |
| 85 Years and over | 279 (1.0%) | 581 (2.1%) |
| Total | 27,133 (100.0%) | 28,093 (100.0%) |
Families and Households in Perth Amboy
Median Family Size in Perth Amboy
The median family size in Perth Amboy is 3.41 persons per family, with married-couple families (6,287 | 47.7%) accounting for the largest median family size of 3.59 persons per family. On the other hand, single male/father families (2,047 | 15.5%) represent the smallest median family size with 3.06 persons per family.
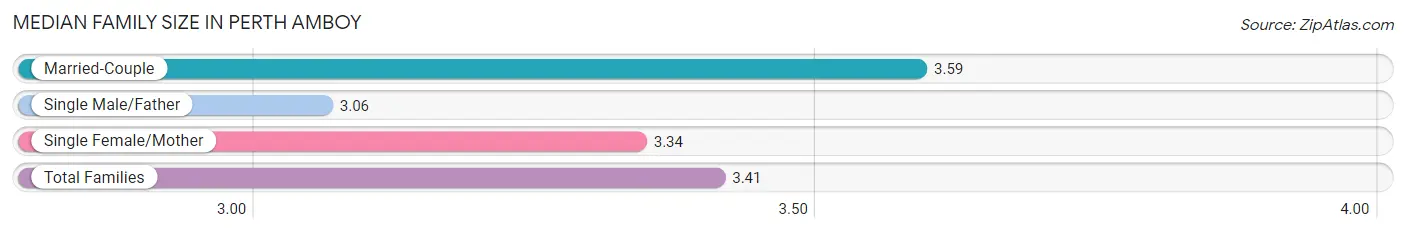
| Family Type | # Families | Family Size |
| Married-Couple | 6,287 (47.7%) | 3.59 |
| Single Male/Father | 2,047 (15.5%) | 3.06 |
| Single Female/Mother | 4,853 (36.8%) | 3.34 |
| Total Families | 13,187 (100.0%) | 3.41 |
Median Household Size in Perth Amboy
The median household size in Perth Amboy is 2.97 persons per household, with single male/father households (2,047 | 11.1%) accounting for the largest median household size of 3.72 persons per household. non-family households (5,222 | 28.4%) represent the smallest median household size with 1.24 persons per household.
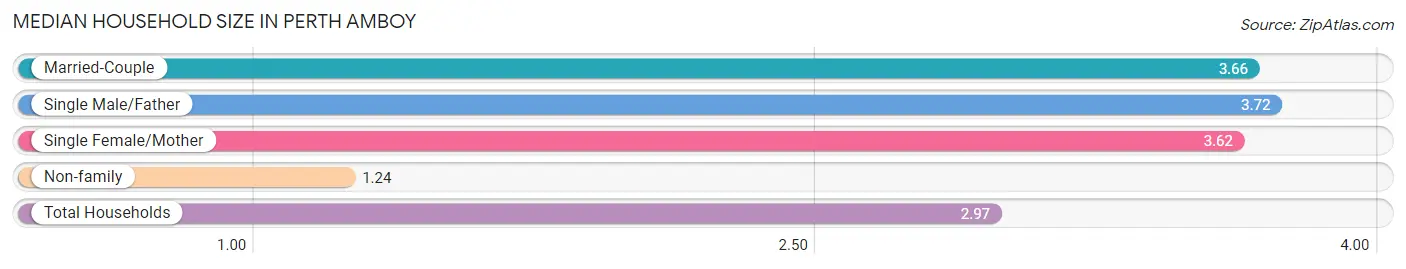
| Household Type | # Households | Household Size |
| Married-Couple | 6,287 (34.2%) | 3.66 |
| Single Male/Father | 2,047 (11.1%) | 3.72 |
| Single Female/Mother | 4,853 (26.4%) | 3.62 |
| Non-family | 5,222 (28.4%) | 1.24 |
| Total Households | 18,409 (100.0%) | 2.97 |
Household Size by Marriage Status in Perth Amboy
Out of a total of 18,409 households in Perth Amboy, 13,187 (71.6%) are family households, while 5,222 (28.4%) are nonfamily households. The most numerous type of family households are 3-person households, comprising 3,741, and the most common type of nonfamily households are 1-person households, comprising 4,168.
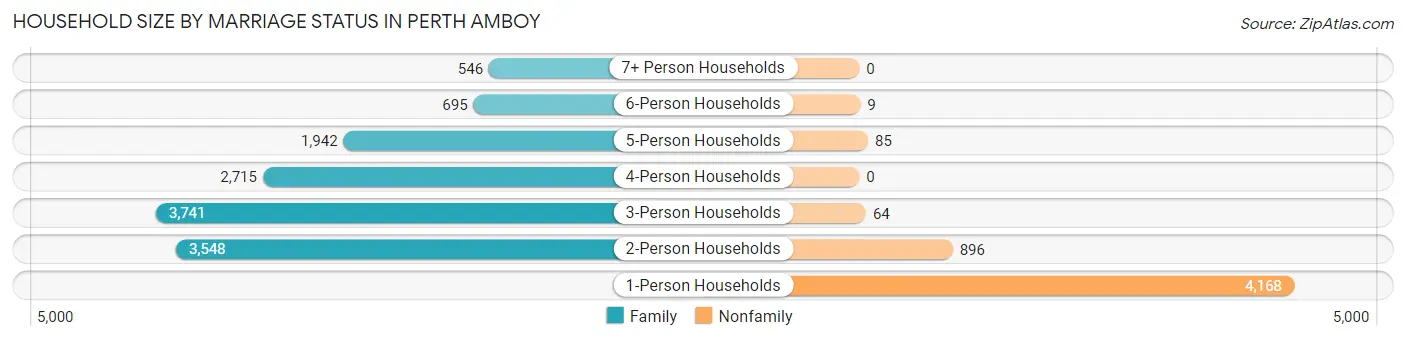
| Household Size | Family Households | Nonfamily Households |
| 1-Person Households | - | 4,168 (22.6%) |
| 2-Person Households | 3,548 (19.3%) | 896 (4.9%) |
| 3-Person Households | 3,741 (20.3%) | 64 (0.4%) |
| 4-Person Households | 2,715 (14.7%) | 0 (0.0%) |
| 5-Person Households | 1,942 (10.5%) | 85 (0.5%) |
| 6-Person Households | 695 (3.8%) | 9 (0.1%) |
| 7+ Person Households | 546 (3.0%) | 0 (0.0%) |
| Total | 13,187 (71.6%) | 5,222 (28.4%) |
Female Fertility in Perth Amboy
Fertility by Age in Perth Amboy
Average fertility rate in Perth Amboy is 44.0 births per 1,000 women. Women in the age bracket of 20 to 34 years have the highest fertility rate with 77.0 births per 1,000 women. Women in the age bracket of 20 to 34 years acount for 76.1% of all women with births.
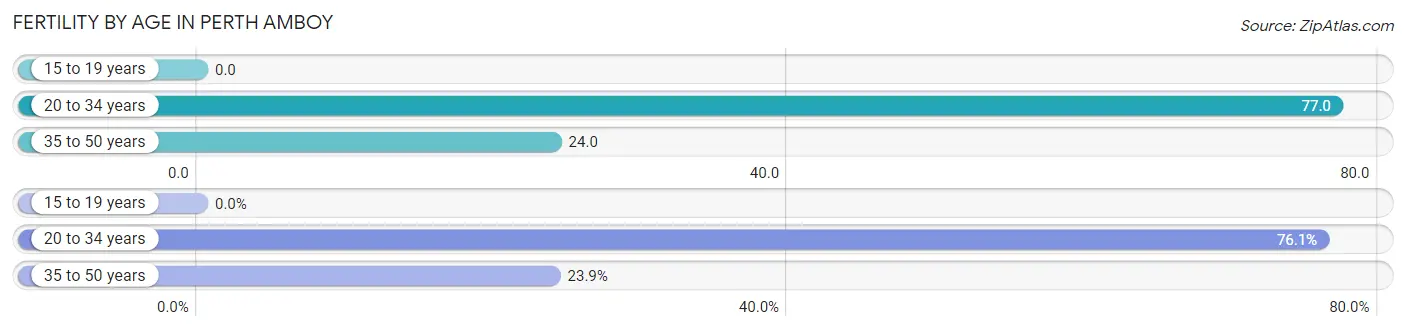
| Age Bracket | Women with Births | Births / 1,000 Women |
| 15 to 19 years | 0 (0.0%) | 0.0 |
| 20 to 34 years | 464 (76.1%) | 77.0 |
| 35 to 50 years | 146 (23.9%) | 24.0 |
| Total | 610 (100.0%) | 44.0 |
Fertility by Age by Marriage Status in Perth Amboy
44.8% of women with births (610) in Perth Amboy are married. The highest percentage of unmarried women with births falls into 20 to 34 years age bracket with 56.5% of them unmarried at the time of birth, while the lowest percentage of unmarried women with births belong to 35 to 50 years age bracket with 51.4% of them unmarried.
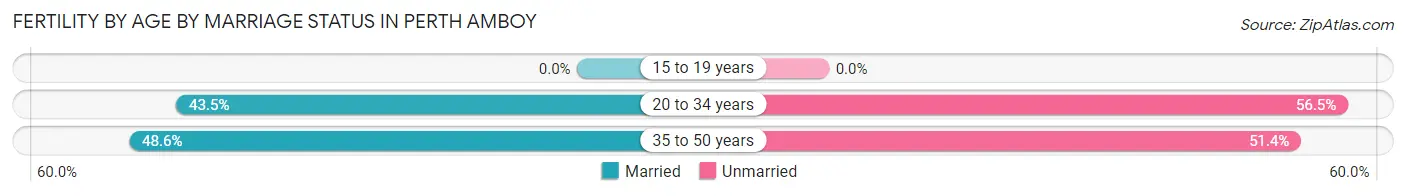
| Age Bracket | Married | Unmarried |
| 15 to 19 years | 0 (0.0%) | 0 (0.0%) |
| 20 to 34 years | 202 (43.5%) | 262 (56.5%) |
| 35 to 50 years | 71 (48.6%) | 75 (51.4%) |
| Total | 273 (44.8%) | 337 (55.2%) |
Fertility by Education in Perth Amboy
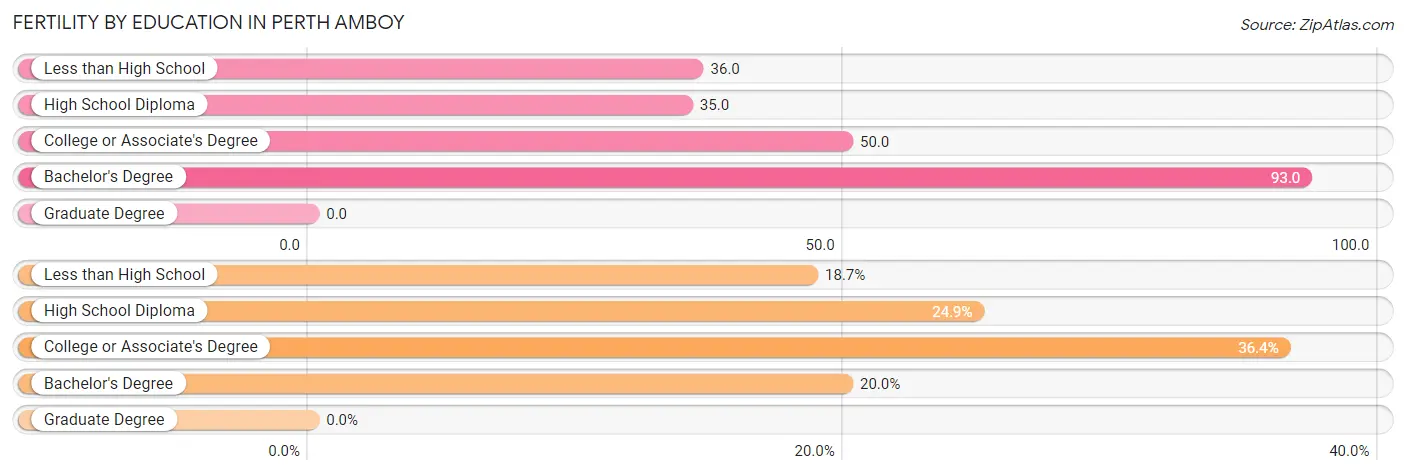
| Educational Attainment | Women with Births | Births / 1,000 Women |
| Less than High School | 114 (18.7%) | 36.0 |
| High School Diploma | 152 (24.9%) | 35.0 |
| College or Associate's Degree | 222 (36.4%) | 50.0 |
| Bachelor's Degree | 122 (20.0%) | 93.0 |
| Graduate Degree | 0 (0.0%) | 0.0 |
| Total | 610 (100.0%) | 44.0 |
Fertility by Education by Marriage Status in Perth Amboy
55.2% of women with births in Perth Amboy are unmarried. Women with the educational attainment of less than high school are most likely to be married with 75.4% of them married at childbirth, while women with the educational attainment of bachelor's degree are least likely to be married with 95.1% of them unmarried at childbirth.
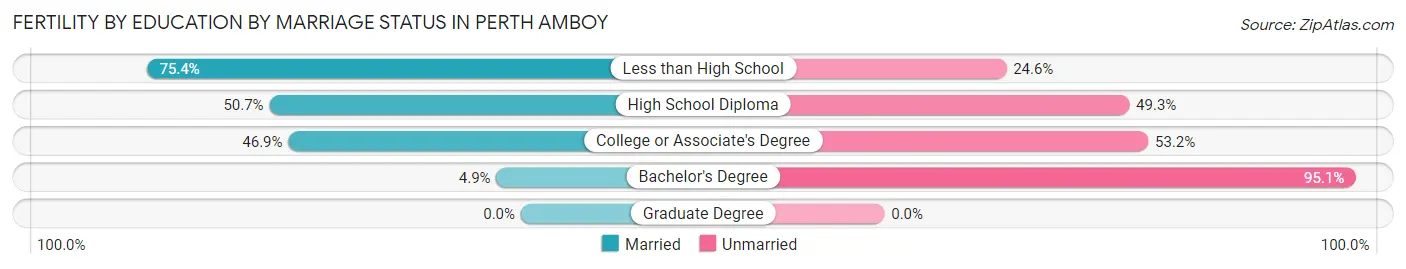
| Educational Attainment | Married | Unmarried |
| Less than High School | 86 (75.4%) | 28 (24.6%) |
| High School Diploma | 77 (50.7%) | 75 (49.3%) |
| College or Associate's Degree | 104 (46.9%) | 118 (53.1%) |
| Bachelor's Degree | 6 (4.9%) | 116 (95.1%) |
| Graduate Degree | 0 (0.0%) | 0 (0.0%) |
| Total | 273 (44.8%) | 337 (55.2%) |
Employment Characteristics in Perth Amboy
Employment by Class of Employer in Perth Amboy
Among the 24,341 employed individuals in Perth Amboy, private company employees (19,105 | 78.5%), local government employees (1,460 | 6.0%), and not-for-profit organizations (1,014 | 4.2%) make up the most common classes of employment.
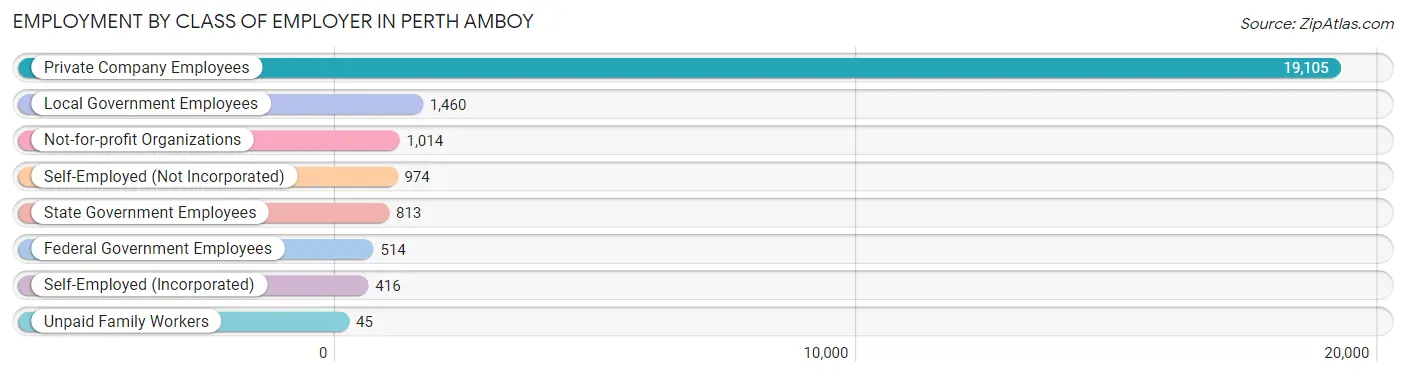
| Employer Class | # Employees | % Employees |
| Private Company Employees | 19,105 | 78.5% |
| Self-Employed (Incorporated) | 416 | 1.7% |
| Self-Employed (Not Incorporated) | 974 | 4.0% |
| Not-for-profit Organizations | 1,014 | 4.2% |
| Local Government Employees | 1,460 | 6.0% |
| State Government Employees | 813 | 3.3% |
| Federal Government Employees | 514 | 2.1% |
| Unpaid Family Workers | 45 | 0.2% |
| Total | 24,341 | 100.0% |
Employment Status by Age in Perth Amboy
According to the labor force statistics for Perth Amboy, out of the total population over 16 years of age (44,255), 65.0% or 28,766 individuals are in the labor force, with 11.3% or 3,251 of them unemployed. The age group with the highest labor force participation rate is 35 to 44 years, with 86.7% or 6,486 individuals in the labor force. Within the labor force, the 16 to 19 years age range has the highest percentage of unemployed individuals, with 33.1% or 327 of them being unemployed.
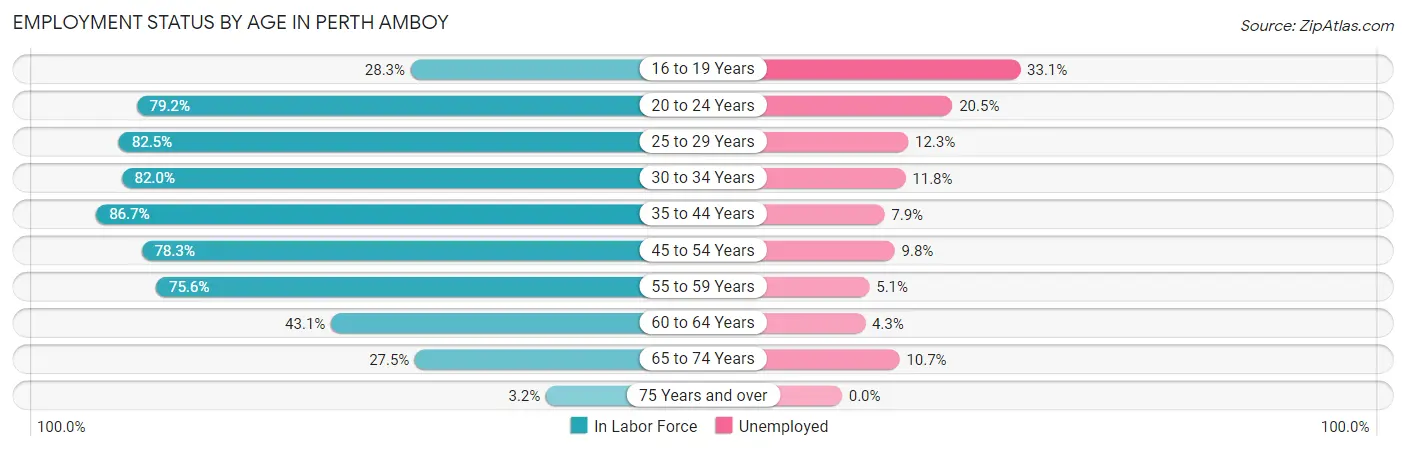
| Age Bracket | In Labor Force | Unemployed |
| 16 to 19 Years | 987 (28.3%) | 327 (33.1%) |
| 20 to 24 Years | 3,545 (79.2%) | 727 (20.5%) |
| 25 to 29 Years | 3,692 (82.5%) | 454 (12.3%) |
| 30 to 34 Years | 2,781 (82.0%) | 328 (11.8%) |
| 35 to 44 Years | 6,486 (86.7%) | 512 (7.9%) |
| 45 to 54 Years | 6,166 (78.3%) | 604 (9.8%) |
| 55 to 59 Years | 2,629 (75.6%) | 134 (5.1%) |
| 60 to 64 Years | 1,245 (43.1%) | 54 (4.3%) |
| 65 to 74 Years | 1,123 (27.5%) | 120 (10.7%) |
| 75 Years and over | 84 (3.2%) | 0 (0.0%) |
| Total | 28,766 (65.0%) | 3,251 (11.3%) |
Employment Status by Educational Attainment in Perth Amboy
According to labor force statistics for Perth Amboy, 77.7% of individuals (22,990) out of the total population between 25 and 64 years of age (29,588) are in the labor force, with 9.1% or 2,092 of them being unemployed. The group with the highest labor force participation rate are those with the educational attainment of bachelor's degree or higher, with 90.0% or 4,096 individuals in the labor force. Within the labor force, individuals with high school diploma education have the highest percentage of unemployment, with 11.7% or 855 of them being unemployed.
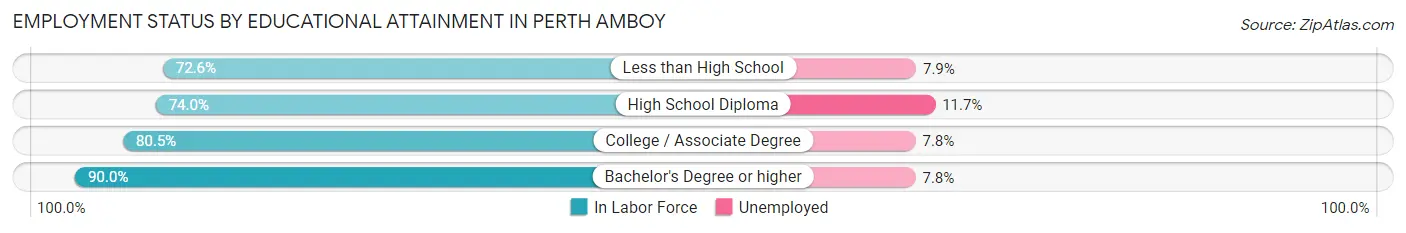
| Educational Attainment | In Labor Force | Unemployed |
| Less than High School | 5,510 (72.6%) | 600 (7.9%) |
| High School Diploma | 7,310 (74.0%) | 1,156 (11.7%) |
| College / Associate Degree | 6,094 (80.5%) | 590 (7.8%) |
| Bachelor's Degree or higher | 4,096 (90.0%) | 355 (7.8%) |
| Total | 22,990 (77.7%) | 2,693 (9.1%) |
Employment Occupations by Sex in Perth Amboy
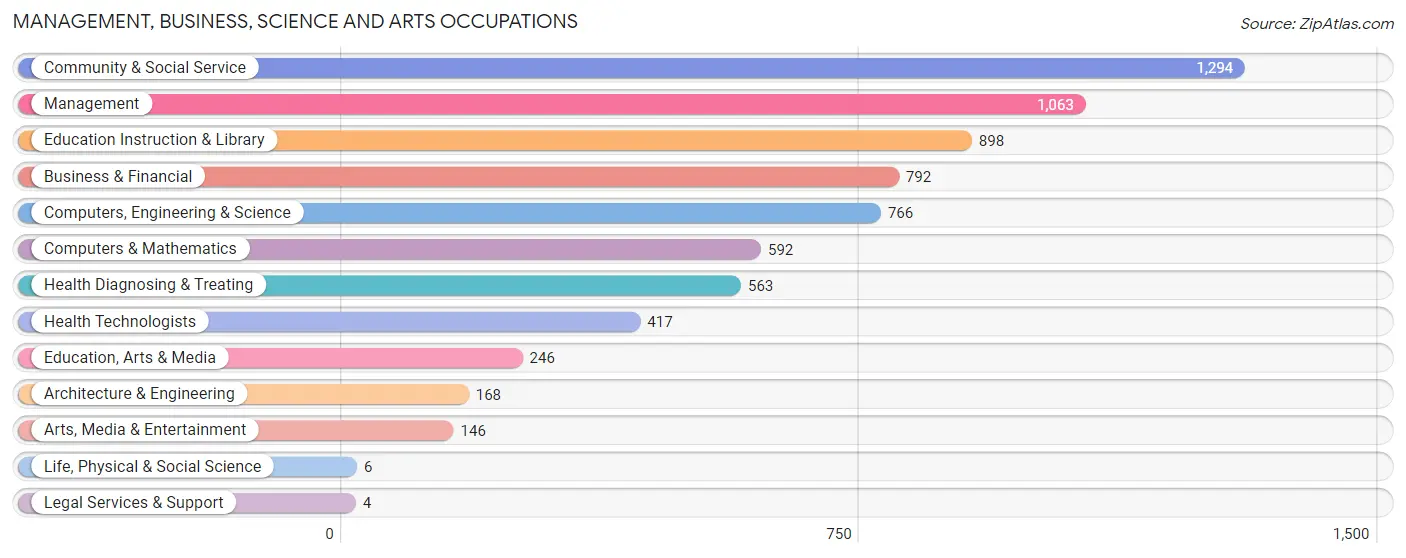
Management, Business, Science and Arts Occupations
The most common Management, Business, Science and Arts occupations in Perth Amboy are Community & Social Service (1,294 | 5.1%), Management (1,063 | 4.2%), Education Instruction & Library (898 | 3.5%), Business & Financial (792 | 3.1%), and Computers, Engineering & Science (766 | 3.0%).
Management, Business, Science and Arts Occupations by Sex
Within the Management, Business, Science and Arts occupations in Perth Amboy, the most male-oriented occupations are Life, Physical & Social Science (100.0%), Architecture & Engineering (96.4%), and Computers, Engineering & Science (92.8%), while the most female-oriented occupations are Legal Services & Support (100.0%), Education Instruction & Library (84.6%), and Community & Social Service (77.2%).
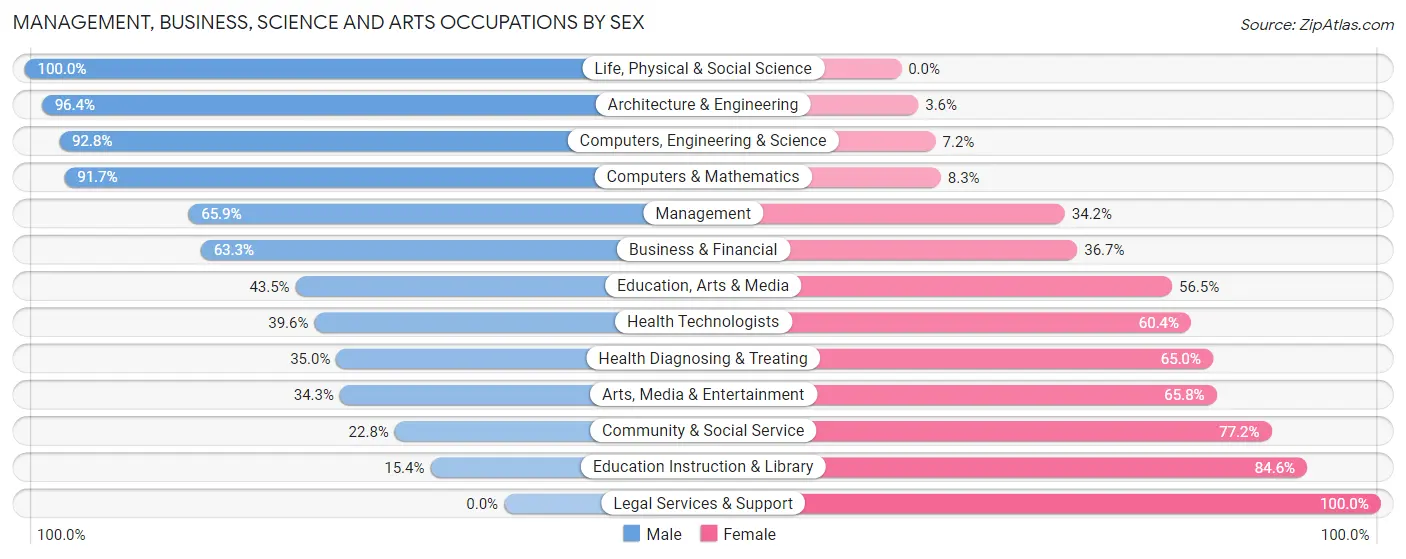
| Occupation | Male | Female |
| Management | 700 (65.8%) | 363 (34.2%) |
| Business & Financial | 501 (63.3%) | 291 (36.7%) |
| Computers, Engineering & Science | 711 (92.8%) | 55 (7.2%) |
| Computers & Mathematics | 543 (91.7%) | 49 (8.3%) |
| Architecture & Engineering | 162 (96.4%) | 6 (3.6%) |
| Life, Physical & Social Science | 6 (100.0%) | 0 (0.0%) |
| Community & Social Service | 295 (22.8%) | 999 (77.2%) |
| Education, Arts & Media | 107 (43.5%) | 139 (56.5%) |
| Legal Services & Support | 0 (0.0%) | 4 (100.0%) |
| Education Instruction & Library | 138 (15.4%) | 760 (84.6%) |
| Arts, Media & Entertainment | 50 (34.3%) | 96 (65.7%) |
| Health Diagnosing & Treating | 197 (35.0%) | 366 (65.0%) |
| Health Technologists | 165 (39.6%) | 252 (60.4%) |
| Total (Category) | 2,404 (53.7%) | 2,074 (46.3%) |
| Total (Overall) | 13,599 (53.4%) | 11,853 (46.6%) |
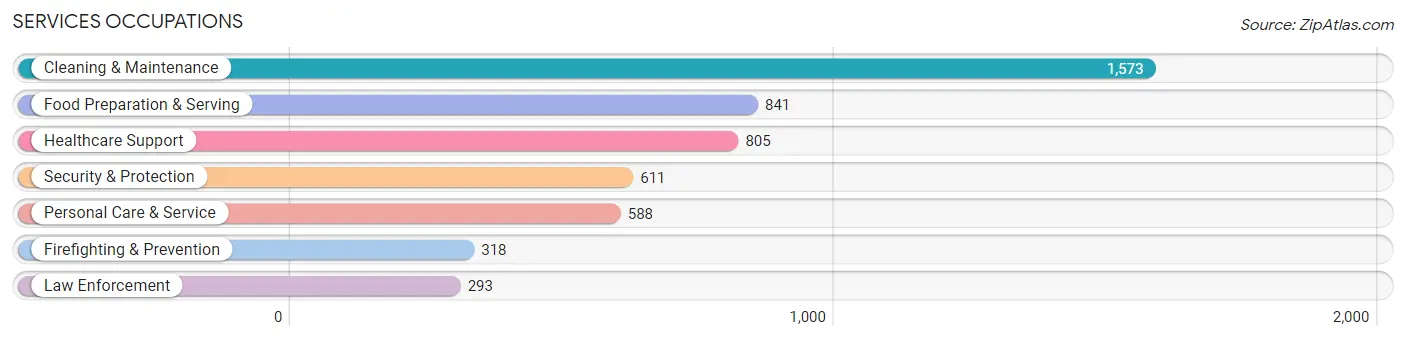
Services Occupations
The most common Services occupations in Perth Amboy are Cleaning & Maintenance (1,573 | 6.2%), Food Preparation & Serving (841 | 3.3%), Healthcare Support (805 | 3.2%), Security & Protection (611 | 2.4%), and Personal Care & Service (588 | 2.3%).
Services Occupations by Sex
Within the Services occupations in Perth Amboy, the most male-oriented occupations are Firefighting & Prevention (74.2%), Security & Protection (70.9%), and Law Enforcement (67.2%), while the most female-oriented occupations are Healthcare Support (87.2%), Personal Care & Service (68.9%), and Cleaning & Maintenance (61.9%).
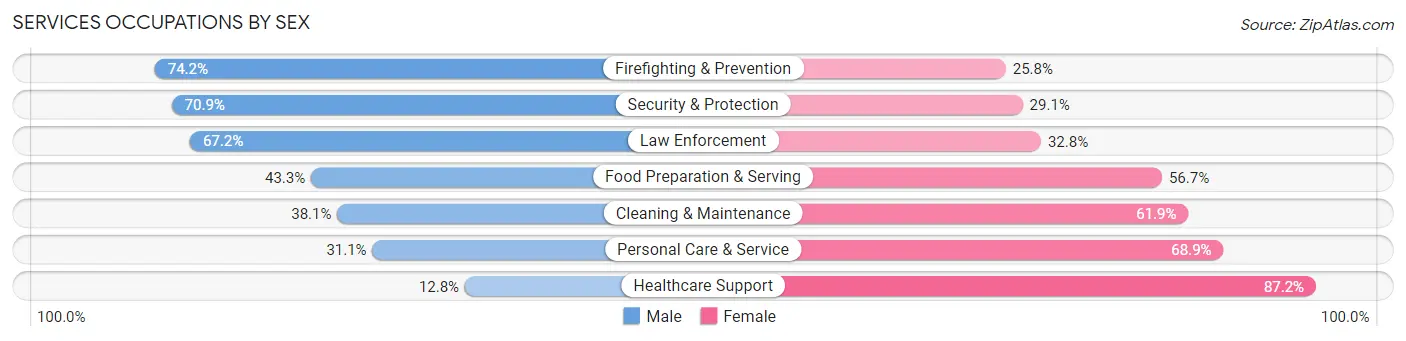
| Occupation | Male | Female |
| Healthcare Support | 103 (12.8%) | 702 (87.2%) |
| Security & Protection | 433 (70.9%) | 178 (29.1%) |
| Firefighting & Prevention | 236 (74.2%) | 82 (25.8%) |
| Law Enforcement | 197 (67.2%) | 96 (32.8%) |
| Food Preparation & Serving | 364 (43.3%) | 477 (56.7%) |
| Cleaning & Maintenance | 599 (38.1%) | 974 (61.9%) |
| Personal Care & Service | 183 (31.1%) | 405 (68.9%) |
| Total (Category) | 1,682 (38.1%) | 2,736 (61.9%) |
| Total (Overall) | 13,599 (53.4%) | 11,853 (46.6%) |
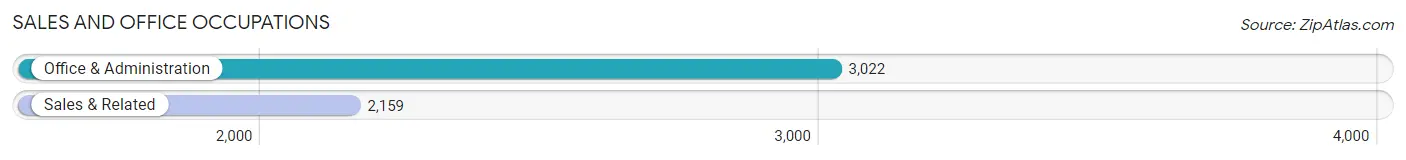
Sales and Office Occupations
The most common Sales and Office occupations in Perth Amboy are Office & Administration (3,022 | 11.9%), and Sales & Related (2,159 | 8.5%).
Sales and Office Occupations by Sex
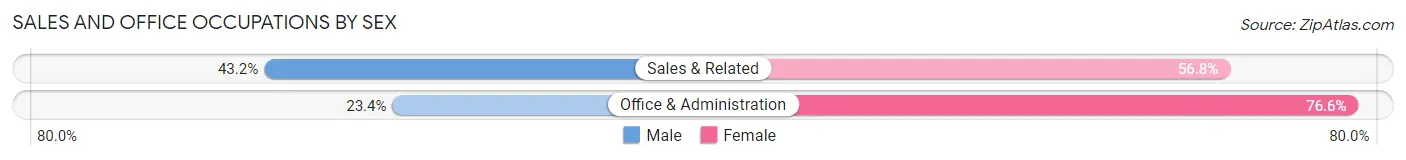
| Occupation | Male | Female |
| Sales & Related | 932 (43.2%) | 1,227 (56.8%) |
| Office & Administration | 708 (23.4%) | 2,314 (76.6%) |
| Total (Category) | 1,640 (31.7%) | 3,541 (68.3%) |
| Total (Overall) | 13,599 (53.4%) | 11,853 (46.6%) |
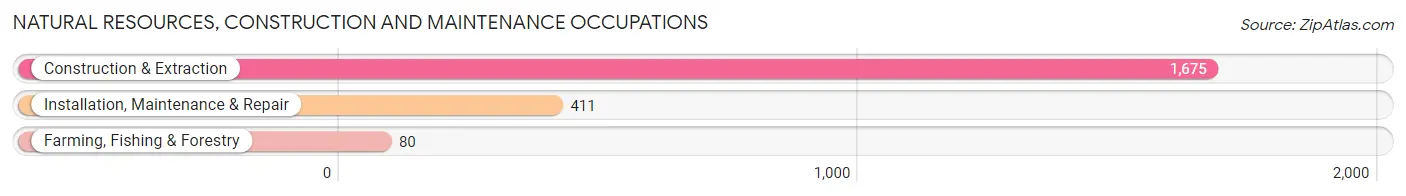
Natural Resources, Construction and Maintenance Occupations
The most common Natural Resources, Construction and Maintenance occupations in Perth Amboy are Construction & Extraction (1,675 | 6.6%), Installation, Maintenance & Repair (411 | 1.6%), and Farming, Fishing & Forestry (80 | 0.3%).
Natural Resources, Construction and Maintenance Occupations by Sex
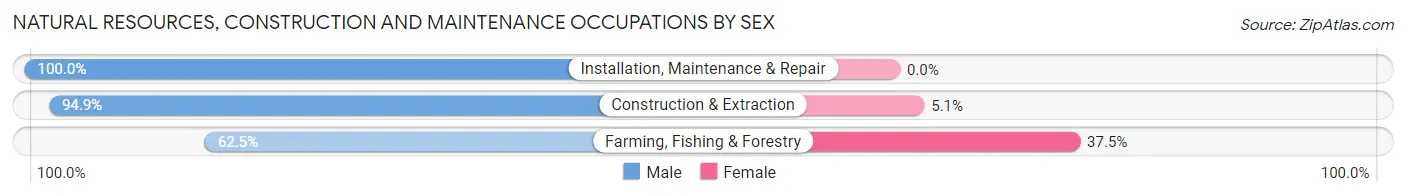
| Occupation | Male | Female |
| Farming, Fishing & Forestry | 50 (62.5%) | 30 (37.5%) |
| Construction & Extraction | 1,590 (94.9%) | 85 (5.1%) |
| Installation, Maintenance & Repair | 411 (100.0%) | 0 (0.0%) |
| Total (Category) | 2,051 (94.7%) | 115 (5.3%) |
| Total (Overall) | 13,599 (53.4%) | 11,853 (46.6%) |
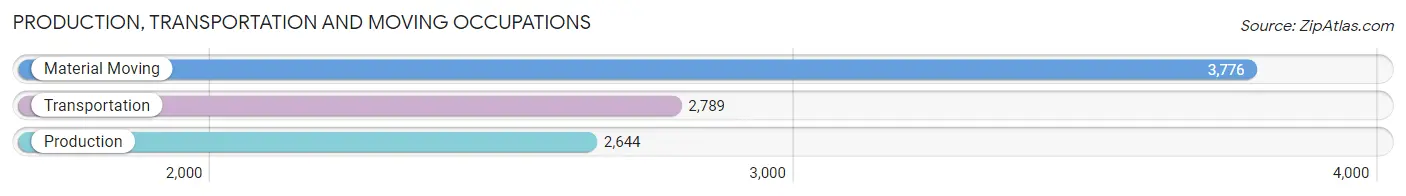
Production, Transportation and Moving Occupations
The most common Production, Transportation and Moving occupations in Perth Amboy are Material Moving (3,776 | 14.8%), Transportation (2,789 | 11.0%), and Production (2,644 | 10.4%).
Production, Transportation and Moving Occupations by Sex
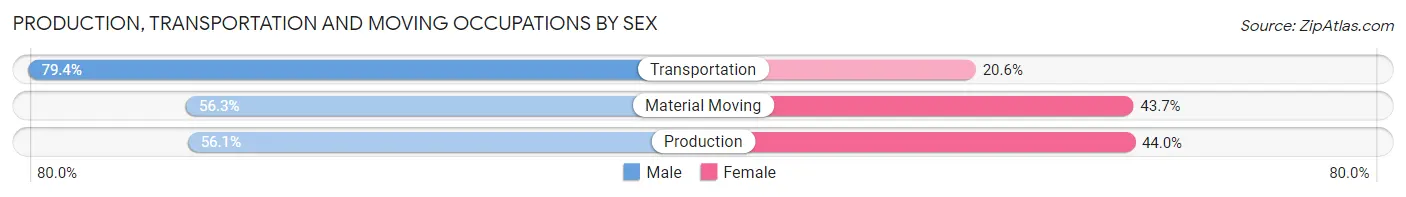
| Occupation | Male | Female |
| Production | 1,482 (56.0%) | 1,162 (44.0%) |
| Transportation | 2,215 (79.4%) | 574 (20.6%) |
| Material Moving | 2,125 (56.3%) | 1,651 (43.7%) |
| Total (Category) | 5,822 (63.2%) | 3,387 (36.8%) |
| Total (Overall) | 13,599 (53.4%) | 11,853 (46.6%) |
Employment Industries by Sex in Perth Amboy
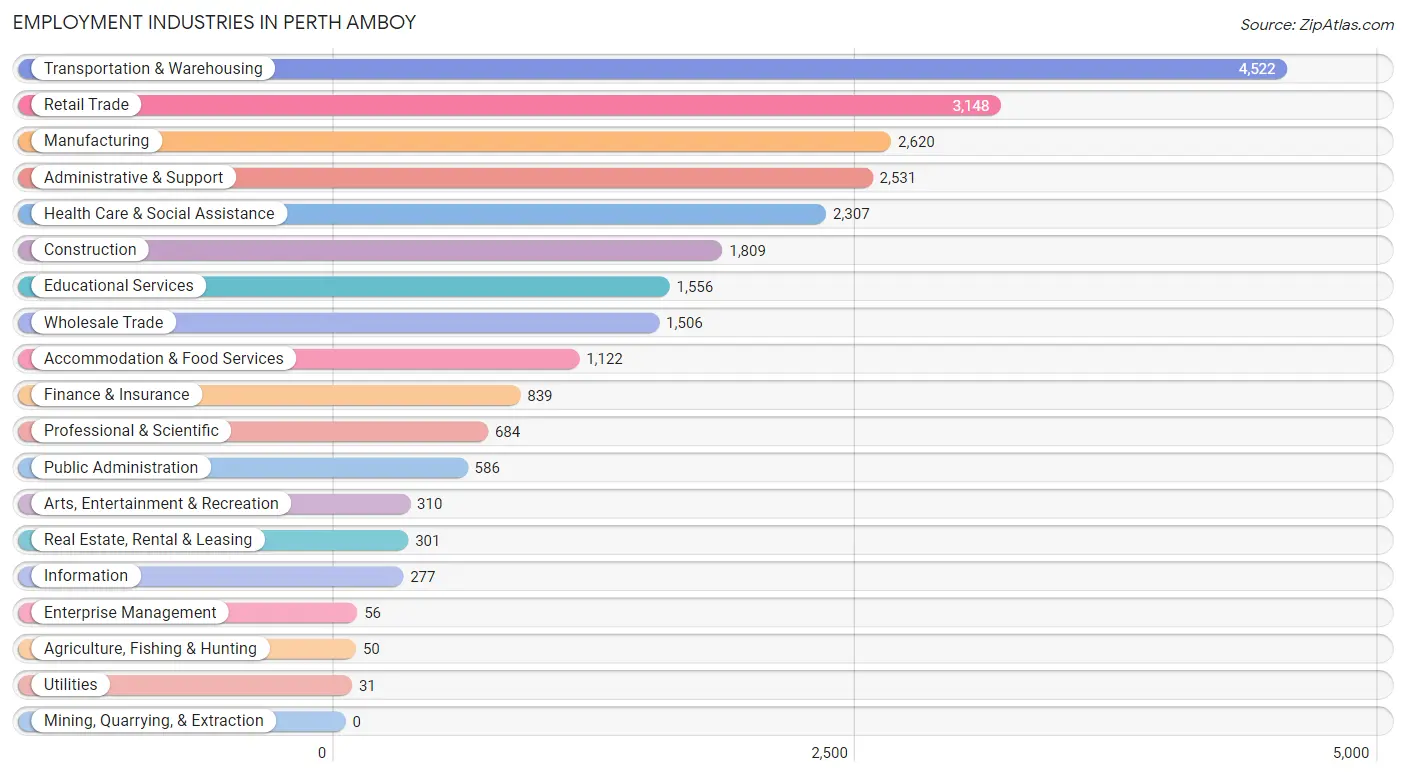
Employment Industries in Perth Amboy
The major employment industries in Perth Amboy include Transportation & Warehousing (4,522 | 17.8%), Retail Trade (3,148 | 12.4%), Manufacturing (2,620 | 10.3%), Administrative & Support (2,531 | 9.9%), and Health Care & Social Assistance (2,307 | 9.1%).
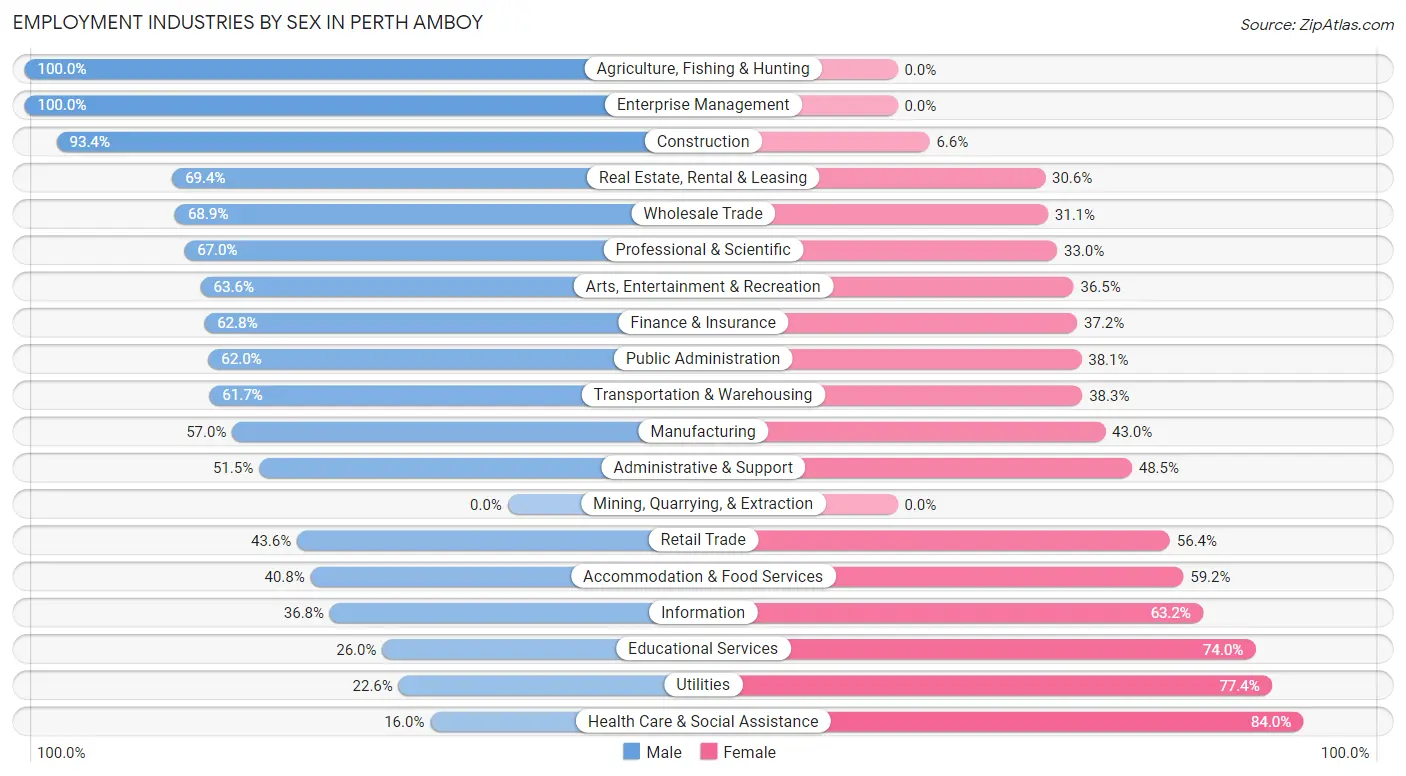
Employment Industries by Sex in Perth Amboy
The Perth Amboy industries that see more men than women are Agriculture, Fishing & Hunting (100.0%), Enterprise Management (100.0%), and Construction (93.4%), whereas the industries that tend to have a higher number of women are Health Care & Social Assistance (84.0%), Utilities (77.4%), and Educational Services (74.0%).
| Industry | Male | Female |
| Agriculture, Fishing & Hunting | 50 (100.0%) | 0 (0.0%) |
| Mining, Quarrying, & Extraction | 0 (0.0%) | 0 (0.0%) |
| Construction | 1,689 (93.4%) | 120 (6.6%) |
| Manufacturing | 1,494 (57.0%) | 1,126 (43.0%) |
| Wholesale Trade | 1,037 (68.9%) | 469 (31.1%) |
| Retail Trade | 1,373 (43.6%) | 1,775 (56.4%) |
| Transportation & Warehousing | 2,792 (61.7%) | 1,730 (38.3%) |
| Utilities | 7 (22.6%) | 24 (77.4%) |
| Information | 102 (36.8%) | 175 (63.2%) |
| Finance & Insurance | 527 (62.8%) | 312 (37.2%) |
| Real Estate, Rental & Leasing | 209 (69.4%) | 92 (30.6%) |
| Professional & Scientific | 458 (67.0%) | 226 (33.0%) |
| Enterprise Management | 56 (100.0%) | 0 (0.0%) |
| Administrative & Support | 1,303 (51.5%) | 1,228 (48.5%) |
| Educational Services | 404 (26.0%) | 1,152 (74.0%) |
| Health Care & Social Assistance | 370 (16.0%) | 1,937 (84.0%) |
| Arts, Entertainment & Recreation | 197 (63.5%) | 113 (36.4%) |
| Accommodation & Food Services | 458 (40.8%) | 664 (59.2%) |
| Public Administration | 363 (62.0%) | 223 (38.1%) |
| Total | 13,599 (53.4%) | 11,853 (46.6%) |
Education in Perth Amboy
School Enrollment in Perth Amboy
The most common levels of schooling among the 13,618 students in Perth Amboy are high school (3,216 | 23.6%), college / undergraduate (2,852 | 20.9%), and middle school (2,700 | 19.8%).
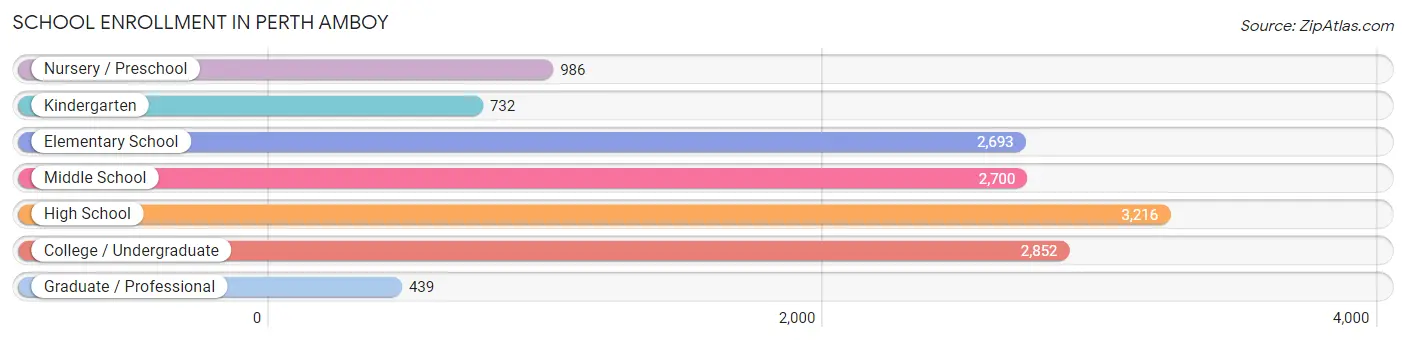
| School Level | # Students | % Students |
| Nursery / Preschool | 986 | 7.2% |
| Kindergarten | 732 | 5.4% |
| Elementary School | 2,693 | 19.8% |
| Middle School | 2,700 | 19.8% |
| High School | 3,216 | 23.6% |
| College / Undergraduate | 2,852 | 20.9% |
| Graduate / Professional | 439 | 3.2% |
| Total | 13,618 | 100.0% |
School Enrollment by Age by Funding Source in Perth Amboy
Out of a total of 13,618 students who are enrolled in schools in Perth Amboy, 1,185 (8.7%) attend a private institution, while the remaining 12,433 (91.3%) are enrolled in public schools. The age group of 35 years and over has the highest likelihood of being enrolled in private schools, with 145 (30.5% in the age bracket) enrolled. Conversely, the age group of 18 to 19 year olds has the lowest likelihood of being enrolled in a private school, with 1,010 (99.1% in the age bracket) attending a public institution.
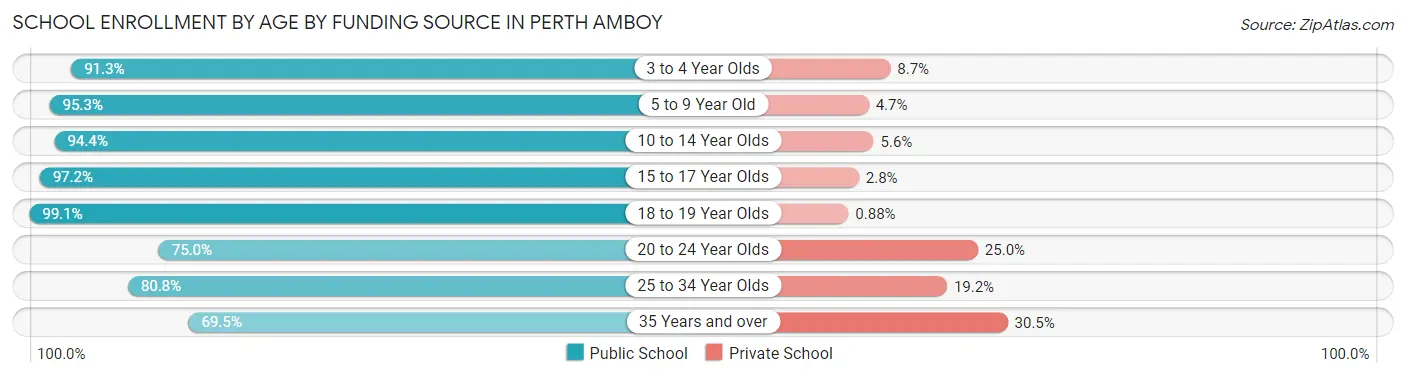
| Age Bracket | Public School | Private School |
| 3 to 4 Year Olds | 946 (91.3%) | 90 (8.7%) |
| 5 to 9 Year Old | 2,822 (95.3%) | 138 (4.7%) |
| 10 to 14 Year Olds | 3,271 (94.4%) | 193 (5.6%) |
| 15 to 17 Year Olds | 2,102 (97.2%) | 61 (2.8%) |
| 18 to 19 Year Olds | 1,010 (99.1%) | 9 (0.9%) |
| 20 to 24 Year Olds | 909 (75.0%) | 303 (25.0%) |
| 25 to 34 Year Olds | 1,041 (80.8%) | 248 (19.2%) |
| 35 Years and over | 330 (69.5%) | 145 (30.5%) |
| Total | 12,433 (91.3%) | 1,185 (8.7%) |
Educational Attainment by Field of Study in Perth Amboy
Business (910 | 16.0%), social sciences (640 | 11.2%), engineering (609 | 10.7%), education (600 | 10.5%), and science & technology (527 | 9.2%) are the most common fields of study among 5,701 individuals in Perth Amboy who have obtained a bachelor's degree or higher.
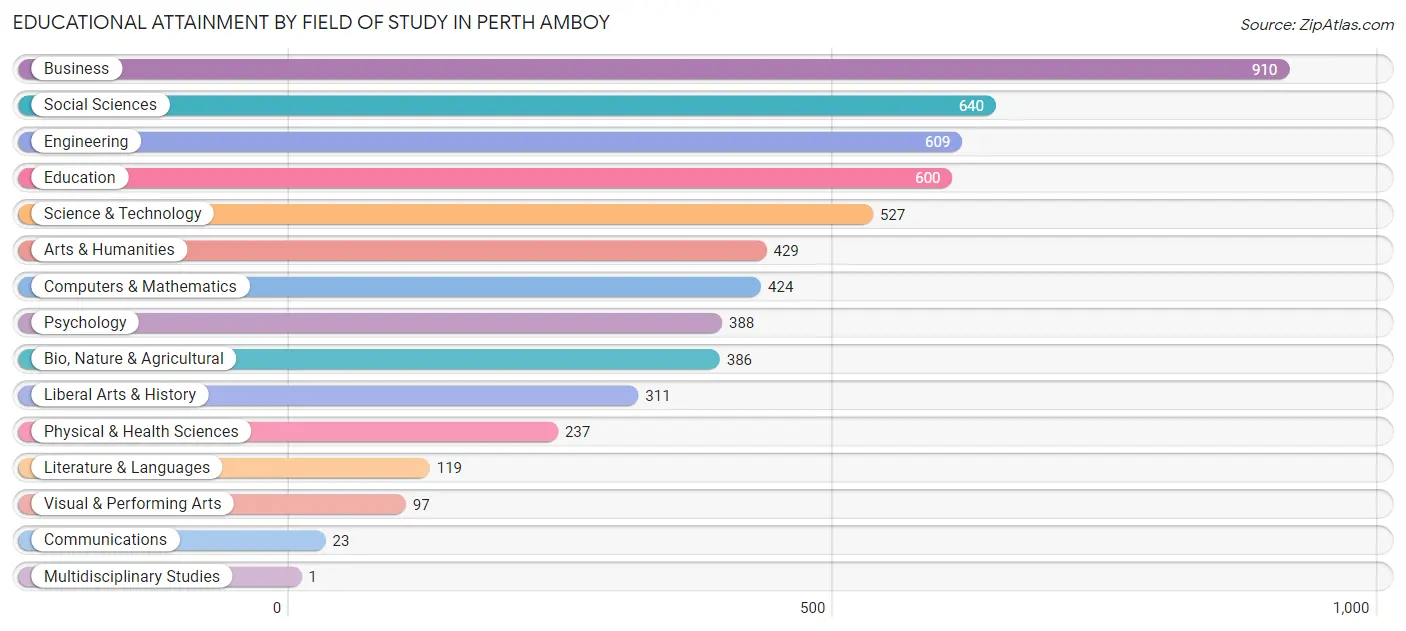
| Field of Study | # Graduates | % Graduates |
| Computers & Mathematics | 424 | 7.4% |
| Bio, Nature & Agricultural | 386 | 6.8% |
| Physical & Health Sciences | 237 | 4.2% |
| Psychology | 388 | 6.8% |
| Social Sciences | 640 | 11.2% |
| Engineering | 609 | 10.7% |
| Multidisciplinary Studies | 1 | 0.0% |
| Science & Technology | 527 | 9.2% |
| Business | 910 | 16.0% |
| Education | 600 | 10.5% |
| Literature & Languages | 119 | 2.1% |
| Liberal Arts & History | 311 | 5.5% |
| Visual & Performing Arts | 97 | 1.7% |
| Communications | 23 | 0.4% |
| Arts & Humanities | 429 | 7.5% |
| Total | 5,701 | 100.0% |
Transportation & Commute in Perth Amboy
Vehicle Availability by Sex in Perth Amboy
The most prevalent vehicle ownership categories in Perth Amboy are males with 1 vehicle (4,261, accounting for 32.6%) and females with 1 vehicle (3,844, making up 37.9%).
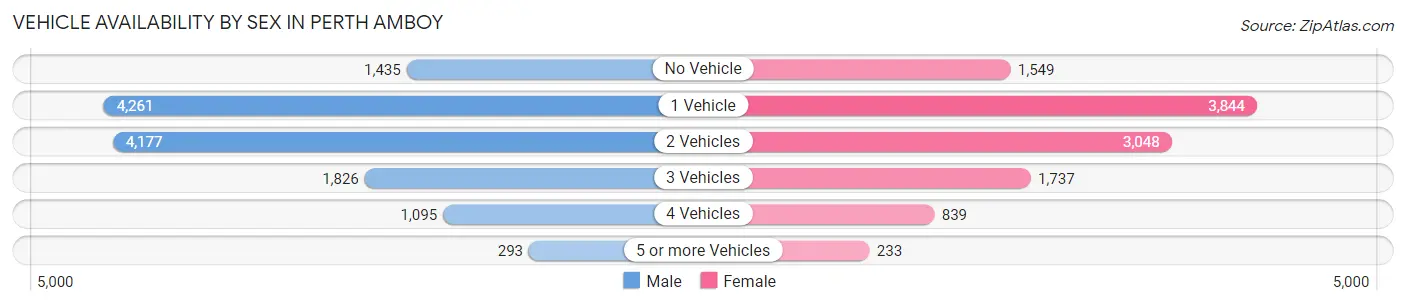
| Vehicles Available | Male | Female |
| No Vehicle | 1,435 (11.0%) | 1,549 (13.8%) |
| 1 Vehicle | 4,261 (32.6%) | 3,844 (34.2%) |
| 2 Vehicles | 4,177 (31.9%) | 3,048 (27.1%) |
| 3 Vehicles | 1,826 (14.0%) | 1,737 (15.4%) |
| 4 Vehicles | 1,095 (8.4%) | 839 (7.5%) |
| 5 or more Vehicles | 293 (2.2%) | 233 (2.1%) |
| Total | 13,087 (100.0%) | 11,250 (100.0%) |
Commute Time in Perth Amboy
The most frequently occuring commute durations in Perth Amboy are 30 to 34 minutes (3,893 commuters, 16.6%), 10 to 14 minutes (3,787 commuters, 16.2%), and 15 to 19 minutes (3,458 commuters, 14.8%).
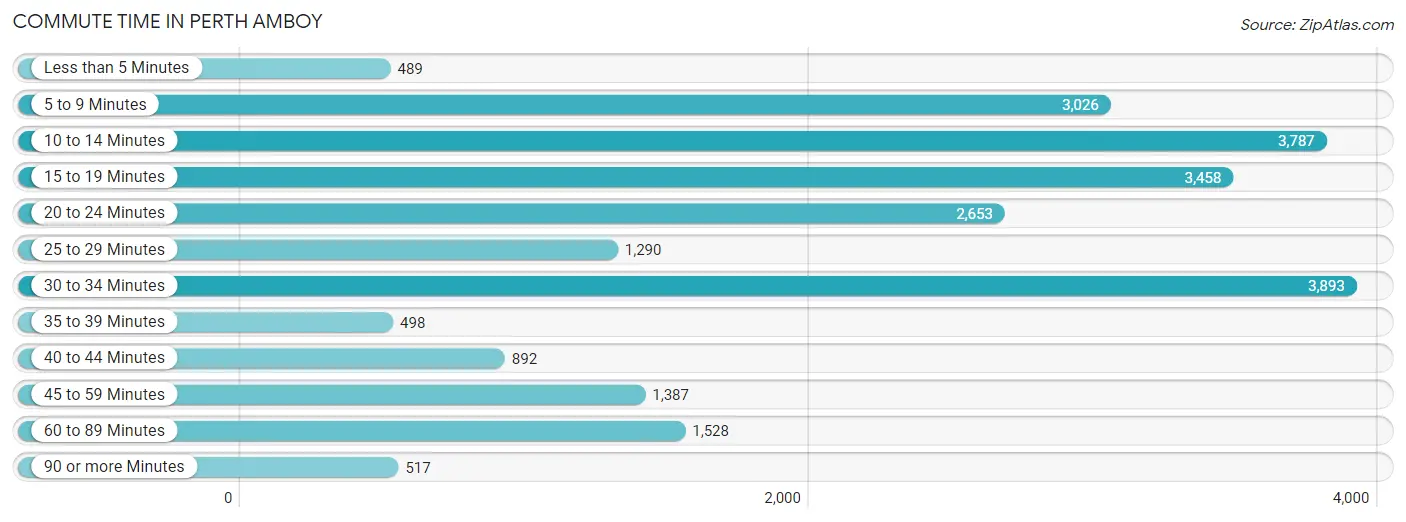
| Commute Time | # Commuters | % Commuters |
| Less than 5 Minutes | 489 | 2.1% |
| 5 to 9 Minutes | 3,026 | 12.9% |
| 10 to 14 Minutes | 3,787 | 16.2% |
| 15 to 19 Minutes | 3,458 | 14.8% |
| 20 to 24 Minutes | 2,653 | 11.3% |
| 25 to 29 Minutes | 1,290 | 5.5% |
| 30 to 34 Minutes | 3,893 | 16.6% |
| 35 to 39 Minutes | 498 | 2.1% |
| 40 to 44 Minutes | 892 | 3.8% |
| 45 to 59 Minutes | 1,387 | 5.9% |
| 60 to 89 Minutes | 1,528 | 6.5% |
| 90 or more Minutes | 517 | 2.2% |
Commute Time by Sex in Perth Amboy
The most common commute times in Perth Amboy are 30 to 34 minutes (2,168 commuters, 17.0%) for males and 10 to 14 minutes (2,125 commuters, 20.0%) for females.
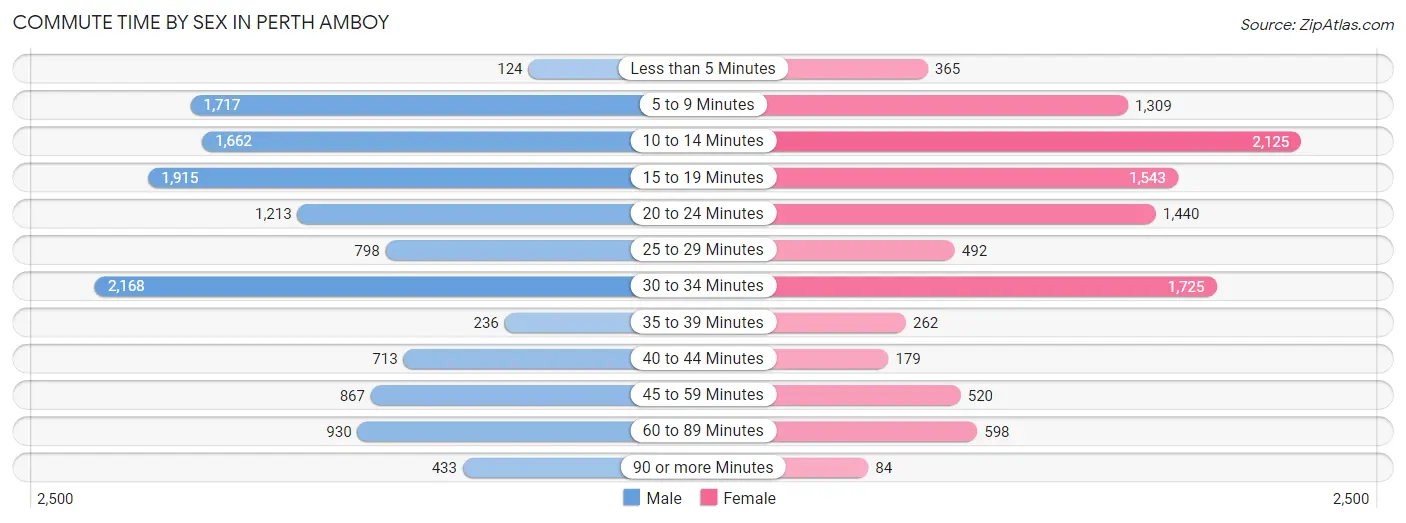
| Commute Time | Male | Female |
| Less than 5 Minutes | 124 (1.0%) | 365 (3.4%) |
| 5 to 9 Minutes | 1,717 (13.4%) | 1,309 (12.3%) |
| 10 to 14 Minutes | 1,662 (13.0%) | 2,125 (20.0%) |
| 15 to 19 Minutes | 1,915 (15.0%) | 1,543 (14.5%) |
| 20 to 24 Minutes | 1,213 (9.5%) | 1,440 (13.5%) |
| 25 to 29 Minutes | 798 (6.2%) | 492 (4.6%) |
| 30 to 34 Minutes | 2,168 (17.0%) | 1,725 (16.2%) |
| 35 to 39 Minutes | 236 (1.8%) | 262 (2.5%) |
| 40 to 44 Minutes | 713 (5.6%) | 179 (1.7%) |
| 45 to 59 Minutes | 867 (6.8%) | 520 (4.9%) |
| 60 to 89 Minutes | 930 (7.3%) | 598 (5.6%) |
| 90 or more Minutes | 433 (3.4%) | 84 (0.8%) |
Time of Departure to Work by Sex in Perth Amboy
The most frequent times of departure to work in Perth Amboy are 6:00 AM to 6:29 AM (1,965, 15.4%) for males and 7:00 AM to 7:29 AM (1,966, 18.5%) for females.
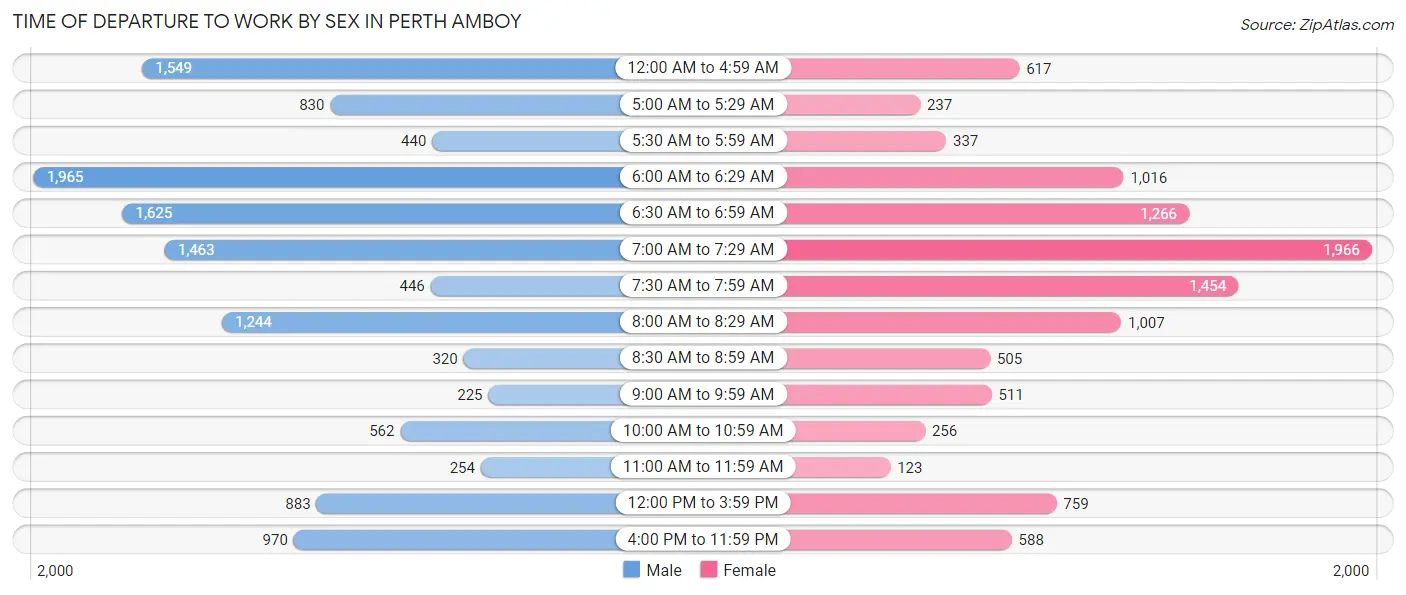
| Time of Departure | Male | Female |
| 12:00 AM to 4:59 AM | 1,549 (12.1%) | 617 (5.8%) |
| 5:00 AM to 5:29 AM | 830 (6.5%) | 237 (2.2%) |
| 5:30 AM to 5:59 AM | 440 (3.4%) | 337 (3.2%) |
| 6:00 AM to 6:29 AM | 1,965 (15.4%) | 1,016 (9.6%) |
| 6:30 AM to 6:59 AM | 1,625 (12.7%) | 1,266 (11.9%) |
| 7:00 AM to 7:29 AM | 1,463 (11.5%) | 1,966 (18.5%) |
| 7:30 AM to 7:59 AM | 446 (3.5%) | 1,454 (13.7%) |
| 8:00 AM to 8:29 AM | 1,244 (9.7%) | 1,007 (9.5%) |
| 8:30 AM to 8:59 AM | 320 (2.5%) | 505 (4.8%) |
| 9:00 AM to 9:59 AM | 225 (1.8%) | 511 (4.8%) |
| 10:00 AM to 10:59 AM | 562 (4.4%) | 256 (2.4%) |
| 11:00 AM to 11:59 AM | 254 (2.0%) | 123 (1.2%) |
| 12:00 PM to 3:59 PM | 883 (6.9%) | 759 (7.1%) |
| 4:00 PM to 11:59 PM | 970 (7.6%) | 588 (5.5%) |
| Total | 12,776 (100.0%) | 10,642 (100.0%) |
Housing Occupancy in Perth Amboy
Occupancy by Ownership in Perth Amboy
Of the total 18,409 dwellings in Perth Amboy, owner-occupied units account for 6,506 (35.3%), while renter-occupied units make up 11,903 (64.7%).
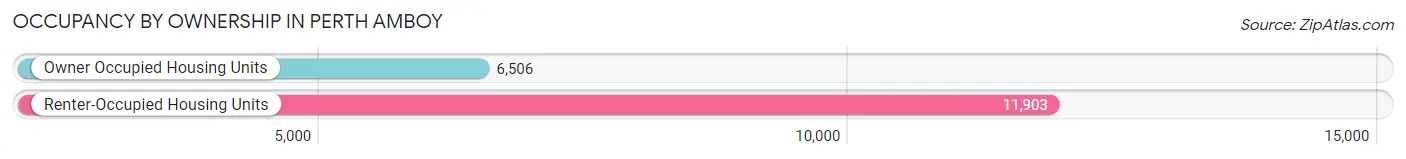
| Occupancy | # Housing Units | % Housing Units |
| Owner Occupied Housing Units | 6,506 | 35.3% |
| Renter-Occupied Housing Units | 11,903 | 64.7% |
| Total Occupied Housing Units | 18,409 | 100.0% |
Occupancy by Household Size in Perth Amboy
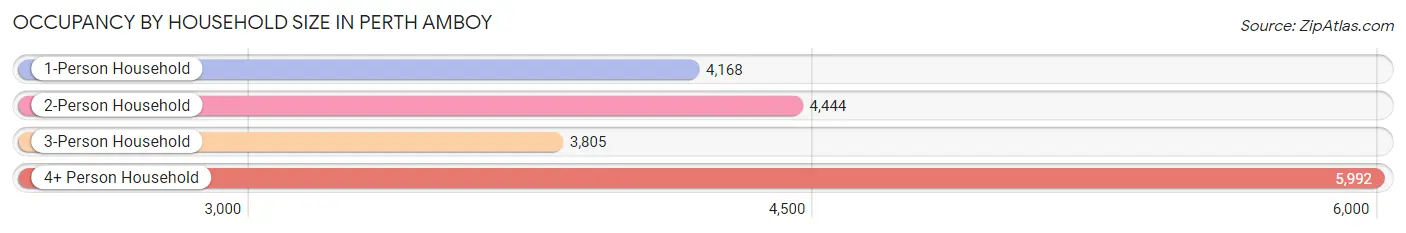
| Household Size | # Housing Units | % Housing Units |
| 1-Person Household | 4,168 | 22.6% |
| 2-Person Household | 4,444 | 24.1% |
| 3-Person Household | 3,805 | 20.7% |
| 4+ Person Household | 5,992 | 32.6% |
| Total Housing Units | 18,409 | 100.0% |
Occupancy by Ownership by Household Size in Perth Amboy

| Household Size | Owner-occupied | Renter-occupied |
| 1-Person Household | 1,256 (30.1%) | 2,912 (69.9%) |
| 2-Person Household | 1,881 (42.3%) | 2,563 (57.7%) |
| 3-Person Household | 1,176 (30.9%) | 2,629 (69.1%) |
| 4+ Person Household | 2,193 (36.6%) | 3,799 (63.4%) |
| Total Housing Units | 6,506 (35.3%) | 11,903 (64.7%) |
Occupancy by Educational Attainment in Perth Amboy
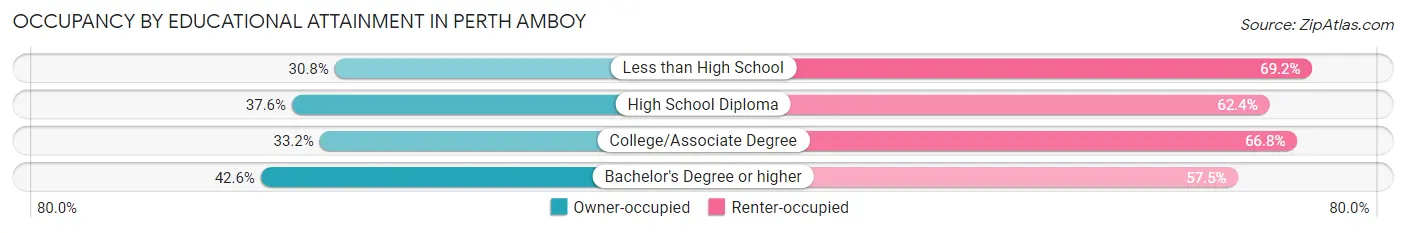
| Household Size | Owner-occupied | Renter-occupied |
| Less than High School | 1,676 (30.8%) | 3,760 (69.2%) |
| High School Diploma | 2,023 (37.6%) | 3,356 (62.4%) |
| College/Associate Degree | 1,511 (33.2%) | 3,037 (66.8%) |
| Bachelor's Degree or higher | 1,296 (42.5%) | 1,750 (57.5%) |
Occupancy by Age of Householder in Perth Amboy
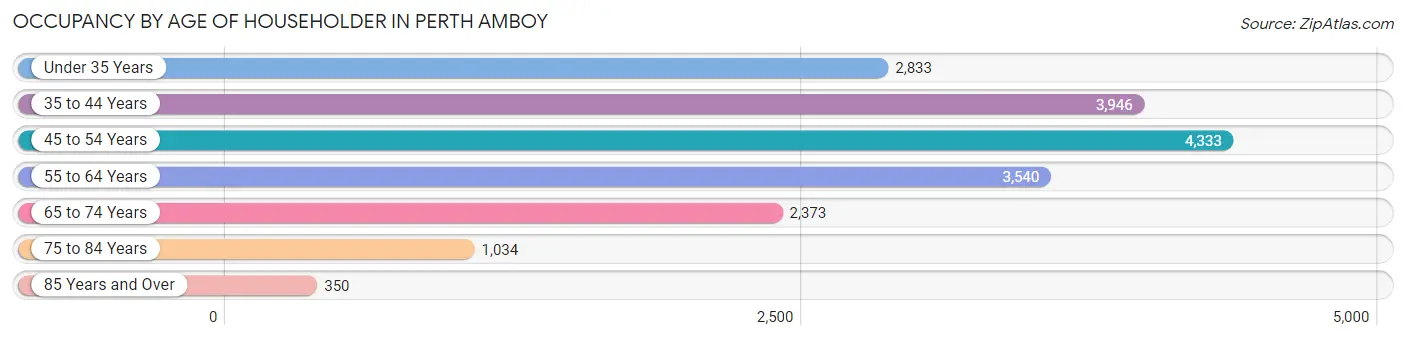
| Age Bracket | # Households | % Households |
| Under 35 Years | 2,833 | 15.4% |
| 35 to 44 Years | 3,946 | 21.4% |
| 45 to 54 Years | 4,333 | 23.5% |
| 55 to 64 Years | 3,540 | 19.2% |
| 65 to 74 Years | 2,373 | 12.9% |
| 75 to 84 Years | 1,034 | 5.6% |
| 85 Years and Over | 350 | 1.9% |
| Total | 18,409 | 100.0% |
Housing Finances in Perth Amboy
Median Income by Occupancy in Perth Amboy
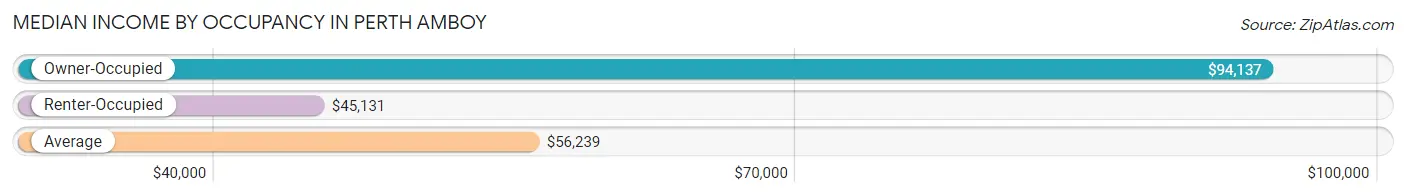
| Occupancy Type | # Households | Median Income |
| Owner-Occupied | 6,506 (35.3%) | $94,137 |
| Renter-Occupied | 11,903 (64.7%) | $45,131 |
| Average | 18,409 (100.0%) | $56,239 |
Occupancy by Householder Income Bracket in Perth Amboy
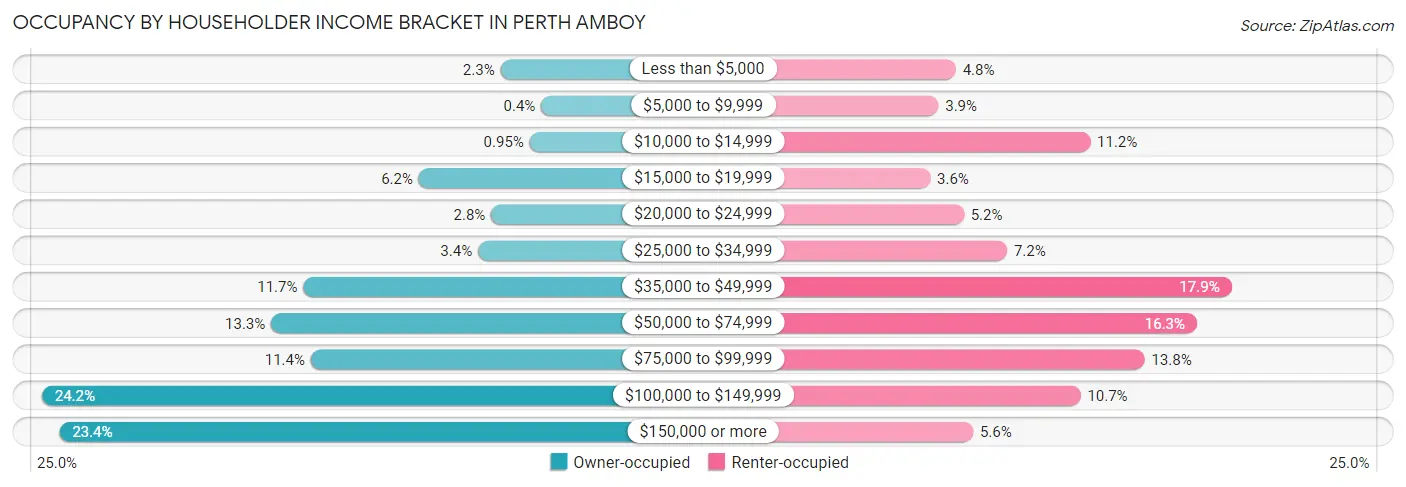
| Income Bracket | Owner-occupied | Renter-occupied |
| Less than $5,000 | 152 (2.3%) | 568 (4.8%) |
| $5,000 to $9,999 | 26 (0.4%) | 469 (3.9%) |
| $10,000 to $14,999 | 62 (0.9%) | 1,329 (11.2%) |
| $15,000 to $19,999 | 405 (6.2%) | 423 (3.5%) |
| $20,000 to $24,999 | 181 (2.8%) | 613 (5.1%) |
| $25,000 to $34,999 | 222 (3.4%) | 858 (7.2%) |
| $35,000 to $49,999 | 763 (11.7%) | 2,131 (17.9%) |
| $50,000 to $74,999 | 863 (13.3%) | 1,934 (16.3%) |
| $75,000 to $99,999 | 740 (11.4%) | 1,638 (13.8%) |
| $100,000 to $149,999 | 1,573 (24.2%) | 1,275 (10.7%) |
| $150,000 or more | 1,519 (23.4%) | 665 (5.6%) |
| Total | 6,506 (100.0%) | 11,903 (100.0%) |
Monthly Housing Cost Tiers in Perth Amboy
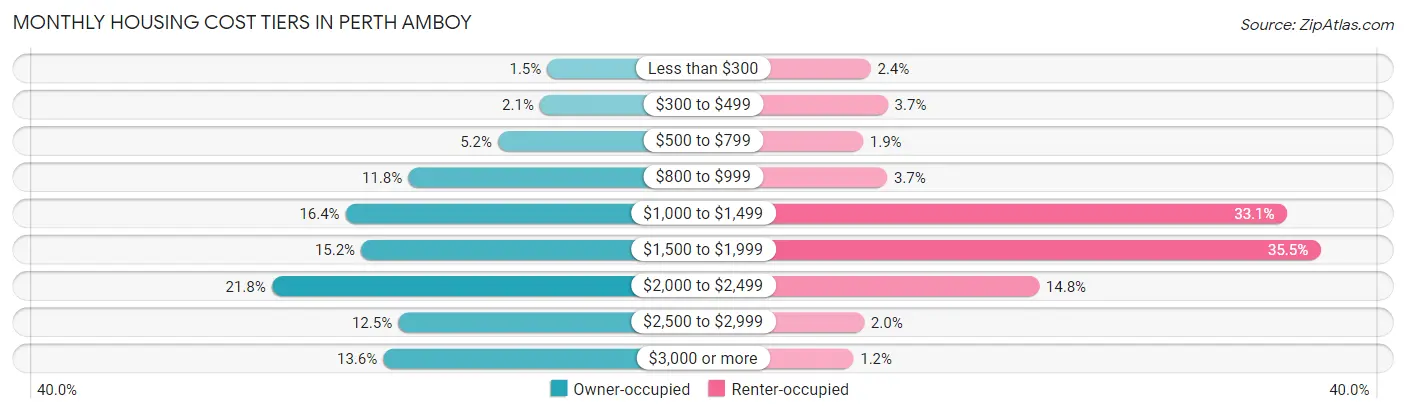
| Monthly Cost | Owner-occupied | Renter-occupied |
| Less than $300 | 99 (1.5%) | 290 (2.4%) |
| $300 to $499 | 134 (2.1%) | 440 (3.7%) |
| $500 to $799 | 335 (5.1%) | 222 (1.9%) |
| $800 to $999 | 765 (11.8%) | 435 (3.6%) |
| $1,000 to $1,499 | 1,065 (16.4%) | 3,935 (33.1%) |
| $1,500 to $1,999 | 991 (15.2%) | 4,230 (35.5%) |
| $2,000 to $2,499 | 1,419 (21.8%) | 1,767 (14.8%) |
| $2,500 to $2,999 | 813 (12.5%) | 232 (1.9%) |
| $3,000 or more | 885 (13.6%) | 139 (1.2%) |
| Total | 6,506 (100.0%) | 11,903 (100.0%) |
Physical Housing Characteristics in Perth Amboy
Housing Structures in Perth Amboy
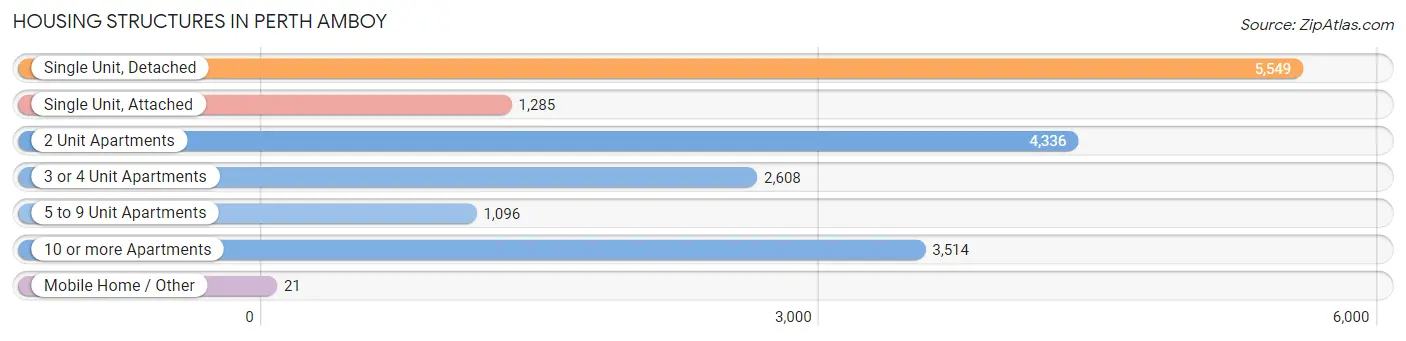
| Structure Type | # Housing Units | % Housing Units |
| Single Unit, Detached | 5,549 | 30.1% |
| Single Unit, Attached | 1,285 | 7.0% |
| 2 Unit Apartments | 4,336 | 23.5% |
| 3 or 4 Unit Apartments | 2,608 | 14.2% |
| 5 to 9 Unit Apartments | 1,096 | 5.9% |
| 10 or more Apartments | 3,514 | 19.1% |
| Mobile Home / Other | 21 | 0.1% |
| Total | 18,409 | 100.0% |
Housing Structures by Occupancy in Perth Amboy
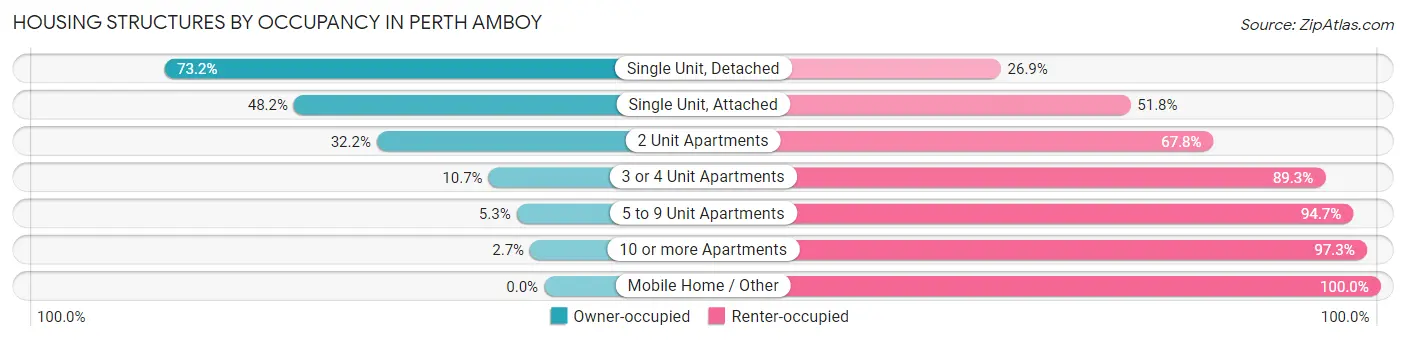
| Structure Type | Owner-occupied | Renter-occupied |
| Single Unit, Detached | 4,059 (73.2%) | 1,490 (26.9%) |
| Single Unit, Attached | 619 (48.2%) | 666 (51.8%) |
| 2 Unit Apartments | 1,396 (32.2%) | 2,940 (67.8%) |
| 3 or 4 Unit Apartments | 279 (10.7%) | 2,329 (89.3%) |
| 5 to 9 Unit Apartments | 58 (5.3%) | 1,038 (94.7%) |
| 10 or more Apartments | 95 (2.7%) | 3,419 (97.3%) |
| Mobile Home / Other | 0 (0.0%) | 21 (100.0%) |
| Total | 6,506 (35.3%) | 11,903 (64.7%) |
Housing Structures by Number of Rooms in Perth Amboy
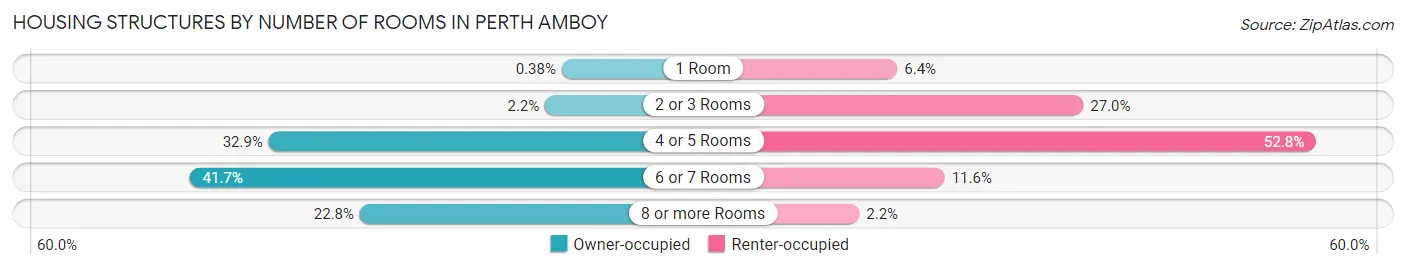
| Number of Rooms | Owner-occupied | Renter-occupied |
| 1 Room | 25 (0.4%) | 758 (6.4%) |
| 2 or 3 Rooms | 145 (2.2%) | 3,215 (27.0%) |
| 4 or 5 Rooms | 2,141 (32.9%) | 6,289 (52.8%) |
| 6 or 7 Rooms | 2,712 (41.7%) | 1,384 (11.6%) |
| 8 or more Rooms | 1,483 (22.8%) | 257 (2.2%) |
| Total | 6,506 (100.0%) | 11,903 (100.0%) |
Housing Structure by Heating Type in Perth Amboy
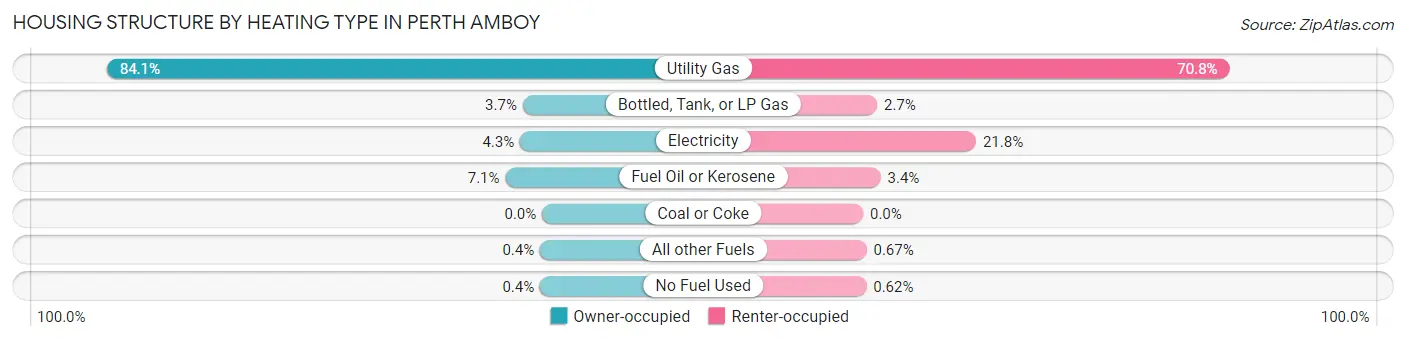
| Heating Type | Owner-occupied | Renter-occupied |
| Utility Gas | 5,472 (84.1%) | 8,426 (70.8%) |
| Bottled, Tank, or LP Gas | 243 (3.7%) | 321 (2.7%) |
| Electricity | 277 (4.3%) | 2,597 (21.8%) |
| Fuel Oil or Kerosene | 462 (7.1%) | 405 (3.4%) |
| Coal or Coke | 0 (0.0%) | 0 (0.0%) |
| All other Fuels | 26 (0.4%) | 80 (0.7%) |
| No Fuel Used | 26 (0.4%) | 74 (0.6%) |
| Total | 6,506 (100.0%) | 11,903 (100.0%) |
Household Vehicle Usage in Perth Amboy
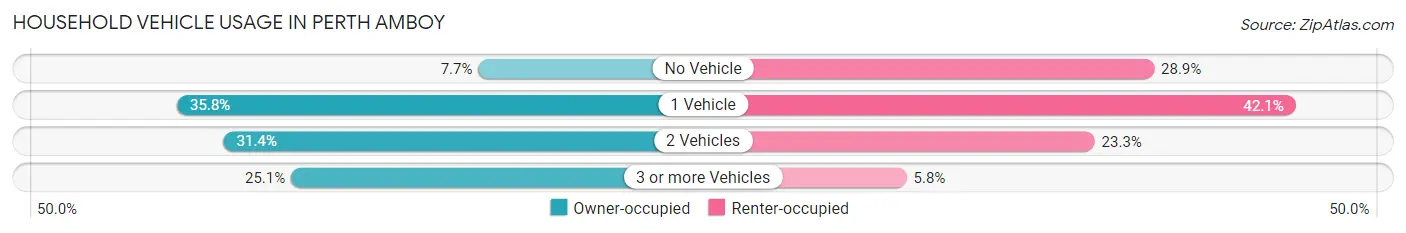
| Vehicles per Household | Owner-occupied | Renter-occupied |
| No Vehicle | 498 (7.6%) | 3,435 (28.9%) |
| 1 Vehicle | 2,328 (35.8%) | 5,007 (42.1%) |
| 2 Vehicles | 2,045 (31.4%) | 2,775 (23.3%) |
| 3 or more Vehicles | 1,635 (25.1%) | 686 (5.8%) |
| Total | 6,506 (100.0%) | 11,903 (100.0%) |
Real Estate & Mortgages in Perth Amboy
Real Estate and Mortgage Overview in Perth Amboy
| Characteristic | Without Mortgage | With Mortgage |
| Housing Units | 2,248 | 4,258 |
| Median Property Value | $306,900 | $336,900 |
| Median Household Income | $68,250 | $1,141 |
| Monthly Housing Costs | $1,011 | $831 |
| Real Estate Taxes | $7,425 | $279 |
Property Value by Mortgage Status in Perth Amboy
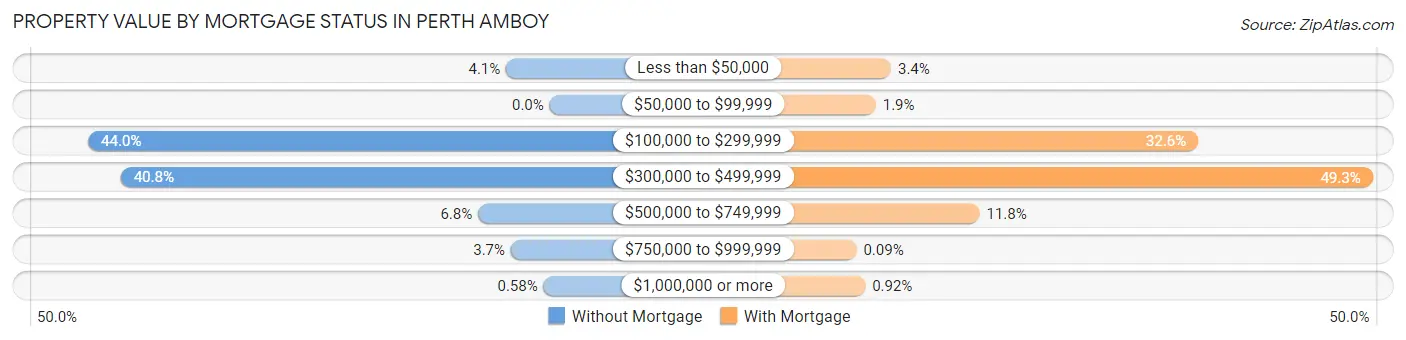
| Property Value | Without Mortgage | With Mortgage |
| Less than $50,000 | 93 (4.1%) | 144 (3.4%) |
| $50,000 to $99,999 | 0 (0.0%) | 82 (1.9%) |
| $100,000 to $299,999 | 988 (44.0%) | 1,389 (32.6%) |
| $300,000 to $499,999 | 918 (40.8%) | 2,097 (49.2%) |
| $500,000 to $749,999 | 153 (6.8%) | 503 (11.8%) |
| $750,000 to $999,999 | 83 (3.7%) | 4 (0.1%) |
| $1,000,000 or more | 13 (0.6%) | 39 (0.9%) |
| Total | 2,248 (100.0%) | 4,258 (100.0%) |
Household Income by Mortgage Status in Perth Amboy
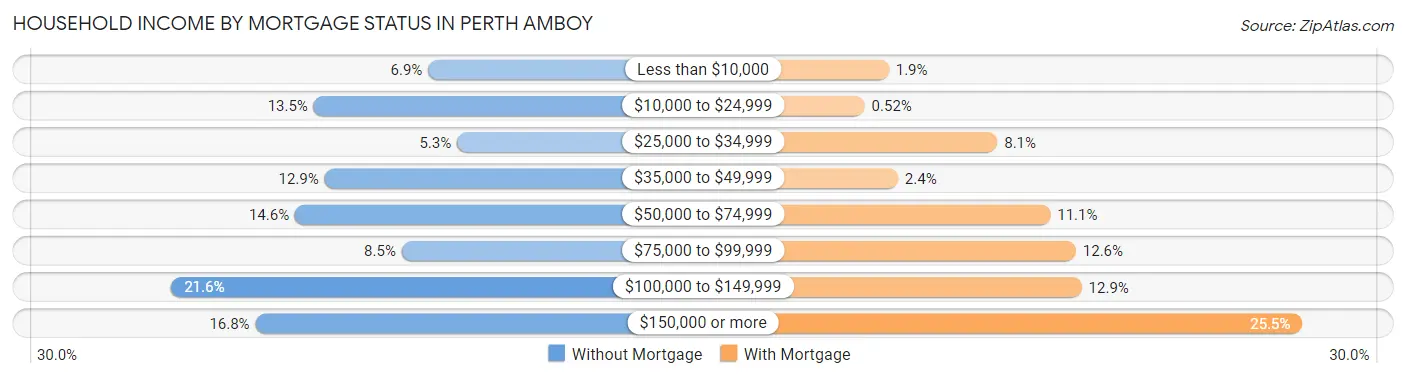
| Household Income | Without Mortgage | With Mortgage |
| Less than $10,000 | 156 (6.9%) | 81 (1.9%) |
| $10,000 to $24,999 | 303 (13.5%) | 22 (0.5%) |
| $25,000 to $34,999 | 119 (5.3%) | 345 (8.1%) |
| $35,000 to $49,999 | 289 (12.9%) | 103 (2.4%) |
| $50,000 to $74,999 | 327 (14.5%) | 474 (11.1%) |
| $75,000 to $99,999 | 190 (8.5%) | 536 (12.6%) |
| $100,000 to $149,999 | 486 (21.6%) | 550 (12.9%) |
| $150,000 or more | 378 (16.8%) | 1,087 (25.5%) |
| Total | 2,248 (100.0%) | 4,258 (100.0%) |
Property Value to Household Income Ratio in Perth Amboy
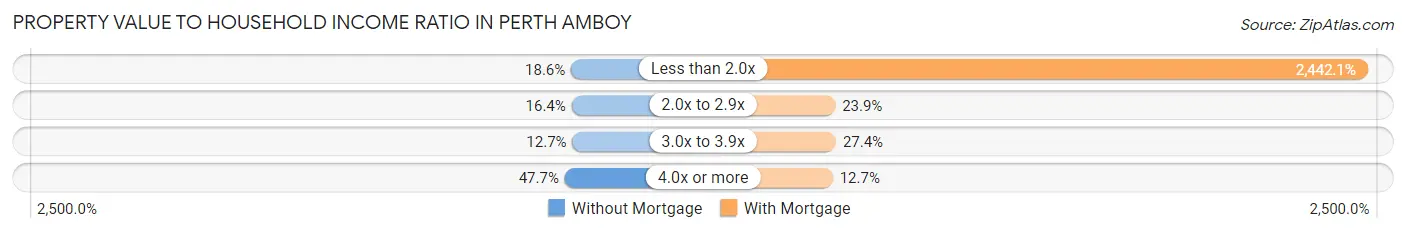
| Value-to-Income Ratio | Without Mortgage | With Mortgage |
| Less than 2.0x | 418 (18.6%) | 103,983 (2,442.1%) |
| 2.0x to 2.9x | 368 (16.4%) | 1,018 (23.9%) |
| 3.0x to 3.9x | 286 (12.7%) | 1,166 (27.4%) |
| 4.0x or more | 1,072 (47.7%) | 541 (12.7%) |
| Total | 2,248 (100.0%) | 4,258 (100.0%) |
Real Estate Taxes by Mortgage Status in Perth Amboy
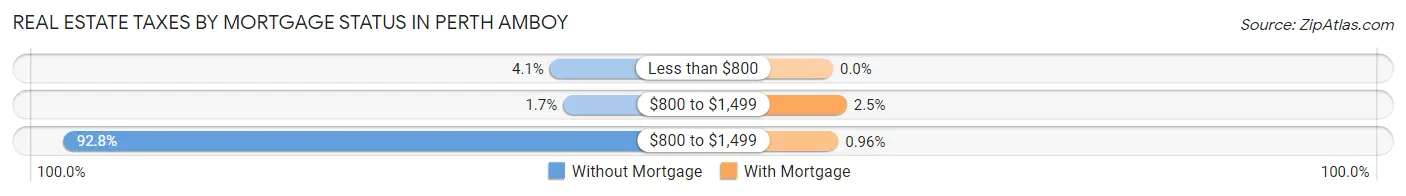
| Property Taxes | Without Mortgage | With Mortgage |
| Less than $800 | 92 (4.1%) | 0 (0.0%) |
| $800 to $1,499 | 37 (1.7%) | 107 (2.5%) |
| $800 to $1,499 | 2,087 (92.8%) | 41 (1.0%) |
| Total | 2,248 (100.0%) | 4,258 (100.0%) |
Health & Disability in Perth Amboy
Health Insurance Coverage by Age in Perth Amboy
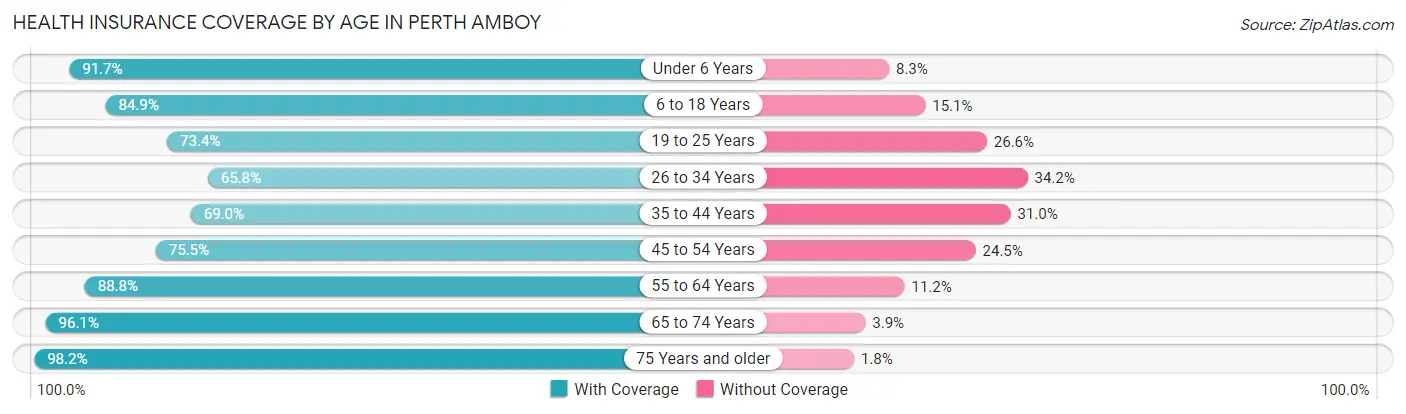
| Age Bracket | With Coverage | Without Coverage |
| Under 6 Years | 4,134 (91.7%) | 376 (8.3%) |
| 6 to 18 Years | 7,871 (84.9%) | 1,400 (15.1%) |
| 19 to 25 Years | 4,469 (73.4%) | 1,619 (26.6%) |
| 26 to 34 Years | 4,539 (65.8%) | 2,356 (34.2%) |
| 35 to 44 Years | 5,162 (69.0%) | 2,319 (31.0%) |
| 45 to 54 Years | 5,925 (75.5%) | 1,922 (24.5%) |
| 55 to 64 Years | 5,620 (88.8%) | 711 (11.2%) |
| 65 to 74 Years | 3,846 (96.1%) | 157 (3.9%) |
| 75 Years and older | 2,345 (98.2%) | 43 (1.8%) |
| Total | 43,911 (80.1%) | 10,903 (19.9%) |
Health Insurance Coverage by Citizenship Status in Perth Amboy
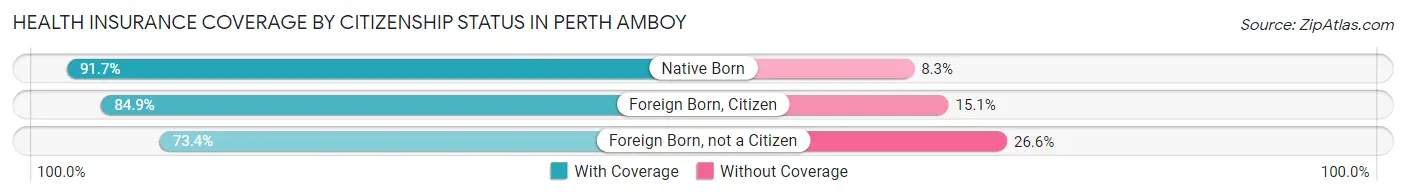
| Citizenship Status | With Coverage | Without Coverage |
| Native Born | 4,134 (91.7%) | 376 (8.3%) |
| Foreign Born, Citizen | 7,871 (84.9%) | 1,400 (15.1%) |
| Foreign Born, not a Citizen | 4,469 (73.4%) | 1,619 (26.6%) |
Health Insurance Coverage by Household Income in Perth Amboy
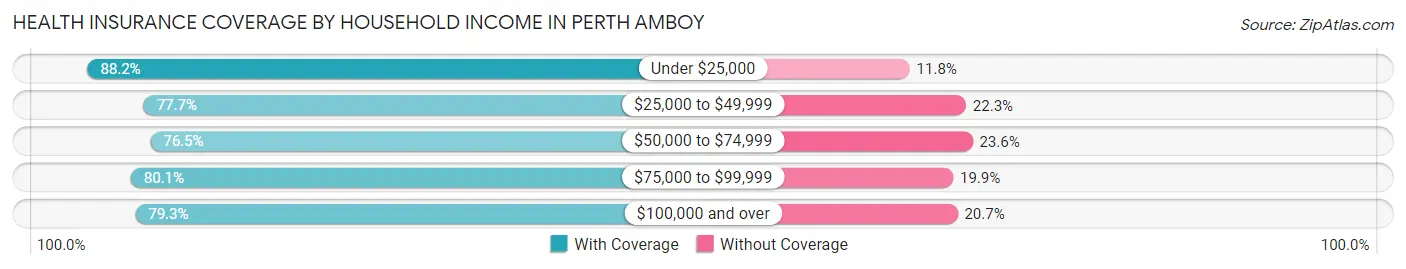
| Household Income | With Coverage | Without Coverage |
| Under $25,000 | 7,439 (88.2%) | 993 (11.8%) |
| $25,000 to $49,999 | 8,034 (77.7%) | 2,308 (22.3%) |
| $50,000 to $74,999 | 6,306 (76.4%) | 1,942 (23.5%) |
| $75,000 to $99,999 | 6,675 (80.1%) | 1,658 (19.9%) |
| $100,000 and over | 15,285 (79.3%) | 4,000 (20.7%) |
Public vs Private Health Insurance Coverage by Age in Perth Amboy
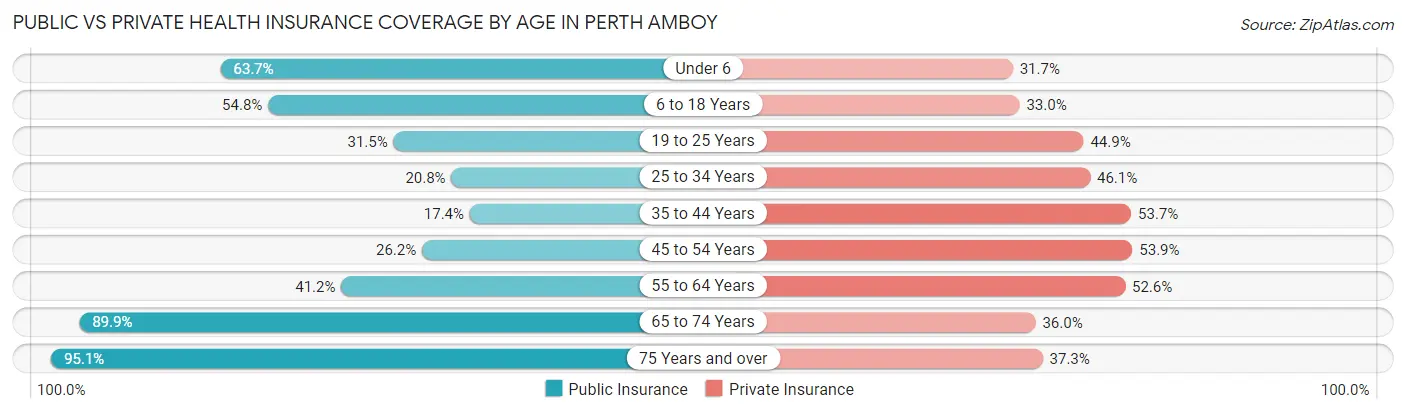
| Age Bracket | Public Insurance | Private Insurance |
| Under 6 | 2,871 (63.7%) | 1,431 (31.7%) |
| 6 to 18 Years | 5,080 (54.8%) | 3,058 (33.0%) |
| 19 to 25 Years | 1,919 (31.5%) | 2,731 (44.9%) |
| 25 to 34 Years | 1,432 (20.8%) | 3,177 (46.1%) |
| 35 to 44 Years | 1,298 (17.3%) | 4,017 (53.7%) |
| 45 to 54 Years | 2,058 (26.2%) | 4,232 (53.9%) |
| 55 to 64 Years | 2,609 (41.2%) | 3,329 (52.6%) |
| 65 to 74 Years | 3,597 (89.9%) | 1,439 (35.9%) |
| 75 Years and over | 2,271 (95.1%) | 890 (37.3%) |
| Total | 23,135 (42.2%) | 24,304 (44.3%) |
Disability Status by Sex by Age in Perth Amboy
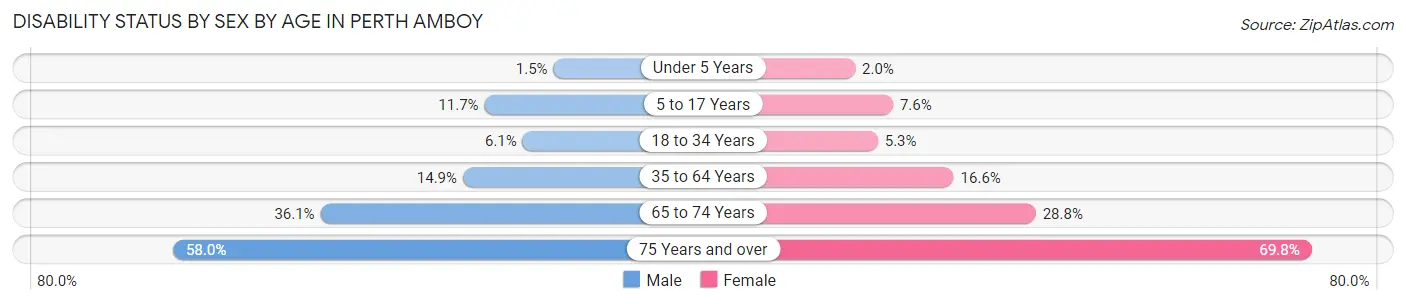
| Age Bracket | Male | Female |
| Under 5 Years | 28 (1.5%) | 39 (2.0%) |
| 5 to 17 Years | 513 (11.7%) | 347 (7.6%) |
| 18 to 34 Years | 432 (6.0%) | 363 (5.3%) |
| 35 to 64 Years | 1,599 (14.9%) | 1,817 (16.6%) |
| 65 to 74 Years | 685 (36.1%) | 606 (28.8%) |
| 75 Years and over | 539 (58.0%) | 1,017 (69.8%) |
Disability Class by Sex by Age in Perth Amboy
Disability Class: Hearing Difficulty
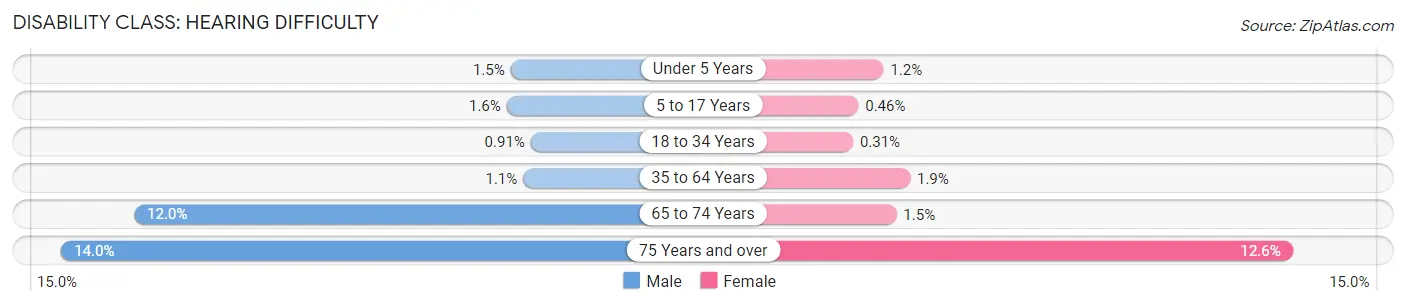
| Age Bracket | Male | Female |
| Under 5 Years | 28 (1.5%) | 23 (1.2%) |
| 5 to 17 Years | 69 (1.6%) | 21 (0.5%) |
| 18 to 34 Years | 65 (0.9%) | 21 (0.3%) |
| 35 to 64 Years | 120 (1.1%) | 208 (1.9%) |
| 65 to 74 Years | 227 (11.9%) | 32 (1.5%) |
| 75 Years and over | 130 (14.0%) | 183 (12.6%) |
Disability Class: Vision Difficulty
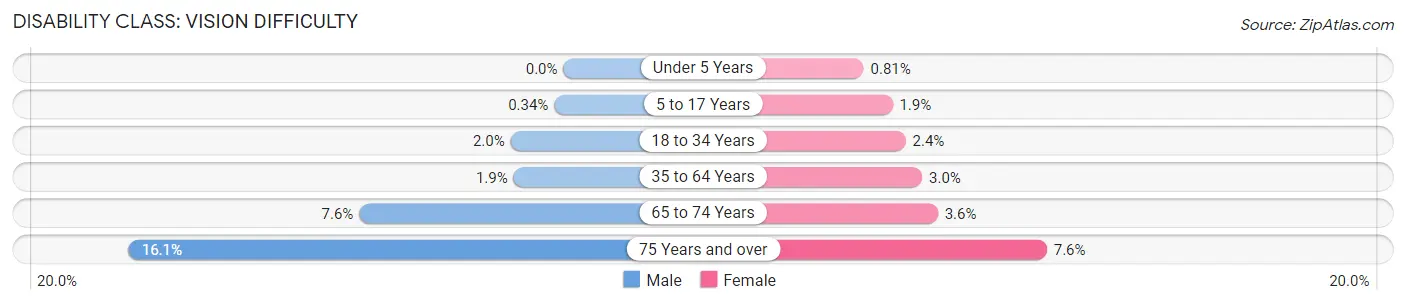
| Age Bracket | Male | Female |
| Under 5 Years | 0 (0.0%) | 16 (0.8%) |
| 5 to 17 Years | 15 (0.3%) | 86 (1.9%) |
| 18 to 34 Years | 140 (2.0%) | 161 (2.4%) |
| 35 to 64 Years | 198 (1.8%) | 326 (3.0%) |
| 65 to 74 Years | 144 (7.6%) | 75 (3.6%) |
| 75 Years and over | 150 (16.1%) | 111 (7.6%) |
Disability Class: Cognitive Difficulty
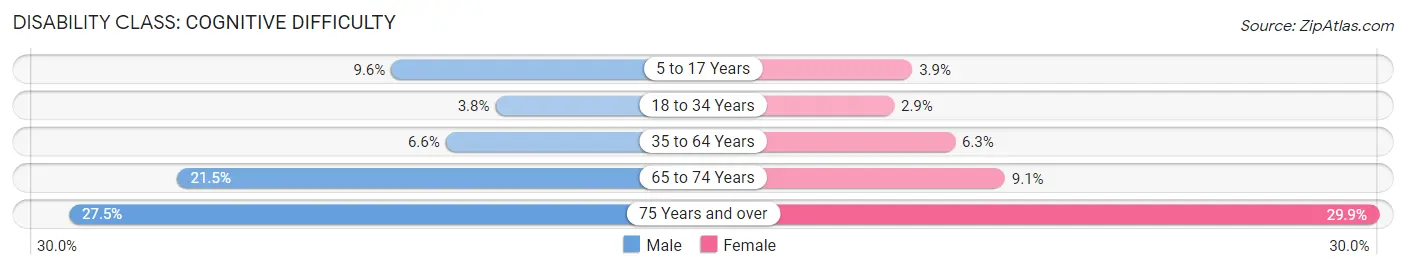
| Age Bracket | Male | Female |
| 5 to 17 Years | 420 (9.6%) | 179 (3.9%) |
| 18 to 34 Years | 271 (3.8%) | 198 (2.9%) |
| 35 to 64 Years | 703 (6.6%) | 689 (6.3%) |
| 65 to 74 Years | 408 (21.5%) | 191 (9.1%) |
| 75 Years and over | 256 (27.5%) | 436 (29.9%) |
Disability Class: Ambulatory Difficulty
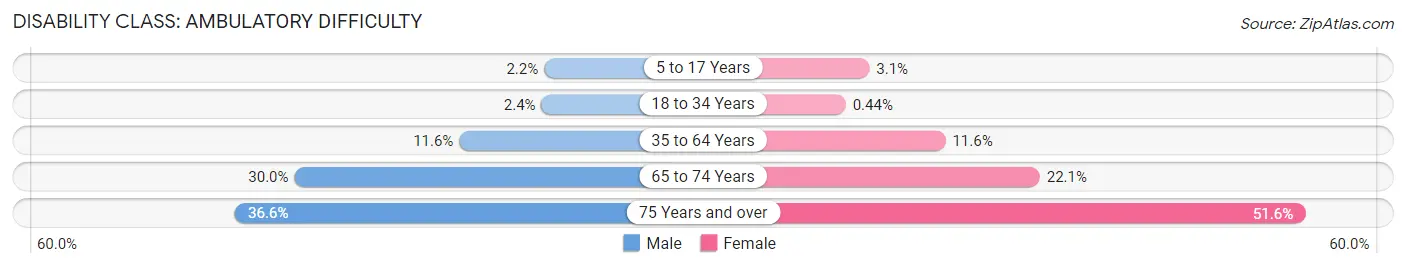
| Age Bracket | Male | Female |
| 5 to 17 Years | 94 (2.1%) | 140 (3.1%) |
| 18 to 34 Years | 174 (2.4%) | 30 (0.4%) |
| 35 to 64 Years | 1,243 (11.6%) | 1,264 (11.6%) |
| 65 to 74 Years | 569 (30.0%) | 464 (22.1%) |
| 75 Years and over | 340 (36.6%) | 752 (51.6%) |
Disability Class: Self-Care Difficulty
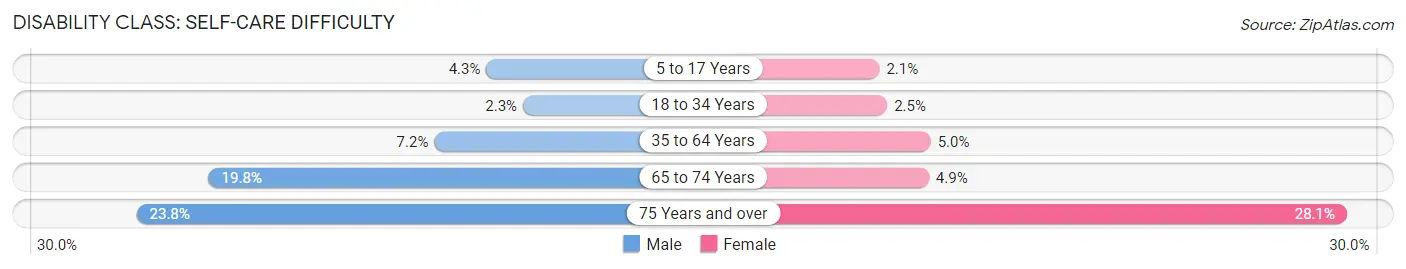
| Age Bracket | Male | Female |
| 5 to 17 Years | 188 (4.3%) | 96 (2.1%) |
| 18 to 34 Years | 161 (2.2%) | 172 (2.5%) |
| 35 to 64 Years | 771 (7.2%) | 542 (5.0%) |
| 65 to 74 Years | 375 (19.8%) | 102 (4.9%) |
| 75 Years and over | 221 (23.8%) | 410 (28.1%) |
Technology Access in Perth Amboy
Computing Device Access in Perth Amboy
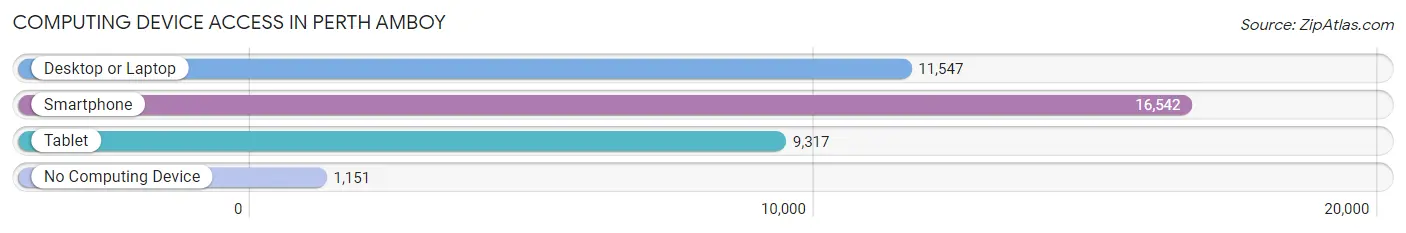
| Device Type | # Households | % Households |
| Desktop or Laptop | 11,547 | 62.7% |
| Smartphone | 16,542 | 89.9% |
| Tablet | 9,317 | 50.6% |
| No Computing Device | 1,151 | 6.2% |
| Total | 18,409 | 100.0% |
Internet Access in Perth Amboy
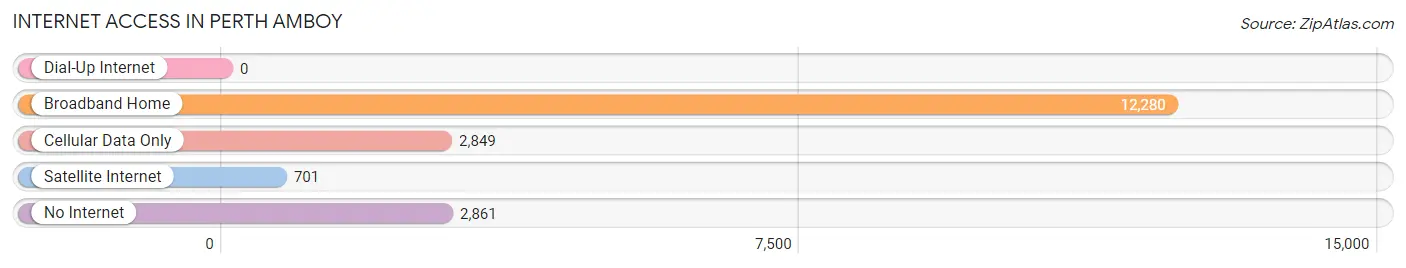
| Internet Type | # Households | % Households |
| Dial-Up Internet | 0 | 0.0% |
| Broadband Home | 12,280 | 66.7% |
| Cellular Data Only | 2,849 | 15.5% |
| Satellite Internet | 701 | 3.8% |
| No Internet | 2,861 | 15.5% |
| Total | 18,409 | 100.0% |
Perth Amboy Summary
Perth Amboy is a city located in Middlesex County, New Jersey, United States. It is situated on the Raritan Bay, near the mouth of the Raritan River. As of the 2010 United States Census, the city had a total population of 50,814, making it the fifth-most populous city in New Jersey. Perth Amboy is known as the "City by the Bay," due to its location on the Raritan Bay.
History
Perth Amboy was founded in 1683 by Scottish colonists, and was the capital of East Jersey from 1686 to 1776. It was the site of the first permanent European settlement in New Jersey. The city was originally called New Perth, after James Drummond, 4th Earl of Perth, who was the Proprietor of East Jersey. The city was later renamed Perth Amboy in 1686, after the Earl's title.
The city was the site of several battles during the American Revolutionary War, including the Battle of Perth Amboy in 1776. During the 19th century, Perth Amboy was an important port city, with a thriving fishing industry and a major shipbuilding industry. The city was also a major center of industry, with several factories and mills operating in the city.
Geography
Perth Amboy is located at 40°30′N 74°17′W (40.50, -74.28). According to the United States Census Bureau, the city has a total area of 5.9 square miles (15.3 km2), of which 5.7 square miles (14.8 km2) is land and 0.2 square miles (0.5 km2) (3.45%) is water.
The city is located on the Raritan Bay, near the mouth of the Raritan River. It is bordered to the north by Sayreville, to the east by South Amboy, to the south by Woodbridge Township, and to the west by the Arthur Kill.
Economy
Perth Amboy has a diverse economy, with a mix of manufacturing, retail, and service industries. The city is home to several major employers, including Johnson & Johnson, the Port Authority of New York and New Jersey, and the New Jersey Department of Transportation.
The city is also home to several smaller businesses, including several restaurants, bars, and retail stores. The city is also home to several marinas, which provide services to recreational boaters.
Demographics
As of the 2010 United States Census, there were 50,814 people, 17,945 households, and 11,845 families residing in the city. The population density was 8,845.3 per square mile (3,420.2/km2). There were 19,845 housing units at an average density of 3,444.3 per square mile (1,327.2/km2). The racial makeup of the city was 44.2% (22,521) White, 28.2% (14,323) African American, 0.5% (258) Native American, 8.2% (4,150) Asian, 0.1% (50) Pacific Islander, 16.2% (8,204) from other races, and 2.7% (1,368) from two or more races. Hispanic or Latino of any race were 44.2% (22,521) of the population.
The median income for a household in the city was $41,945, and the median income for a family was $50,945. Males had a median income of $37,945 versus $30,945 for females. The per capita income for the city was $20,945. About 11.2% of families and 14.2% of the population were below the poverty line, including 19.2% of those under age 18 and 11.2% of those age 65 or over.
Common Questions
What is Per Capita Income in Perth Amboy?
Per Capita income in Perth Amboy is $25,853.
What is the Median Family Income in Perth Amboy?
Median Family Income in Perth Amboy is $55,129.
What is the Median Household income in Perth Amboy?
Median Household Income in Perth Amboy is $56,239.
What is Income or Wage Gap in Perth Amboy?
Income or Wage Gap in Perth Amboy is 29.6%.
Women in Perth Amboy earn 70.4 cents for every dollar earned by a man.
What is Family Income Deficit in Perth Amboy?
Family Income Deficit in Perth Amboy is $9,962.
Families that are below poverty line in Perth Amboy earn $9,962 less on average than the poverty threshold level.
What is Inequality or Gini Index in Perth Amboy?
Inequality or Gini Index in Perth Amboy is 0.45.
What is the Total Population of Perth Amboy?
Total Population of Perth Amboy is 55,226.
What is the Total Male Population of Perth Amboy?
Total Male Population of Perth Amboy is 27,133.
What is the Total Female Population of Perth Amboy?
Total Female Population of Perth Amboy is 28,093.
What is the Ratio of Males per 100 Females in Perth Amboy?
There are 96.58 Males per 100 Females in Perth Amboy.
What is the Ratio of Females per 100 Males in Perth Amboy?
There are 103.54 Females per 100 Males in Perth Amboy.
What is the Median Population Age in Perth Amboy?
Median Population Age in Perth Amboy is 36.0 Years.
What is the Average Family Size in Perth Amboy
Average Family Size in Perth Amboy is 3.4 People.
What is the Average Household Size in Perth Amboy
Average Household Size in Perth Amboy is 3.0 People.
How Large is the Labor Force in Perth Amboy?
There are 28,766 People in the Labor Forcein in Perth Amboy.
What is the Percentage of People in the Labor Force in Perth Amboy?
65.0% of People are in the Labor Force in Perth Amboy.
What is the Unemployment Rate in Perth Amboy?
Unemployment Rate in Perth Amboy is 11.3%.