East Orange, NJ Map & Demographics
East Orange Map
East Orange Overview
$30,503
PER CAPITA INCOME
$73,510
AVG FAMILY INCOME
$58,659
AVG HOUSEHOLD INCOME
4.1%
WAGE / INCOME GAP [ % ]
95.9¢/ $1
WAGE / INCOME GAP [ $ ]
$12,046
FAMILY INCOME DEFICIT
0.46
INEQUALITY / GINI INDEX
68,879
TOTAL POPULATION
31,325
MALE POPULATION
37,554
FEMALE POPULATION
83.41
MALES / 100 FEMALES
119.89
FEMALES / 100 MALES
35.1
MEDIAN AGE
3.6
AVG FAMILY SIZE
2.6
AVG HOUSEHOLD SIZE
36,056
LABOR FORCE [ PEOPLE ]
66.9%
PERCENT IN LABOR FORCE
11.6%
UNEMPLOYMENT RATE
East Orange Area Codes
Income in East Orange
Income Overview in East Orange
Per Capita Income in East Orange is $30,503, while median incomes of families and households are $73,510 and $58,659 respectively.
| Characteristic | Number | Measure |
| Per Capita Income | 68,879 | $30,503 |
| Median Family Income | 14,506 | $73,510 |
| Mean Family Income | 14,506 | $88,238 |
| Median Household Income | 26,359 | $58,659 |
| Mean Household Income | 26,359 | $75,197 |
| Income Deficit | 14,506 | $12,046 |
| Wage / Income Gap (%) | 68,879 | 4.14% |
| Wage / Income Gap ($) | 68,879 | 95.86¢ per $1 |
| Gini / Inequality Index | 68,879 | 0.46 |
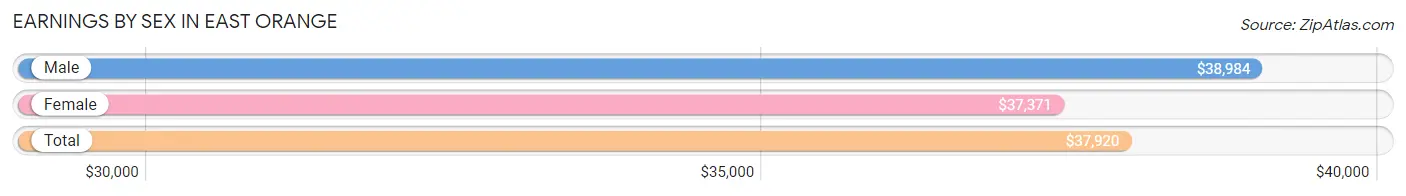
Earnings by Sex in East Orange
Average Earnings in East Orange are $37,920, $38,984 for men and $37,371 for women, a difference of 4.1%.
| Sex | Number | Average Earnings |
| Male | 16,554 (46.2%) | $38,984 |
| Female | 19,257 (53.8%) | $37,371 |
| Total | 35,811 (100.0%) | $37,920 |
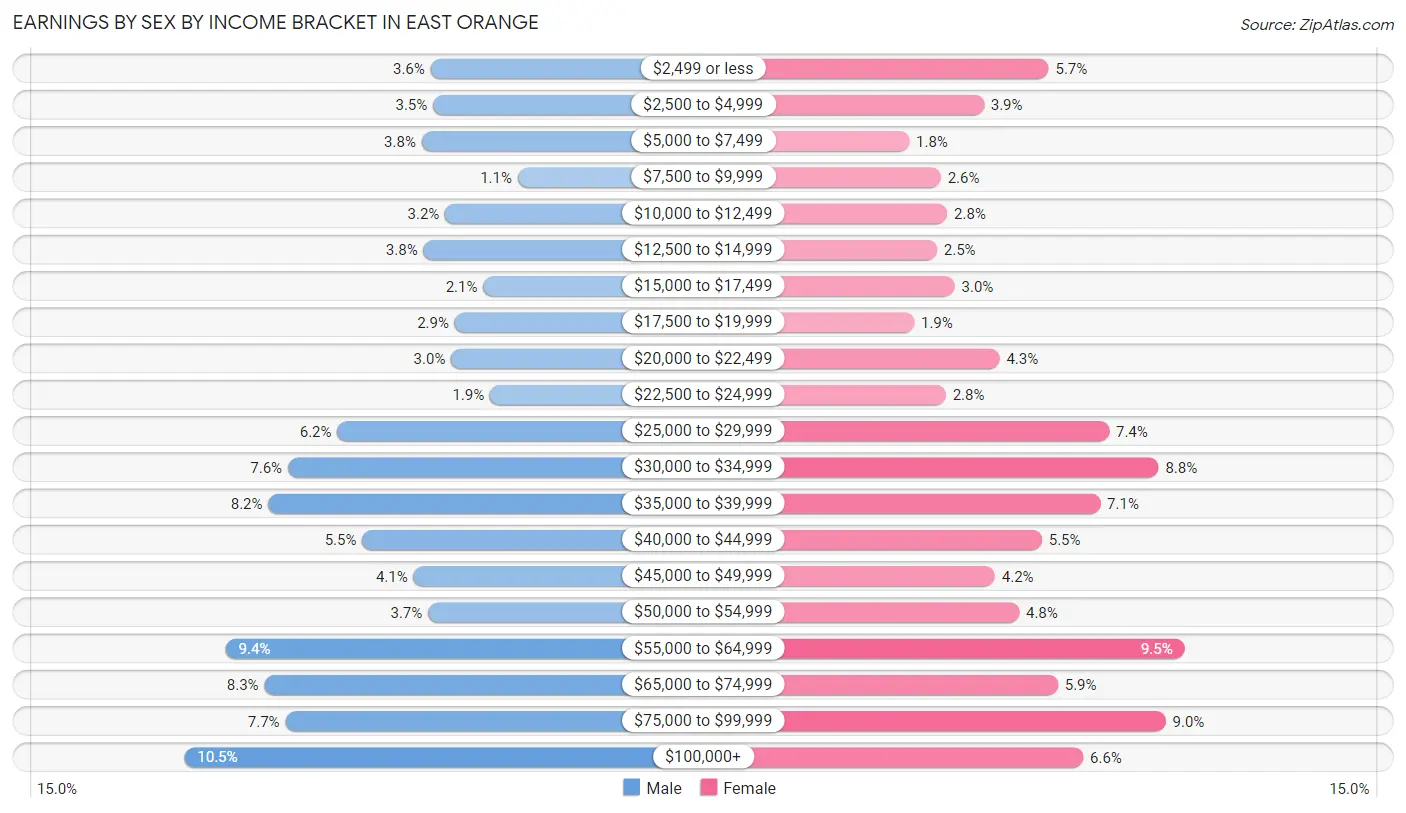
Earnings by Sex by Income Bracket in East Orange
The most common earnings brackets in East Orange are $100,000+ for men (1,740 | 10.5%) and $55,000 to $64,999 for women (1,827 | 9.5%).
| Income | Male | Female |
| $2,499 or less | 594 (3.6%) | 1,091 (5.7%) |
| $2,500 to $4,999 | 583 (3.5%) | 742 (3.8%) |
| $5,000 to $7,499 | 636 (3.8%) | 337 (1.8%) |
| $7,500 to $9,999 | 188 (1.1%) | 509 (2.6%) |
| $10,000 to $12,499 | 527 (3.2%) | 543 (2.8%) |
| $12,500 to $14,999 | 627 (3.8%) | 487 (2.5%) |
| $15,000 to $17,499 | 350 (2.1%) | 583 (3.0%) |
| $17,500 to $19,999 | 482 (2.9%) | 363 (1.9%) |
| $20,000 to $22,499 | 498 (3.0%) | 826 (4.3%) |
| $22,500 to $24,999 | 318 (1.9%) | 536 (2.8%) |
| $25,000 to $29,999 | 1,028 (6.2%) | 1,420 (7.4%) |
| $30,000 to $34,999 | 1,258 (7.6%) | 1,687 (8.8%) |
| $35,000 to $39,999 | 1,349 (8.2%) | 1,372 (7.1%) |
| $40,000 to $44,999 | 912 (5.5%) | 1,055 (5.5%) |
| $45,000 to $49,999 | 674 (4.1%) | 801 (4.2%) |
| $50,000 to $54,999 | 606 (3.7%) | 933 (4.8%) |
| $55,000 to $64,999 | 1,547 (9.3%) | 1,827 (9.5%) |
| $65,000 to $74,999 | 1,368 (8.3%) | 1,141 (5.9%) |
| $75,000 to $99,999 | 1,269 (7.7%) | 1,726 (9.0%) |
| $100,000+ | 1,740 (10.5%) | 1,278 (6.6%) |
| Total | 16,554 (100.0%) | 19,257 (100.0%) |
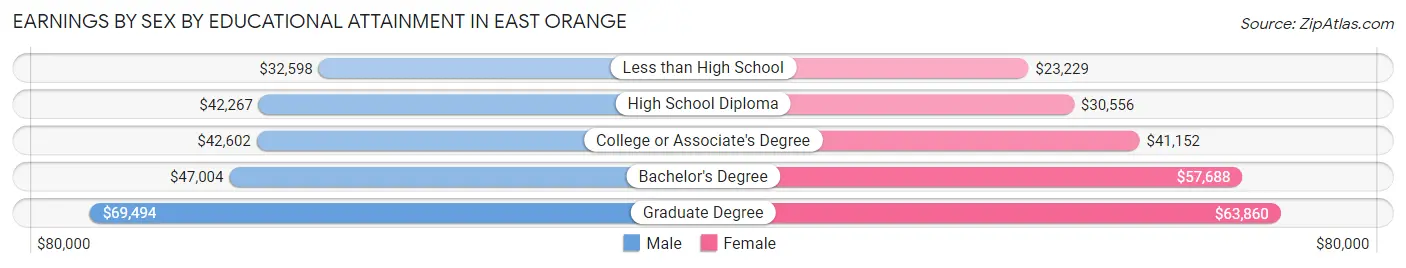
Earnings by Sex by Educational Attainment in East Orange
Average earnings in East Orange are $42,177 for men and $39,201 for women, a difference of 7.1%. Men with an educational attainment of graduate degree enjoy the highest average annual earnings of $69,494, while those with less than high school education earn the least with $32,598. Women with an educational attainment of graduate degree earn the most with the average annual earnings of $63,860, while those with less than high school education have the smallest earnings of $23,229.
| Educational Attainment | Male Income | Female Income |
| Less than High School | $32,598 | $23,229 |
| High School Diploma | $42,267 | $30,556 |
| College or Associate's Degree | $42,602 | $41,152 |
| Bachelor's Degree | $47,004 | $57,688 |
| Graduate Degree | $69,494 | $63,860 |
| Total | $42,177 | $39,201 |
Family Income in East Orange
Family Income Brackets in East Orange
According to the East Orange family income data, there are 3,235 families falling into the $100,000 to $149,999 income range, which is the most common income bracket and makes up 22.3% of all families. Conversely, the $10,000 to $14,999 income bracket is the least frequent group with only 261 families (1.8%) belonging to this category.
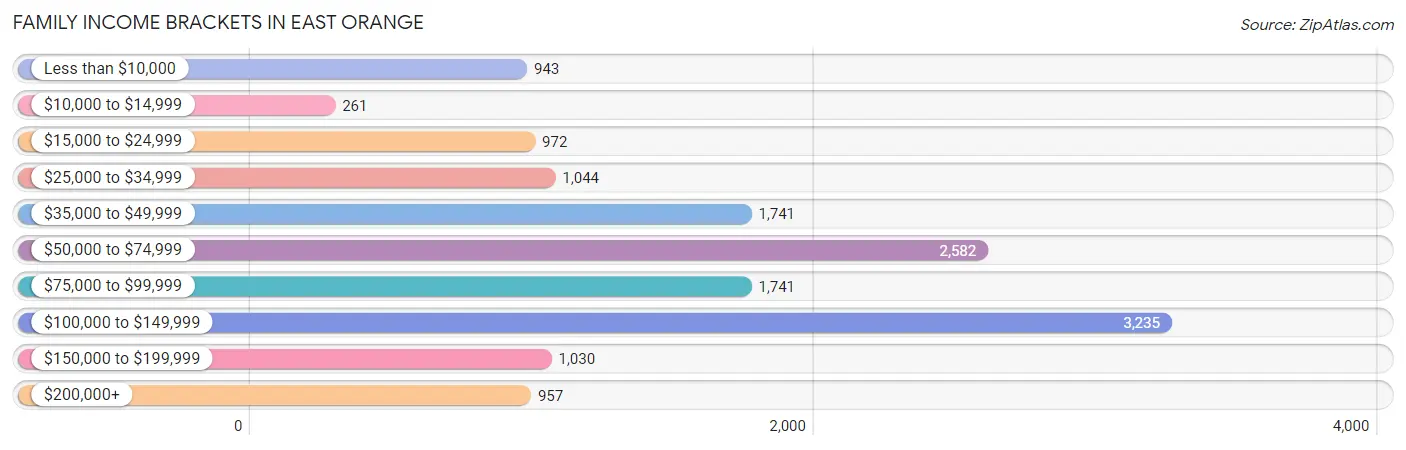
| Income Bracket | # Families | % Families |
| Less than $10,000 | 943 | 6.5% |
| $10,000 to $14,999 | 261 | 1.8% |
| $15,000 to $24,999 | 972 | 6.7% |
| $25,000 to $34,999 | 1,044 | 7.2% |
| $35,000 to $49,999 | 1,741 | 12.0% |
| $50,000 to $74,999 | 2,582 | 17.8% |
| $75,000 to $99,999 | 1,741 | 12.0% |
| $100,000 to $149,999 | 3,235 | 22.3% |
| $150,000 to $199,999 | 1,030 | 7.1% |
| $200,000+ | 957 | 6.6% |
Family Income by Famaliy Size in East Orange
7+ person families (566 | 3.9%) account for the highest median family income in East Orange with $143,600 per family, while 2-person families (6,239 | 43.0%) have the highest median income of $30,120 per family member.
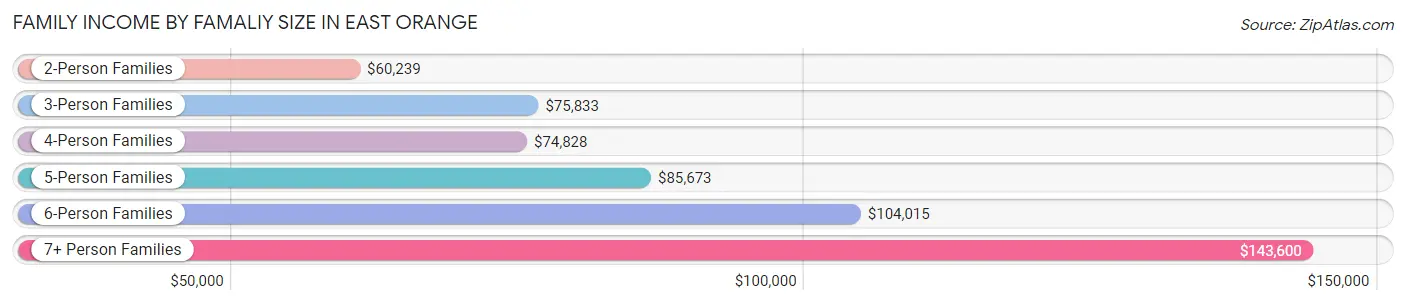
| Income Bracket | # Families | Median Income |
| 2-Person Families | 6,239 (43.0%) | $60,239 |
| 3-Person Families | 3,208 (22.1%) | $75,833 |
| 4-Person Families | 2,494 (17.2%) | $74,828 |
| 5-Person Families | 1,321 (9.1%) | $85,673 |
| 6-Person Families | 678 (4.7%) | $104,015 |
| 7+ Person Families | 566 (3.9%) | $143,600 |
| Total | 14,506 (100.0%) | $73,510 |
Family Income by Number of Earners in East Orange
The median family income in East Orange is $73,510, with families comprising 3+ earners (1,993) having the highest median family income of $143,738, while families with no earners (1,390) have the lowest median family income of $24,038, accounting for 13.7% and 9.6% of families, respectively.
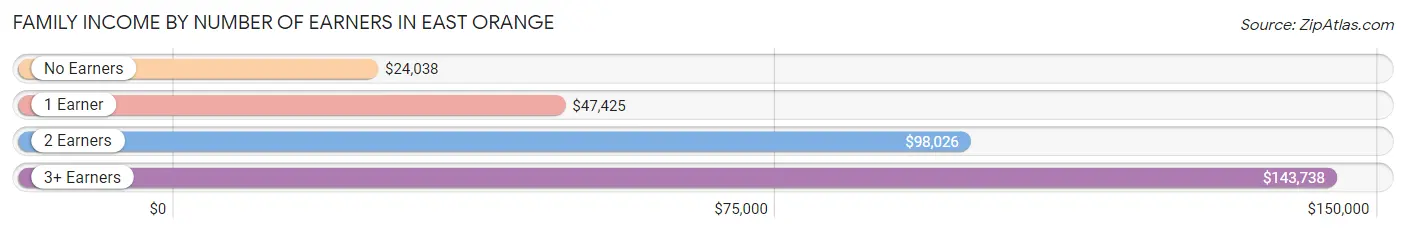
| Number of Earners | # Families | Median Income |
| No Earners | 1,390 (9.6%) | $24,038 |
| 1 Earner | 5,713 (39.4%) | $47,425 |
| 2 Earners | 5,410 (37.3%) | $98,026 |
| 3+ Earners | 1,993 (13.7%) | $143,738 |
| Total | 14,506 (100.0%) | $73,510 |
Household Income in East Orange
Household Income Brackets in East Orange
With 4,824 households falling in the category, the $50,000 to $74,999 income range is the most frequent in East Orange, accounting for 18.3% of all households. In contrast, only 1,239 households (4.7%) fall into the $150,000 to $199,999 income bracket, making it the least populous group.
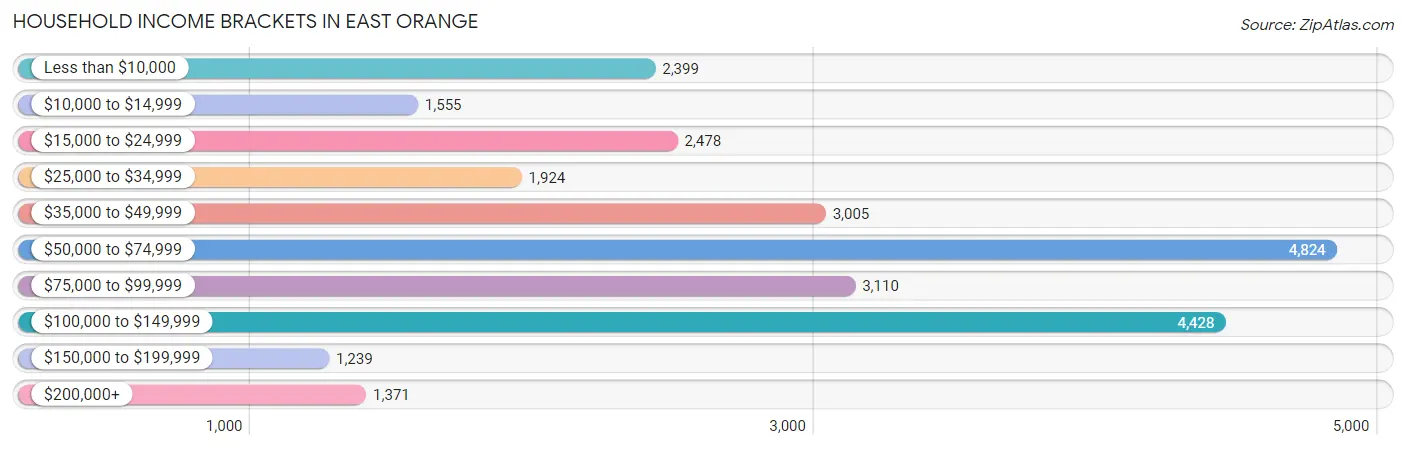
| Income Bracket | # Households | % Households |
| Less than $10,000 | 2,399 | 9.1% |
| $10,000 to $14,999 | 1,555 | 5.9% |
| $15,000 to $24,999 | 2,478 | 9.4% |
| $25,000 to $34,999 | 1,924 | 7.3% |
| $35,000 to $49,999 | 3,005 | 11.4% |
| $50,000 to $74,999 | 4,824 | 18.3% |
| $75,000 to $99,999 | 3,110 | 11.8% |
| $100,000 to $149,999 | 4,428 | 16.8% |
| $150,000 to $199,999 | 1,239 | 4.7% |
| $200,000+ | 1,371 | 5.2% |
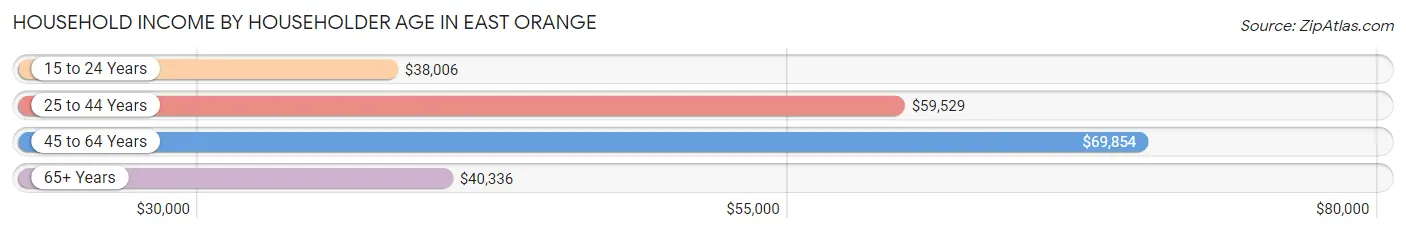
Household Income by Householder Age in East Orange
The median household income in East Orange is $58,659, with the highest median household income of $69,854 found in the 45 to 64 years age bracket for the primary householder. A total of 9,670 households (36.7%) fall into this category. Meanwhile, the 15 to 24 years age bracket for the primary householder has the lowest median household income of $38,006, with 887 households (3.4%) in this group.
| Income Bracket | # Households | Median Income |
| 15 to 24 Years | 887 (3.4%) | $38,006 |
| 25 to 44 Years | 9,237 (35.0%) | $59,529 |
| 45 to 64 Years | 9,670 (36.7%) | $69,854 |
| 65+ Years | 6,565 (24.9%) | $40,336 |
| Total | 26,359 (100.0%) | $58,659 |
Poverty in East Orange
Income Below Poverty by Sex and Age in East Orange
With 17.7% poverty level for males and 19.0% for females among the residents of East Orange, 12 to 14 year old males and 6 to 11 year old females are the most vulnerable to poverty, with 458 males (40.3%) and 772 females (27.8%) in their respective age groups living below the poverty level.
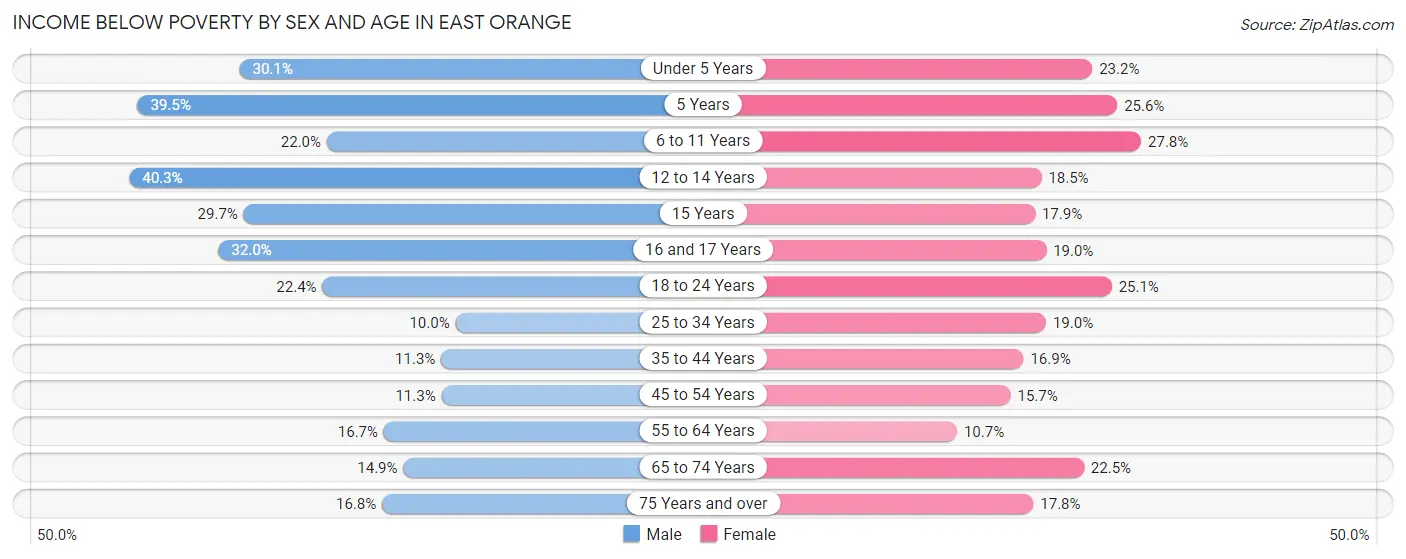
| Age Bracket | Male | Female |
| Under 5 Years | 747 (30.0%) | 521 (23.2%) |
| 5 Years | 183 (39.5%) | 126 (25.6%) |
| 6 to 11 Years | 542 (22.0%) | 772 (27.8%) |
| 12 to 14 Years | 458 (40.3%) | 260 (18.5%) |
| 15 Years | 124 (29.7%) | 102 (17.9%) |
| 16 and 17 Years | 226 (32.0%) | 140 (19.0%) |
| 18 to 24 Years | 587 (22.4%) | 678 (25.1%) |
| 25 to 34 Years | 584 (10.0%) | 1,267 (19.0%) |
| 35 to 44 Years | 486 (11.3%) | 774 (16.9%) |
| 45 to 54 Years | 381 (11.3%) | 740 (15.7%) |
| 55 to 64 Years | 596 (16.7%) | 443 (10.7%) |
| 65 to 74 Years | 302 (14.8%) | 754 (22.5%) |
| 75 Years and over | 207 (16.8%) | 464 (17.8%) |
| Total | 5,423 (17.7%) | 7,041 (19.0%) |
Income Above Poverty by Sex and Age in East Orange
According to the poverty statistics in East Orange, males aged 25 to 34 years and females aged 55 to 64 years are the age groups that are most secure financially, with 90.0% of males and 89.3% of females in these age groups living above the poverty line.
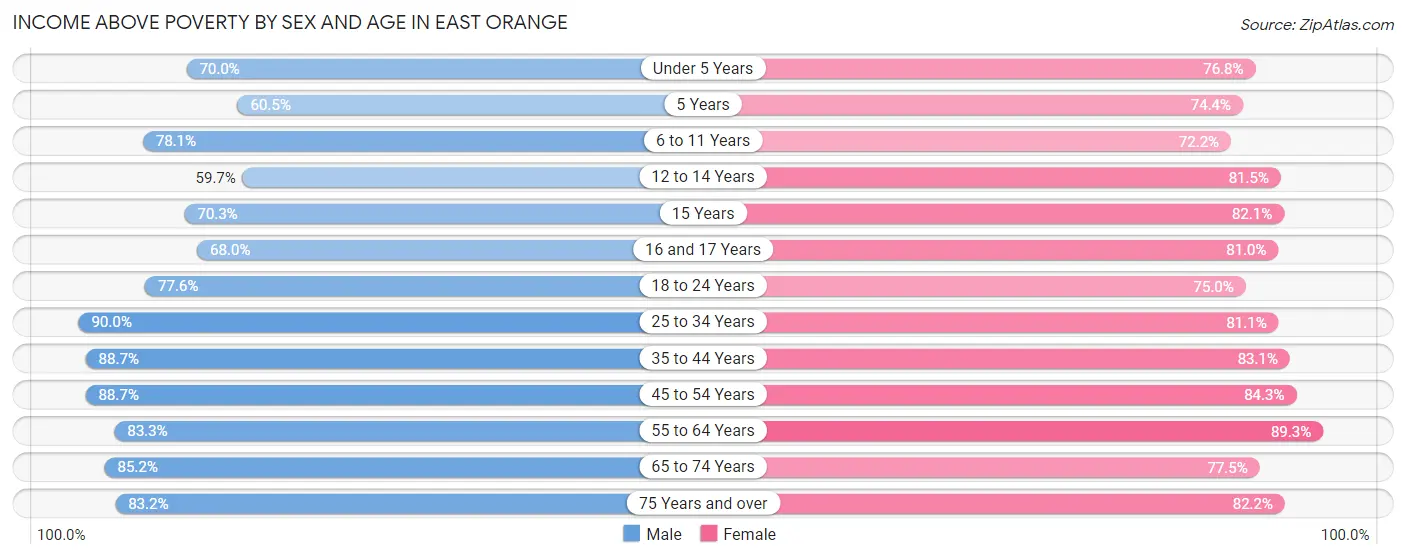
| Age Bracket | Male | Female |
| Under 5 Years | 1,739 (70.0%) | 1,721 (76.8%) |
| 5 Years | 280 (60.5%) | 367 (74.4%) |
| 6 to 11 Years | 1,927 (78.0%) | 2,007 (72.2%) |
| 12 to 14 Years | 679 (59.7%) | 1,143 (81.5%) |
| 15 Years | 294 (70.3%) | 467 (82.1%) |
| 16 and 17 Years | 480 (68.0%) | 598 (81.0%) |
| 18 to 24 Years | 2,038 (77.6%) | 2,029 (75.0%) |
| 25 to 34 Years | 5,248 (90.0%) | 5,418 (81.0%) |
| 35 to 44 Years | 3,801 (88.7%) | 3,816 (83.1%) |
| 45 to 54 Years | 2,989 (88.7%) | 3,985 (84.3%) |
| 55 to 64 Years | 2,981 (83.3%) | 3,702 (89.3%) |
| 65 to 74 Years | 1,731 (85.2%) | 2,602 (77.5%) |
| 75 Years and over | 1,023 (83.2%) | 2,146 (82.2%) |
| Total | 25,210 (82.3%) | 30,001 (81.0%) |
Income Below Poverty Among Married-Couple Families in East Orange
The poverty statistics for married-couple families in East Orange show that 5.3% or 328 of the total 6,131 families live below the poverty line. Families with 3 or 4 children have the highest poverty rate of 12.5%, comprising of 102 families. On the other hand, families with 5 or more children have the lowest poverty rate of 0.0%, which includes 0 families.
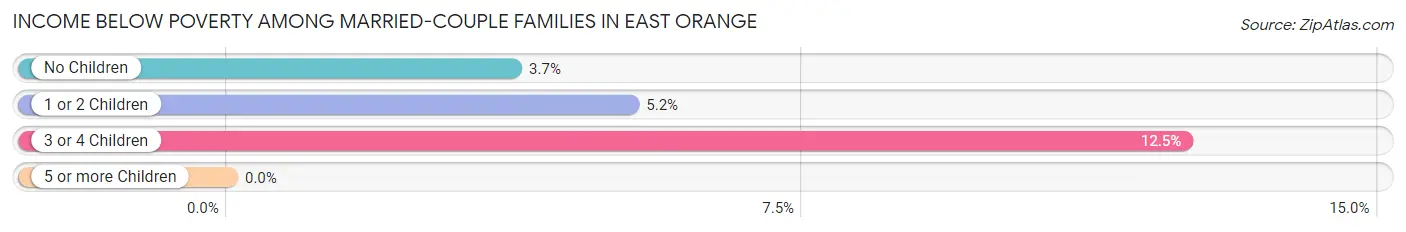
| Children | Above Poverty | Below Poverty |
| No Children | 3,166 (96.3%) | 122 (3.7%) |
| 1 or 2 Children | 1,880 (94.8%) | 104 (5.2%) |
| 3 or 4 Children | 716 (87.5%) | 102 (12.5%) |
| 5 or more Children | 41 (100.0%) | 0 (0.0%) |
| Total | 5,803 (94.7%) | 328 (5.3%) |
Income Below Poverty Among Single-Parent Households in East Orange
According to the poverty data in East Orange, 19.4% or 403 single-father households and 22.0% or 1,384 single-mother households are living below the poverty line. Among single-father households, those with 3 or 4 children have the highest poverty rate, with 112 households (74.7%) experiencing poverty. Likewise, among single-mother households, those with 3 or 4 children have the highest poverty rate, with 338 households (45.9%) falling below the poverty line.
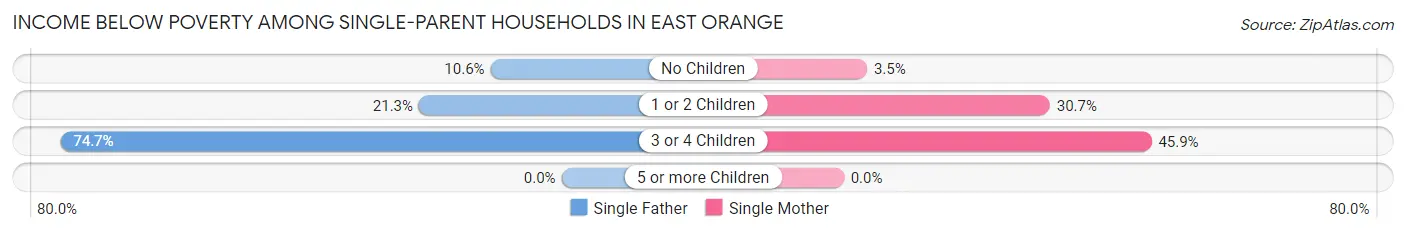
| Children | Single Father | Single Mother |
| No Children | 117 (10.6%) | 82 (3.5%) |
| 1 or 2 Children | 174 (21.2%) | 964 (30.7%) |
| 3 or 4 Children | 112 (74.7%) | 338 (45.9%) |
| 5 or more Children | 0 (0.0%) | 0 (0.0%) |
| Total | 403 (19.4%) | 1,384 (22.0%) |
Income Below Poverty Among Married-Couple vs Single-Parent Households in East Orange
The poverty data for East Orange shows that 328 of the married-couple family households (5.3%) and 1,787 of the single-parent households (21.3%) are living below the poverty level. Within the married-couple family households, those with 3 or 4 children have the highest poverty rate, with 102 households (12.5%) falling below the poverty line. Among the single-parent households, those with 3 or 4 children have the highest poverty rate, with 450 household (50.7%) living below poverty.
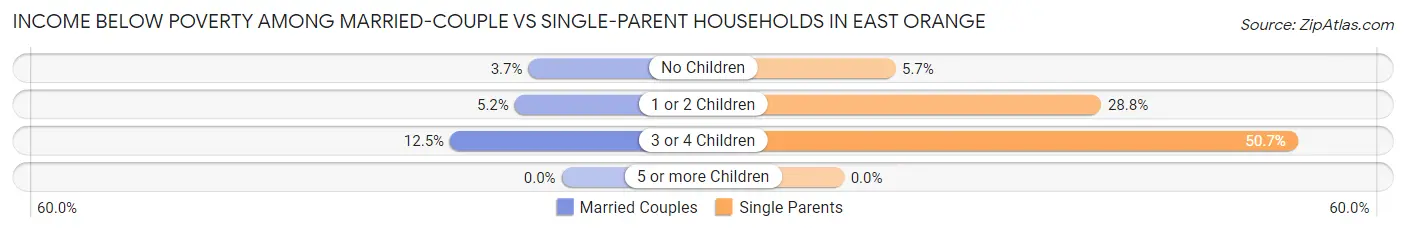
| Children | Married-Couple Families | Single-Parent Households |
| No Children | 122 (3.7%) | 199 (5.7%) |
| 1 or 2 Children | 104 (5.2%) | 1,138 (28.8%) |
| 3 or 4 Children | 102 (12.5%) | 450 (50.7%) |
| 5 or more Children | 0 (0.0%) | 0 (0.0%) |
| Total | 328 (5.3%) | 1,787 (21.3%) |
Race in East Orange
The most populous races in East Orange are Black / African American (55,532 | 80.6%), Hispanic or Latino (7,895 | 11.5%), and Some other Race (5,692 | 8.3%).
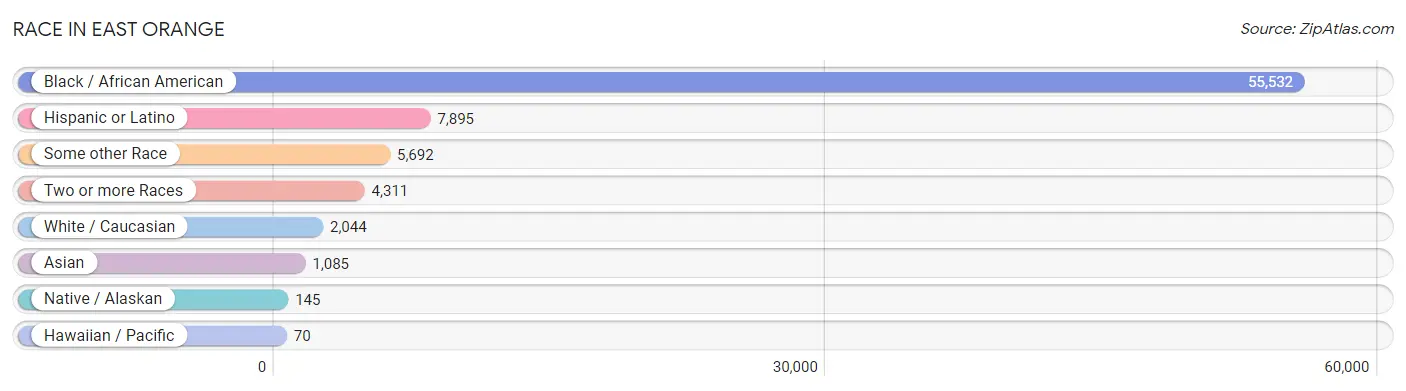
| Race | # Population | % Population |
| Asian | 1,085 | 1.6% |
| Black / African American | 55,532 | 80.6% |
| Hawaiian / Pacific | 70 | 0.1% |
| Hispanic or Latino | 7,895 | 11.5% |
| Native / Alaskan | 145 | 0.2% |
| White / Caucasian | 2,044 | 3.0% |
| Two or more Races | 4,311 | 6.3% |
| Some other Race | 5,692 | 8.3% |
| Total | 68,879 | 100.0% |
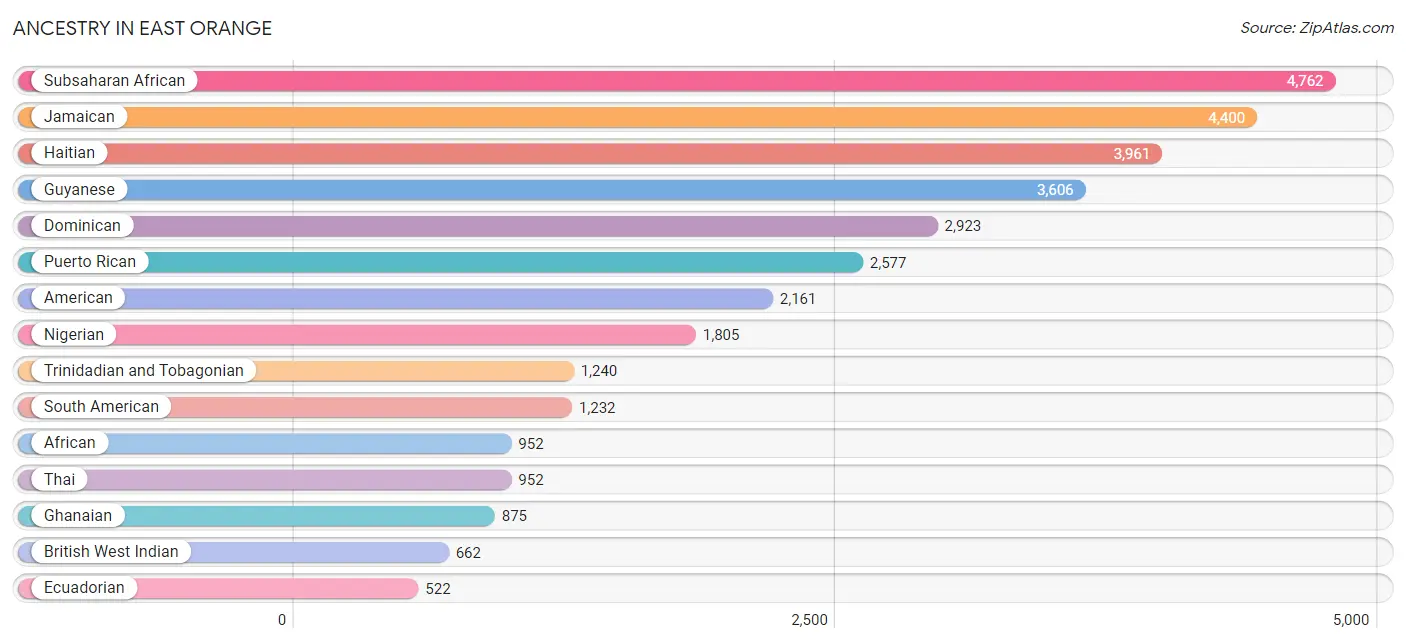
Ancestry in East Orange
The most populous ancestries reported in East Orange are Subsaharan African (4,762 | 6.9%), Jamaican (4,400 | 6.4%), Haitian (3,961 | 5.8%), Guyanese (3,606 | 5.2%), and Dominican (2,923 | 4.2%), together accounting for 28.5% of all East Orange residents.
| Ancestry | # Population | % Population |
| African | 952 | 1.4% |
| American | 2,161 | 3.1% |
| Apache | 15 | 0.0% |
| Arab | 128 | 0.2% |
| Bahamian | 17 | 0.0% |
| Barbadian | 476 | 0.7% |
| Belizean | 31 | 0.1% |
| Bermudan | 75 | 0.1% |
| Bhutanese | 8 | 0.0% |
| Blackfeet | 16 | 0.0% |
| Brazilian | 41 | 0.1% |
| British | 156 | 0.2% |
| British West Indian | 662 | 1.0% |
| Burmese | 22 | 0.0% |
| Cambodian | 33 | 0.1% |
| Cape Verdean | 7 | 0.0% |
| Central American | 459 | 0.7% |
| Central American Indian | 28 | 0.0% |
| Cherokee | 174 | 0.3% |
| Choctaw | 18 | 0.0% |
| Colombian | 306 | 0.4% |
| Cuban | 118 | 0.2% |
| Delaware | 127 | 0.2% |
| Dominican | 2,923 | 4.2% |
| Eastern European | 16 | 0.0% |
| Ecuadorian | 522 | 0.8% |
| English | 187 | 0.3% |
| Ethiopian | 17 | 0.0% |
| Fijian | 40 | 0.1% |
| Filipino | 13 | 0.0% |
| French | 85 | 0.1% |
| German | 439 | 0.6% |
| Ghanaian | 875 | 1.3% |
| Greek | 5 | 0.0% |
| Guatemalan | 201 | 0.3% |
| Guyanese | 3,606 | 5.2% |
| Haitian | 3,961 | 5.8% |
| Indian (Asian) | 64 | 0.1% |
| Irish | 425 | 0.6% |
| Italian | 419 | 0.6% |
| Jamaican | 4,400 | 6.4% |
| Kenyan | 14 | 0.0% |
| Korean | 125 | 0.2% |
| Liberian | 92 | 0.1% |
| Mexican | 418 | 0.6% |
| Moroccan | 94 | 0.1% |
| Nigerian | 1,805 | 2.6% |
| Panamanian | 243 | 0.4% |
| Paraguayan | 11 | 0.0% |
| Peruvian | 192 | 0.3% |
| Polish | 44 | 0.1% |
| Portuguese | 74 | 0.1% |
| Puerto Rican | 2,577 | 3.7% |
| Russian | 71 | 0.1% |
| Salvadoran | 15 | 0.0% |
| Scottish | 116 | 0.2% |
| Seminole | 51 | 0.1% |
| Sierra Leonean | 24 | 0.0% |
| Slavic | 39 | 0.1% |
| Slovak | 16 | 0.0% |
| South African | 17 | 0.0% |
| South American | 1,232 | 1.8% |
| South American Indian | 15 | 0.0% |
| Spaniard | 6 | 0.0% |
| Spanish | 9 | 0.0% |
| Sri Lankan | 86 | 0.1% |
| Subsaharan African | 4,762 | 6.9% |
| Sudanese | 77 | 0.1% |
| Thai | 952 | 1.4% |
| Trinidadian and Tobagonian | 1,240 | 1.8% |
| U.S. Virgin Islander | 182 | 0.3% |
| Ugandan | 14 | 0.0% |
| Uruguayan | 74 | 0.1% |
| Venezuelan | 121 | 0.2% |
| West Indian | 502 | 0.7% | View All 75 Rows |
Immigrants in East Orange
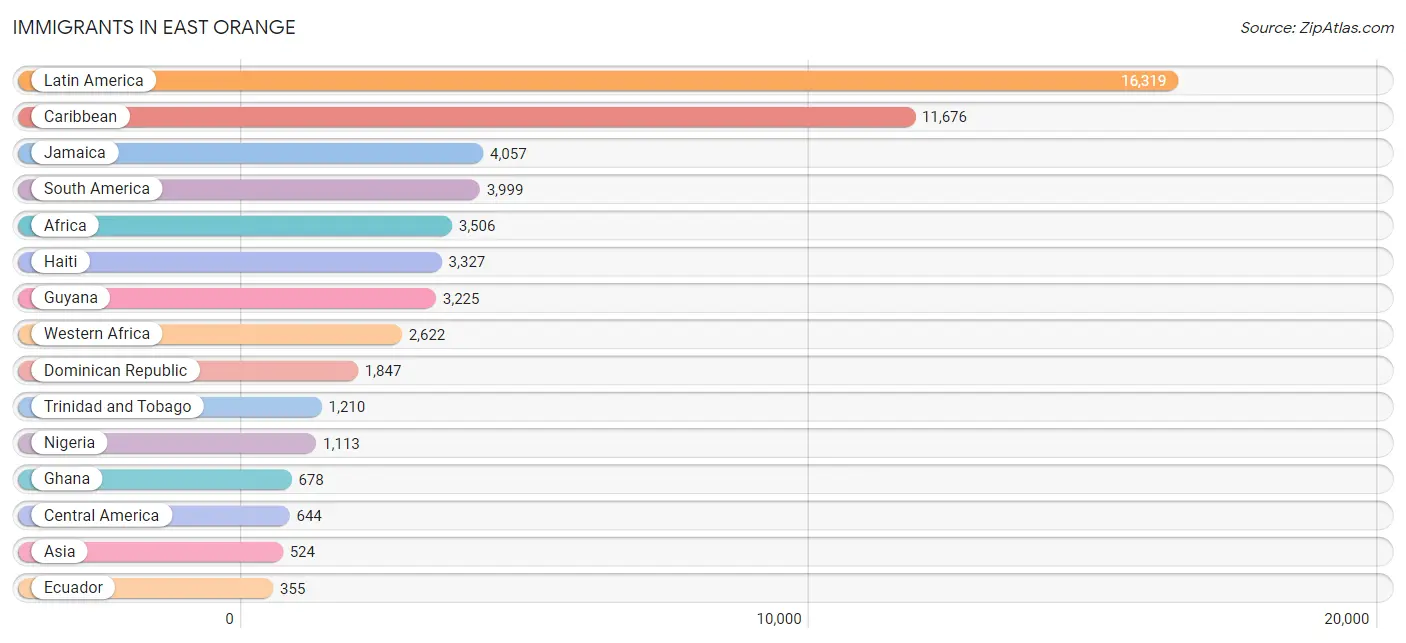
The most numerous immigrant groups reported in East Orange came from Latin America (16,319 | 23.7%), Caribbean (11,676 | 17.0%), Jamaica (4,057 | 5.9%), South America (3,999 | 5.8%), and Africa (3,506 | 5.1%), together accounting for 57.4% of all East Orange residents.
| Immigration Origin | # Population | % Population |
| Africa | 3,506 | 5.1% |
| Asia | 524 | 0.8% |
| Austria | 39 | 0.1% |
| Barbados | 121 | 0.2% |
| Belize | 45 | 0.1% |
| Brazil | 146 | 0.2% |
| Cameroon | 241 | 0.4% |
| Canada | 8 | 0.0% |
| Caribbean | 11,676 | 17.0% |
| Central America | 644 | 0.9% |
| China | 52 | 0.1% |
| Colombia | 45 | 0.1% |
| Cuba | 2 | 0.0% |
| Dominica | 236 | 0.3% |
| Dominican Republic | 1,847 | 2.7% |
| Eastern Africa | 196 | 0.3% |
| Eastern Asia | 74 | 0.1% |
| Ecuador | 355 | 0.5% |
| El Salvador | 15 | 0.0% |
| England | 21 | 0.0% |
| Ethiopia | 17 | 0.0% |
| Europe | 236 | 0.3% |
| Germany | 16 | 0.0% |
| Ghana | 678 | 1.0% |
| Grenada | 170 | 0.3% |
| Guatemala | 139 | 0.2% |
| Guyana | 3,225 | 4.7% |
| Haiti | 3,327 | 4.8% |
| Honduras | 15 | 0.0% |
| India | 239 | 0.4% |
| Israel | 20 | 0.0% |
| Italy | 1 | 0.0% |
| Jamaica | 4,057 | 5.9% |
| Kenya | 55 | 0.1% |
| Korea | 22 | 0.0% |
| Latin America | 16,319 | 23.7% |
| Liberia | 83 | 0.1% |
| Mexico | 351 | 0.5% |
| Middle Africa | 272 | 0.4% |
| Morocco | 45 | 0.1% |
| Nigeria | 1,113 | 1.6% |
| Northern Africa | 87 | 0.1% |
| Northern Europe | 135 | 0.2% |
| Panama | 79 | 0.1% |
| Peru | 91 | 0.1% |
| Philippines | 118 | 0.2% |
| Portugal | 12 | 0.0% |
| Scotland | 15 | 0.0% |
| Senegal | 187 | 0.3% |
| Sierra Leone | 83 | 0.1% |
| South Africa | 17 | 0.0% |
| South America | 3,999 | 5.8% |
| South Central Asia | 272 | 0.4% |
| South Eastern Asia | 158 | 0.2% |
| Southern Europe | 46 | 0.1% |
| Spain | 33 | 0.1% |
| Sri Lanka | 33 | 0.1% |
| St. Vincent and the Grenadines | 58 | 0.1% |
| Sudan | 32 | 0.1% |
| Trinidad and Tobago | 1,210 | 1.8% |
| Uganda | 7 | 0.0% |
| Uruguay | 34 | 0.1% |
| Venezuela | 82 | 0.1% |
| Vietnam | 40 | 0.1% |
| West Indies | 84 | 0.1% |
| Western Africa | 2,622 | 3.8% |
| Western Asia | 20 | 0.0% |
| Western Europe | 55 | 0.1% |
| Zaire | 31 | 0.1% |
| Zimbabwe | 90 | 0.1% | View All 70 Rows |
Sex and Age in East Orange
Sex and Age in East Orange
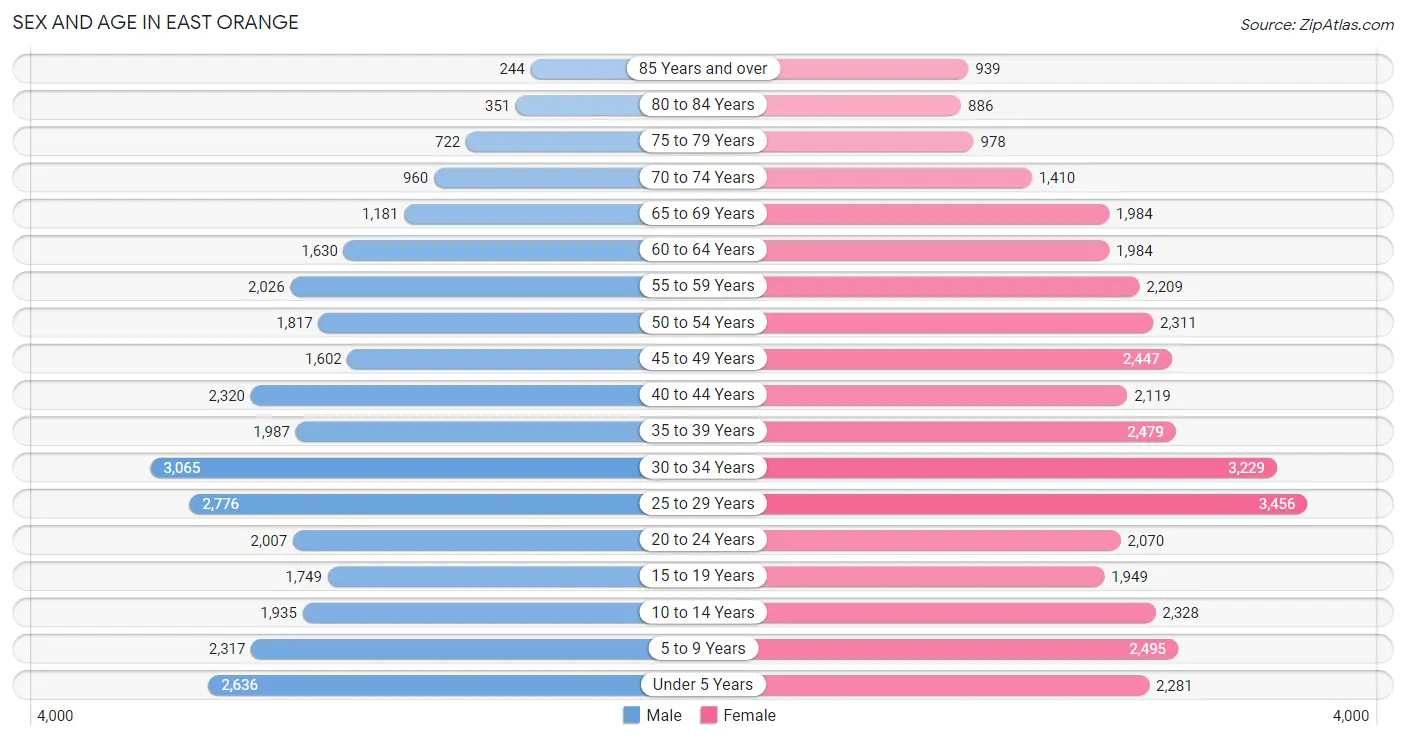
The most populous age groups in East Orange are 30 to 34 Years (3,065 | 9.8%) for men and 25 to 29 Years (3,456 | 9.2%) for women.
| Age Bracket | Male | Female |
| Under 5 Years | 2,636 (8.4%) | 2,281 (6.1%) |
| 5 to 9 Years | 2,317 (7.4%) | 2,495 (6.6%) |
| 10 to 14 Years | 1,935 (6.2%) | 2,328 (6.2%) |
| 15 to 19 Years | 1,749 (5.6%) | 1,949 (5.2%) |
| 20 to 24 Years | 2,007 (6.4%) | 2,070 (5.5%) |
| 25 to 29 Years | 2,776 (8.9%) | 3,456 (9.2%) |
| 30 to 34 Years | 3,065 (9.8%) | 3,229 (8.6%) |
| 35 to 39 Years | 1,987 (6.3%) | 2,479 (6.6%) |
| 40 to 44 Years | 2,320 (7.4%) | 2,119 (5.6%) |
| 45 to 49 Years | 1,602 (5.1%) | 2,447 (6.5%) |
| 50 to 54 Years | 1,817 (5.8%) | 2,311 (6.1%) |
| 55 to 59 Years | 2,026 (6.5%) | 2,209 (5.9%) |
| 60 to 64 Years | 1,630 (5.2%) | 1,984 (5.3%) |
| 65 to 69 Years | 1,181 (3.8%) | 1,984 (5.3%) |
| 70 to 74 Years | 960 (3.1%) | 1,410 (3.7%) |
| 75 to 79 Years | 722 (2.3%) | 978 (2.6%) |
| 80 to 84 Years | 351 (1.1%) | 886 (2.4%) |
| 85 Years and over | 244 (0.8%) | 939 (2.5%) |
| Total | 31,325 (100.0%) | 37,554 (100.0%) |
Families and Households in East Orange
Median Family Size in East Orange
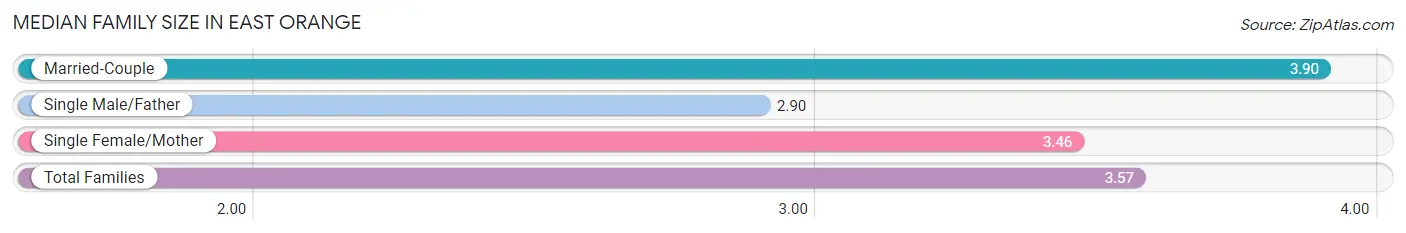
The median family size in East Orange is 3.57 persons per family, with married-couple families (6,131 | 42.3%) accounting for the largest median family size of 3.9 persons per family. On the other hand, single male/father families (2,074 | 14.3%) represent the smallest median family size with 2.90 persons per family.
| Family Type | # Families | Family Size |
| Married-Couple | 6,131 (42.3%) | 3.90 |
| Single Male/Father | 2,074 (14.3%) | 2.90 |
| Single Female/Mother | 6,301 (43.4%) | 3.46 |
| Total Families | 14,506 (100.0%) | 3.57 |
Median Household Size in East Orange
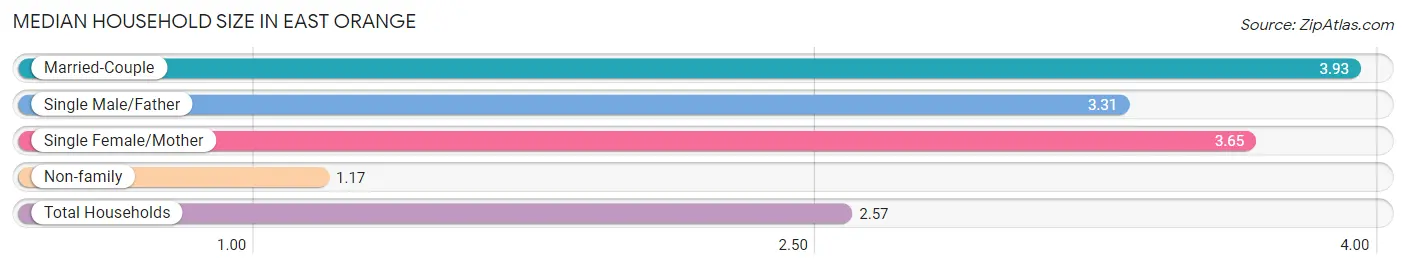
The median household size in East Orange is 2.57 persons per household, with married-couple households (6,131 | 23.3%) accounting for the largest median household size of 3.93 persons per household. non-family households (11,853 | 45.0%) represent the smallest median household size with 1.17 persons per household.
| Household Type | # Households | Household Size |
| Married-Couple | 6,131 (23.3%) | 3.93 |
| Single Male/Father | 2,074 (7.9%) | 3.31 |
| Single Female/Mother | 6,301 (23.9%) | 3.65 |
| Non-family | 11,853 (45.0%) | 1.17 |
| Total Households | 26,359 (100.0%) | 2.57 |
Household Size by Marriage Status in East Orange
Out of a total of 26,359 households in East Orange, 14,506 (55.0%) are family households, while 11,853 (45.0%) are nonfamily households. The most numerous type of family households are 2-person households, comprising 5,520, and the most common type of nonfamily households are 1-person households, comprising 10,274.
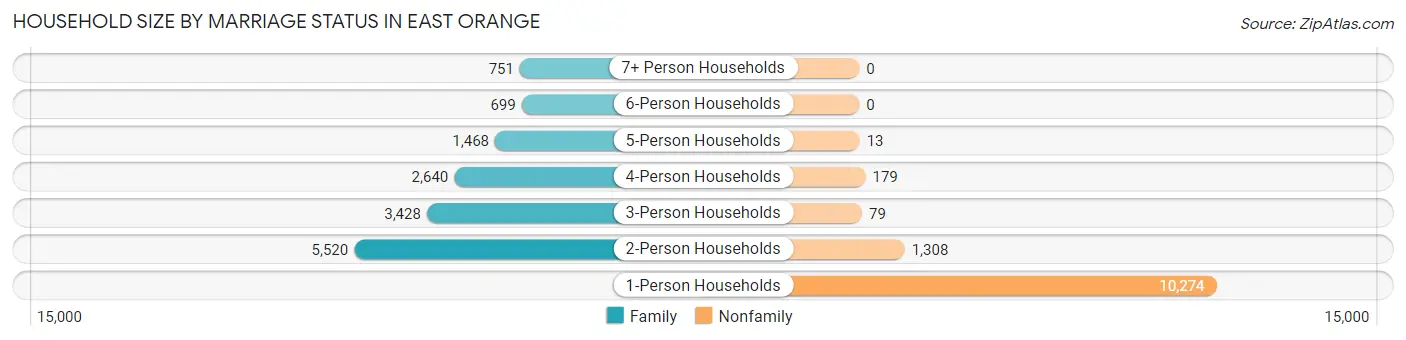
| Household Size | Family Households | Nonfamily Households |
| 1-Person Households | - | 10,274 (39.0%) |
| 2-Person Households | 5,520 (20.9%) | 1,308 (5.0%) |
| 3-Person Households | 3,428 (13.0%) | 79 (0.3%) |
| 4-Person Households | 2,640 (10.0%) | 179 (0.7%) |
| 5-Person Households | 1,468 (5.6%) | 13 (0.1%) |
| 6-Person Households | 699 (2.6%) | 0 (0.0%) |
| 7+ Person Households | 751 (2.9%) | 0 (0.0%) |
| Total | 14,506 (55.0%) | 11,853 (45.0%) |
Female Fertility in East Orange
Fertility by Age in East Orange
Average fertility rate in East Orange is 47.0 births per 1,000 women. Women in the age bracket of 20 to 34 years have the highest fertility rate with 58.0 births per 1,000 women. Women in the age bracket of 20 to 34 years acount for 58.9% of all women with births.
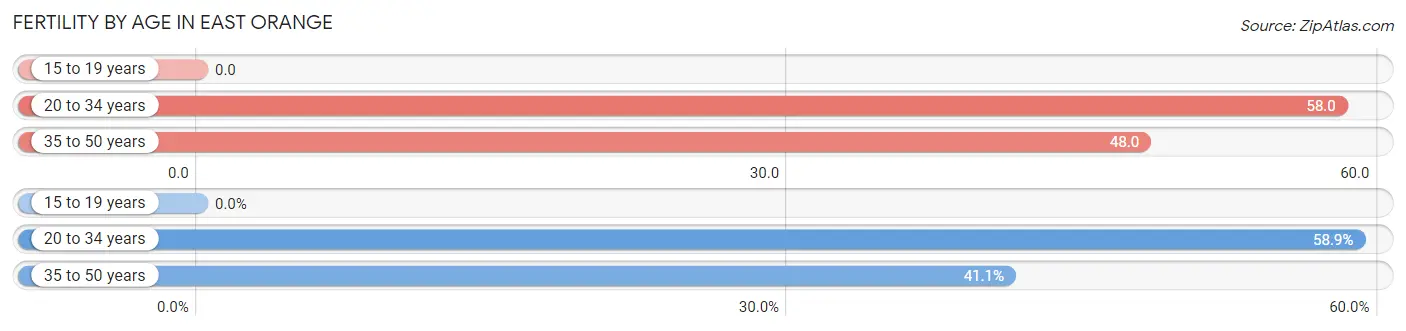
| Age Bracket | Women with Births | Births / 1,000 Women |
| 15 to 19 years | 0 (0.0%) | 0.0 |
| 20 to 34 years | 507 (58.9%) | 58.0 |
| 35 to 50 years | 354 (41.1%) | 48.0 |
| Total | 861 (100.0%) | 47.0 |
Fertility by Age by Marriage Status in East Orange
46.2% of women with births (861) in East Orange are married. The highest percentage of unmarried women with births falls into 20 to 34 years age bracket with 58.8% of them unmarried at the time of birth, while the lowest percentage of unmarried women with births belong to 35 to 50 years age bracket with 46.6% of them unmarried.

| Age Bracket | Married | Unmarried |
| 15 to 19 years | 0 (0.0%) | 0 (0.0%) |
| 20 to 34 years | 209 (41.2%) | 298 (58.8%) |
| 35 to 50 years | 189 (53.4%) | 165 (46.6%) |
| Total | 398 (46.2%) | 463 (53.8%) |
Fertility by Education in East Orange
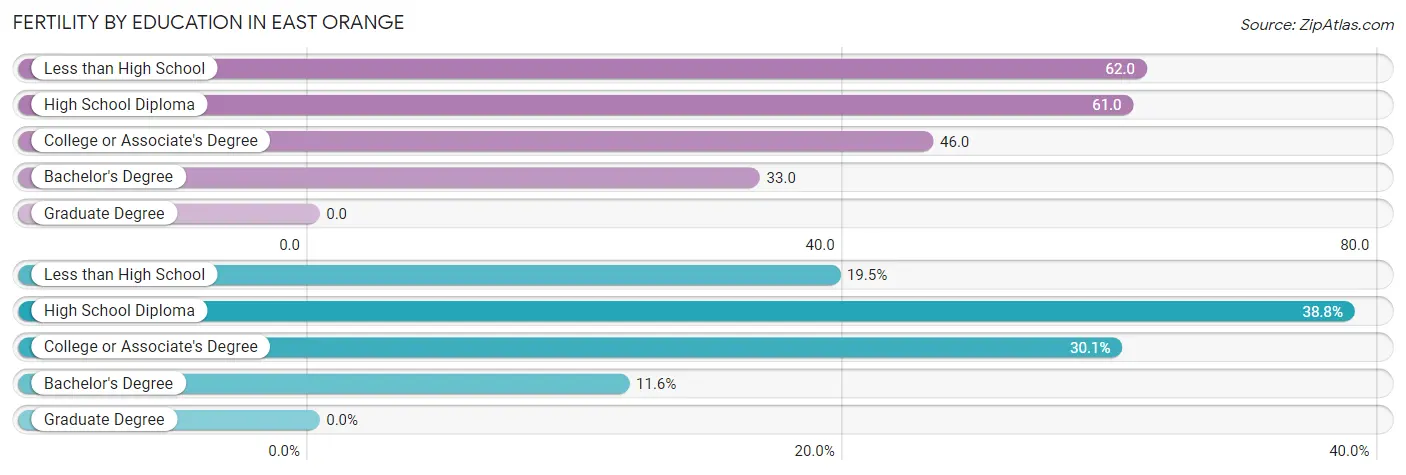
| Educational Attainment | Women with Births | Births / 1,000 Women |
| Less than High School | 168 (19.5%) | 62.0 |
| High School Diploma | 334 (38.8%) | 61.0 |
| College or Associate's Degree | 259 (30.1%) | 46.0 |
| Bachelor's Degree | 100 (11.6%) | 33.0 |
| Graduate Degree | 0 (0.0%) | 0.0 |
| Total | 861 (100.0%) | 47.0 |
Fertility by Education by Marriage Status in East Orange
53.8% of women with births in East Orange are unmarried. Women with the educational attainment of bachelor's degree are most likely to be married with 67.0% of them married at childbirth, while women with the educational attainment of college or associate's degree are least likely to be married with 67.9% of them unmarried at childbirth.
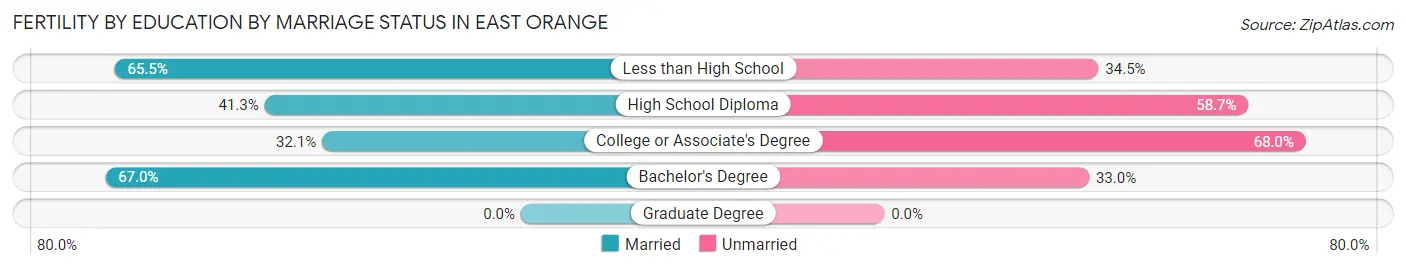
| Educational Attainment | Married | Unmarried |
| Less than High School | 110 (65.5%) | 58 (34.5%) |
| High School Diploma | 138 (41.3%) | 196 (58.7%) |
| College or Associate's Degree | 83 (32.1%) | 176 (67.9%) |
| Bachelor's Degree | 67 (67.0%) | 33 (33.0%) |
| Graduate Degree | 0 (0.0%) | 0 (0.0%) |
| Total | 398 (46.2%) | 463 (53.8%) |
Employment Characteristics in East Orange
Employment by Class of Employer in East Orange
Among the 30,781 employed individuals in East Orange, private company employees (21,025 | 68.3%), not-for-profit organizations (2,627 | 8.5%), and local government employees (2,325 | 7.5%) make up the most common classes of employment.
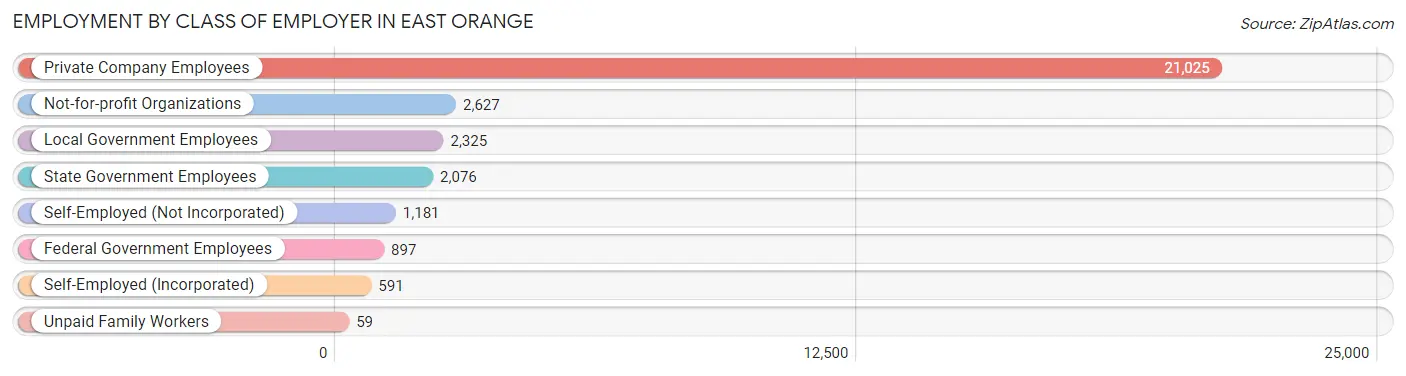
| Employer Class | # Employees | % Employees |
| Private Company Employees | 21,025 | 68.3% |
| Self-Employed (Incorporated) | 591 | 1.9% |
| Self-Employed (Not Incorporated) | 1,181 | 3.8% |
| Not-for-profit Organizations | 2,627 | 8.5% |
| Local Government Employees | 2,325 | 7.5% |
| State Government Employees | 2,076 | 6.7% |
| Federal Government Employees | 897 | 2.9% |
| Unpaid Family Workers | 59 | 0.2% |
| Total | 30,781 | 100.0% |
Employment Status by Age in East Orange
According to the labor force statistics for East Orange, out of the total population over 16 years of age (53,896), 66.9% or 36,056 individuals are in the labor force, with 11.6% or 4,182 of them unemployed. The age group with the highest labor force participation rate is 35 to 44 years, with 85.0% or 7,569 individuals in the labor force. Within the labor force, the 16 to 19 years age range has the highest percentage of unemployed individuals, with 37.8% or 308 of them being unemployed.
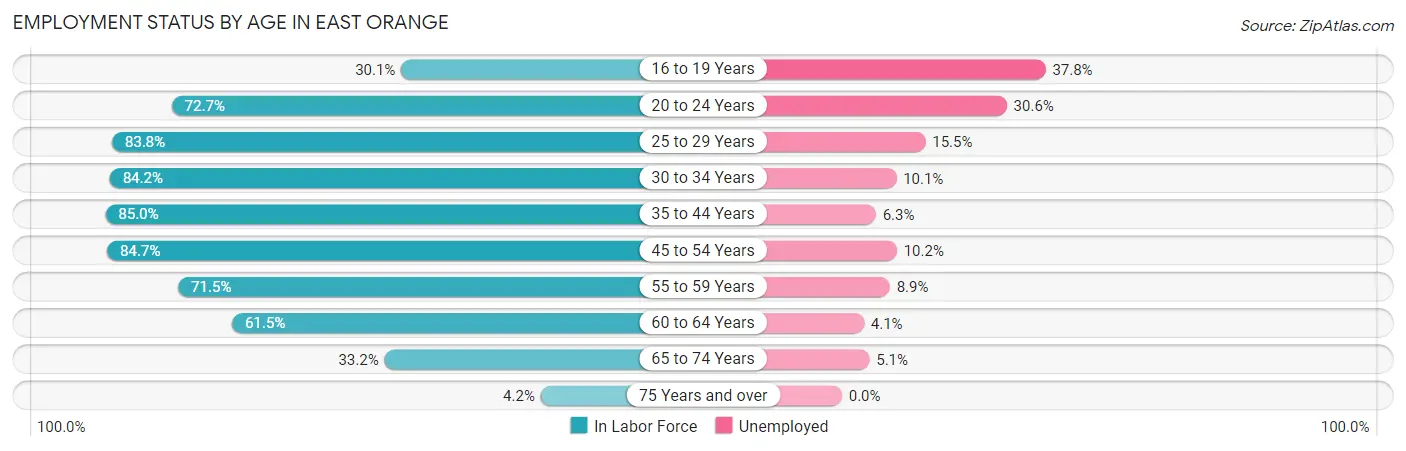
| Age Bracket | In Labor Force | Unemployed |
| 16 to 19 Years | 815 (30.1%) | 308 (37.8%) |
| 20 to 24 Years | 2,964 (72.7%) | 907 (30.6%) |
| 25 to 29 Years | 5,222 (83.8%) | 809 (15.5%) |
| 30 to 34 Years | 5,300 (84.2%) | 535 (10.1%) |
| 35 to 44 Years | 7,569 (85.0%) | 477 (6.3%) |
| 45 to 54 Years | 6,926 (84.7%) | 706 (10.2%) |
| 55 to 59 Years | 3,028 (71.5%) | 269 (8.9%) |
| 60 to 64 Years | 2,223 (61.5%) | 91 (4.1%) |
| 65 to 74 Years | 1,838 (33.2%) | 94 (5.1%) |
| 75 Years and over | 173 (4.2%) | 0 (0.0%) |
| Total | 36,056 (66.9%) | 4,182 (11.6%) |
Employment Status by Educational Attainment in East Orange
According to labor force statistics for East Orange, 80.8% of individuals (30,265) out of the total population between 25 and 64 years of age (37,457) are in the labor force, with 9.5% or 2,875 of them being unemployed. The group with the highest labor force participation rate are those with the educational attainment of bachelor's degree or higher, with 91.2% or 7,685 individuals in the labor force. Within the labor force, individuals with less than high school education have the highest percentage of unemployment, with 15.9% or 449 of them being unemployed.
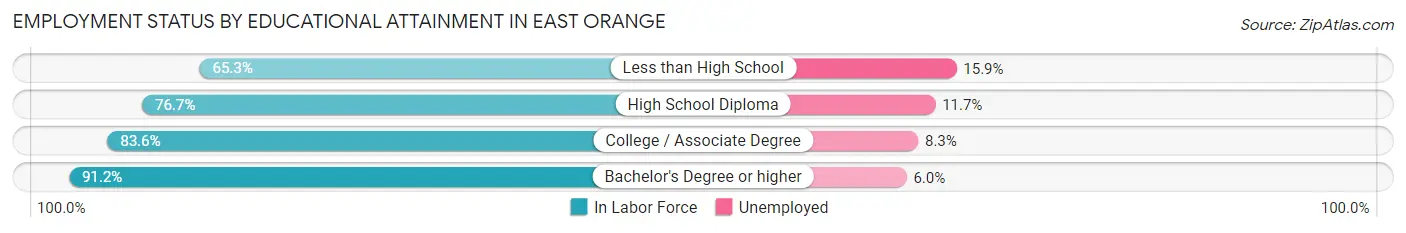
| Educational Attainment | In Labor Force | Unemployed |
| Less than High School | 2,826 (65.3%) | 688 (15.9%) |
| High School Diploma | 9,882 (76.7%) | 1,507 (11.7%) |
| College / Associate Degree | 9,880 (83.6%) | 981 (8.3%) |
| Bachelor's Degree or higher | 7,685 (91.2%) | 506 (6.0%) |
| Total | 30,265 (80.8%) | 3,558 (9.5%) |
Employment Occupations by Sex in East Orange
Management, Business, Science and Arts Occupations
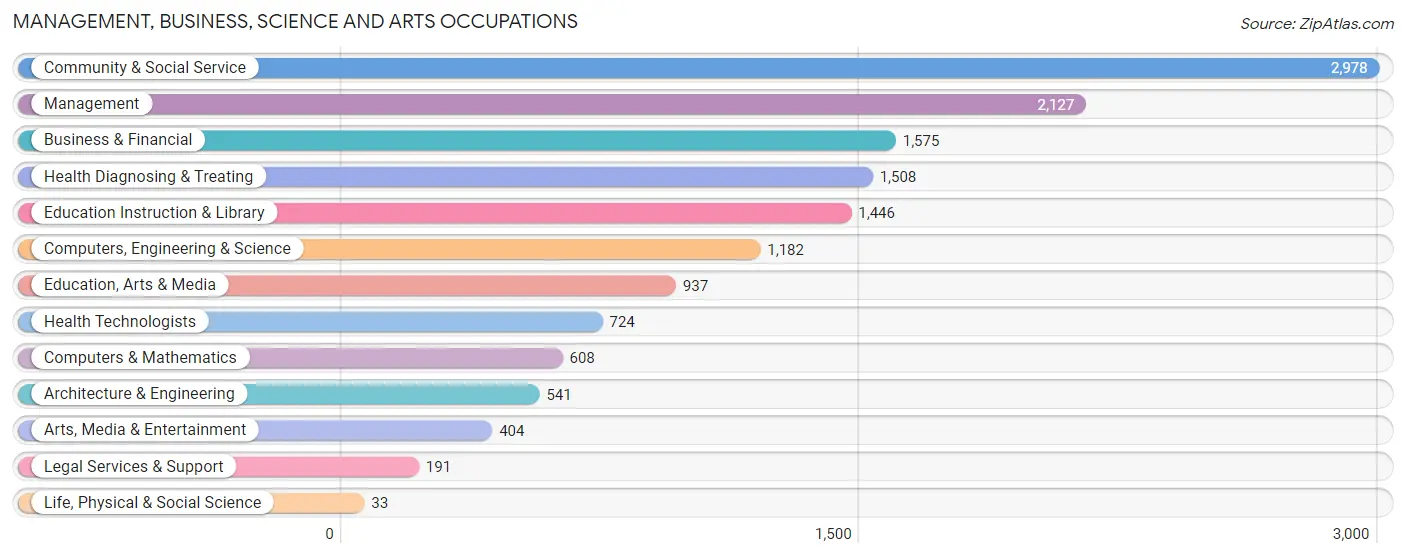
The most common Management, Business, Science and Arts occupations in East Orange are Community & Social Service (2,978 | 9.3%), Management (2,127 | 6.7%), Business & Financial (1,575 | 5.0%), Health Diagnosing & Treating (1,508 | 4.7%), and Education Instruction & Library (1,446 | 4.5%).
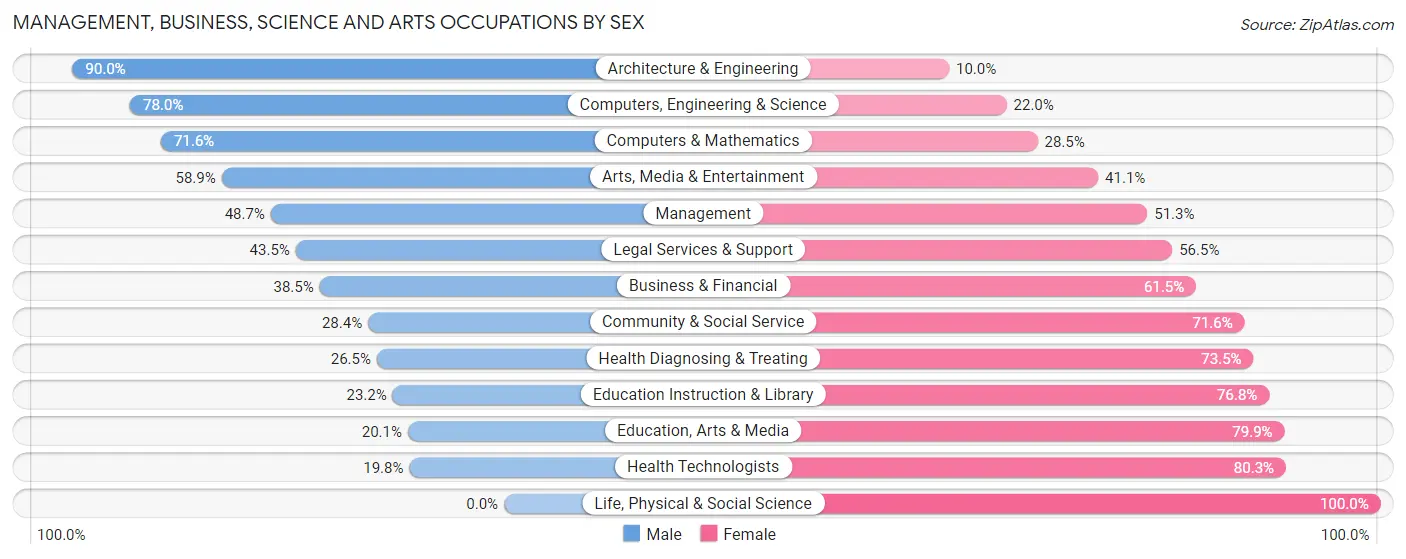
Management, Business, Science and Arts Occupations by Sex
Within the Management, Business, Science and Arts occupations in East Orange, the most male-oriented occupations are Architecture & Engineering (90.0%), Computers, Engineering & Science (78.0%), and Computers & Mathematics (71.6%), while the most female-oriented occupations are Life, Physical & Social Science (100.0%), Health Technologists (80.2%), and Education, Arts & Media (79.9%).
| Occupation | Male | Female |
| Management | 1,035 (48.7%) | 1,092 (51.3%) |
| Business & Financial | 606 (38.5%) | 969 (61.5%) |
| Computers, Engineering & Science | 922 (78.0%) | 260 (22.0%) |
| Computers & Mathematics | 435 (71.6%) | 173 (28.4%) |
| Architecture & Engineering | 487 (90.0%) | 54 (10.0%) |
| Life, Physical & Social Science | 0 (0.0%) | 33 (100.0%) |
| Community & Social Service | 845 (28.4%) | 2,133 (71.6%) |
| Education, Arts & Media | 188 (20.1%) | 749 (79.9%) |
| Legal Services & Support | 83 (43.5%) | 108 (56.5%) |
| Education Instruction & Library | 336 (23.2%) | 1,110 (76.8%) |
| Arts, Media & Entertainment | 238 (58.9%) | 166 (41.1%) |
| Health Diagnosing & Treating | 400 (26.5%) | 1,108 (73.5%) |
| Health Technologists | 143 (19.8%) | 581 (80.2%) |
| Total (Category) | 3,808 (40.6%) | 5,562 (59.4%) |
| Total (Overall) | 14,936 (46.9%) | 16,902 (53.1%) |
Services Occupations
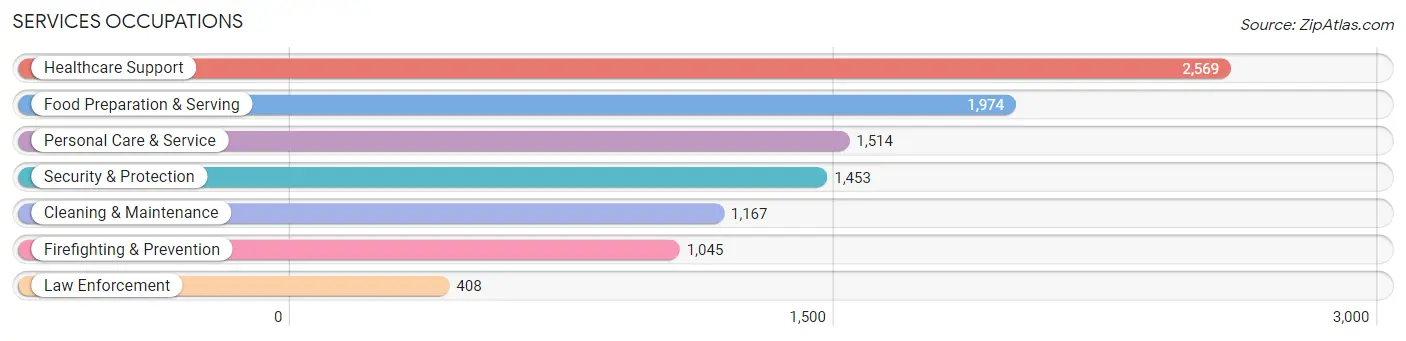
The most common Services occupations in East Orange are Healthcare Support (2,569 | 8.1%), Food Preparation & Serving (1,974 | 6.2%), Personal Care & Service (1,514 | 4.8%), Security & Protection (1,453 | 4.6%), and Cleaning & Maintenance (1,167 | 3.7%).
Services Occupations by Sex
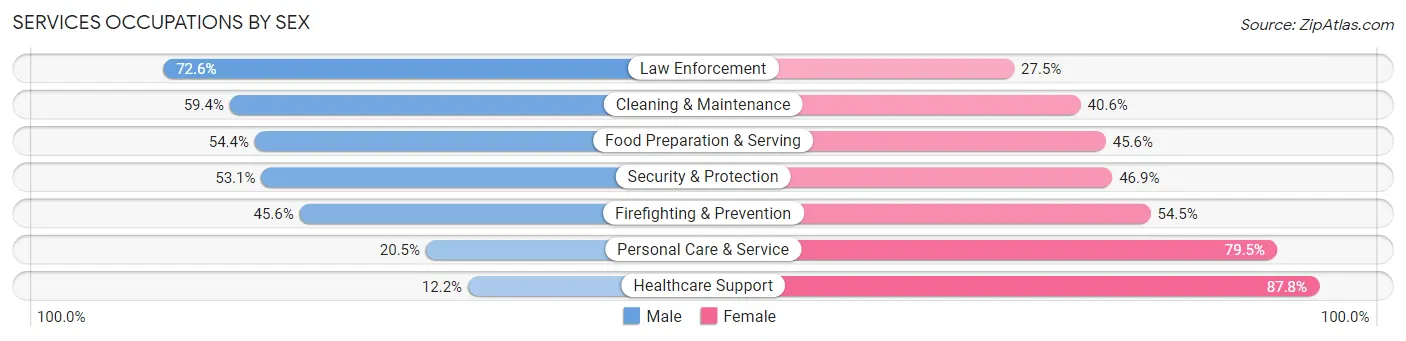
Within the Services occupations in East Orange, the most male-oriented occupations are Law Enforcement (72.6%), Cleaning & Maintenance (59.4%), and Food Preparation & Serving (54.4%), while the most female-oriented occupations are Healthcare Support (87.8%), Personal Care & Service (79.5%), and Firefighting & Prevention (54.4%).
| Occupation | Male | Female |
| Healthcare Support | 314 (12.2%) | 2,255 (87.8%) |
| Security & Protection | 772 (53.1%) | 681 (46.9%) |
| Firefighting & Prevention | 476 (45.6%) | 569 (54.4%) |
| Law Enforcement | 296 (72.6%) | 112 (27.5%) |
| Food Preparation & Serving | 1,074 (54.4%) | 900 (45.6%) |
| Cleaning & Maintenance | 693 (59.4%) | 474 (40.6%) |
| Personal Care & Service | 311 (20.5%) | 1,203 (79.5%) |
| Total (Category) | 3,164 (36.5%) | 5,513 (63.5%) |
| Total (Overall) | 14,936 (46.9%) | 16,902 (53.1%) |
Sales and Office Occupations
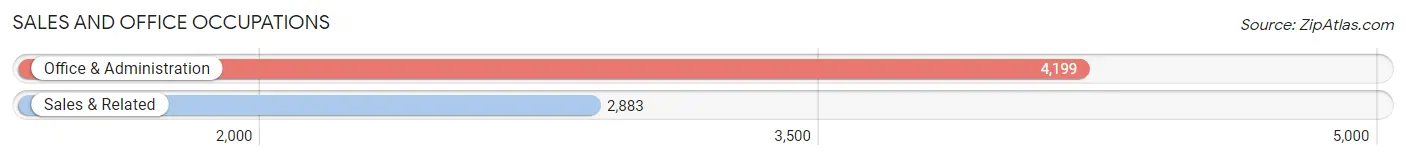
The most common Sales and Office occupations in East Orange are Office & Administration (4,199 | 13.2%), and Sales & Related (2,883 | 9.1%).
Sales and Office Occupations by Sex
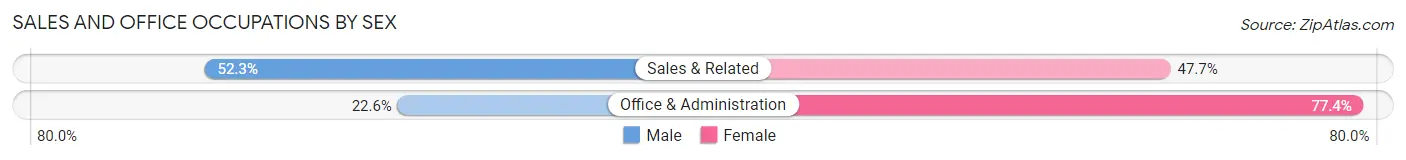
| Occupation | Male | Female |
| Sales & Related | 1,508 (52.3%) | 1,375 (47.7%) |
| Office & Administration | 949 (22.6%) | 3,250 (77.4%) |
| Total (Category) | 2,457 (34.7%) | 4,625 (65.3%) |
| Total (Overall) | 14,936 (46.9%) | 16,902 (53.1%) |
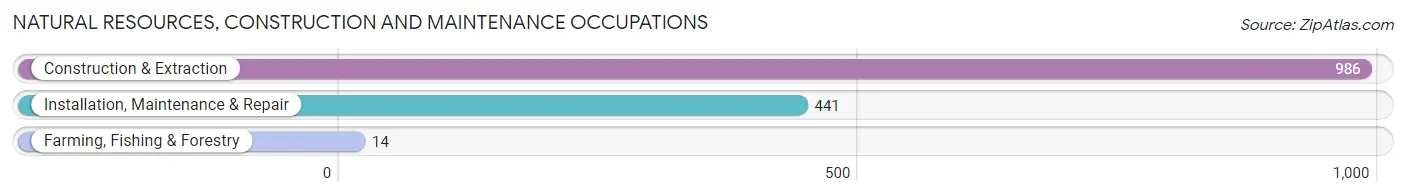
Natural Resources, Construction and Maintenance Occupations
The most common Natural Resources, Construction and Maintenance occupations in East Orange are Construction & Extraction (986 | 3.1%), Installation, Maintenance & Repair (441 | 1.4%), and Farming, Fishing & Forestry (14 | 0.0%).
Natural Resources, Construction and Maintenance Occupations by Sex
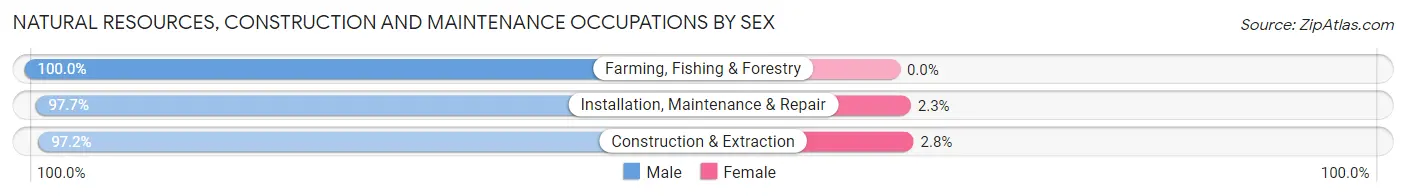
| Occupation | Male | Female |
| Farming, Fishing & Forestry | 14 (100.0%) | 0 (0.0%) |
| Construction & Extraction | 958 (97.2%) | 28 (2.8%) |
| Installation, Maintenance & Repair | 431 (97.7%) | 10 (2.3%) |
| Total (Category) | 1,403 (97.4%) | 38 (2.6%) |
| Total (Overall) | 14,936 (46.9%) | 16,902 (53.1%) |
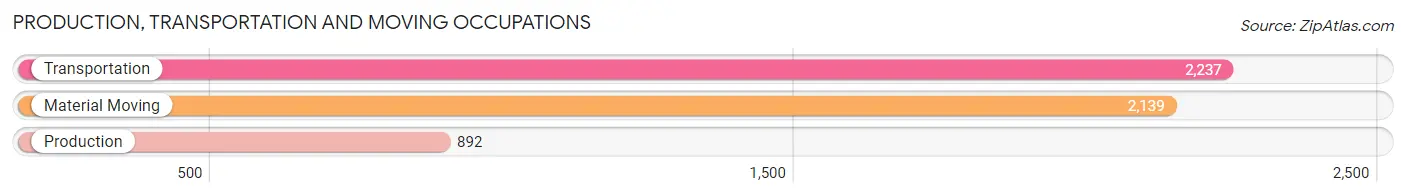
Production, Transportation and Moving Occupations
The most common Production, Transportation and Moving occupations in East Orange are Transportation (2,237 | 7.0%), Material Moving (2,139 | 6.7%), and Production (892 | 2.8%).
Production, Transportation and Moving Occupations by Sex
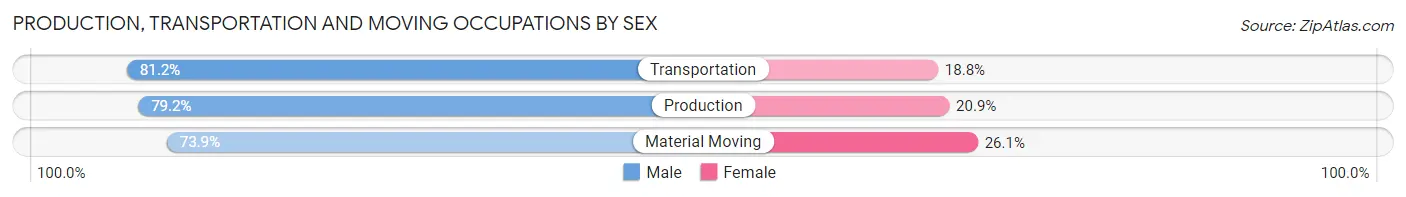
| Occupation | Male | Female |
| Production | 706 (79.1%) | 186 (20.8%) |
| Transportation | 1,817 (81.2%) | 420 (18.8%) |
| Material Moving | 1,581 (73.9%) | 558 (26.1%) |
| Total (Category) | 4,104 (77.9%) | 1,164 (22.1%) |
| Total (Overall) | 14,936 (46.9%) | 16,902 (53.1%) |
Employment Industries by Sex in East Orange
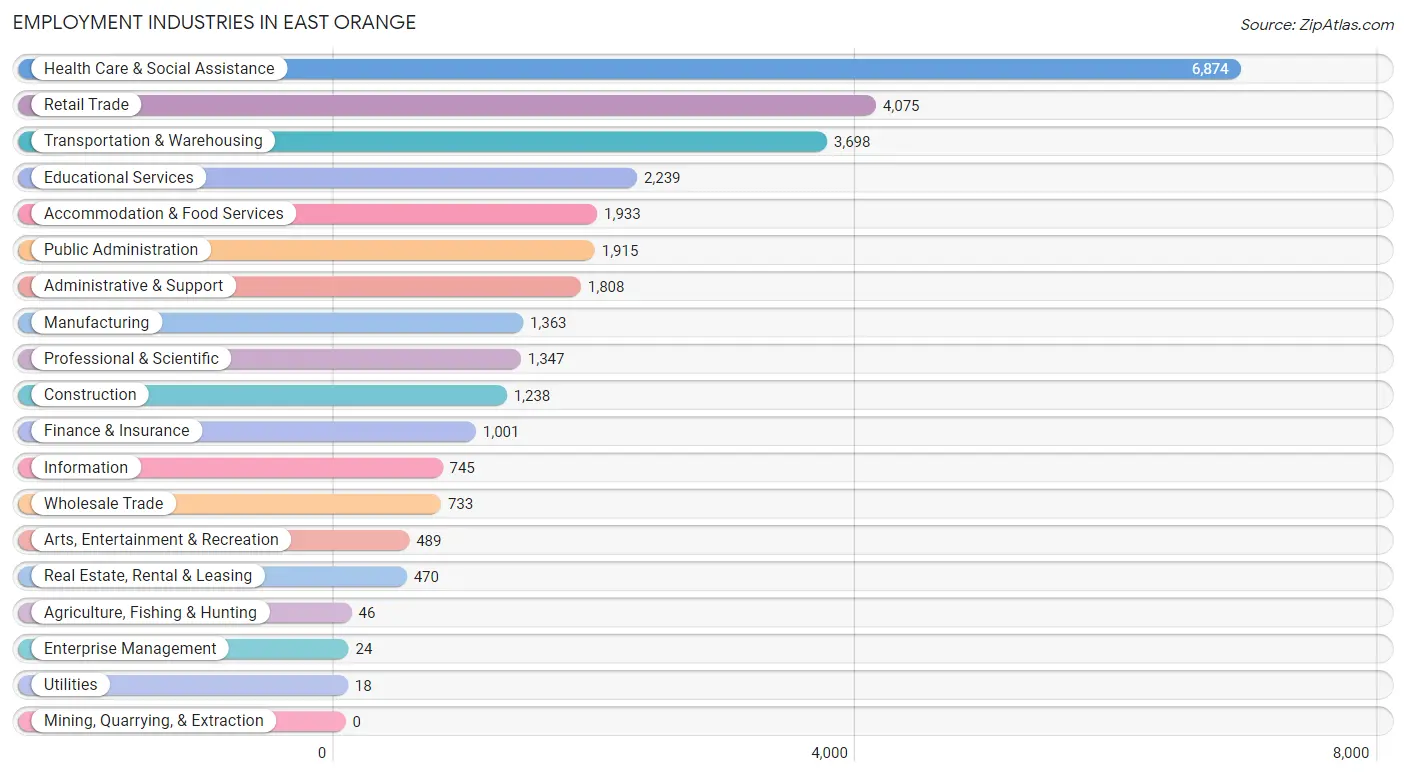
Employment Industries in East Orange
The major employment industries in East Orange include Health Care & Social Assistance (6,874 | 21.6%), Retail Trade (4,075 | 12.8%), Transportation & Warehousing (3,698 | 11.6%), Educational Services (2,239 | 7.0%), and Accommodation & Food Services (1,933 | 6.1%).
Employment Industries by Sex in East Orange
The East Orange industries that see more men than women are Agriculture, Fishing & Hunting (100.0%), Construction (88.8%), and Manufacturing (82.8%), whereas the industries that tend to have a higher number of women are Enterprise Management (100.0%), Health Care & Social Assistance (79.7%), and Utilities (66.7%).
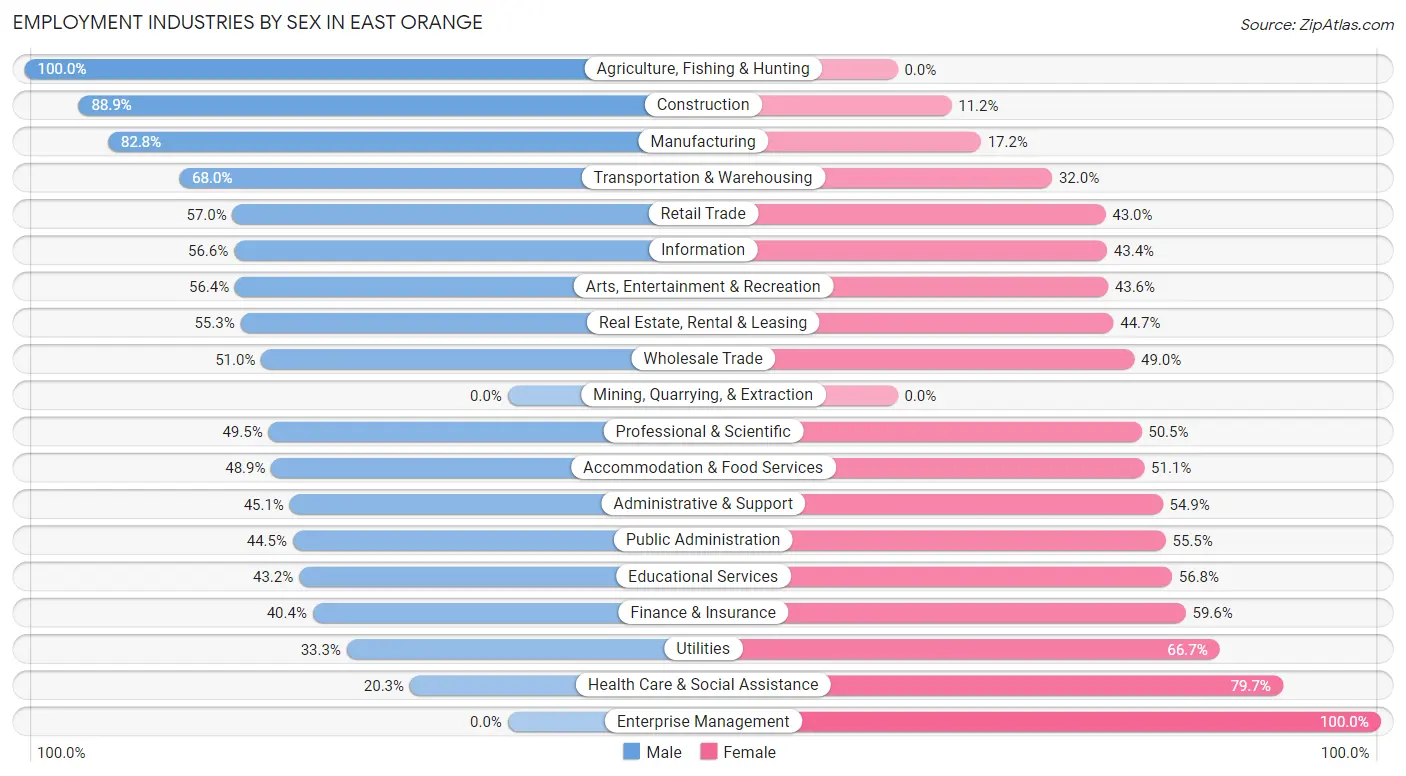
| Industry | Male | Female |
| Agriculture, Fishing & Hunting | 46 (100.0%) | 0 (0.0%) |
| Mining, Quarrying, & Extraction | 0 (0.0%) | 0 (0.0%) |
| Construction | 1,100 (88.8%) | 138 (11.2%) |
| Manufacturing | 1,128 (82.8%) | 235 (17.2%) |
| Wholesale Trade | 374 (51.0%) | 359 (49.0%) |
| Retail Trade | 2,321 (57.0%) | 1,754 (43.0%) |
| Transportation & Warehousing | 2,515 (68.0%) | 1,183 (32.0%) |
| Utilities | 6 (33.3%) | 12 (66.7%) |
| Information | 422 (56.6%) | 323 (43.4%) |
| Finance & Insurance | 404 (40.4%) | 597 (59.6%) |
| Real Estate, Rental & Leasing | 260 (55.3%) | 210 (44.7%) |
| Professional & Scientific | 667 (49.5%) | 680 (50.5%) |
| Enterprise Management | 0 (0.0%) | 24 (100.0%) |
| Administrative & Support | 816 (45.1%) | 992 (54.9%) |
| Educational Services | 967 (43.2%) | 1,272 (56.8%) |
| Health Care & Social Assistance | 1,393 (20.3%) | 5,481 (79.7%) |
| Arts, Entertainment & Recreation | 276 (56.4%) | 213 (43.6%) |
| Accommodation & Food Services | 946 (48.9%) | 987 (51.1%) |
| Public Administration | 852 (44.5%) | 1,063 (55.5%) |
| Total | 14,936 (46.9%) | 16,902 (53.1%) |
Education in East Orange
School Enrollment in East Orange
The most common levels of schooling among the 16,748 students in East Orange are middle school (3,566 | 21.3%), elementary school (3,207 | 19.2%), and high school (3,156 | 18.8%).
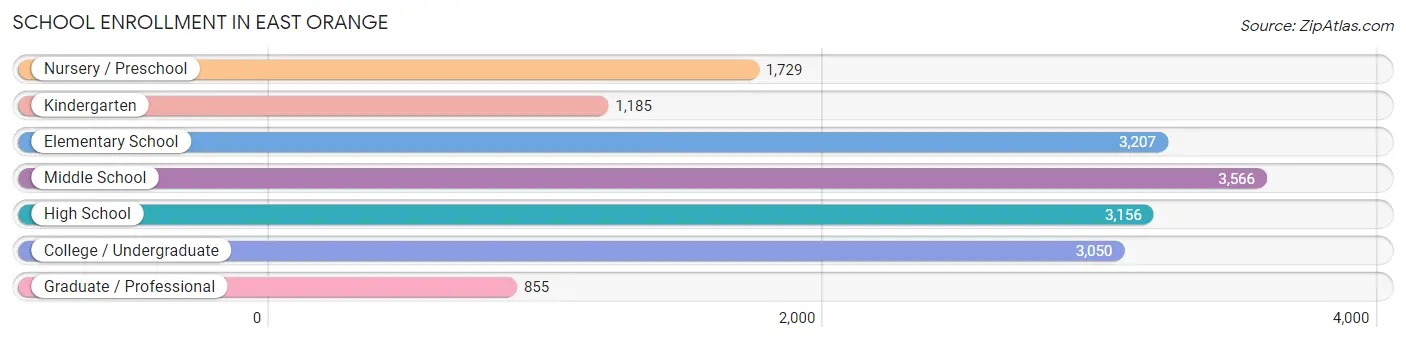
| School Level | # Students | % Students |
| Nursery / Preschool | 1,729 | 10.3% |
| Kindergarten | 1,185 | 7.1% |
| Elementary School | 3,207 | 19.2% |
| Middle School | 3,566 | 21.3% |
| High School | 3,156 | 18.8% |
| College / Undergraduate | 3,050 | 18.2% |
| Graduate / Professional | 855 | 5.1% |
| Total | 16,748 | 100.0% |
School Enrollment by Age by Funding Source in East Orange
Out of a total of 16,748 students who are enrolled in schools in East Orange, 2,847 (17.0%) attend a private institution, while the remaining 13,901 (83.0%) are enrolled in public schools. The age group of 35 years and over has the highest likelihood of being enrolled in private schools, with 520 (49.0% in the age bracket) enrolled. Conversely, the age group of 5 to 9 year old has the lowest likelihood of being enrolled in a private school, with 4,215 (92.8% in the age bracket) attending a public institution.
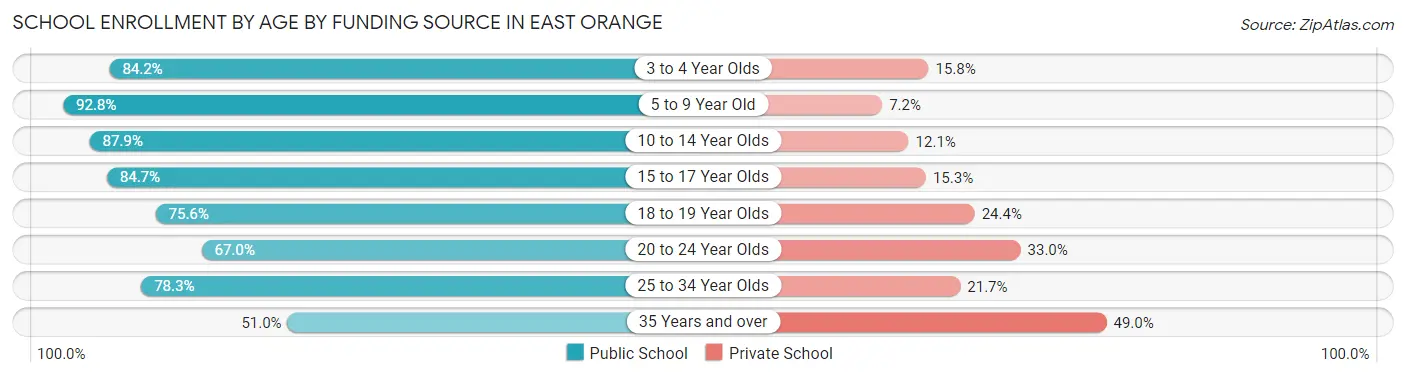
| Age Bracket | Public School | Private School |
| 3 to 4 Year Olds | 1,209 (84.2%) | 227 (15.8%) |
| 5 to 9 Year Old | 4,215 (92.8%) | 326 (7.2%) |
| 10 to 14 Year Olds | 3,531 (87.9%) | 486 (12.1%) |
| 15 to 17 Year Olds | 1,895 (84.7%) | 343 (15.3%) |
| 18 to 19 Year Olds | 737 (75.6%) | 238 (24.4%) |
| 20 to 24 Year Olds | 1,017 (67.0%) | 500 (33.0%) |
| 25 to 34 Year Olds | 753 (78.3%) | 209 (21.7%) |
| 35 Years and over | 542 (51.0%) | 520 (49.0%) |
| Total | 13,901 (83.0%) | 2,847 (17.0%) |
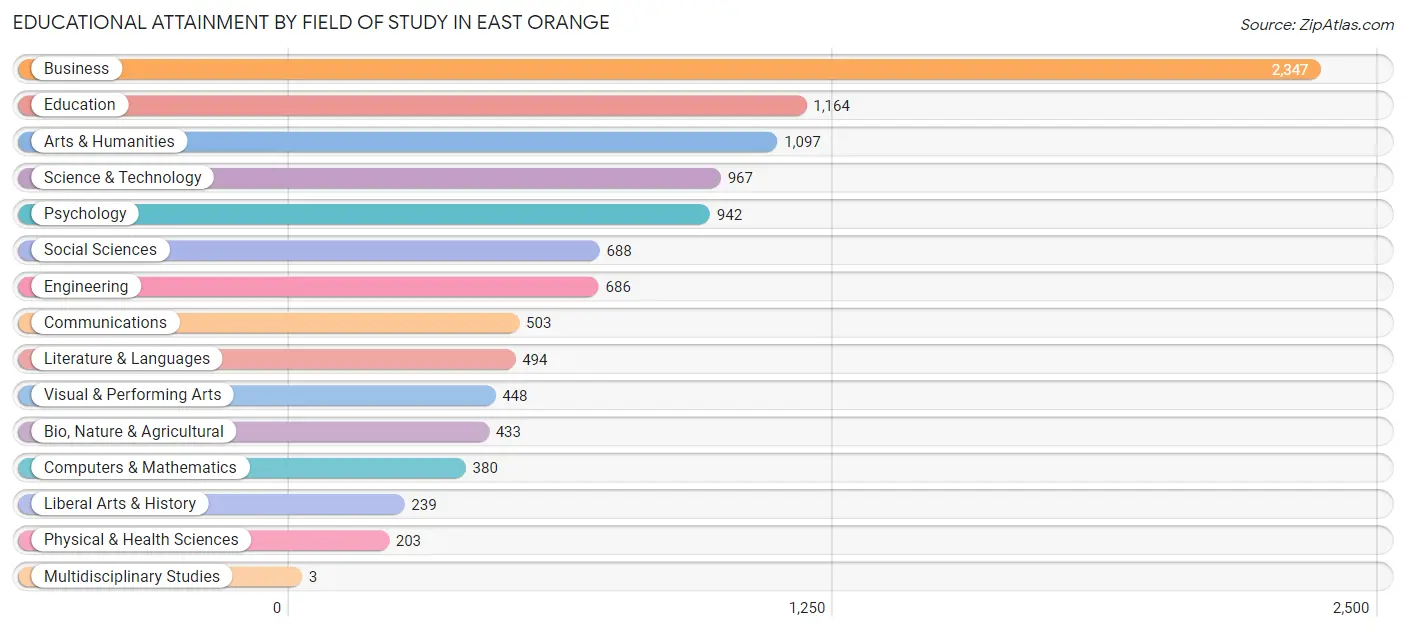
Educational Attainment by Field of Study in East Orange
Business (2,347 | 22.2%), education (1,164 | 11.0%), arts & humanities (1,097 | 10.3%), science & technology (967 | 9.1%), and psychology (942 | 8.9%) are the most common fields of study among 10,594 individuals in East Orange who have obtained a bachelor's degree or higher.
| Field of Study | # Graduates | % Graduates |
| Computers & Mathematics | 380 | 3.6% |
| Bio, Nature & Agricultural | 433 | 4.1% |
| Physical & Health Sciences | 203 | 1.9% |
| Psychology | 942 | 8.9% |
| Social Sciences | 688 | 6.5% |
| Engineering | 686 | 6.5% |
| Multidisciplinary Studies | 3 | 0.0% |
| Science & Technology | 967 | 9.1% |
| Business | 2,347 | 22.2% |
| Education | 1,164 | 11.0% |
| Literature & Languages | 494 | 4.7% |
| Liberal Arts & History | 239 | 2.3% |
| Visual & Performing Arts | 448 | 4.2% |
| Communications | 503 | 4.8% |
| Arts & Humanities | 1,097 | 10.3% |
| Total | 10,594 | 100.0% |
Transportation & Commute in East Orange
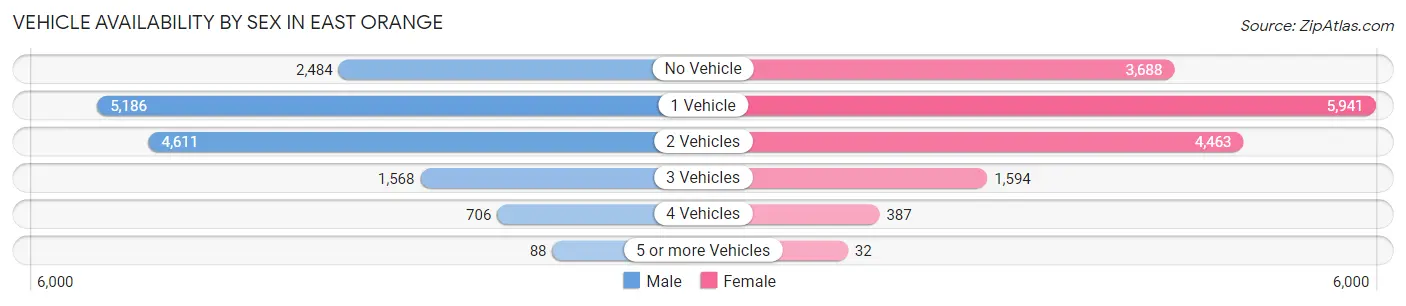
Vehicle Availability by Sex in East Orange
The most prevalent vehicle ownership categories in East Orange are males with 1 vehicle (5,186, accounting for 35.4%) and females with 1 vehicle (5,941, making up 32.2%).
| Vehicles Available | Male | Female |
| No Vehicle | 2,484 (17.0%) | 3,688 (22.9%) |
| 1 Vehicle | 5,186 (35.4%) | 5,941 (36.9%) |
| 2 Vehicles | 4,611 (31.5%) | 4,463 (27.7%) |
| 3 Vehicles | 1,568 (10.7%) | 1,594 (9.9%) |
| 4 Vehicles | 706 (4.8%) | 387 (2.4%) |
| 5 or more Vehicles | 88 (0.6%) | 32 (0.2%) |
| Total | 14,643 (100.0%) | 16,105 (100.0%) |
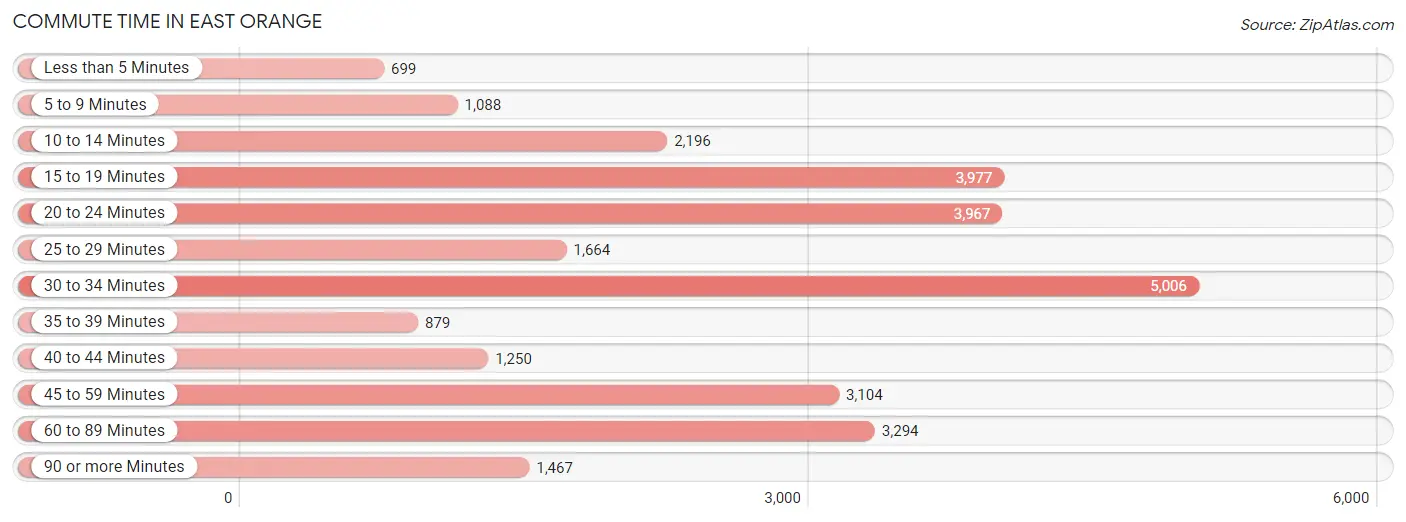
Commute Time in East Orange
The most frequently occuring commute durations in East Orange are 30 to 34 minutes (5,006 commuters, 17.5%), 15 to 19 minutes (3,977 commuters, 13.9%), and 20 to 24 minutes (3,967 commuters, 13.9%).
| Commute Time | # Commuters | % Commuters |
| Less than 5 Minutes | 699 | 2.4% |
| 5 to 9 Minutes | 1,088 | 3.8% |
| 10 to 14 Minutes | 2,196 | 7.7% |
| 15 to 19 Minutes | 3,977 | 13.9% |
| 20 to 24 Minutes | 3,967 | 13.9% |
| 25 to 29 Minutes | 1,664 | 5.8% |
| 30 to 34 Minutes | 5,006 | 17.5% |
| 35 to 39 Minutes | 879 | 3.1% |
| 40 to 44 Minutes | 1,250 | 4.4% |
| 45 to 59 Minutes | 3,104 | 10.9% |
| 60 to 89 Minutes | 3,294 | 11.5% |
| 90 or more Minutes | 1,467 | 5.1% |
Commute Time by Sex in East Orange
The most common commute times in East Orange are 30 to 34 minutes (2,457 commuters, 17.9%) for males and 30 to 34 minutes (2,549 commuters, 17.2%) for females.
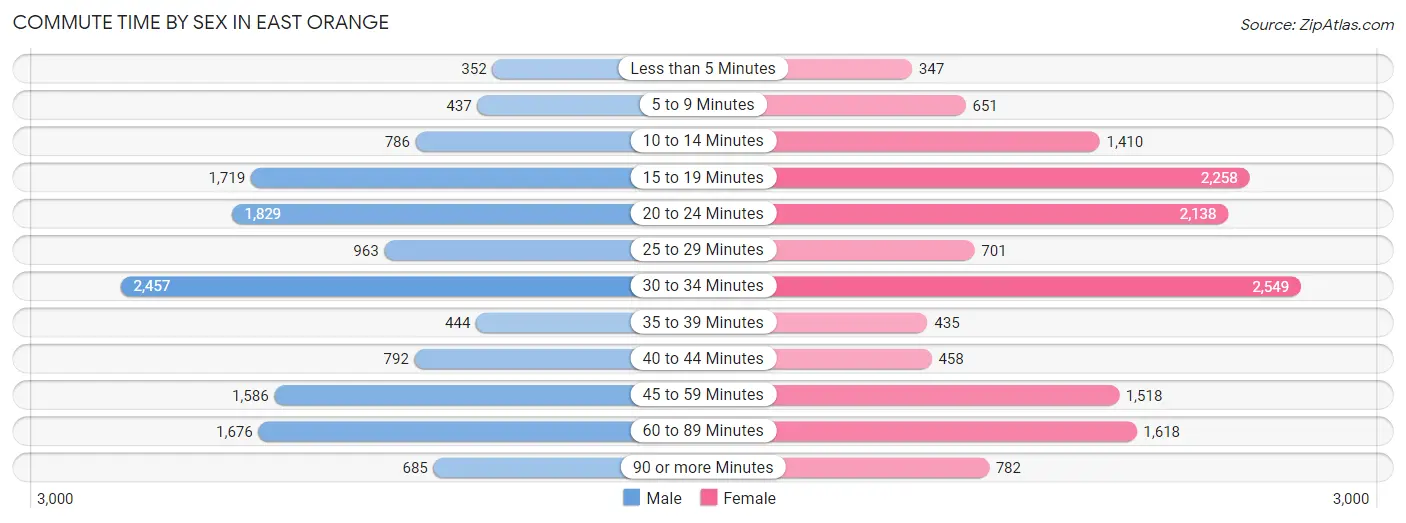
| Commute Time | Male | Female |
| Less than 5 Minutes | 352 (2.6%) | 347 (2.3%) |
| 5 to 9 Minutes | 437 (3.2%) | 651 (4.4%) |
| 10 to 14 Minutes | 786 (5.7%) | 1,410 (9.5%) |
| 15 to 19 Minutes | 1,719 (12.5%) | 2,258 (15.2%) |
| 20 to 24 Minutes | 1,829 (13.3%) | 2,138 (14.4%) |
| 25 to 29 Minutes | 963 (7.0%) | 701 (4.7%) |
| 30 to 34 Minutes | 2,457 (17.9%) | 2,549 (17.2%) |
| 35 to 39 Minutes | 444 (3.2%) | 435 (2.9%) |
| 40 to 44 Minutes | 792 (5.8%) | 458 (3.1%) |
| 45 to 59 Minutes | 1,586 (11.6%) | 1,518 (10.2%) |
| 60 to 89 Minutes | 1,676 (12.2%) | 1,618 (10.9%) |
| 90 or more Minutes | 685 (5.0%) | 782 (5.3%) |
Time of Departure to Work by Sex in East Orange
The most frequent times of departure to work in East Orange are 12:00 PM to 3:59 PM (1,738, 12.7%) for males and 8:00 AM to 8:29 AM (1,860, 12.5%) for females.
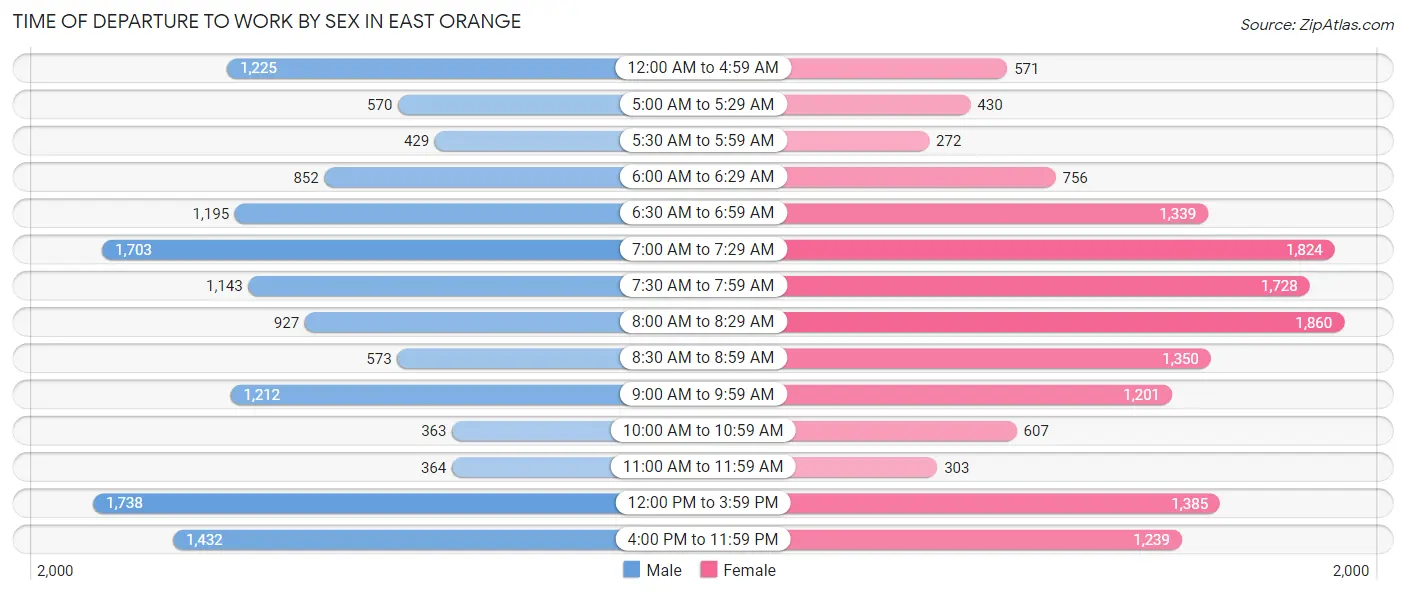
| Time of Departure | Male | Female |
| 12:00 AM to 4:59 AM | 1,225 (8.9%) | 571 (3.8%) |
| 5:00 AM to 5:29 AM | 570 (4.2%) | 430 (2.9%) |
| 5:30 AM to 5:59 AM | 429 (3.1%) | 272 (1.8%) |
| 6:00 AM to 6:29 AM | 852 (6.2%) | 756 (5.1%) |
| 6:30 AM to 6:59 AM | 1,195 (8.7%) | 1,339 (9.0%) |
| 7:00 AM to 7:29 AM | 1,703 (12.4%) | 1,824 (12.3%) |
| 7:30 AM to 7:59 AM | 1,143 (8.3%) | 1,728 (11.6%) |
| 8:00 AM to 8:29 AM | 927 (6.8%) | 1,860 (12.5%) |
| 8:30 AM to 8:59 AM | 573 (4.2%) | 1,350 (9.1%) |
| 9:00 AM to 9:59 AM | 1,212 (8.8%) | 1,201 (8.1%) |
| 10:00 AM to 10:59 AM | 363 (2.6%) | 607 (4.1%) |
| 11:00 AM to 11:59 AM | 364 (2.6%) | 303 (2.0%) |
| 12:00 PM to 3:59 PM | 1,738 (12.7%) | 1,385 (9.3%) |
| 4:00 PM to 11:59 PM | 1,432 (10.4%) | 1,239 (8.3%) |
| Total | 13,726 (100.0%) | 14,865 (100.0%) |
Housing Occupancy in East Orange
Occupancy by Ownership in East Orange
Of the total 26,359 dwellings in East Orange, owner-occupied units account for 7,389 (28.0%), while renter-occupied units make up 18,970 (72.0%).
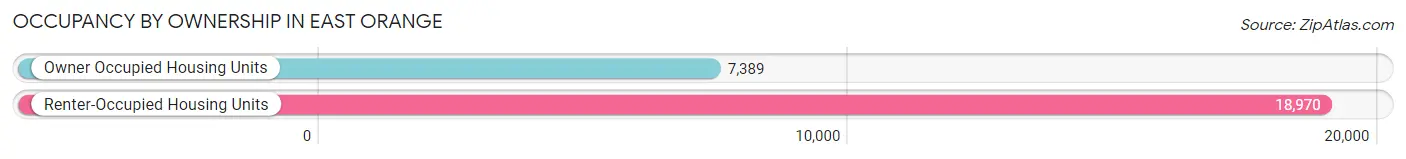
| Occupancy | # Housing Units | % Housing Units |
| Owner Occupied Housing Units | 7,389 | 28.0% |
| Renter-Occupied Housing Units | 18,970 | 72.0% |
| Total Occupied Housing Units | 26,359 | 100.0% |
Occupancy by Household Size in East Orange
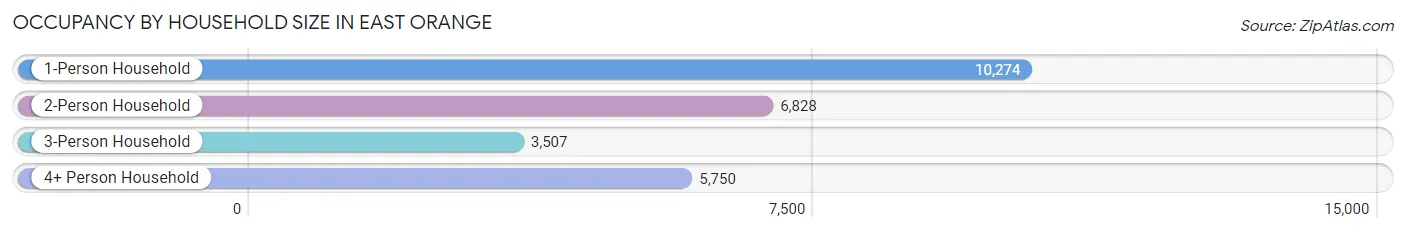
| Household Size | # Housing Units | % Housing Units |
| 1-Person Household | 10,274 | 39.0% |
| 2-Person Household | 6,828 | 25.9% |
| 3-Person Household | 3,507 | 13.3% |
| 4+ Person Household | 5,750 | 21.8% |
| Total Housing Units | 26,359 | 100.0% |
Occupancy by Ownership by Household Size in East Orange
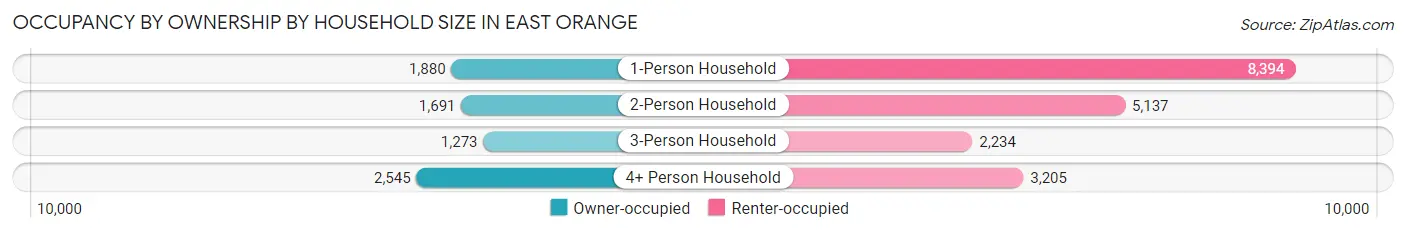
| Household Size | Owner-occupied | Renter-occupied |
| 1-Person Household | 1,880 (18.3%) | 8,394 (81.7%) |
| 2-Person Household | 1,691 (24.8%) | 5,137 (75.2%) |
| 3-Person Household | 1,273 (36.3%) | 2,234 (63.7%) |
| 4+ Person Household | 2,545 (44.3%) | 3,205 (55.7%) |
| Total Housing Units | 7,389 (28.0%) | 18,970 (72.0%) |
Occupancy by Educational Attainment in East Orange
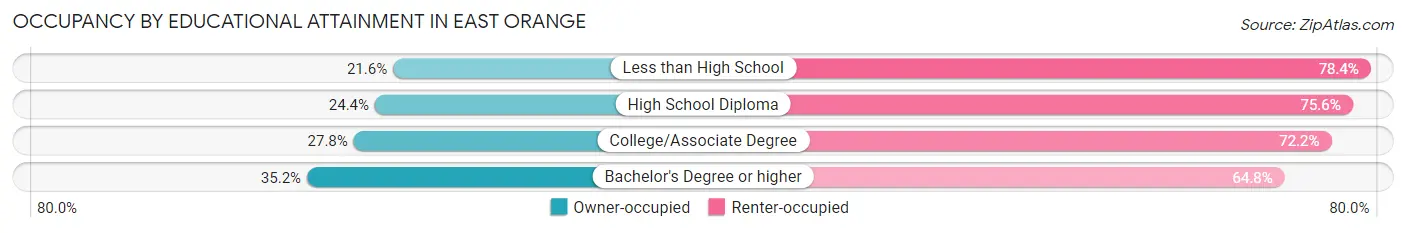
| Household Size | Owner-occupied | Renter-occupied |
| Less than High School | 669 (21.6%) | 2,432 (78.4%) |
| High School Diploma | 1,821 (24.4%) | 5,629 (75.6%) |
| College/Associate Degree | 2,510 (27.8%) | 6,515 (72.2%) |
| Bachelor's Degree or higher | 2,389 (35.2%) | 4,394 (64.8%) |
Occupancy by Age of Householder in East Orange
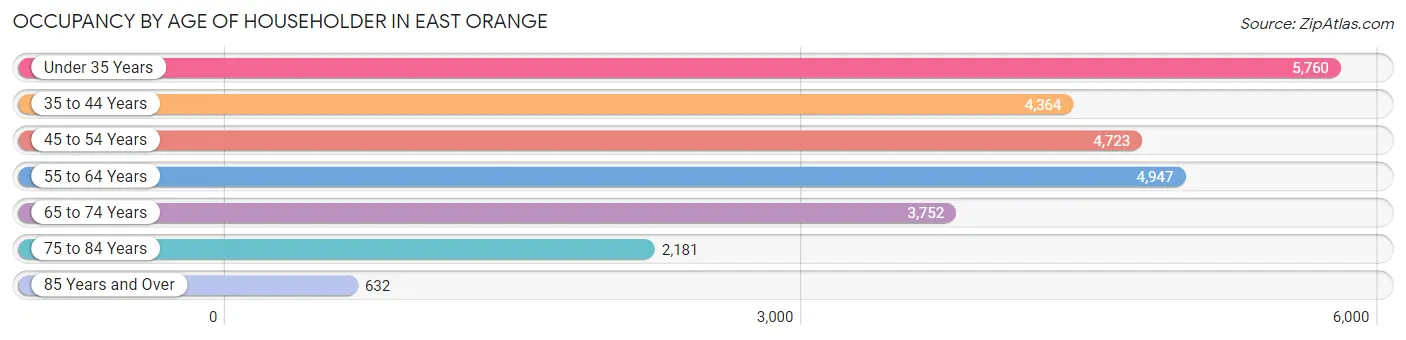
| Age Bracket | # Households | % Households |
| Under 35 Years | 5,760 | 21.8% |
| 35 to 44 Years | 4,364 | 16.6% |
| 45 to 54 Years | 4,723 | 17.9% |
| 55 to 64 Years | 4,947 | 18.8% |
| 65 to 74 Years | 3,752 | 14.2% |
| 75 to 84 Years | 2,181 | 8.3% |
| 85 Years and Over | 632 | 2.4% |
| Total | 26,359 | 100.0% |
Housing Finances in East Orange
Median Income by Occupancy in East Orange
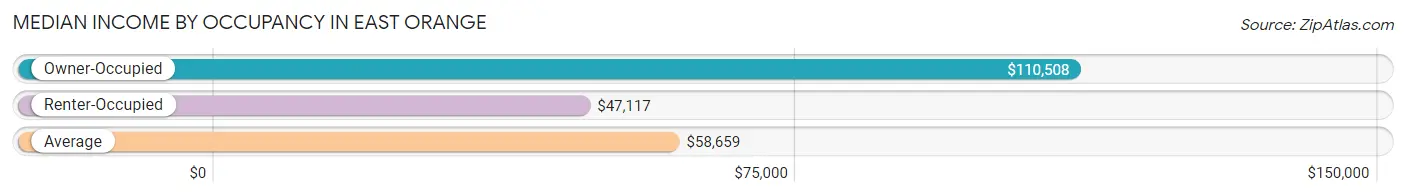
| Occupancy Type | # Households | Median Income |
| Owner-Occupied | 7,389 (28.0%) | $110,508 |
| Renter-Occupied | 18,970 (72.0%) | $47,117 |
| Average | 26,359 (100.0%) | $58,659 |
Occupancy by Householder Income Bracket in East Orange
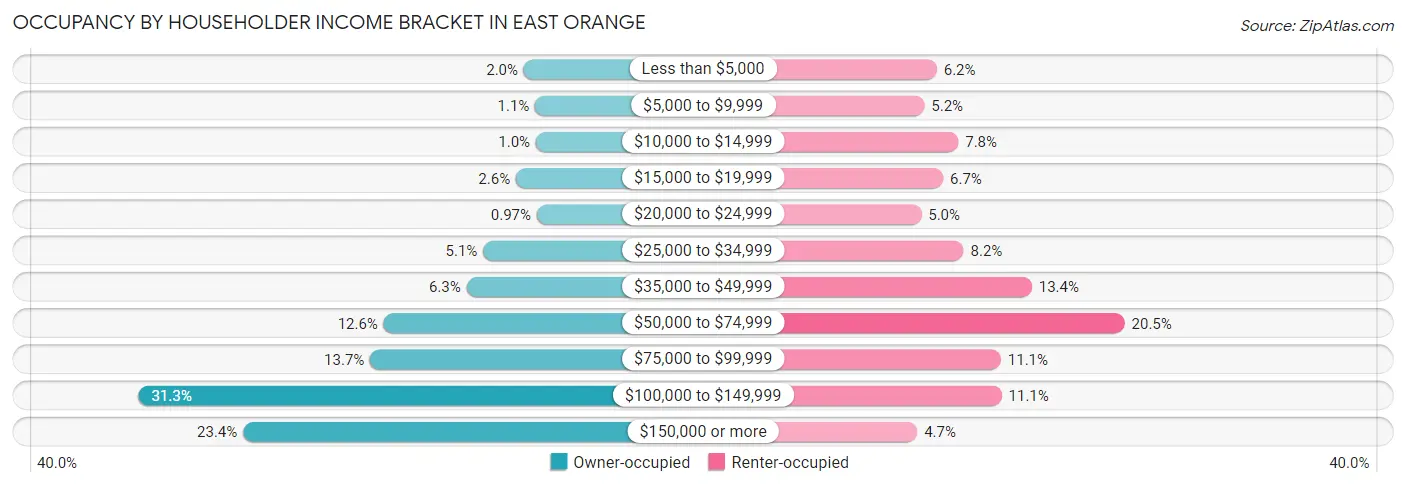
| Income Bracket | Owner-occupied | Renter-occupied |
| Less than $5,000 | 145 (2.0%) | 1,175 (6.2%) |
| $5,000 to $9,999 | 81 (1.1%) | 994 (5.2%) |
| $10,000 to $14,999 | 77 (1.0%) | 1,486 (7.8%) |
| $15,000 to $19,999 | 189 (2.6%) | 1,265 (6.7%) |
| $20,000 to $24,999 | 72 (1.0%) | 950 (5.0%) |
| $25,000 to $34,999 | 374 (5.1%) | 1,561 (8.2%) |
| $35,000 to $49,999 | 468 (6.3%) | 2,547 (13.4%) |
| $50,000 to $74,999 | 934 (12.6%) | 3,888 (20.5%) |
| $75,000 to $99,999 | 1,010 (13.7%) | 2,100 (11.1%) |
| $100,000 to $149,999 | 2,314 (31.3%) | 2,112 (11.1%) |
| $150,000 or more | 1,725 (23.4%) | 892 (4.7%) |
| Total | 7,389 (100.0%) | 18,970 (100.0%) |
Monthly Housing Cost Tiers in East Orange
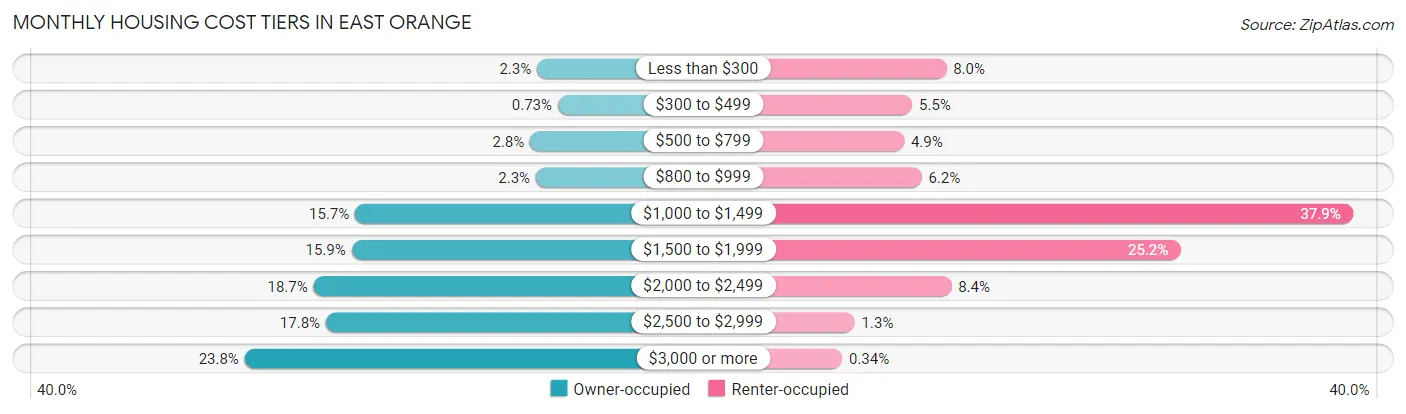
| Monthly Cost | Owner-occupied | Renter-occupied |
| Less than $300 | 167 (2.3%) | 1,520 (8.0%) |
| $300 to $499 | 54 (0.7%) | 1,043 (5.5%) |
| $500 to $799 | 205 (2.8%) | 929 (4.9%) |
| $800 to $999 | 173 (2.3%) | 1,175 (6.2%) |
| $1,000 to $1,499 | 1,157 (15.7%) | 7,198 (37.9%) |
| $1,500 to $1,999 | 1,176 (15.9%) | 4,786 (25.2%) |
| $2,000 to $2,499 | 1,383 (18.7%) | 1,590 (8.4%) |
| $2,500 to $2,999 | 1,316 (17.8%) | 240 (1.3%) |
| $3,000 or more | 1,758 (23.8%) | 65 (0.3%) |
| Total | 7,389 (100.0%) | 18,970 (100.0%) |
Physical Housing Characteristics in East Orange
Housing Structures in East Orange
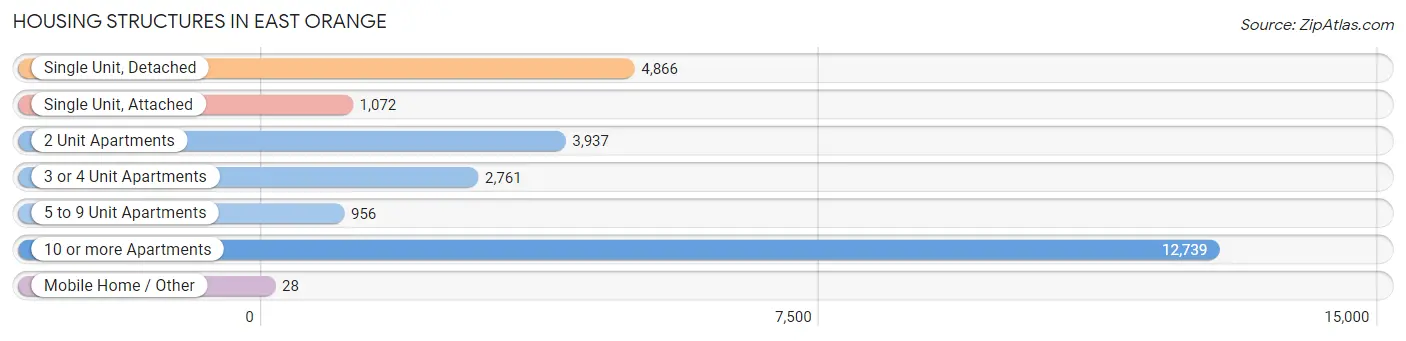
| Structure Type | # Housing Units | % Housing Units |
| Single Unit, Detached | 4,866 | 18.5% |
| Single Unit, Attached | 1,072 | 4.1% |
| 2 Unit Apartments | 3,937 | 14.9% |
| 3 or 4 Unit Apartments | 2,761 | 10.5% |
| 5 to 9 Unit Apartments | 956 | 3.6% |
| 10 or more Apartments | 12,739 | 48.3% |
| Mobile Home / Other | 28 | 0.1% |
| Total | 26,359 | 100.0% |
Housing Structures by Occupancy in East Orange
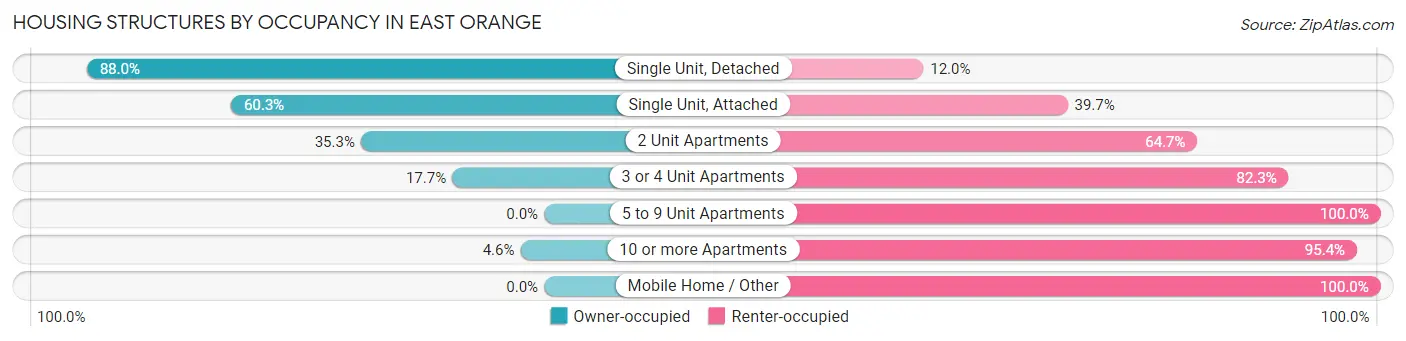
| Structure Type | Owner-occupied | Renter-occupied |
| Single Unit, Detached | 4,284 (88.0%) | 582 (12.0%) |
| Single Unit, Attached | 646 (60.3%) | 426 (39.7%) |
| 2 Unit Apartments | 1,389 (35.3%) | 2,548 (64.7%) |
| 3 or 4 Unit Apartments | 489 (17.7%) | 2,272 (82.3%) |
| 5 to 9 Unit Apartments | 0 (0.0%) | 956 (100.0%) |
| 10 or more Apartments | 581 (4.6%) | 12,158 (95.4%) |
| Mobile Home / Other | 0 (0.0%) | 28 (100.0%) |
| Total | 7,389 (28.0%) | 18,970 (72.0%) |
Housing Structures by Number of Rooms in East Orange
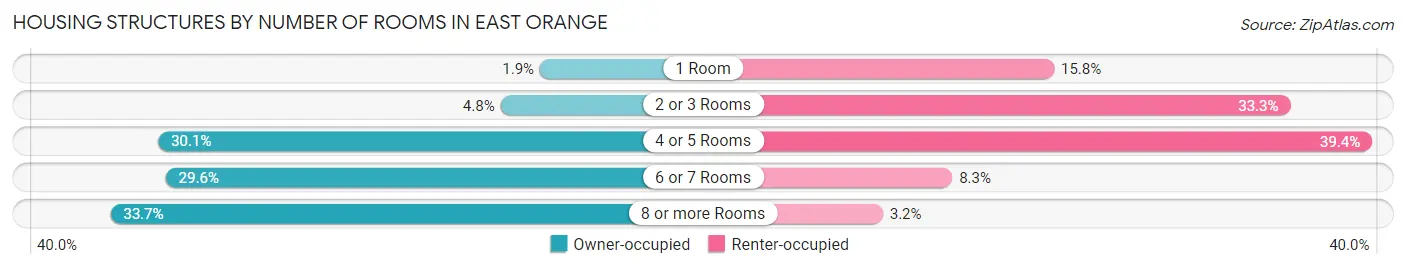
| Number of Rooms | Owner-occupied | Renter-occupied |
| 1 Room | 138 (1.9%) | 3,004 (15.8%) |
| 2 or 3 Rooms | 354 (4.8%) | 6,321 (33.3%) |
| 4 or 5 Rooms | 2,226 (30.1%) | 7,468 (39.4%) |
| 6 or 7 Rooms | 2,184 (29.6%) | 1,576 (8.3%) |
| 8 or more Rooms | 2,487 (33.7%) | 601 (3.2%) |
| Total | 7,389 (100.0%) | 18,970 (100.0%) |
Housing Structure by Heating Type in East Orange
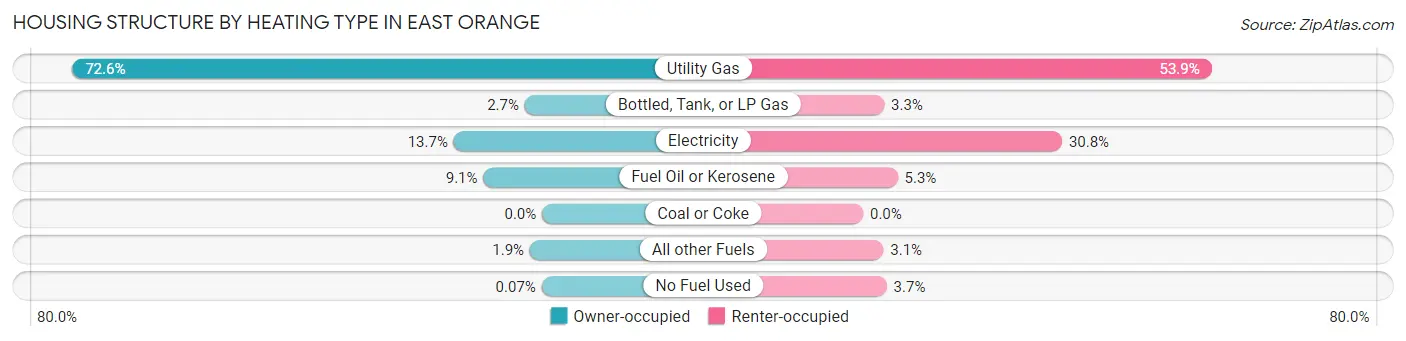
| Heating Type | Owner-occupied | Renter-occupied |
| Utility Gas | 5,367 (72.6%) | 10,219 (53.9%) |
| Bottled, Tank, or LP Gas | 198 (2.7%) | 617 (3.3%) |
| Electricity | 1,009 (13.7%) | 5,834 (30.7%) |
| Fuel Oil or Kerosene | 671 (9.1%) | 1,013 (5.3%) |
| Coal or Coke | 0 (0.0%) | 0 (0.0%) |
| All other Fuels | 139 (1.9%) | 595 (3.1%) |
| No Fuel Used | 5 (0.1%) | 692 (3.6%) |
| Total | 7,389 (100.0%) | 18,970 (100.0%) |
Household Vehicle Usage in East Orange
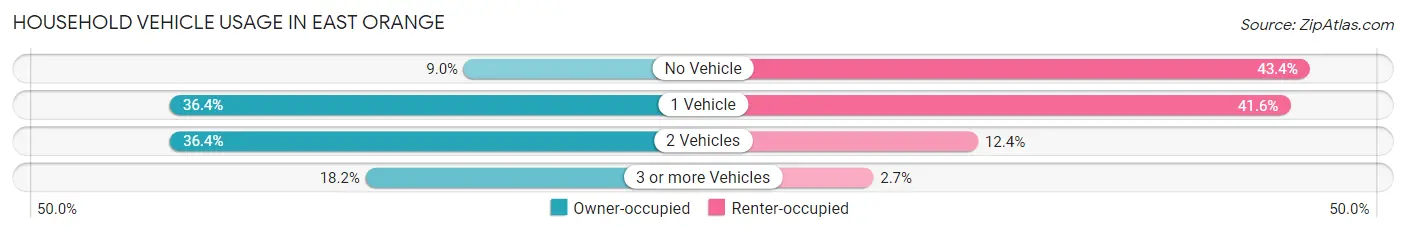
| Vehicles per Household | Owner-occupied | Renter-occupied |
| No Vehicle | 664 (9.0%) | 8,227 (43.4%) |
| 1 Vehicle | 2,692 (36.4%) | 7,884 (41.6%) |
| 2 Vehicles | 2,691 (36.4%) | 2,357 (12.4%) |
| 3 or more Vehicles | 1,342 (18.2%) | 502 (2.6%) |
| Total | 7,389 (100.0%) | 18,970 (100.0%) |
Real Estate & Mortgages in East Orange
Real Estate and Mortgage Overview in East Orange
| Characteristic | Without Mortgage | With Mortgage |
| Housing Units | 2,034 | 5,355 |
| Median Property Value | $247,500 | $291,600 |
| Median Household Income | $72,360 | $1,513 |
| Monthly Housing Costs | $1,266 | $1,733 |
| Real Estate Taxes | $9,237 | $238 |
Property Value by Mortgage Status in East Orange
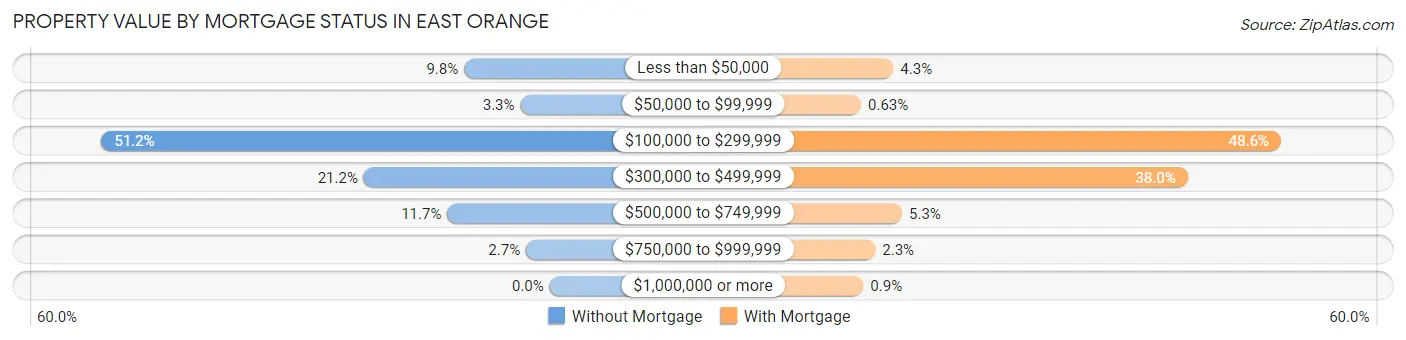
| Property Value | Without Mortgage | With Mortgage |
| Less than $50,000 | 199 (9.8%) | 232 (4.3%) |
| $50,000 to $99,999 | 68 (3.3%) | 34 (0.6%) |
| $100,000 to $299,999 | 1,042 (51.2%) | 2,603 (48.6%) |
| $300,000 to $499,999 | 432 (21.2%) | 2,032 (38.0%) |
| $500,000 to $749,999 | 238 (11.7%) | 285 (5.3%) |
| $750,000 to $999,999 | 55 (2.7%) | 121 (2.3%) |
| $1,000,000 or more | 0 (0.0%) | 48 (0.9%) |
| Total | 2,034 (100.0%) | 5,355 (100.0%) |
Household Income by Mortgage Status in East Orange
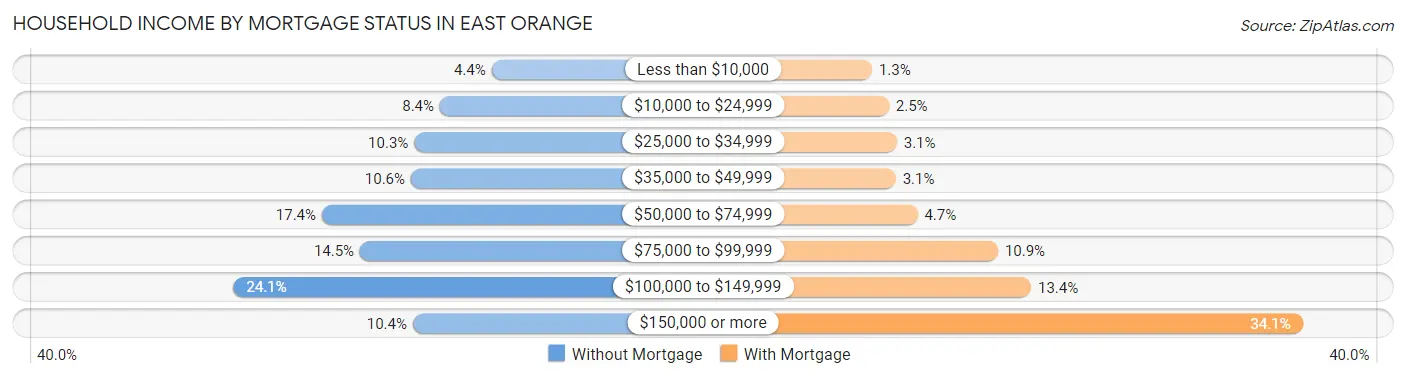
| Household Income | Without Mortgage | With Mortgage |
| Less than $10,000 | 90 (4.4%) | 67 (1.3%) |
| $10,000 to $24,999 | 170 (8.4%) | 136 (2.5%) |
| $25,000 to $34,999 | 210 (10.3%) | 168 (3.1%) |
| $35,000 to $49,999 | 215 (10.6%) | 164 (3.1%) |
| $50,000 to $74,999 | 353 (17.3%) | 253 (4.7%) |
| $75,000 to $99,999 | 294 (14.4%) | 581 (10.8%) |
| $100,000 to $149,999 | 490 (24.1%) | 716 (13.4%) |
| $150,000 or more | 212 (10.4%) | 1,824 (34.1%) |
| Total | 2,034 (100.0%) | 5,355 (100.0%) |
Property Value to Household Income Ratio in East Orange
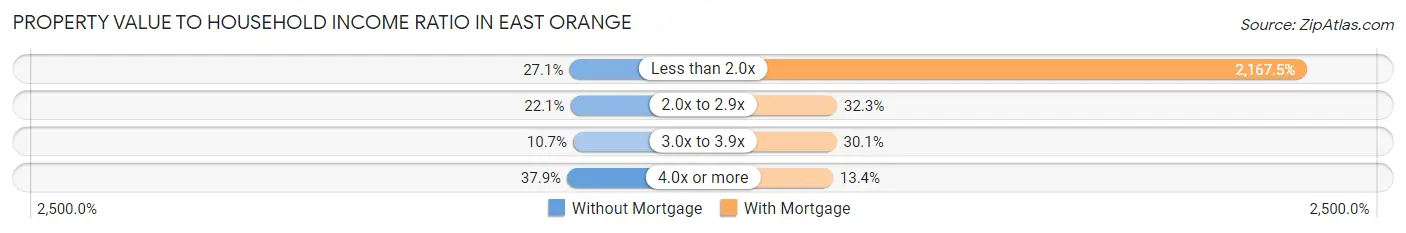
| Value-to-Income Ratio | Without Mortgage | With Mortgage |
| Less than 2.0x | 552 (27.1%) | 116,069 (2,167.5%) |
| 2.0x to 2.9x | 449 (22.1%) | 1,730 (32.3%) |
| 3.0x to 3.9x | 218 (10.7%) | 1,611 (30.1%) |
| 4.0x or more | 770 (37.9%) | 718 (13.4%) |
| Total | 2,034 (100.0%) | 5,355 (100.0%) |
Real Estate Taxes by Mortgage Status in East Orange
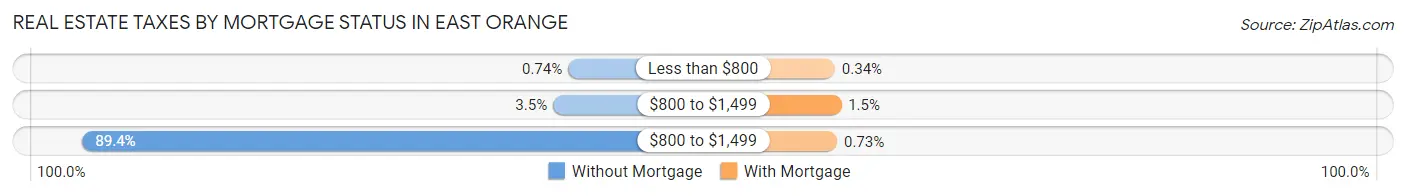
| Property Taxes | Without Mortgage | With Mortgage |
| Less than $800 | 15 (0.7%) | 18 (0.3%) |
| $800 to $1,499 | 71 (3.5%) | 80 (1.5%) |
| $800 to $1,499 | 1,819 (89.4%) | 39 (0.7%) |
| Total | 2,034 (100.0%) | 5,355 (100.0%) |
Health & Disability in East Orange
Health Insurance Coverage by Age in East Orange
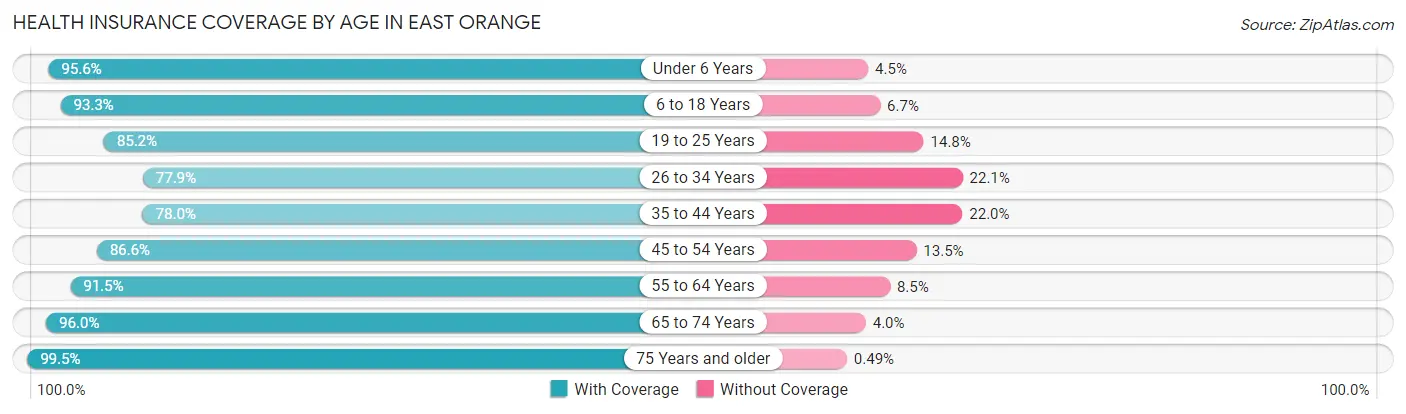
| Age Bracket | With Coverage | Without Coverage |
| Under 6 Years | 5,625 (95.6%) | 262 (4.4%) |
| 6 to 18 Years | 10,564 (93.3%) | 758 (6.7%) |
| 19 to 25 Years | 5,093 (85.2%) | 884 (14.8%) |
| 26 to 34 Years | 8,608 (77.9%) | 2,436 (22.1%) |
| 35 to 44 Years | 6,922 (78.0%) | 1,955 (22.0%) |
| 45 to 54 Years | 7,006 (86.6%) | 1,089 (13.5%) |
| 55 to 64 Years | 7,064 (91.5%) | 658 (8.5%) |
| 65 to 74 Years | 5,173 (96.0%) | 216 (4.0%) |
| 75 Years and older | 3,821 (99.5%) | 19 (0.5%) |
| Total | 59,876 (87.9%) | 8,277 (12.1%) |
Health Insurance Coverage by Citizenship Status in East Orange
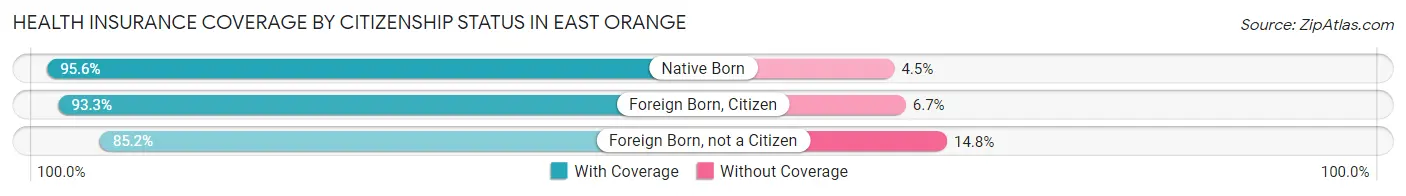
| Citizenship Status | With Coverage | Without Coverage |
| Native Born | 5,625 (95.6%) | 262 (4.4%) |
| Foreign Born, Citizen | 10,564 (93.3%) | 758 (6.7%) |
| Foreign Born, not a Citizen | 5,093 (85.2%) | 884 (14.8%) |
Health Insurance Coverage by Household Income in East Orange
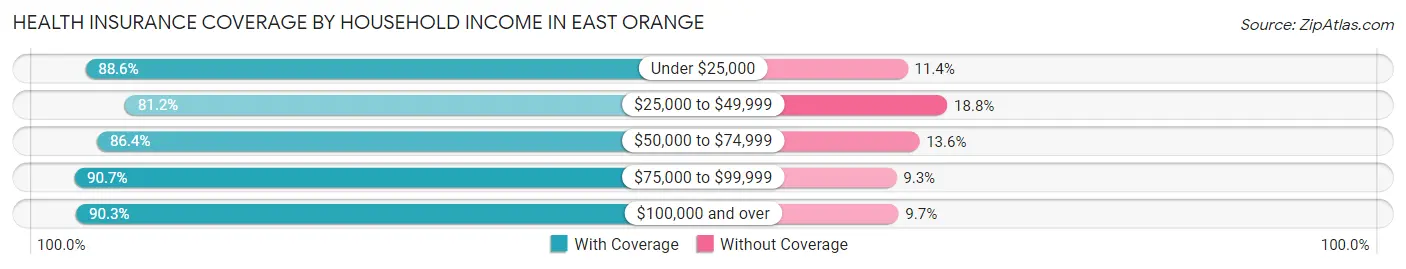
| Household Income | With Coverage | Without Coverage |
| Under $25,000 | 9,813 (88.6%) | 1,260 (11.4%) |
| $25,000 to $49,999 | 9,382 (81.2%) | 2,172 (18.8%) |
| $50,000 to $74,999 | 10,812 (86.4%) | 1,697 (13.6%) |
| $75,000 to $99,999 | 6,659 (90.7%) | 682 (9.3%) |
| $100,000 and over | 22,885 (90.3%) | 2,449 (9.7%) |
Public vs Private Health Insurance Coverage by Age in East Orange
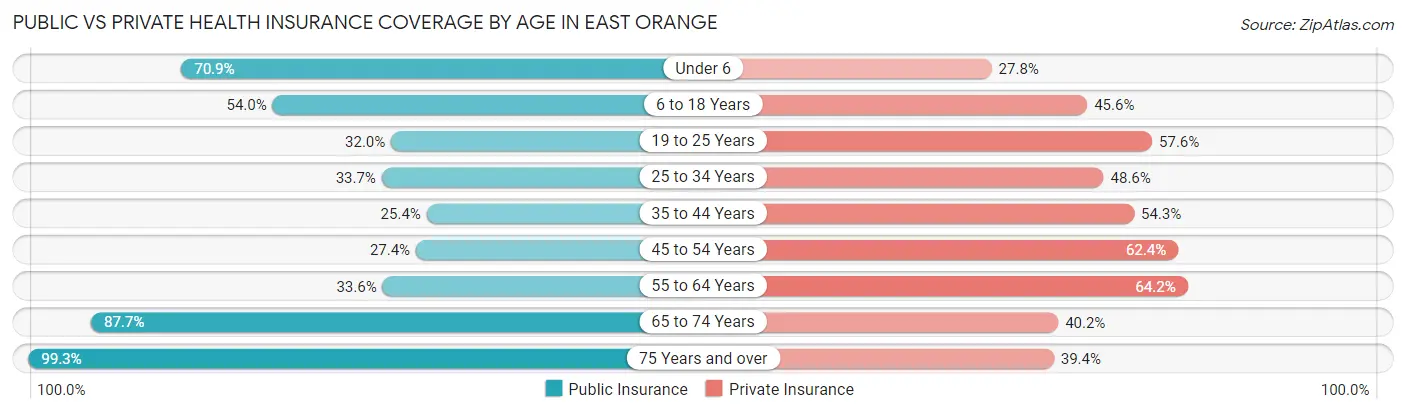
| Age Bracket | Public Insurance | Private Insurance |
| Under 6 | 4,174 (70.9%) | 1,638 (27.8%) |
| 6 to 18 Years | 6,110 (54.0%) | 5,158 (45.6%) |
| 19 to 25 Years | 1,911 (32.0%) | 3,443 (57.6%) |
| 25 to 34 Years | 3,724 (33.7%) | 5,367 (48.6%) |
| 35 to 44 Years | 2,252 (25.4%) | 4,816 (54.2%) |
| 45 to 54 Years | 2,215 (27.4%) | 5,053 (62.4%) |
| 55 to 64 Years | 2,592 (33.6%) | 4,955 (64.2%) |
| 65 to 74 Years | 4,724 (87.7%) | 2,165 (40.2%) |
| 75 Years and over | 3,813 (99.3%) | 1,511 (39.4%) |
| Total | 31,515 (46.2%) | 34,106 (50.0%) |
Disability Status by Sex by Age in East Orange
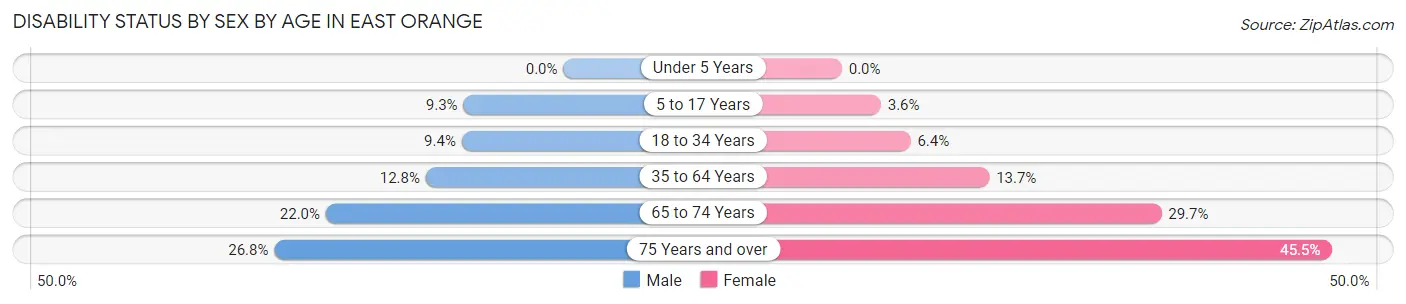
| Age Bracket | Male | Female |
| Under 5 Years | 0 (0.0%) | 0 (0.0%) |
| 5 to 17 Years | 498 (9.3%) | 222 (3.6%) |
| 18 to 34 Years | 795 (9.4%) | 597 (6.4%) |
| 35 to 64 Years | 1,435 (12.8%) | 1,842 (13.7%) |
| 65 to 74 Years | 448 (22.0%) | 995 (29.6%) |
| 75 Years and over | 330 (26.8%) | 1,188 (45.5%) |
Disability Class by Sex by Age in East Orange
Disability Class: Hearing Difficulty
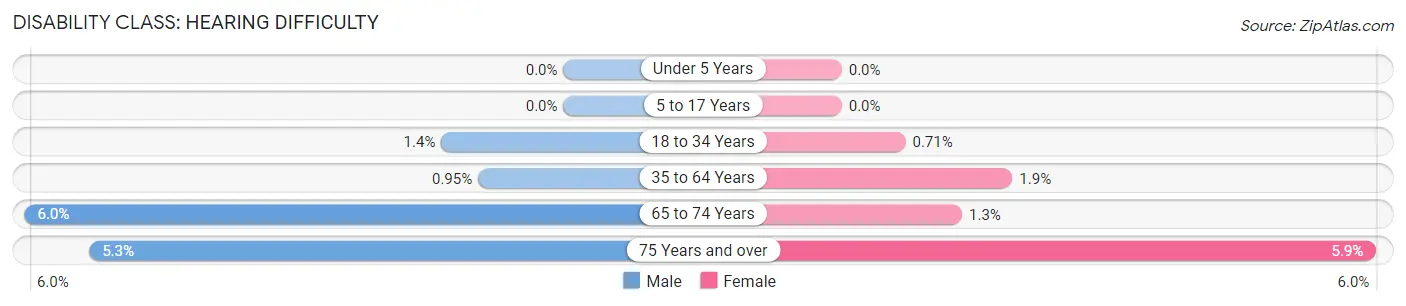
| Age Bracket | Male | Female |
| Under 5 Years | 0 (0.0%) | 0 (0.0%) |
| 5 to 17 Years | 0 (0.0%) | 0 (0.0%) |
| 18 to 34 Years | 115 (1.4%) | 67 (0.7%) |
| 35 to 64 Years | 107 (0.9%) | 256 (1.9%) |
| 65 to 74 Years | 122 (6.0%) | 45 (1.3%) |
| 75 Years and over | 65 (5.3%) | 155 (5.9%) |
Disability Class: Vision Difficulty
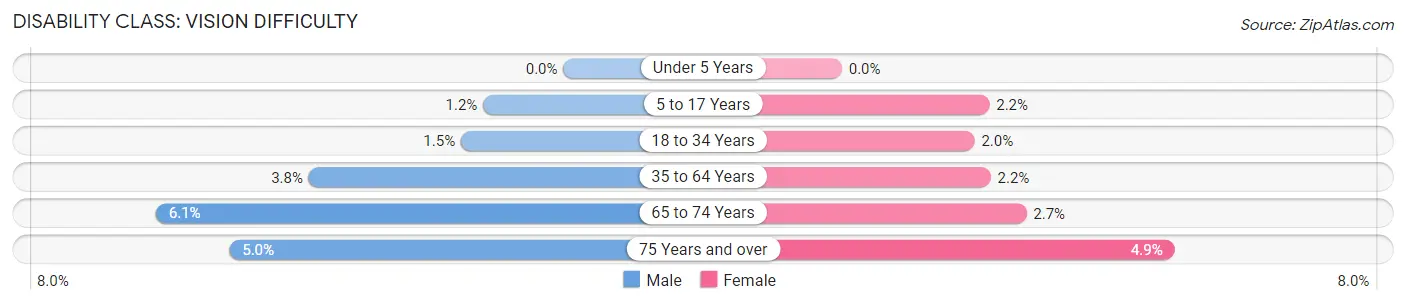
| Age Bracket | Male | Female |
| Under 5 Years | 0 (0.0%) | 0 (0.0%) |
| 5 to 17 Years | 64 (1.2%) | 134 (2.2%) |
| 18 to 34 Years | 128 (1.5%) | 185 (2.0%) |
| 35 to 64 Years | 425 (3.8%) | 297 (2.2%) |
| 65 to 74 Years | 123 (6.0%) | 92 (2.7%) |
| 75 Years and over | 61 (5.0%) | 129 (4.9%) |
Disability Class: Cognitive Difficulty
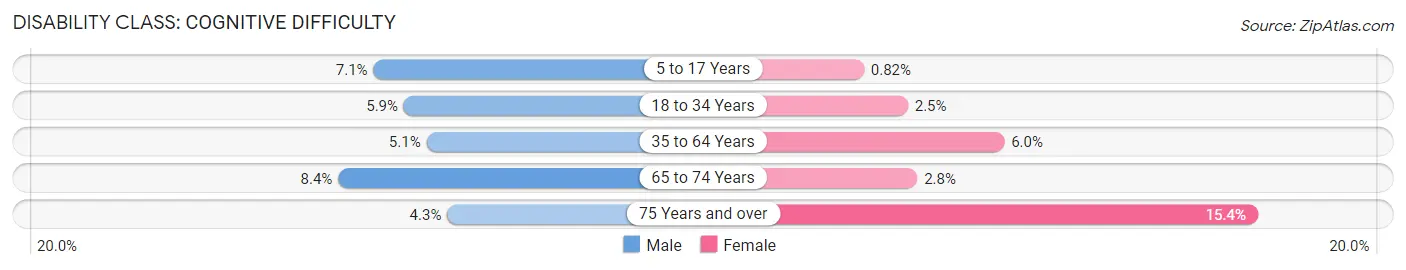
| Age Bracket | Male | Female |
| 5 to 17 Years | 379 (7.0%) | 50 (0.8%) |
| 18 to 34 Years | 499 (5.9%) | 230 (2.5%) |
| 35 to 64 Years | 571 (5.1%) | 811 (6.0%) |
| 65 to 74 Years | 170 (8.4%) | 94 (2.8%) |
| 75 Years and over | 53 (4.3%) | 403 (15.4%) |
Disability Class: Ambulatory Difficulty
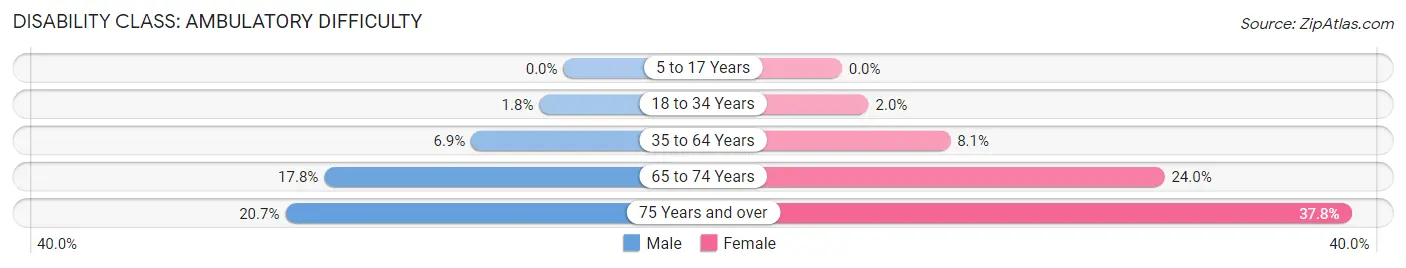
| Age Bracket | Male | Female |
| 5 to 17 Years | 0 (0.0%) | 0 (0.0%) |
| 18 to 34 Years | 151 (1.8%) | 187 (2.0%) |
| 35 to 64 Years | 769 (6.9%) | 1,084 (8.1%) |
| 65 to 74 Years | 361 (17.8%) | 804 (24.0%) |
| 75 Years and over | 254 (20.6%) | 987 (37.8%) |
Disability Class: Self-Care Difficulty

| Age Bracket | Male | Female |
| 5 to 17 Years | 55 (1.0%) | 67 (1.1%) |
| 18 to 34 Years | 163 (1.9%) | 63 (0.7%) |
| 35 to 64 Years | 448 (4.0%) | 402 (3.0%) |
| 65 to 74 Years | 184 (9.0%) | 101 (3.0%) |
| 75 Years and over | 103 (8.4%) | 485 (18.6%) |
Technology Access in East Orange
Computing Device Access in East Orange
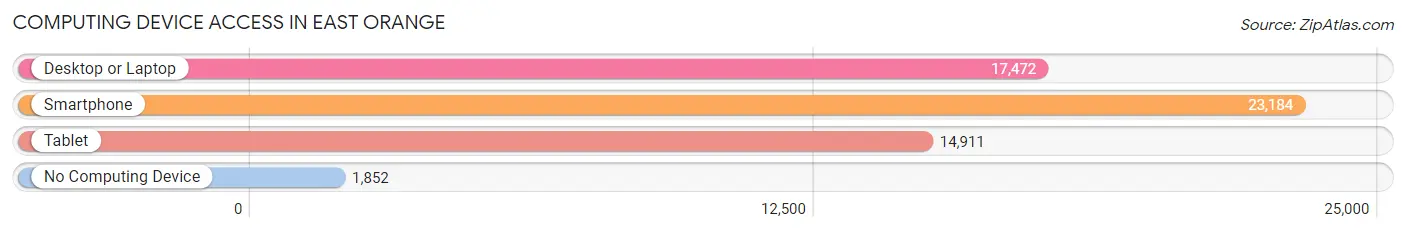
| Device Type | # Households | % Households |
| Desktop or Laptop | 17,472 | 66.3% |
| Smartphone | 23,184 | 87.9% |
| Tablet | 14,911 | 56.6% |
| No Computing Device | 1,852 | 7.0% |
| Total | 26,359 | 100.0% |
Internet Access in East Orange
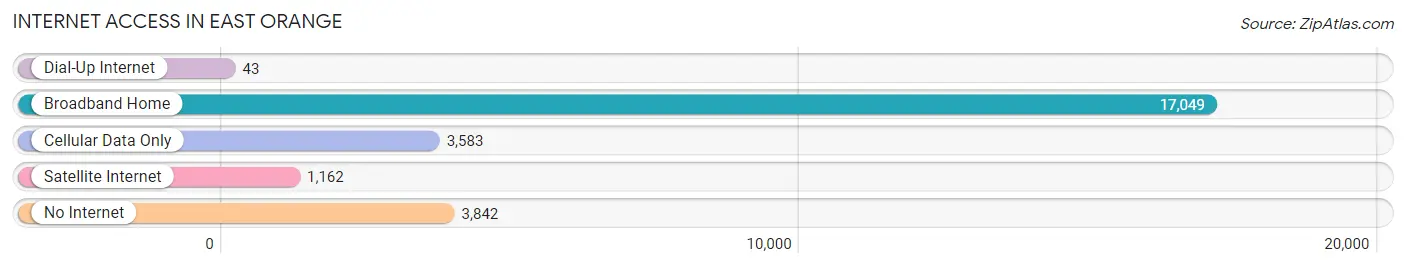
| Internet Type | # Households | % Households |
| Dial-Up Internet | 43 | 0.2% |
| Broadband Home | 17,049 | 64.7% |
| Cellular Data Only | 3,583 | 13.6% |
| Satellite Internet | 1,162 | 4.4% |
| No Internet | 3,842 | 14.6% |
| Total | 26,359 | 100.0% |
East Orange Summary
Orange, New Jersey is a city located in Essex County, New Jersey. It is part of the New York metropolitan area and is located approximately 8 miles west of Manhattan. The city is bordered by Newark to the east, South Orange to the south, and West Orange to the west. East Orange is the largest city in Essex County and is home to a population of approximately 64,270 people as of the 2010 census.
History
East Orange was originally part of the Township of Orange, which was created in 1666. The area was first settled by Dutch and English settlers in the late 1600s. In 1806, the Township of Orange was divided into two separate townships, East Orange and West Orange. East Orange was officially incorporated as a city in 1863.
During the late 19th century, East Orange experienced a period of rapid growth and development. The city was home to a number of large factories and businesses, including the Singer Sewing Machine Company, which was the largest employer in the city. The city also became a popular destination for immigrants from Europe, particularly from Ireland and Italy.
Geography
East Orange is located in the northern part of Essex County, New Jersey. The city is situated on the western bank of the Passaic River and is bordered by Newark to the east, South Orange to the south, and West Orange to the west. The city has a total area of 4.3 square miles, all of which is land.
The city is located in a humid subtropical climate zone, with hot, humid summers and cold, wet winters. The average annual temperature is around 54 degrees Fahrenheit, with an average high of around 75 degrees in the summer and an average low of around 35 degrees in the winter.
Economy
East Orange has a diverse economy that is largely based on the service industry. The city is home to a number of large employers, including the University of Medicine and Dentistry of New Jersey, the East Orange General Hospital, and the East Orange School District. The city is also home to a number of small businesses, including restaurants, retail stores, and professional services.
The city has a median household income of $41,945, which is slightly lower than the national average. The unemployment rate in East Orange is 8.2%, which is slightly higher than the national average.
Demographics
As of the 2010 census, East Orange had a population of 64,270 people. The racial makeup of the city was 54.3% African American, 28.2% White, 10.3% Hispanic or Latino, and 6.2% Asian. The median age of the population was 35.7 years.
The city has a large immigrant population, with approximately 25% of the population being foreign-born. The largest immigrant groups are from the Dominican Republic, Jamaica, and India.
East Orange is a diverse city with a variety of religious affiliations. The largest religious groups are Catholic (30.3%), Protestant (19.2%), and Muslim (7.2%).
Conclusion
East Orange is a city located in Essex County, New Jersey. It is part of the New York metropolitan area and is located approximately 8 miles west of Manhattan. The city has a diverse population and a diverse economy that is largely based on the service industry. East Orange has a median household income of $41,945 and an unemployment rate of 8.2%. The city is home to a number of large employers, including the University of Medicine and Dentistry of New Jersey, the East Orange General Hospital, and the East Orange School District. The city also has a large immigrant population, with approximately 25% of the population being foreign-born.
Common Questions
What is Per Capita Income in East Orange?
Per Capita income in East Orange is $30,503.
What is the Median Family Income in East Orange?
Median Family Income in East Orange is $73,510.
What is the Median Household income in East Orange?
Median Household Income in East Orange is $58,659.
What is Income or Wage Gap in East Orange?
Income or Wage Gap in East Orange is 4.1%.
Women in East Orange earn 95.9 cents for every dollar earned by a man.
What is Family Income Deficit in East Orange?
Family Income Deficit in East Orange is $12,046.
Families that are below poverty line in East Orange earn $12,046 less on average than the poverty threshold level.
What is Inequality or Gini Index in East Orange?
Inequality or Gini Index in East Orange is 0.46.
What is the Total Population of East Orange?
Total Population of East Orange is 68,879.
What is the Total Male Population of East Orange?
Total Male Population of East Orange is 31,325.
What is the Total Female Population of East Orange?
Total Female Population of East Orange is 37,554.
What is the Ratio of Males per 100 Females in East Orange?
There are 83.41 Males per 100 Females in East Orange.
What is the Ratio of Females per 100 Males in East Orange?
There are 119.89 Females per 100 Males in East Orange.
What is the Median Population Age in East Orange?
Median Population Age in East Orange is 35.1 Years.
What is the Average Family Size in East Orange
Average Family Size in East Orange is 3.6 People.
What is the Average Household Size in East Orange
Average Household Size in East Orange is 2.6 People.
How Large is the Labor Force in East Orange?
There are 36,056 People in the Labor Forcein in East Orange.
What is the Percentage of People in the Labor Force in East Orange?
66.9% of People are in the Labor Force in East Orange.
What is the Unemployment Rate in East Orange?
Unemployment Rate in East Orange is 11.6%.