Loch Arbour, NJ Map & Demographics
Loch Arbour Map
Loch Arbour Overview
$68,603
PER CAPITA INCOME
$162,083
AVG FAMILY INCOME
$122,500
AVG HOUSEHOLD INCOME
0.47
INEQUALITY / GINI INDEX
220
TOTAL POPULATION
90
MALE POPULATION
130
FEMALE POPULATION
69.23
MALES / 100 FEMALES
144.44
FEMALES / 100 MALES
51.0
MEDIAN AGE
3.3
AVG FAMILY SIZE
2.6
AVG HOUSEHOLD SIZE
107
LABOR FORCE [ PEOPLE ]
56.3%
PERCENT IN LABOR FORCE
8.4%
UNEMPLOYMENT RATE
Income in Loch Arbour
Income Overview in Loch Arbour
Per Capita Income in Loch Arbour is $68,603, while median incomes of families and households are $162,083 and $122,500 respectively.
| Characteristic | Number | Measure |
| Per Capita Income | 220 | $68,603 |
| Median Family Income | 59 | $162,083 |
| Mean Family Income | 59 | $202,642 |
| Median Household Income | 84 | $122,500 |
| Mean Household Income | 84 | $166,688 |
| Income Deficit | 59 | $0 |
| Wage / Income Gap (%) | 220 | 0.00% |
| Wage / Income Gap ($) | 220 | 100.00¢ per $1 |
| Gini / Inequality Index | 220 | 0.47 |
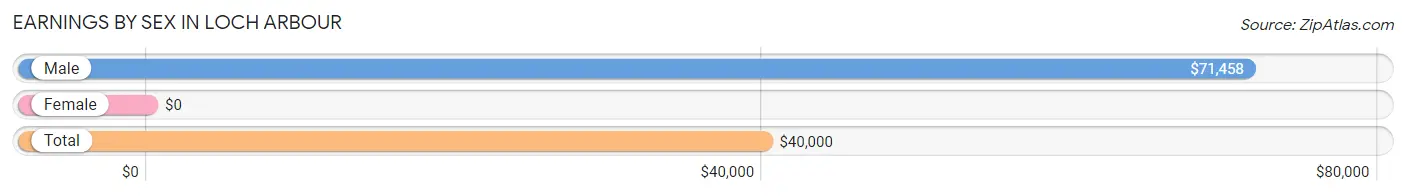
Earnings by Sex in Loch Arbour
| Sex | Number | Average Earnings |
| Male | 53 (48.2%) | $71,458 |
| Female | 57 (51.8%) | $0 |
| Total | 110 (100.0%) | $40,000 |
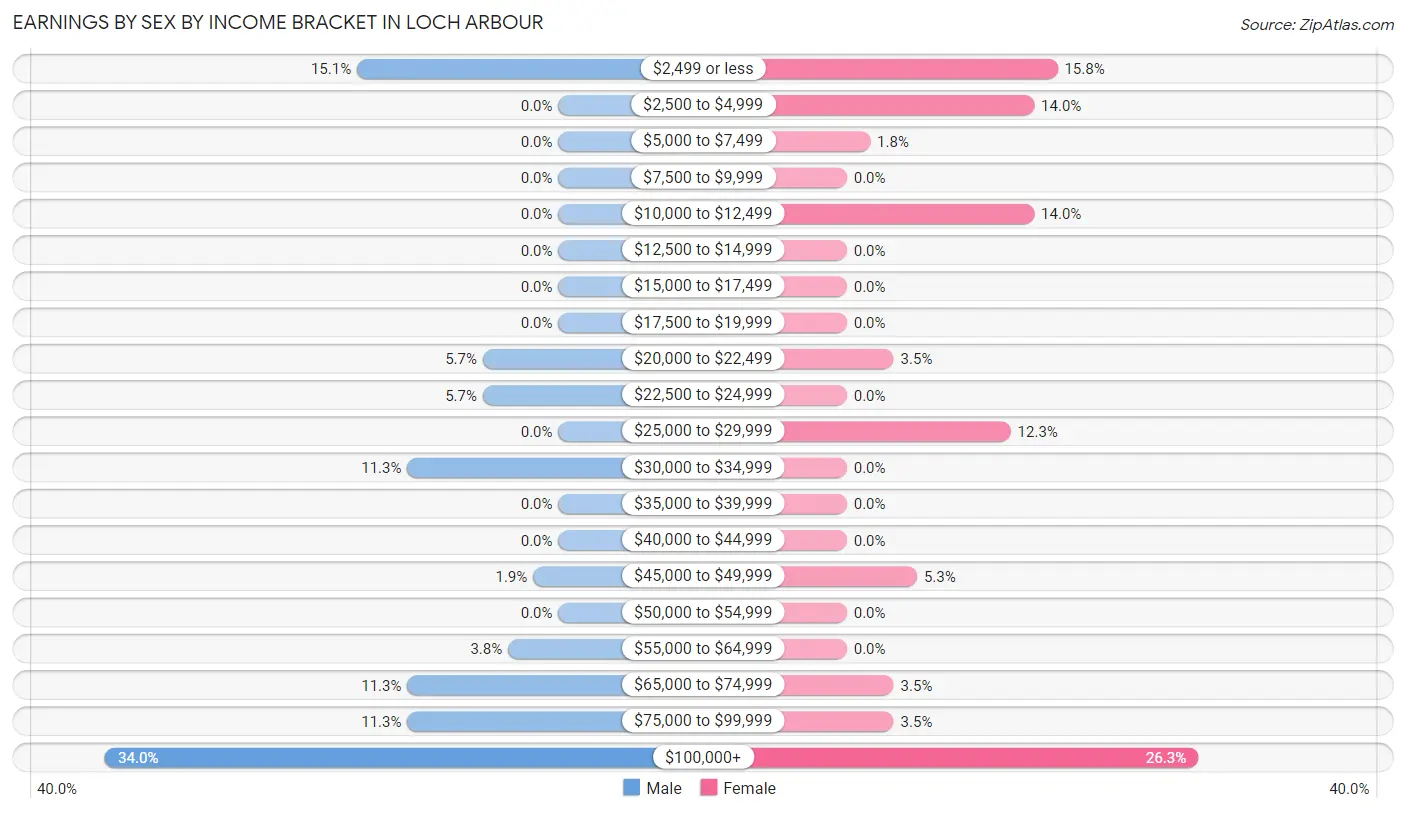
Earnings by Sex by Income Bracket in Loch Arbour
The most common earnings brackets in Loch Arbour are $100,000+ for men (18 | 34.0%) and $100,000+ for women (15 | 26.3%).
| Income | Male | Female |
| $2,499 or less | 8 (15.1%) | 9 (15.8%) |
| $2,500 to $4,999 | 0 (0.0%) | 8 (14.0%) |
| $5,000 to $7,499 | 0 (0.0%) | 1 (1.8%) |
| $7,500 to $9,999 | 0 (0.0%) | 0 (0.0%) |
| $10,000 to $12,499 | 0 (0.0%) | 8 (14.0%) |
| $12,500 to $14,999 | 0 (0.0%) | 0 (0.0%) |
| $15,000 to $17,499 | 0 (0.0%) | 0 (0.0%) |
| $17,500 to $19,999 | 0 (0.0%) | 0 (0.0%) |
| $20,000 to $22,499 | 3 (5.7%) | 2 (3.5%) |
| $22,500 to $24,999 | 3 (5.7%) | 0 (0.0%) |
| $25,000 to $29,999 | 0 (0.0%) | 7 (12.3%) |
| $30,000 to $34,999 | 6 (11.3%) | 0 (0.0%) |
| $35,000 to $39,999 | 0 (0.0%) | 0 (0.0%) |
| $40,000 to $44,999 | 0 (0.0%) | 0 (0.0%) |
| $45,000 to $49,999 | 1 (1.9%) | 3 (5.3%) |
| $50,000 to $54,999 | 0 (0.0%) | 0 (0.0%) |
| $55,000 to $64,999 | 2 (3.8%) | 0 (0.0%) |
| $65,000 to $74,999 | 6 (11.3%) | 2 (3.5%) |
| $75,000 to $99,999 | 6 (11.3%) | 2 (3.5%) |
| $100,000+ | 18 (34.0%) | 15 (26.3%) |
| Total | 53 (100.0%) | 57 (100.0%) |
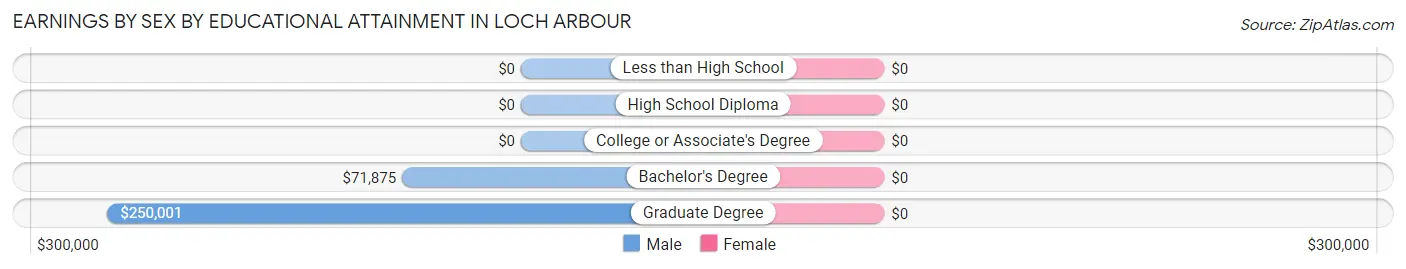
Earnings by Sex by Educational Attainment in Loch Arbour
| Educational Attainment | Male Income | Female Income |
| Less than High School | - | - |
| High School Diploma | - | - |
| College or Associate's Degree | - | - |
| Bachelor's Degree | $71,875 | $0 |
| Graduate Degree | $250,001 | $0 |
| Total | $83,750 | $82,500 |
Family Income in Loch Arbour
Family Income Brackets in Loch Arbour
According to the Loch Arbour family income data, there are 18 families falling into the $200,000+ income range, which is the most common income bracket and makes up 30.5% of all families.
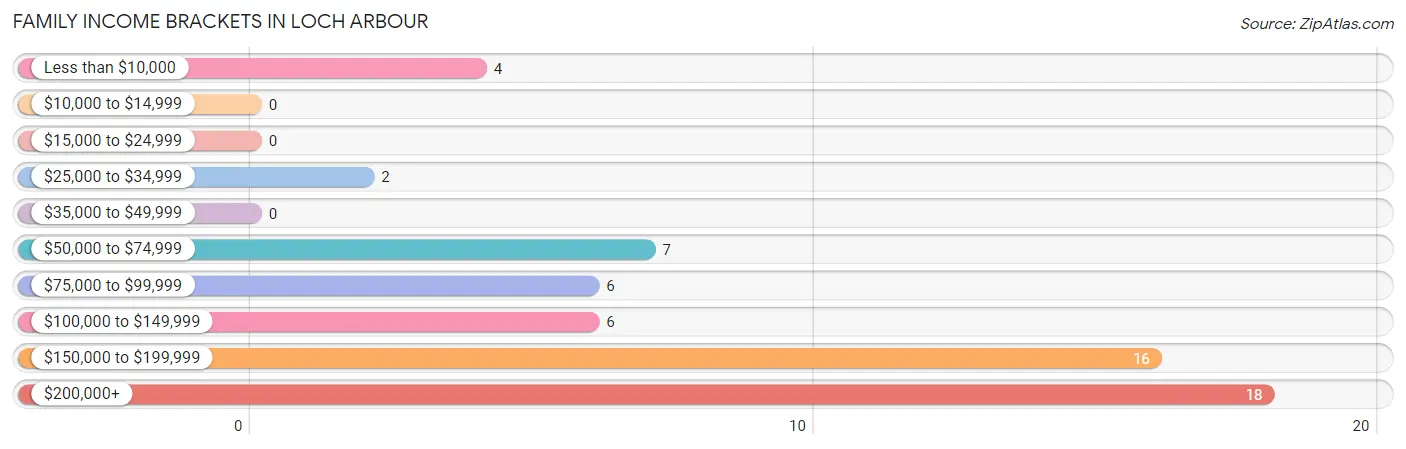
| Income Bracket | # Families | % Families |
| Less than $10,000 | 4 | 6.8% |
| $10,000 to $14,999 | 0 | 0.0% |
| $15,000 to $24,999 | 0 | 0.0% |
| $25,000 to $34,999 | 2 | 3.4% |
| $35,000 to $49,999 | 0 | 0.0% |
| $50,000 to $74,999 | 7 | 11.9% |
| $75,000 to $99,999 | 6 | 10.2% |
| $100,000 to $149,999 | 6 | 10.2% |
| $150,000 to $199,999 | 16 | 27.1% |
| $200,000+ | 18 | 30.5% |
Family Income by Famaliy Size in Loch Arbour
4-person families (8 | 13.6%) account for the highest median family income in Loch Arbour with $250,001 per family, while 4-person families (8 | 13.6%) have the highest median income of $62,500 per family member.
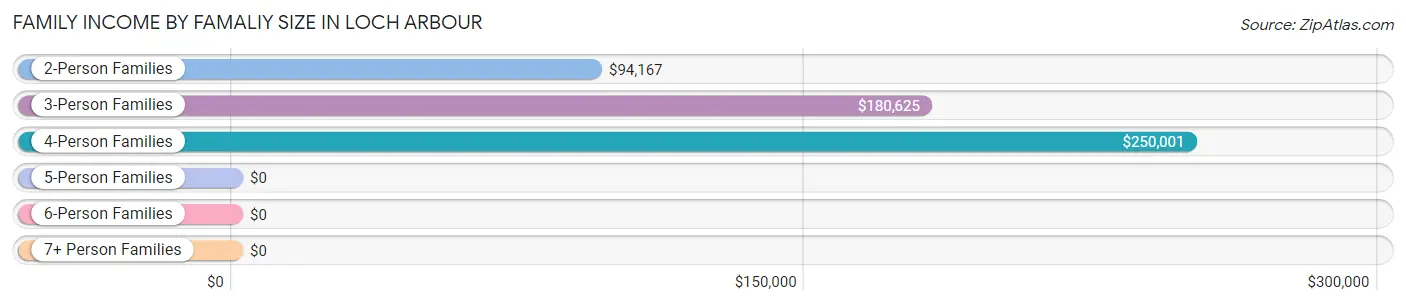
| Income Bracket | # Families | Median Income |
| 2-Person Families | 22 (37.3%) | $94,167 |
| 3-Person Families | 21 (35.6%) | $180,625 |
| 4-Person Families | 8 (13.6%) | $250,001 |
| 5-Person Families | 5 (8.5%) | $0 |
| 6-Person Families | 3 (5.1%) | $0 |
| 7+ Person Families | 0 (0.0%) | $0 |
| Total | 59 (100.0%) | $162,083 |
Family Income by Number of Earners in Loch Arbour
The median family income in Loch Arbour is $162,083, with families comprising 3+ earners (9) having the highest median family income of $250,001, while families with no earners (11) have the lowest median family income of $81,875, accounting for 15.2% and 18.6% of families, respectively.
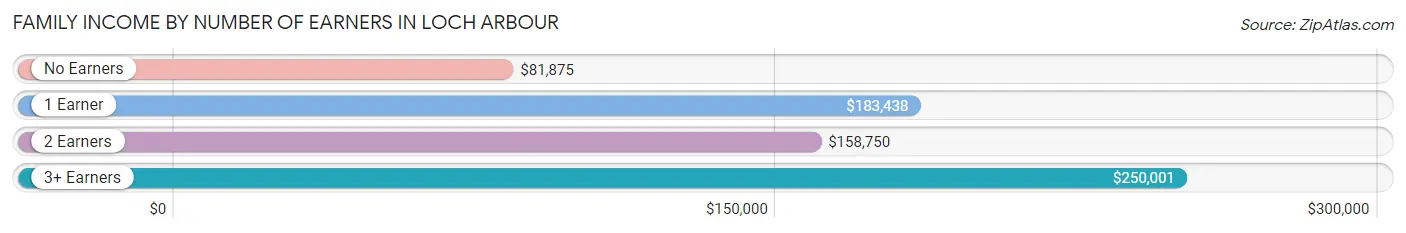
| Number of Earners | # Families | Median Income |
| No Earners | 11 (18.6%) | $81,875 |
| 1 Earner | 19 (32.2%) | $183,438 |
| 2 Earners | 20 (33.9%) | $158,750 |
| 3+ Earners | 9 (15.2%) | $250,001 |
| Total | 59 (100.0%) | $162,083 |
Household Income in Loch Arbour
Household Income Brackets in Loch Arbour
With 20 households falling in the category, the $200,000+ income range is the most frequent in Loch Arbour, accounting for 23.8% of all households.
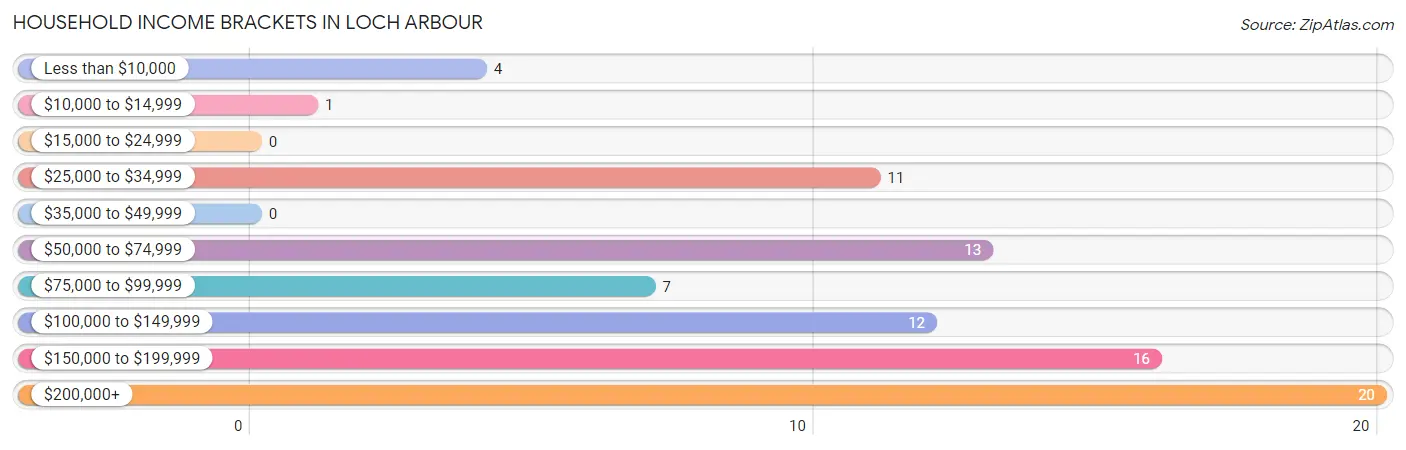
| Income Bracket | # Households | % Households |
| Less than $10,000 | 4 | 4.8% |
| $10,000 to $14,999 | 1 | 1.2% |
| $15,000 to $24,999 | 0 | 0.0% |
| $25,000 to $34,999 | 11 | 13.1% |
| $35,000 to $49,999 | 0 | 0.0% |
| $50,000 to $74,999 | 13 | 15.5% |
| $75,000 to $99,999 | 7 | 8.3% |
| $100,000 to $149,999 | 12 | 14.3% |
| $150,000 to $199,999 | 16 | 19.0% |
| $200,000+ | 20 | 23.8% |
Household Income by Householder Age in Loch Arbour
The median household income in Loch Arbour is $122,500, with the highest median household income of $81,875 found in the 65+ years age bracket for the primary householder. A total of 37 households (44.1%) fall into this category. Meanwhile, the 15 to 24 years age bracket for the primary householder has the lowest median household income of $0, with 2 households (2.4%) in this group.
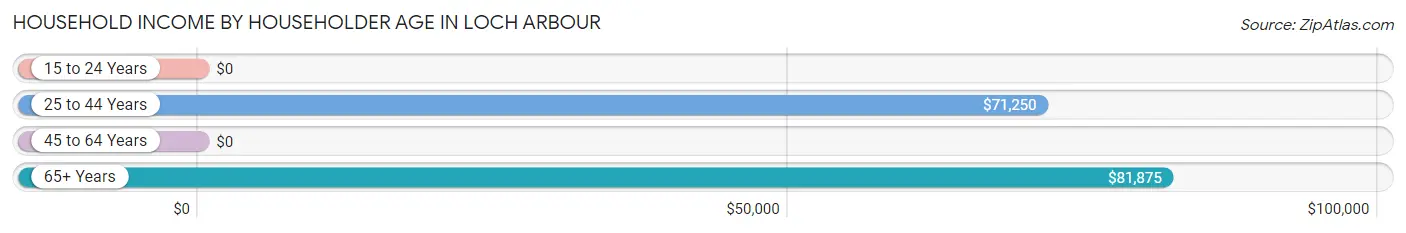
| Income Bracket | # Households | Median Income |
| 15 to 24 Years | 2 (2.4%) | $0 |
| 25 to 44 Years | 16 (19.1%) | $71,250 |
| 45 to 64 Years | 29 (34.5%) | $0 |
| 65+ Years | 37 (44.1%) | $81,875 |
| Total | 84 (100.0%) | $122,500 |
Poverty in Loch Arbour
Income Below Poverty by Sex and Age in Loch Arbour
With 8.9% poverty level for males and 10.0% for females among the residents of Loch Arbour, under 5 year old males and under 5 year old females are the most vulnerable to poverty, with 4 males (66.7%) and 4 females (80.0%) in their respective age groups living below the poverty level.
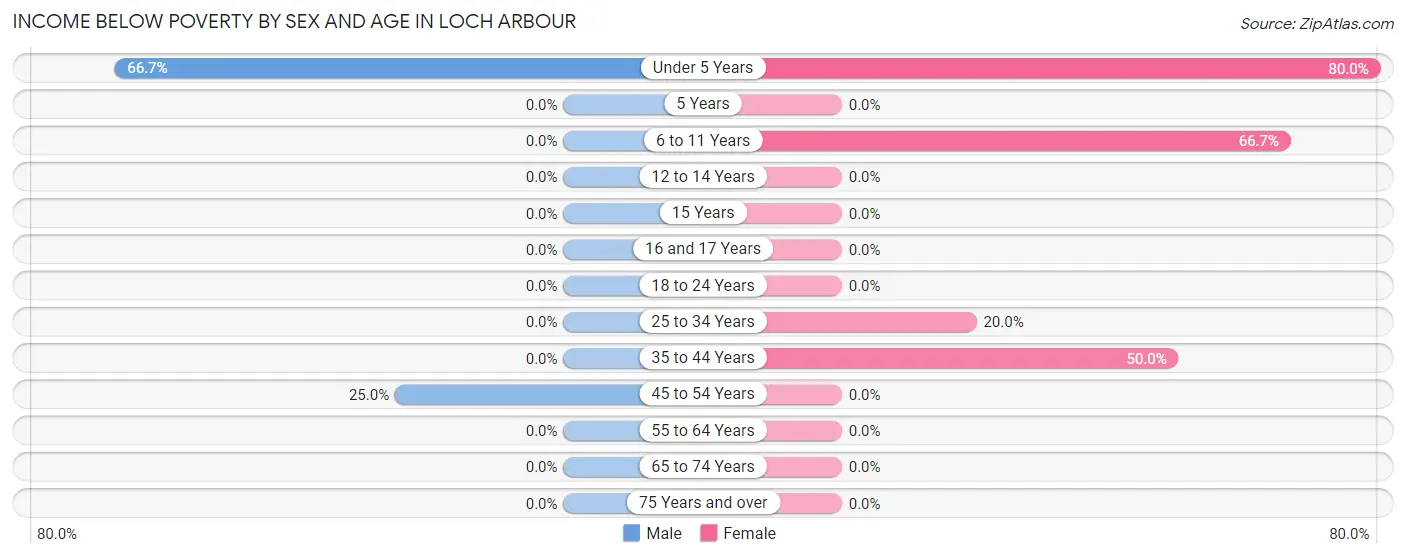
| Age Bracket | Male | Female |
| Under 5 Years | 4 (66.7%) | 4 (80.0%) |
| 5 Years | 0 (0.0%) | 0 (0.0%) |
| 6 to 11 Years | 0 (0.0%) | 4 (66.7%) |
| 12 to 14 Years | 0 (0.0%) | 0 (0.0%) |
| 15 Years | 0 (0.0%) | 0 (0.0%) |
| 16 and 17 Years | 0 (0.0%) | 0 (0.0%) |
| 18 to 24 Years | 0 (0.0%) | 0 (0.0%) |
| 25 to 34 Years | 0 (0.0%) | 1 (20.0%) |
| 35 to 44 Years | 0 (0.0%) | 4 (50.0%) |
| 45 to 54 Years | 4 (25.0%) | 0 (0.0%) |
| 55 to 64 Years | 0 (0.0%) | 0 (0.0%) |
| 65 to 74 Years | 0 (0.0%) | 0 (0.0%) |
| 75 Years and over | 0 (0.0%) | 0 (0.0%) |
| Total | 8 (8.9%) | 13 (10.0%) |
Income Above Poverty by Sex and Age in Loch Arbour
According to the poverty statistics in Loch Arbour, males aged 6 to 11 years and females aged 12 to 14 years are the age groups that are most secure financially, with 100.0% of males and 100.0% of females in these age groups living above the poverty line.
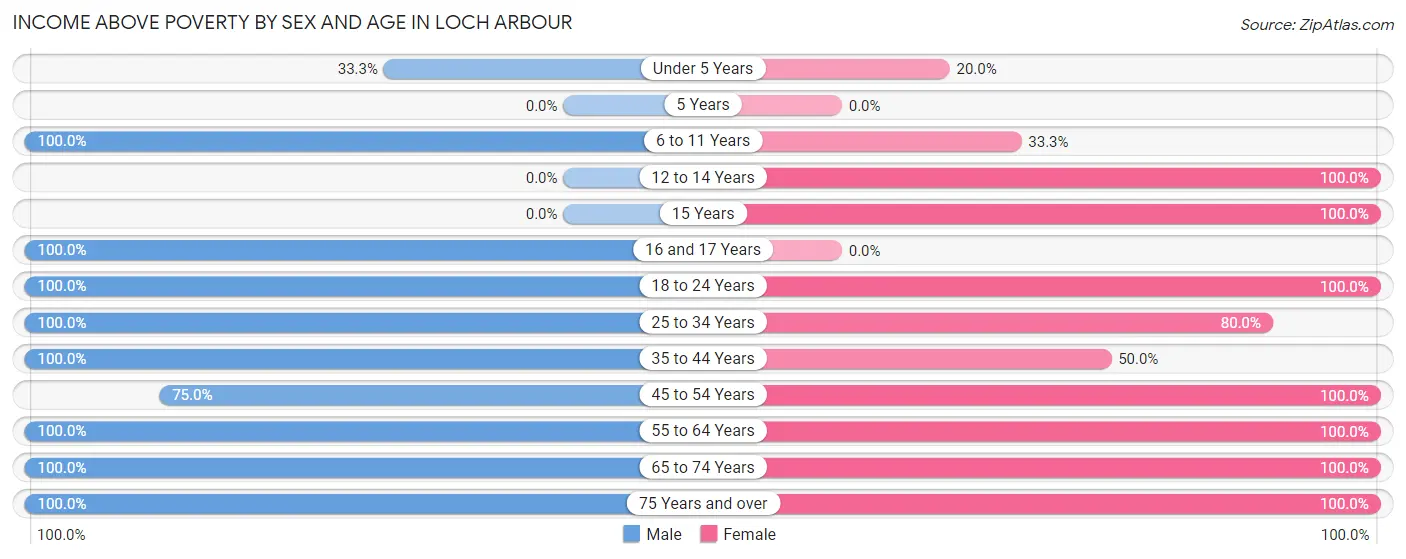
| Age Bracket | Male | Female |
| Under 5 Years | 2 (33.3%) | 1 (20.0%) |
| 5 Years | 0 (0.0%) | 0 (0.0%) |
| 6 to 11 Years | 6 (100.0%) | 2 (33.3%) |
| 12 to 14 Years | 0 (0.0%) | 5 (100.0%) |
| 15 Years | 0 (0.0%) | 2 (100.0%) |
| 16 and 17 Years | 3 (100.0%) | 0 (0.0%) |
| 18 to 24 Years | 7 (100.0%) | 30 (100.0%) |
| 25 to 34 Years | 8 (100.0%) | 4 (80.0%) |
| 35 to 44 Years | 4 (100.0%) | 4 (50.0%) |
| 45 to 54 Years | 12 (75.0%) | 11 (100.0%) |
| 55 to 64 Years | 18 (100.0%) | 26 (100.0%) |
| 65 to 74 Years | 4 (100.0%) | 20 (100.0%) |
| 75 Years and over | 18 (100.0%) | 12 (100.0%) |
| Total | 82 (91.1%) | 117 (90.0%) |
Income Below Poverty Among Married-Couple Families in Loch Arbour
The poverty statistics for married-couple families in Loch Arbour show that 7.3% or 4 of the total 55 families live below the poverty line. Families with 3 or 4 children have the highest poverty rate of 80.0%, comprising of 4 families. On the other hand, families with no children have the lowest poverty rate of 0.0%, which includes 0 families.
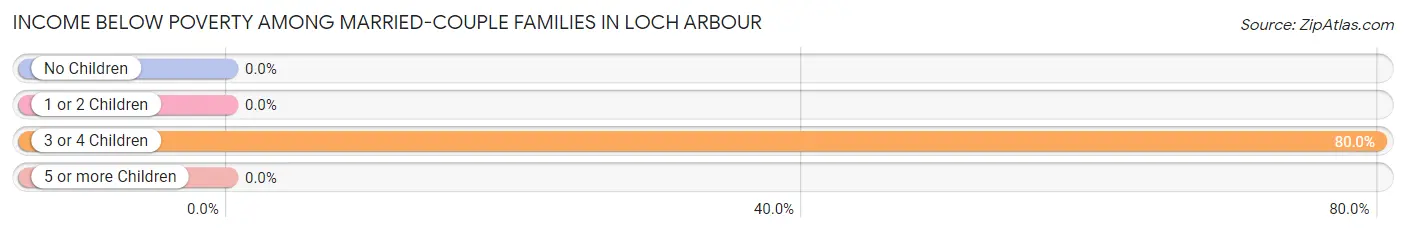
| Children | Above Poverty | Below Poverty |
| No Children | 36 (100.0%) | 0 (0.0%) |
| 1 or 2 Children | 14 (100.0%) | 0 (0.0%) |
| 3 or 4 Children | 1 (20.0%) | 4 (80.0%) |
| 5 or more Children | 0 (0.0%) | 0 (0.0%) |
| Total | 51 (92.7%) | 4 (7.3%) |
Income Below Poverty Among Single-Parent Households in Loch Arbour
| Children | Single Father | Single Mother |
| No Children | 0 (0.0%) | 0 (0.0%) |
| 1 or 2 Children | 0 (0.0%) | 0 (0.0%) |
| 3 or 4 Children | 0 (0.0%) | 0 (0.0%) |
| 5 or more Children | 0 (0.0%) | 0 (0.0%) |
| Total | 0 (0.0%) | 0 (0.0%) |
Income Below Poverty Among Married-Couple vs Single-Parent Households in Loch Arbour
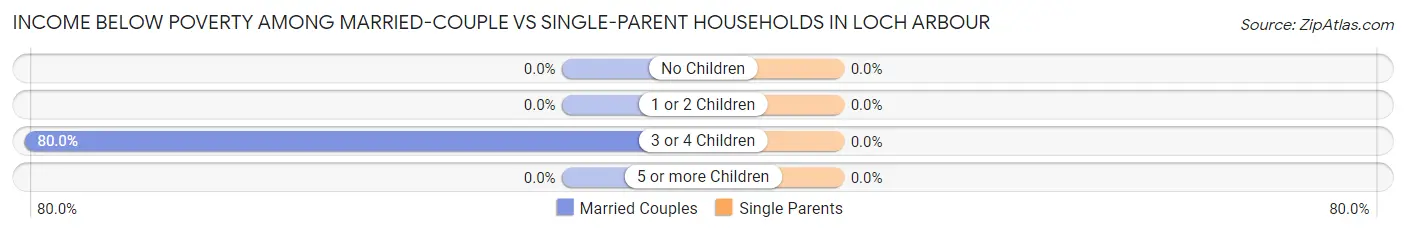
| Children | Married-Couple Families | Single-Parent Households |
| No Children | 0 (0.0%) | 0 (0.0%) |
| 1 or 2 Children | 0 (0.0%) | 0 (0.0%) |
| 3 or 4 Children | 4 (80.0%) | 0 (0.0%) |
| 5 or more Children | 0 (0.0%) | 0 (0.0%) |
| Total | 4 (7.3%) | 0 (0.0%) |
Race in Loch Arbour
The most populous races in Loch Arbour are White / Caucasian (187 | 85.0%), Hispanic or Latino (26 | 11.8%), and Two or more Races (25 | 11.4%).
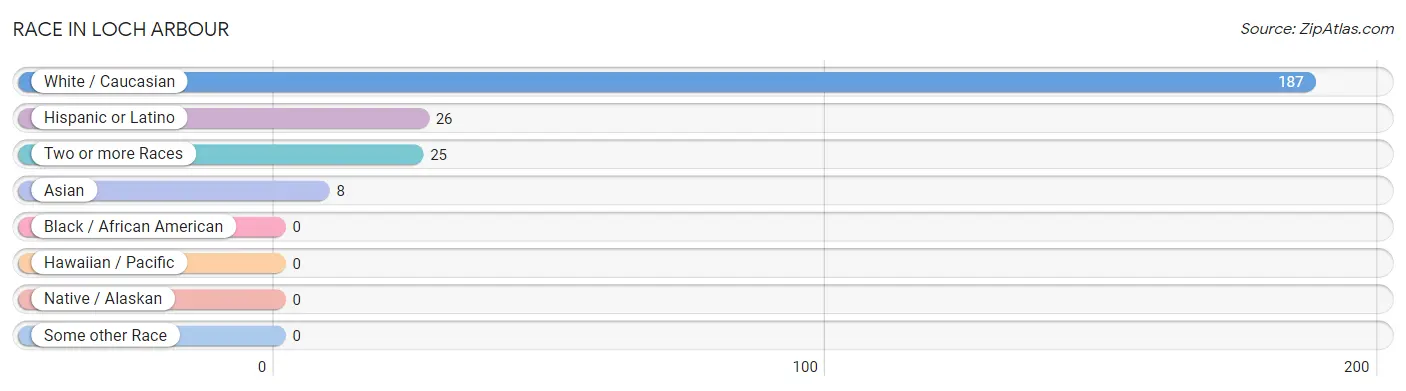
| Race | # Population | % Population |
| Asian | 8 | 3.6% |
| Black / African American | 0 | 0.0% |
| Hawaiian / Pacific | 0 | 0.0% |
| Hispanic or Latino | 26 | 11.8% |
| Native / Alaskan | 0 | 0.0% |
| White / Caucasian | 187 | 85.0% |
| Two or more Races | 25 | 11.4% |
| Some other Race | 0 | 0.0% |
| Total | 220 | 100.0% |
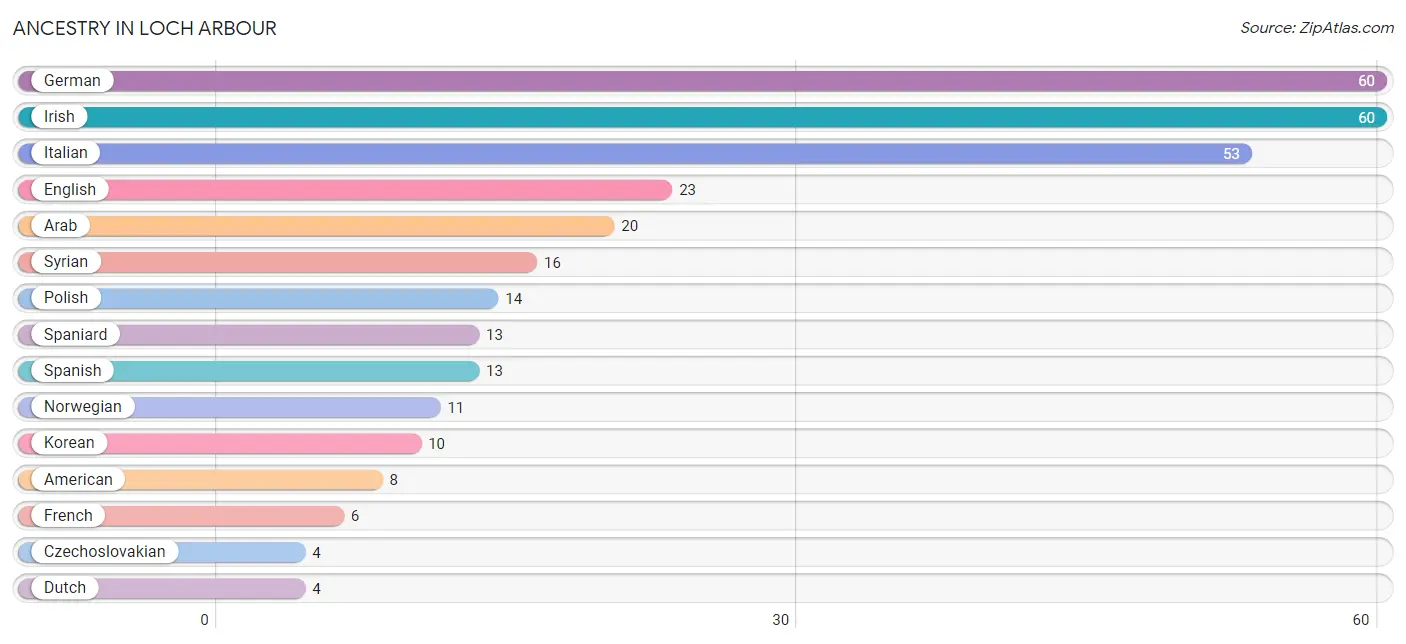
Ancestry in Loch Arbour
The most populous ancestries reported in Loch Arbour are German (60 | 27.3%), Irish (60 | 27.3%), Italian (53 | 24.1%), English (23 | 10.4%), and Arab (20 | 9.1%), together accounting for 98.2% of all Loch Arbour residents.
| Ancestry | # Population | % Population |
| American | 8 | 3.6% |
| Arab | 20 | 9.1% |
| Burmese | 1 | 0.4% |
| Canadian | 3 | 1.4% |
| Czech | 1 | 0.4% |
| Czechoslovakian | 4 | 1.8% |
| Danish | 2 | 0.9% |
| Dutch | 4 | 1.8% |
| Eastern European | 1 | 0.4% |
| English | 23 | 10.4% |
| Finnish | 1 | 0.4% |
| French | 6 | 2.7% |
| German | 60 | 27.3% |
| Hungarian | 2 | 0.9% |
| Indian (Asian) | 4 | 1.8% |
| Irish | 60 | 27.3% |
| Italian | 53 | 24.1% |
| Korean | 10 | 4.5% |
| Norwegian | 11 | 5.0% |
| Pakistani | 2 | 0.9% |
| Polish | 14 | 6.4% |
| Russian | 3 | 1.4% |
| Scottish | 3 | 1.4% |
| Slovene | 1 | 0.4% |
| Spaniard | 13 | 5.9% |
| Spanish | 13 | 5.9% |
| Swedish | 4 | 1.8% |
| Syrian | 16 | 7.3% |
| Ukrainian | 2 | 0.9% | View All 29 Rows |
Immigrants in Loch Arbour
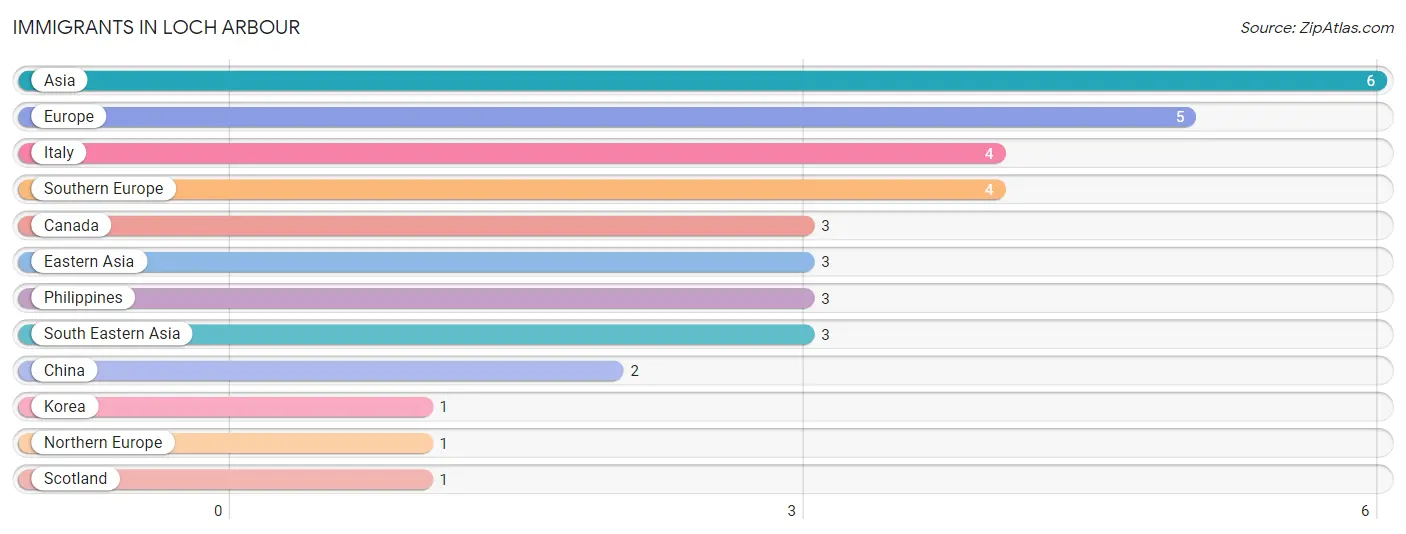
The most numerous immigrant groups reported in Loch Arbour came from Asia (6 | 2.7%), Europe (5 | 2.3%), Italy (4 | 1.8%), Southern Europe (4 | 1.8%), and Canada (3 | 1.4%), together accounting for 10.0% of all Loch Arbour residents.
| Immigration Origin | # Population | % Population |
| Asia | 6 | 2.7% |
| Canada | 3 | 1.4% |
| China | 2 | 0.9% |
| Eastern Asia | 3 | 1.4% |
| Europe | 5 | 2.3% |
| Italy | 4 | 1.8% |
| Korea | 1 | 0.4% |
| Northern Europe | 1 | 0.4% |
| Philippines | 3 | 1.4% |
| Scotland | 1 | 0.4% |
| South Eastern Asia | 3 | 1.4% |
| Southern Europe | 4 | 1.8% | View All 12 Rows |
Sex and Age in Loch Arbour
Sex and Age in Loch Arbour
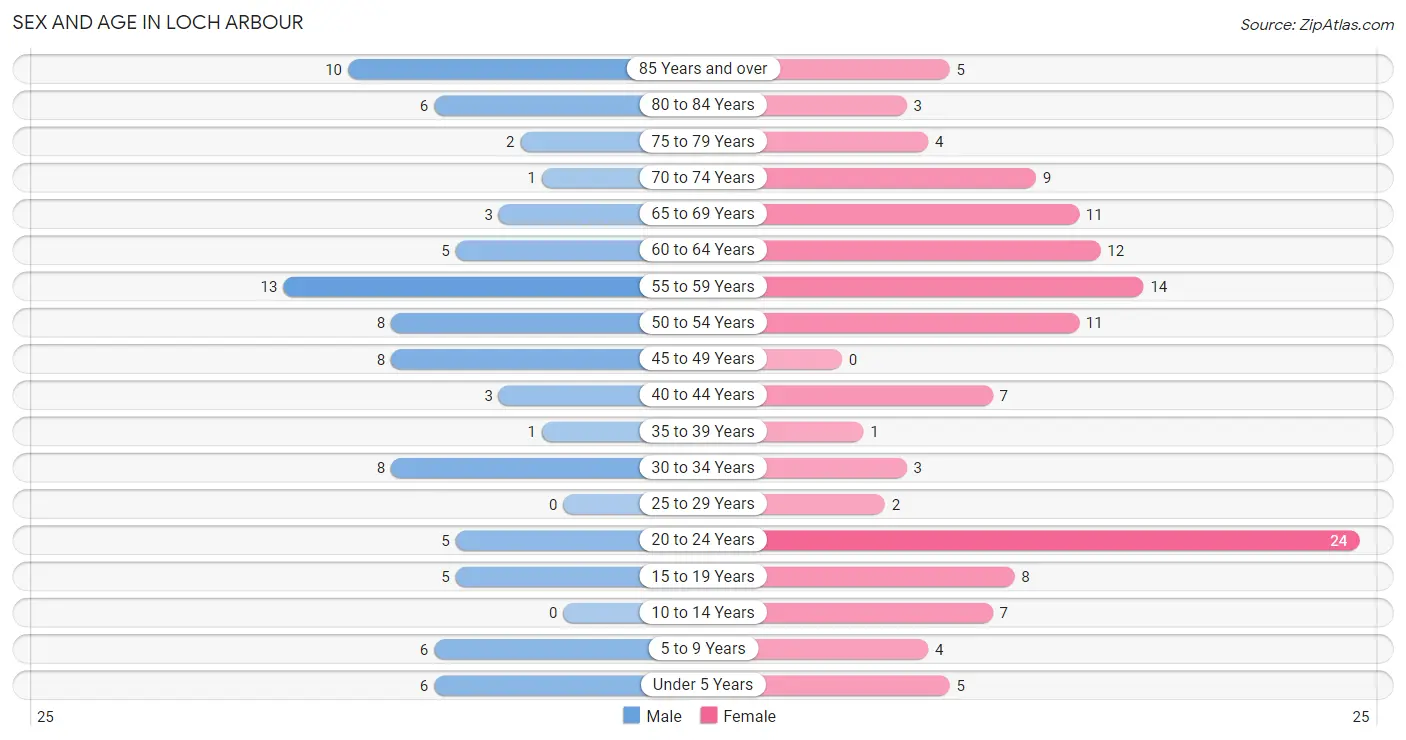
The most populous age groups in Loch Arbour are 55 to 59 Years (13 | 14.4%) for men and 20 to 24 Years (24 | 18.5%) for women.
| Age Bracket | Male | Female |
| Under 5 Years | 6 (6.7%) | 5 (3.8%) |
| 5 to 9 Years | 6 (6.7%) | 4 (3.1%) |
| 10 to 14 Years | 0 (0.0%) | 7 (5.4%) |
| 15 to 19 Years | 5 (5.6%) | 8 (6.1%) |
| 20 to 24 Years | 5 (5.6%) | 24 (18.5%) |
| 25 to 29 Years | 0 (0.0%) | 2 (1.5%) |
| 30 to 34 Years | 8 (8.9%) | 3 (2.3%) |
| 35 to 39 Years | 1 (1.1%) | 1 (0.8%) |
| 40 to 44 Years | 3 (3.3%) | 7 (5.4%) |
| 45 to 49 Years | 8 (8.9%) | 0 (0.0%) |
| 50 to 54 Years | 8 (8.9%) | 11 (8.5%) |
| 55 to 59 Years | 13 (14.4%) | 14 (10.8%) |
| 60 to 64 Years | 5 (5.6%) | 12 (9.2%) |
| 65 to 69 Years | 3 (3.3%) | 11 (8.5%) |
| 70 to 74 Years | 1 (1.1%) | 9 (6.9%) |
| 75 to 79 Years | 2 (2.2%) | 4 (3.1%) |
| 80 to 84 Years | 6 (6.7%) | 3 (2.3%) |
| 85 Years and over | 10 (11.1%) | 5 (3.8%) |
| Total | 90 (100.0%) | 130 (100.0%) |
Families and Households in Loch Arbour
Median Family Size in Loch Arbour
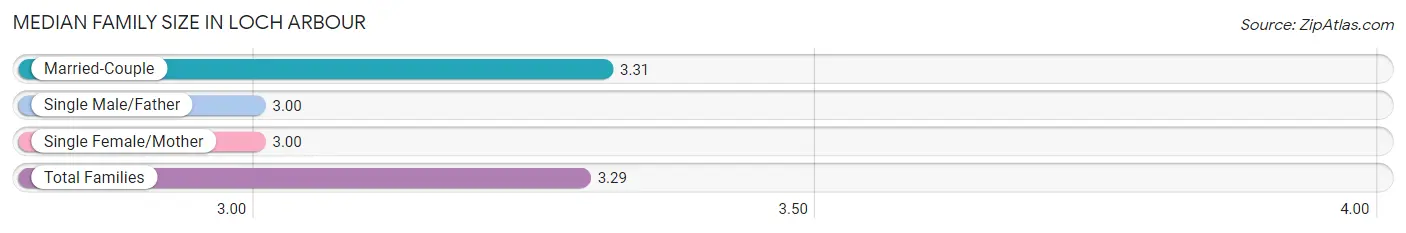
The median family size in Loch Arbour is 3.29 persons per family, with married-couple families (55 | 93.2%) accounting for the largest median family size of 3.31 persons per family. On the other hand, single male/father families (1 | 1.7%) represent the smallest median family size with 3.00 persons per family.
| Family Type | # Families | Family Size |
| Married-Couple | 55 (93.2%) | 3.31 |
| Single Male/Father | 1 (1.7%) | 3.00 |
| Single Female/Mother | 3 (5.1%) | 3.00 |
| Total Families | 59 (100.0%) | 3.29 |
Median Household Size in Loch Arbour
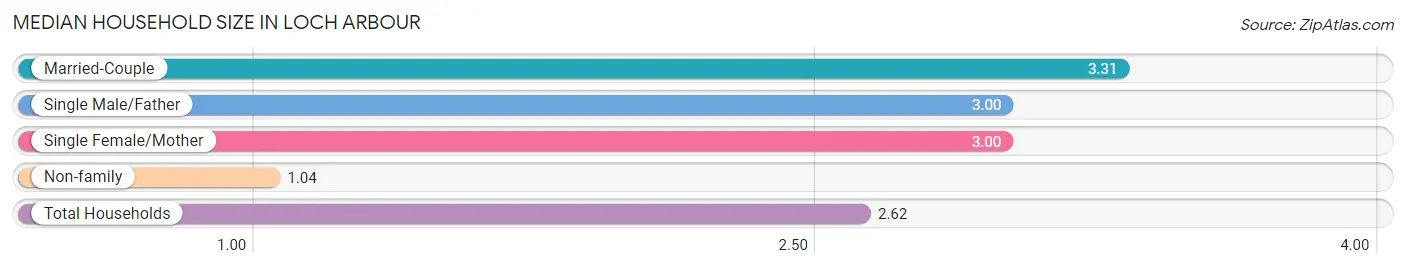
The median household size in Loch Arbour is 2.62 persons per household, with married-couple households (55 | 65.5%) accounting for the largest median household size of 3.31 persons per household. non-family households (25 | 29.8%) represent the smallest median household size with 1.04 persons per household.
| Household Type | # Households | Household Size |
| Married-Couple | 55 (65.5%) | 3.31 |
| Single Male/Father | 1 (1.2%) | 3.00 |
| Single Female/Mother | 3 (3.6%) | 3.00 |
| Non-family | 25 (29.8%) | 1.04 |
| Total Households | 84 (100.0%) | 2.62 |
Household Size by Marriage Status in Loch Arbour
Out of a total of 84 households in Loch Arbour, 59 (70.2%) are family households, while 25 (29.8%) are nonfamily households. The most numerous type of family households are 2-person households, comprising 22, and the most common type of nonfamily households are 1-person households, comprising 24.
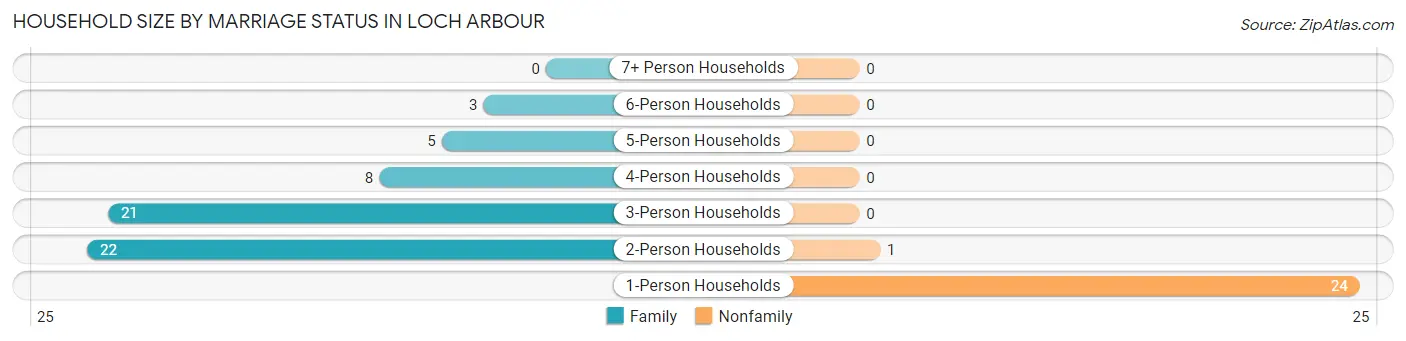
| Household Size | Family Households | Nonfamily Households |
| 1-Person Households | - | 24 (28.6%) |
| 2-Person Households | 22 (26.2%) | 1 (1.2%) |
| 3-Person Households | 21 (25.0%) | 0 (0.0%) |
| 4-Person Households | 8 (9.5%) | 0 (0.0%) |
| 5-Person Households | 5 (5.9%) | 0 (0.0%) |
| 6-Person Households | 3 (3.6%) | 0 (0.0%) |
| 7+ Person Households | 0 (0.0%) | 0 (0.0%) |
| Total | 59 (70.2%) | 25 (29.8%) |
Female Fertility in Loch Arbour
Fertility by Age in Loch Arbour
Average fertility rate in Loch Arbour is 20.0 births per 1,000 women. Women in the age bracket of 35 to 50 years have the highest fertility rate with 71.0 births per 1,000 women. Women in the age bracket of 35 to 50 years acount for 100.0% of all women with births.
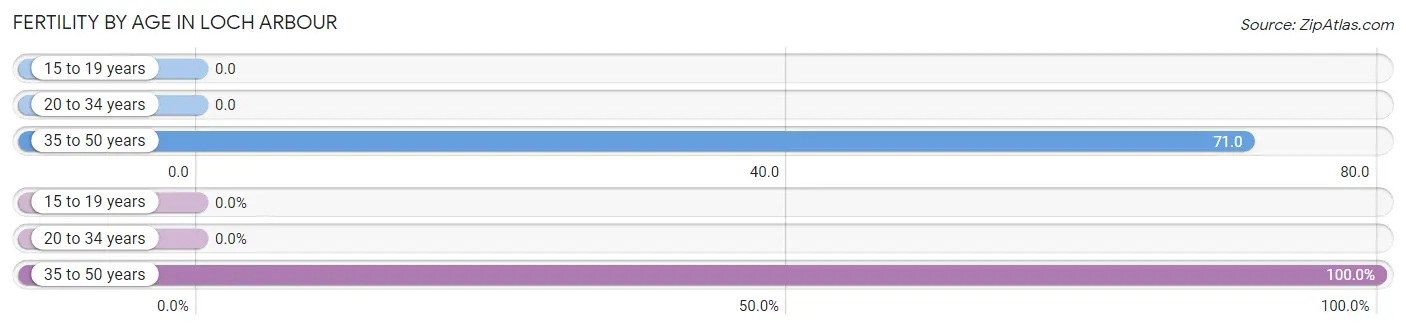
| Age Bracket | Women with Births | Births / 1,000 Women |
| 15 to 19 years | 0 (0.0%) | 0.0 |
| 20 to 34 years | 0 (0.0%) | 0.0 |
| 35 to 50 years | 1 (100.0%) | 71.0 |
| Total | 1 (100.0%) | 20.0 |
Fertility by Age by Marriage Status in Loch Arbour
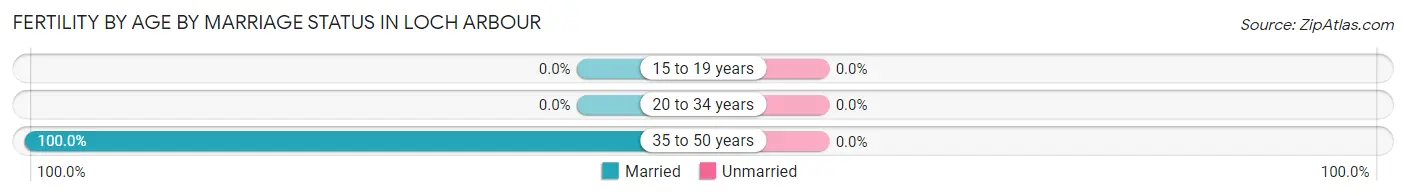
| Age Bracket | Married | Unmarried |
| 15 to 19 years | 0 (0.0%) | 0 (0.0%) |
| 20 to 34 years | 0 (0.0%) | 0 (0.0%) |
| 35 to 50 years | 1 (100.0%) | 0 (0.0%) |
| Total | 1 (100.0%) | 0 (0.0%) |
Fertility by Education in Loch Arbour
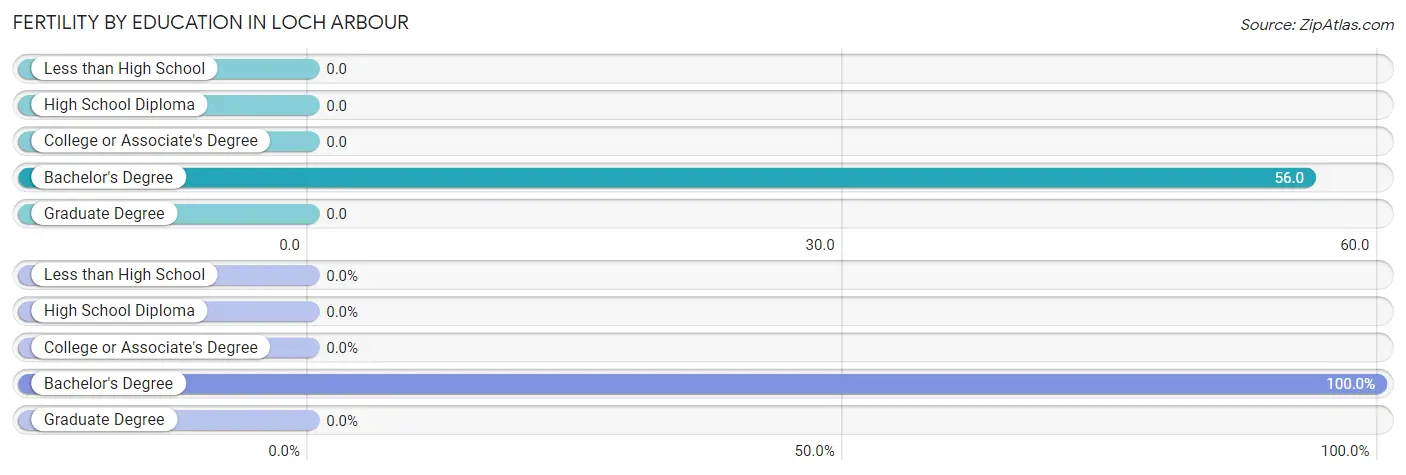
| Educational Attainment | Women with Births | Births / 1,000 Women |
| Less than High School | 0 (0.0%) | 0.0 |
| High School Diploma | 0 (0.0%) | 0.0 |
| College or Associate's Degree | 0 (0.0%) | 0.0 |
| Bachelor's Degree | 1 (100.0%) | 56.0 |
| Graduate Degree | 0 (0.0%) | 0.0 |
| Total | 1 (100.0%) | 20.0 |
Fertility by Education by Marriage Status in Loch Arbour
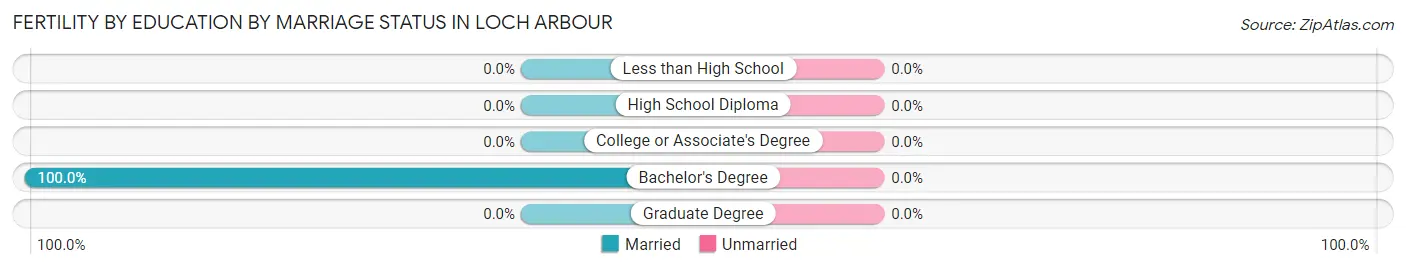
| Educational Attainment | Married | Unmarried |
| Less than High School | 0 (0.0%) | 0 (0.0%) |
| High School Diploma | 0 (0.0%) | 0 (0.0%) |
| College or Associate's Degree | 0 (0.0%) | 0 (0.0%) |
| Bachelor's Degree | 1 (100.0%) | 0 (0.0%) |
| Graduate Degree | 0 (0.0%) | 0 (0.0%) |
| Total | 1 (100.0%) | 0 (0.0%) |
Employment Characteristics in Loch Arbour
Employment by Class of Employer in Loch Arbour
Among the 95 employed individuals in Loch Arbour, private company employees (47 | 49.5%), self-employed (incorporated) (14 | 14.7%), and not-for-profit organizations (13 | 13.7%) make up the most common classes of employment.
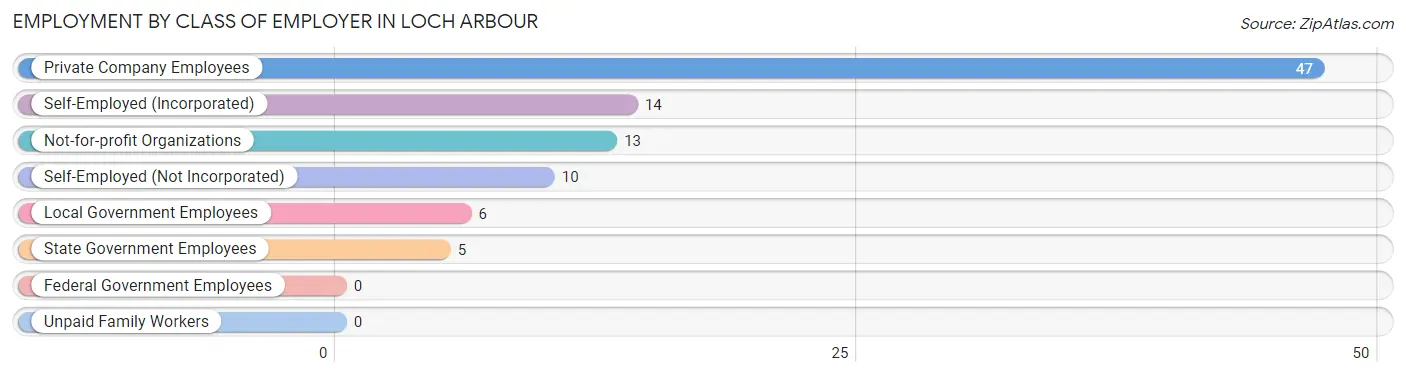
| Employer Class | # Employees | % Employees |
| Private Company Employees | 47 | 49.5% |
| Self-Employed (Incorporated) | 14 | 14.7% |
| Self-Employed (Not Incorporated) | 10 | 10.5% |
| Not-for-profit Organizations | 13 | 13.7% |
| Local Government Employees | 6 | 6.3% |
| State Government Employees | 5 | 5.3% |
| Federal Government Employees | 0 | 0.0% |
| Unpaid Family Workers | 0 | 0.0% |
| Total | 95 | 100.0% |
Employment Status by Age in Loch Arbour
According to the labor force statistics for Loch Arbour, out of the total population over 16 years of age (190), 56.3% or 107 individuals are in the labor force, with 8.4% or 9 of them unemployed. The age group with the highest labor force participation rate is 25 to 29 years, with 100.0% or 2 individuals in the labor force. Within the labor force, the 20 to 24 years age range has the highest percentage of unemployed individuals, with 33.3% or 9 of them being unemployed.
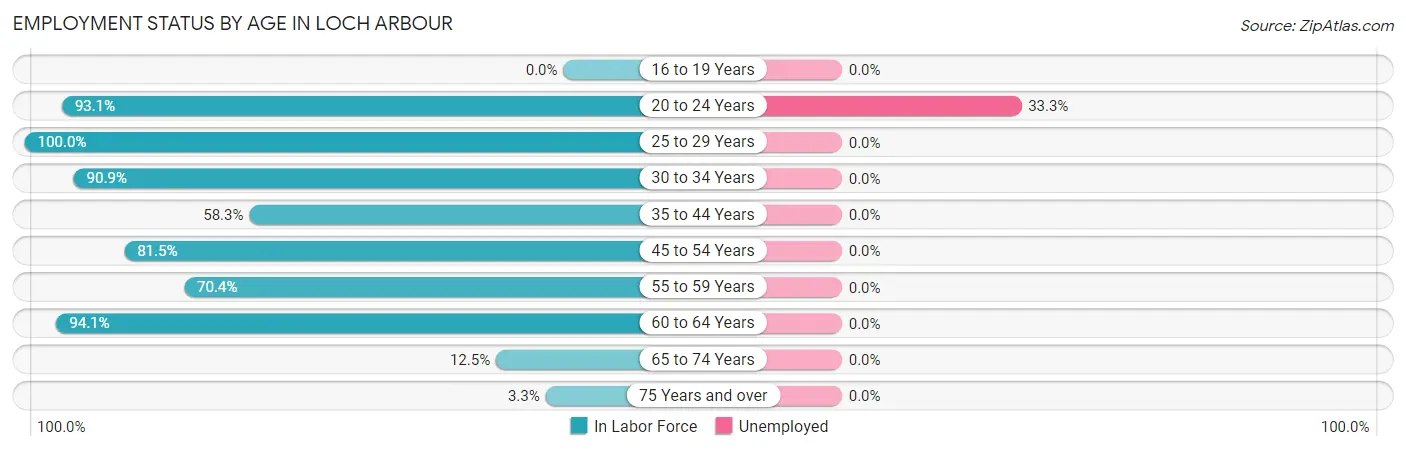
| Age Bracket | In Labor Force | Unemployed |
| 16 to 19 Years | 0 (0.0%) | 0 (0.0%) |
| 20 to 24 Years | 27 (93.1%) | 9 (33.3%) |
| 25 to 29 Years | 2 (100.0%) | 0 (0.0%) |
| 30 to 34 Years | 10 (90.9%) | 0 (0.0%) |
| 35 to 44 Years | 7 (58.3%) | 0 (0.0%) |
| 45 to 54 Years | 22 (81.5%) | 0 (0.0%) |
| 55 to 59 Years | 19 (70.4%) | 0 (0.0%) |
| 60 to 64 Years | 16 (94.1%) | 0 (0.0%) |
| 65 to 74 Years | 3 (12.5%) | 0 (0.0%) |
| 75 Years and over | 1 (3.3%) | 0 (0.0%) |
| Total | 107 (56.3%) | 9 (8.4%) |
Employment Status by Educational Attainment in Loch Arbour
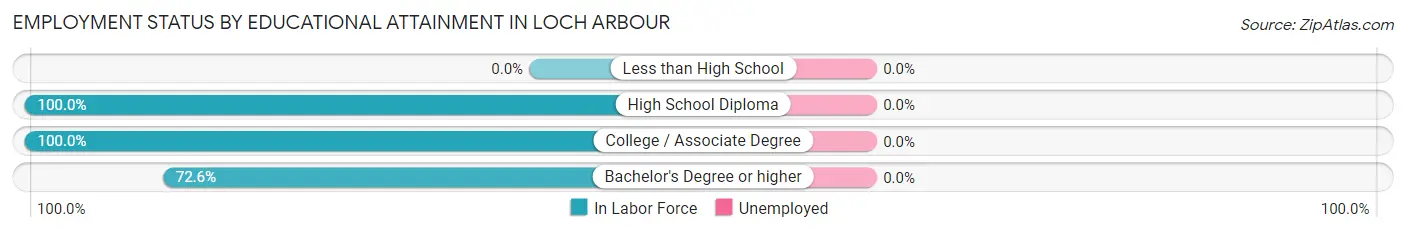
| Educational Attainment | In Labor Force | Unemployed |
| Less than High School | 0 (0.0%) | 0 (0.0%) |
| High School Diploma | 5 (100.0%) | 0 (0.0%) |
| College / Associate Degree | 18 (100.0%) | 0 (0.0%) |
| Bachelor's Degree or higher | 53 (72.6%) | 0 (0.0%) |
| Total | 76 (79.2%) | 0 (0.0%) |
Employment Occupations by Sex in Loch Arbour
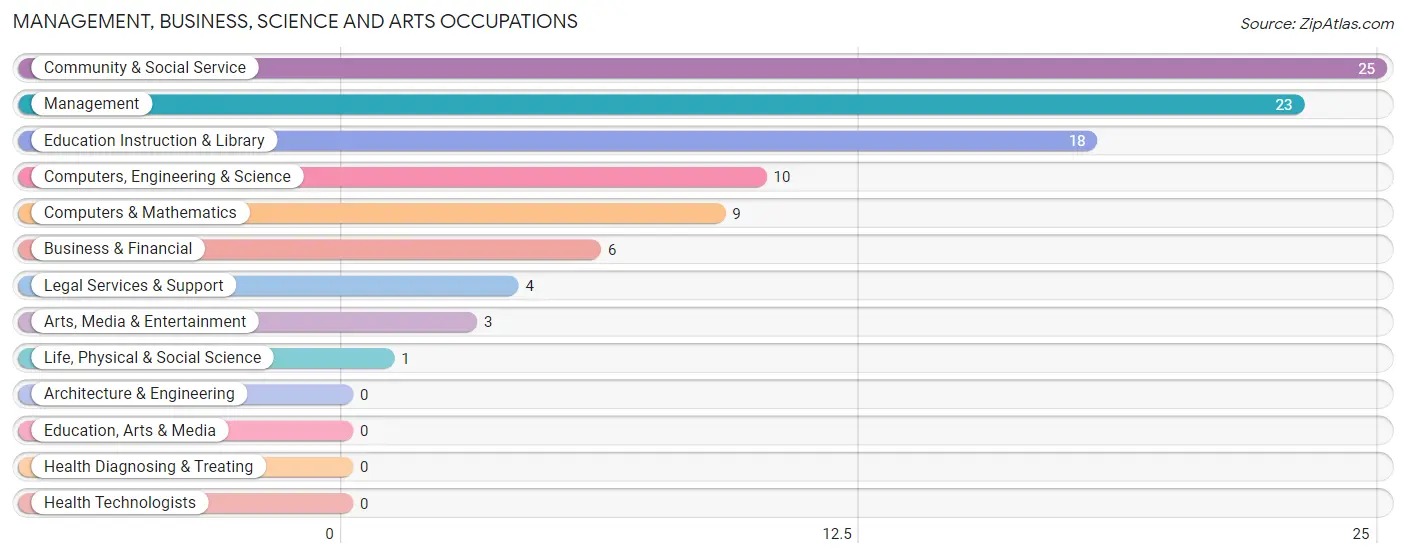
Management, Business, Science and Arts Occupations
The most common Management, Business, Science and Arts occupations in Loch Arbour are Community & Social Service (25 | 25.5%), Management (23 | 23.5%), Education Instruction & Library (18 | 18.4%), Computers, Engineering & Science (10 | 10.2%), and Computers & Mathematics (9 | 9.2%).
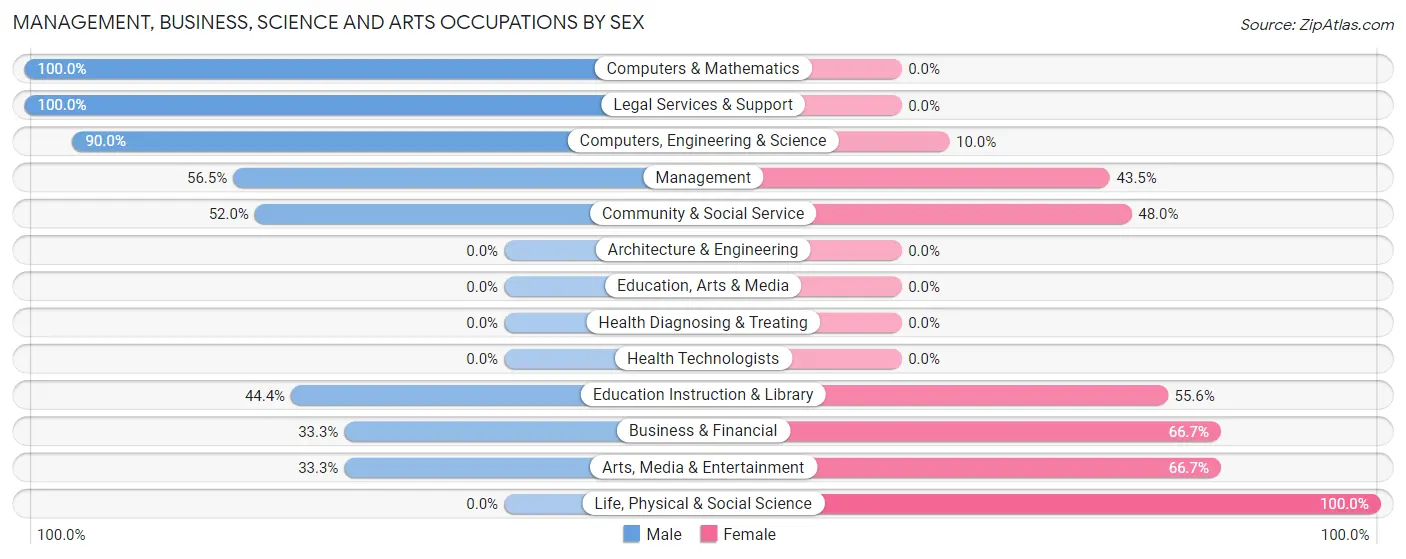
Management, Business, Science and Arts Occupations by Sex
Within the Management, Business, Science and Arts occupations in Loch Arbour, the most male-oriented occupations are Computers & Mathematics (100.0%), Legal Services & Support (100.0%), and Computers, Engineering & Science (90.0%), while the most female-oriented occupations are Life, Physical & Social Science (100.0%), Business & Financial (66.7%), and Arts, Media & Entertainment (66.7%).
| Occupation | Male | Female |
| Management | 13 (56.5%) | 10 (43.5%) |
| Business & Financial | 2 (33.3%) | 4 (66.7%) |
| Computers, Engineering & Science | 9 (90.0%) | 1 (10.0%) |
| Computers & Mathematics | 9 (100.0%) | 0 (0.0%) |
| Architecture & Engineering | 0 (0.0%) | 0 (0.0%) |
| Life, Physical & Social Science | 0 (0.0%) | 1 (100.0%) |
| Community & Social Service | 13 (52.0%) | 12 (48.0%) |
| Education, Arts & Media | 0 (0.0%) | 0 (0.0%) |
| Legal Services & Support | 4 (100.0%) | 0 (0.0%) |
| Education Instruction & Library | 8 (44.4%) | 10 (55.6%) |
| Arts, Media & Entertainment | 1 (33.3%) | 2 (66.7%) |
| Health Diagnosing & Treating | 0 (0.0%) | 0 (0.0%) |
| Health Technologists | 0 (0.0%) | 0 (0.0%) |
| Total (Category) | 37 (57.8%) | 27 (42.2%) |
| Total (Overall) | 48 (49.0%) | 50 (51.0%) |
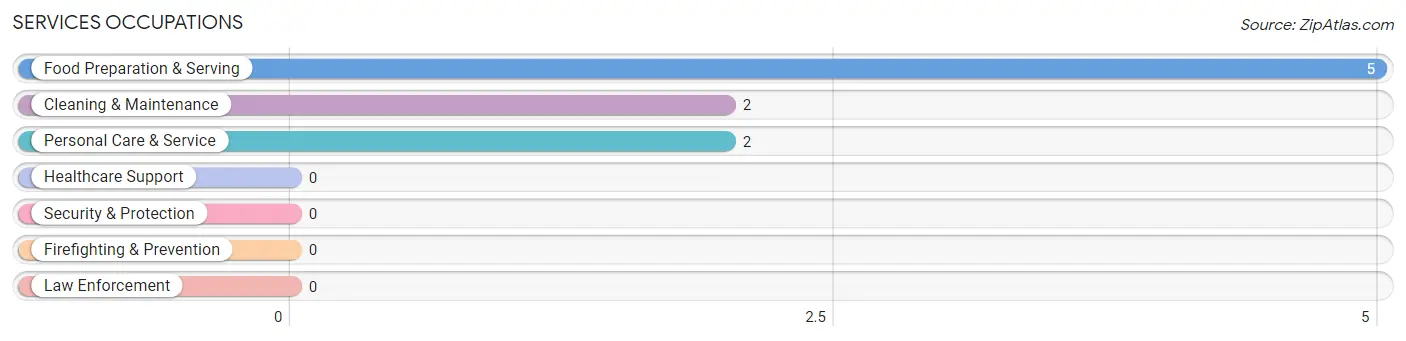
Services Occupations
The most common Services occupations in Loch Arbour are Food Preparation & Serving (5 | 5.1%), Cleaning & Maintenance (2 | 2.0%), and Personal Care & Service (2 | 2.0%).
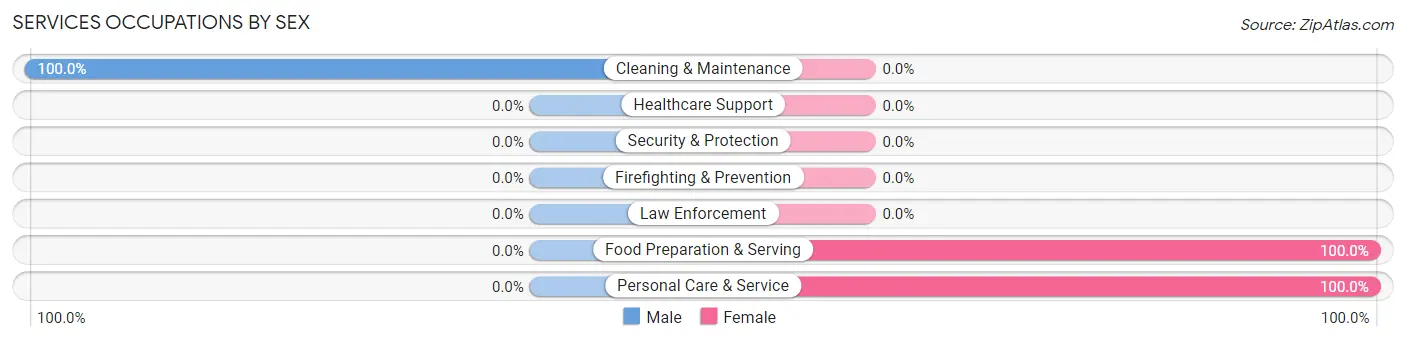
Services Occupations by Sex
| Occupation | Male | Female |
| Healthcare Support | 0 (0.0%) | 0 (0.0%) |
| Security & Protection | 0 (0.0%) | 0 (0.0%) |
| Firefighting & Prevention | 0 (0.0%) | 0 (0.0%) |
| Law Enforcement | 0 (0.0%) | 0 (0.0%) |
| Food Preparation & Serving | 0 (0.0%) | 5 (100.0%) |
| Cleaning & Maintenance | 2 (100.0%) | 0 (0.0%) |
| Personal Care & Service | 0 (0.0%) | 2 (100.0%) |
| Total (Category) | 2 (22.2%) | 7 (77.8%) |
| Total (Overall) | 48 (49.0%) | 50 (51.0%) |
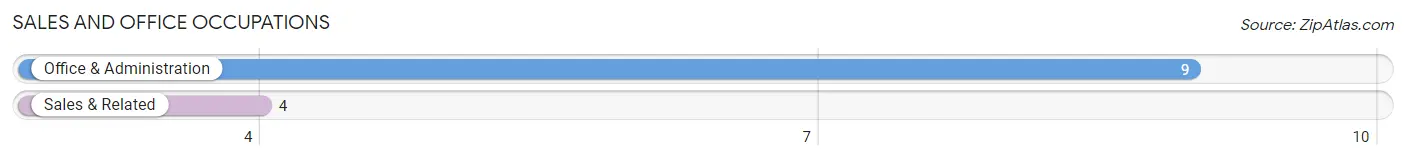
Sales and Office Occupations
The most common Sales and Office occupations in Loch Arbour are Office & Administration (9 | 9.2%), and Sales & Related (4 | 4.1%).
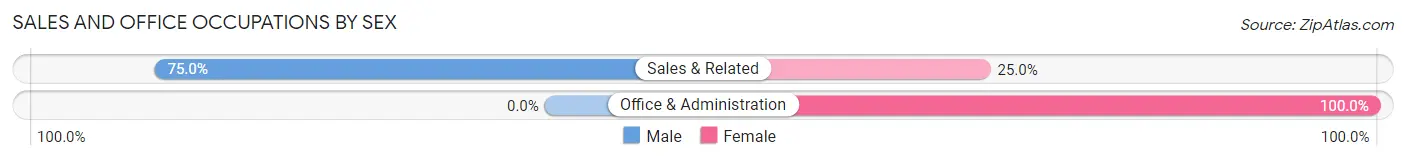
Sales and Office Occupations by Sex
| Occupation | Male | Female |
| Sales & Related | 3 (75.0%) | 1 (25.0%) |
| Office & Administration | 0 (0.0%) | 9 (100.0%) |
| Total (Category) | 3 (23.1%) | 10 (76.9%) |
| Total (Overall) | 48 (49.0%) | 50 (51.0%) |
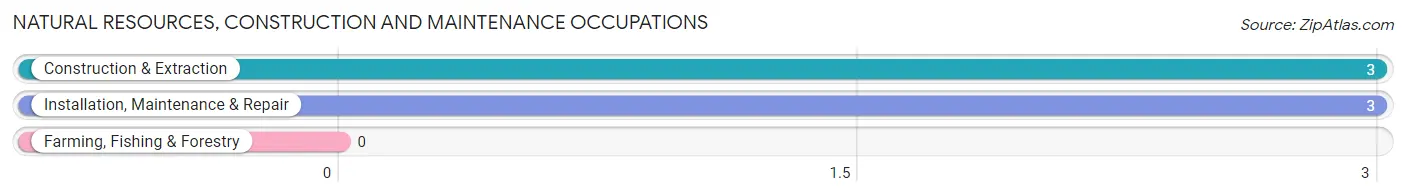
Natural Resources, Construction and Maintenance Occupations
The most common Natural Resources, Construction and Maintenance occupations in Loch Arbour are Construction & Extraction (3 | 3.1%), and Installation, Maintenance & Repair (3 | 3.1%).
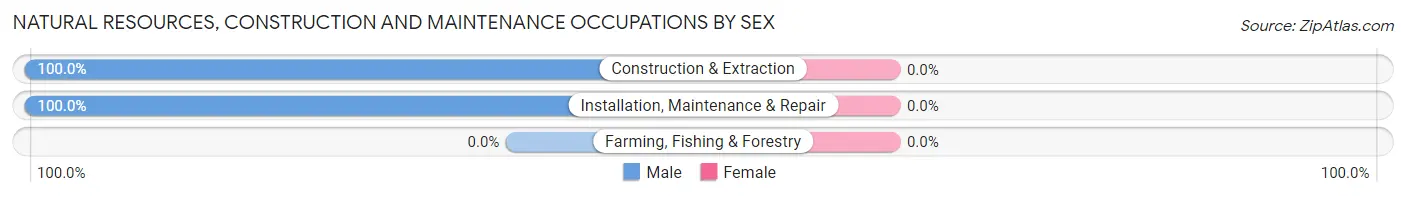
Natural Resources, Construction and Maintenance Occupations by Sex
| Occupation | Male | Female |
| Farming, Fishing & Forestry | 0 (0.0%) | 0 (0.0%) |
| Construction & Extraction | 3 (100.0%) | 0 (0.0%) |
| Installation, Maintenance & Repair | 3 (100.0%) | 0 (0.0%) |
| Total (Category) | 6 (100.0%) | 0 (0.0%) |
| Total (Overall) | 48 (49.0%) | 50 (51.0%) |
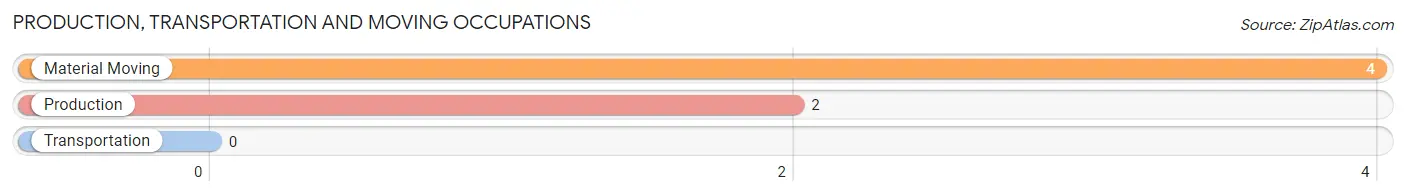
Production, Transportation and Moving Occupations
The most common Production, Transportation and Moving occupations in Loch Arbour are Material Moving (4 | 4.1%), and Production (2 | 2.0%).
Production, Transportation and Moving Occupations by Sex
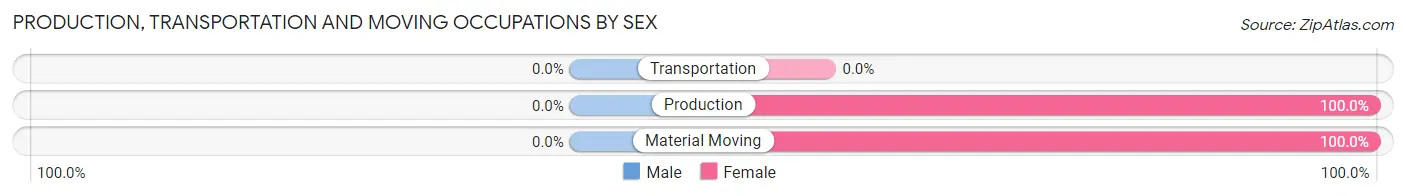
| Occupation | Male | Female |
| Production | 0 (0.0%) | 2 (100.0%) |
| Transportation | 0 (0.0%) | 0 (0.0%) |
| Material Moving | 0 (0.0%) | 4 (100.0%) |
| Total (Category) | 0 (0.0%) | 6 (100.0%) |
| Total (Overall) | 48 (49.0%) | 50 (51.0%) |
Employment Industries by Sex in Loch Arbour
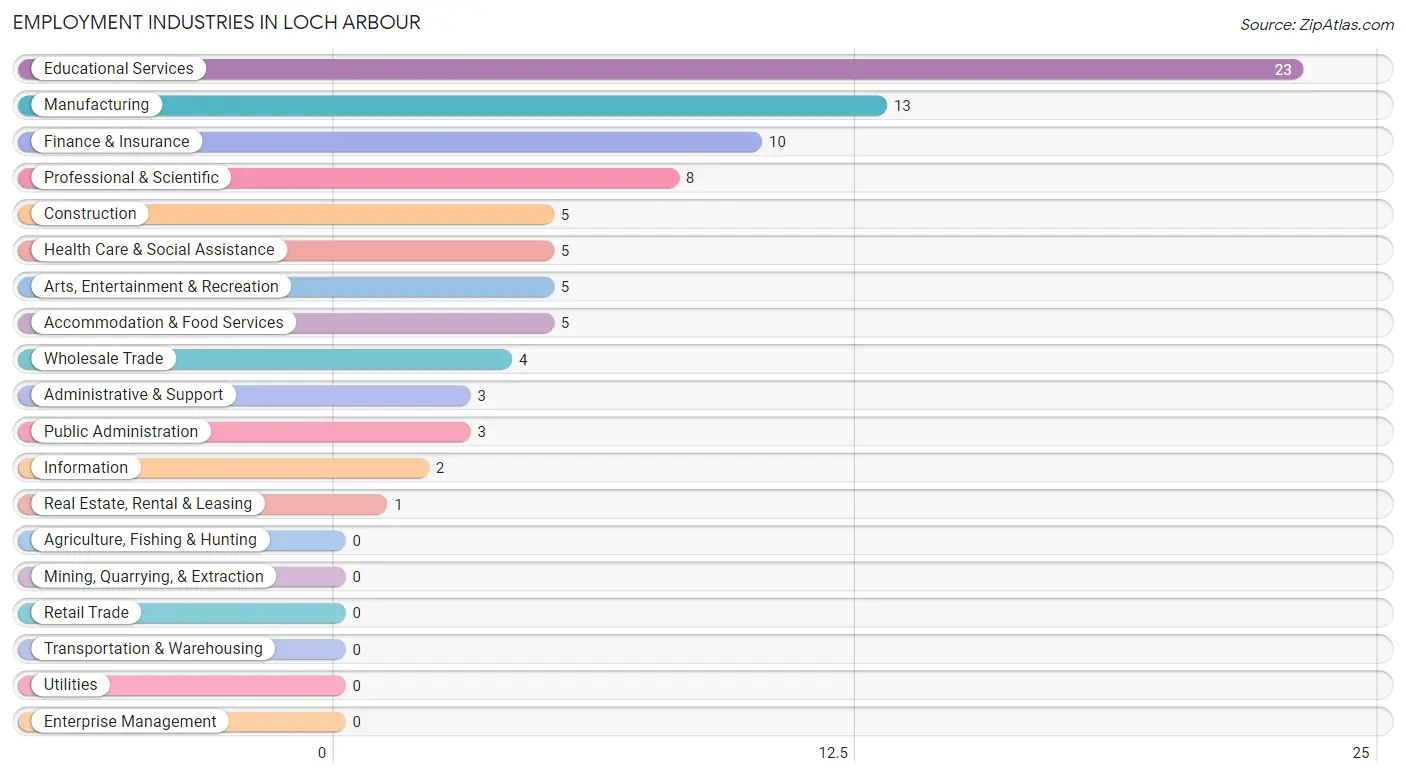
Employment Industries in Loch Arbour
The major employment industries in Loch Arbour include Educational Services (23 | 23.5%), Manufacturing (13 | 13.3%), Finance & Insurance (10 | 10.2%), Professional & Scientific (8 | 8.2%), and Construction (5 | 5.1%).
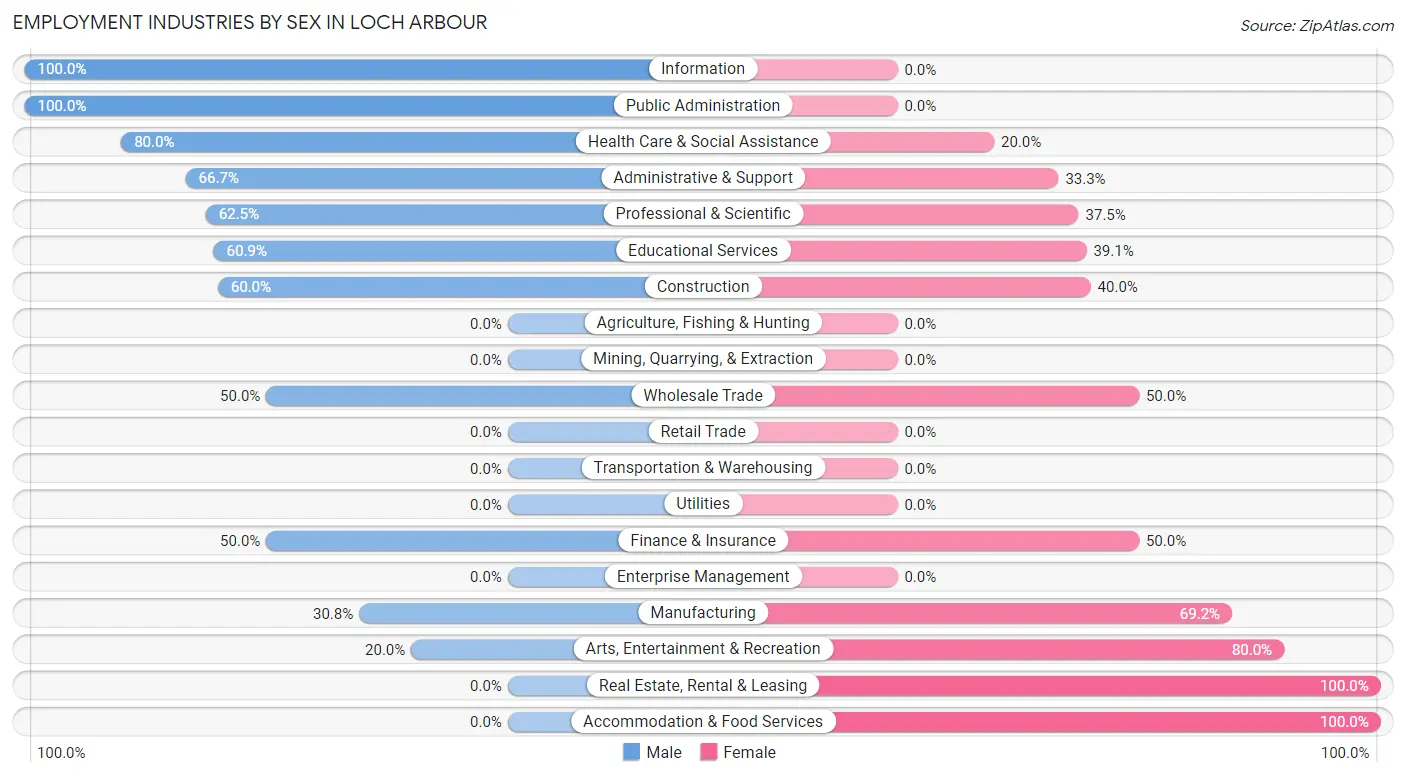
Employment Industries by Sex in Loch Arbour
The Loch Arbour industries that see more men than women are Information (100.0%), Public Administration (100.0%), and Health Care & Social Assistance (80.0%), whereas the industries that tend to have a higher number of women are Real Estate, Rental & Leasing (100.0%), Accommodation & Food Services (100.0%), and Arts, Entertainment & Recreation (80.0%).
| Industry | Male | Female |
| Agriculture, Fishing & Hunting | 0 (0.0%) | 0 (0.0%) |
| Mining, Quarrying, & Extraction | 0 (0.0%) | 0 (0.0%) |
| Construction | 3 (60.0%) | 2 (40.0%) |
| Manufacturing | 4 (30.8%) | 9 (69.2%) |
| Wholesale Trade | 2 (50.0%) | 2 (50.0%) |
| Retail Trade | 0 (0.0%) | 0 (0.0%) |
| Transportation & Warehousing | 0 (0.0%) | 0 (0.0%) |
| Utilities | 0 (0.0%) | 0 (0.0%) |
| Information | 2 (100.0%) | 0 (0.0%) |
| Finance & Insurance | 5 (50.0%) | 5 (50.0%) |
| Real Estate, Rental & Leasing | 0 (0.0%) | 1 (100.0%) |
| Professional & Scientific | 5 (62.5%) | 3 (37.5%) |
| Enterprise Management | 0 (0.0%) | 0 (0.0%) |
| Administrative & Support | 2 (66.7%) | 1 (33.3%) |
| Educational Services | 14 (60.9%) | 9 (39.1%) |
| Health Care & Social Assistance | 4 (80.0%) | 1 (20.0%) |
| Arts, Entertainment & Recreation | 1 (20.0%) | 4 (80.0%) |
| Accommodation & Food Services | 0 (0.0%) | 5 (100.0%) |
| Public Administration | 3 (100.0%) | 0 (0.0%) |
| Total | 48 (49.0%) | 50 (51.0%) |
Education in Loch Arbour
School Enrollment in Loch Arbour
The most common levels of schooling among the 46 students in Loch Arbour are high school (15 | 32.6%), college / undergraduate (12 | 26.1%), and elementary school (8 | 17.4%).
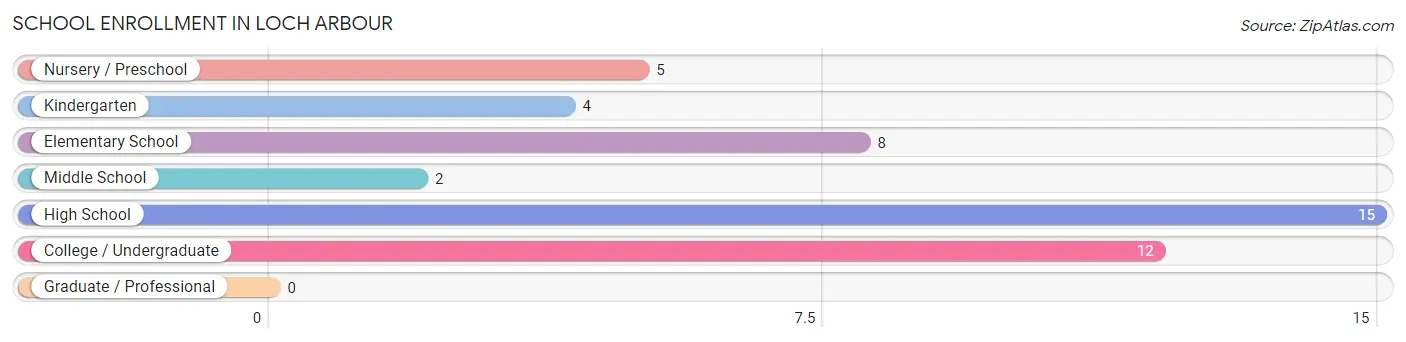
| School Level | # Students | % Students |
| Nursery / Preschool | 5 | 10.9% |
| Kindergarten | 4 | 8.7% |
| Elementary School | 8 | 17.4% |
| Middle School | 2 | 4.3% |
| High School | 15 | 32.6% |
| College / Undergraduate | 12 | 26.1% |
| Graduate / Professional | 0 | 0.0% |
| Total | 46 | 100.0% |
School Enrollment by Age by Funding Source in Loch Arbour
Out of a total of 46 students who are enrolled in schools in Loch Arbour, 11 (23.9%) attend a private institution, while the remaining 35 (76.1%) are enrolled in public schools. The age group of 20 to 24 year olds has the highest likelihood of being enrolled in private schools, with 8 (72.7% in the age bracket) enrolled. Conversely, the age group of 5 to 9 year old has the lowest likelihood of being enrolled in a private school, with 10 (100.0% in the age bracket) attending a public institution.
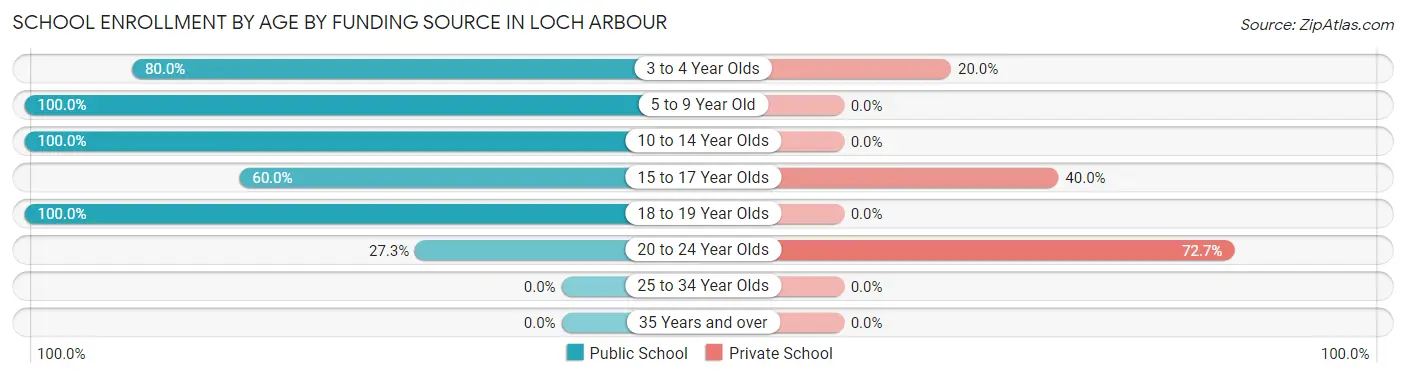
| Age Bracket | Public School | Private School |
| 3 to 4 Year Olds | 4 (80.0%) | 1 (20.0%) |
| 5 to 9 Year Old | 10 (100.0%) | 0 (0.0%) |
| 10 to 14 Year Olds | 7 (100.0%) | 0 (0.0%) |
| 15 to 17 Year Olds | 3 (60.0%) | 2 (40.0%) |
| 18 to 19 Year Olds | 8 (100.0%) | 0 (0.0%) |
| 20 to 24 Year Olds | 3 (27.3%) | 8 (72.7%) |
| 25 to 34 Year Olds | 0 (0.0%) | 0 (0.0%) |
| 35 Years and over | 0 (0.0%) | 0 (0.0%) |
| Total | 35 (76.1%) | 11 (23.9%) |
Educational Attainment by Field of Study in Loch Arbour
Education (27 | 22.9%), social sciences (19 | 16.1%), business (17 | 14.4%), arts & humanities (12 | 10.2%), and physical & health sciences (8 | 6.8%) are the most common fields of study among 118 individuals in Loch Arbour who have obtained a bachelor's degree or higher.

| Field of Study | # Graduates | % Graduates |
| Computers & Mathematics | 7 | 5.9% |
| Bio, Nature & Agricultural | 5 | 4.2% |
| Physical & Health Sciences | 8 | 6.8% |
| Psychology | 3 | 2.5% |
| Social Sciences | 19 | 16.1% |
| Engineering | 3 | 2.5% |
| Multidisciplinary Studies | 0 | 0.0% |
| Science & Technology | 8 | 6.8% |
| Business | 17 | 14.4% |
| Education | 27 | 22.9% |
| Literature & Languages | 0 | 0.0% |
| Liberal Arts & History | 2 | 1.7% |
| Visual & Performing Arts | 2 | 1.7% |
| Communications | 5 | 4.2% |
| Arts & Humanities | 12 | 10.2% |
| Total | 118 | 100.0% |
Transportation & Commute in Loch Arbour
Vehicle Availability by Sex in Loch Arbour
The most prevalent vehicle ownership categories in Loch Arbour are males with 1 vehicle (15, accounting for 31.2%) and females with 1 vehicle (6, making up 31.9%).
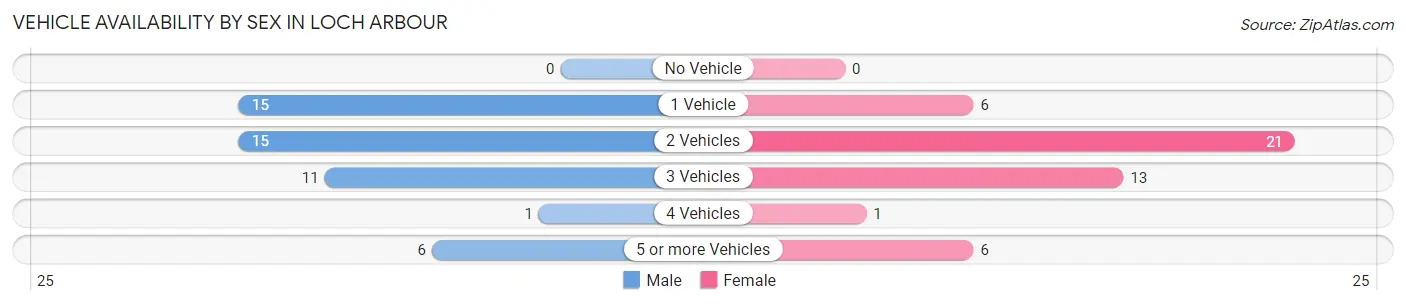
| Vehicles Available | Male | Female |
| No Vehicle | 0 (0.0%) | 0 (0.0%) |
| 1 Vehicle | 15 (31.2%) | 6 (12.8%) |
| 2 Vehicles | 15 (31.2%) | 21 (44.7%) |
| 3 Vehicles | 11 (22.9%) | 13 (27.7%) |
| 4 Vehicles | 1 (2.1%) | 1 (2.1%) |
| 5 or more Vehicles | 6 (12.5%) | 6 (12.8%) |
| Total | 48 (100.0%) | 47 (100.0%) |
Commute Time in Loch Arbour
The most frequently occuring commute durations in Loch Arbour are 30 to 34 minutes (13 commuters, 15.7%), 25 to 29 minutes (11 commuters, 13.3%), and less than 5 minutes (10 commuters, 12.0%).
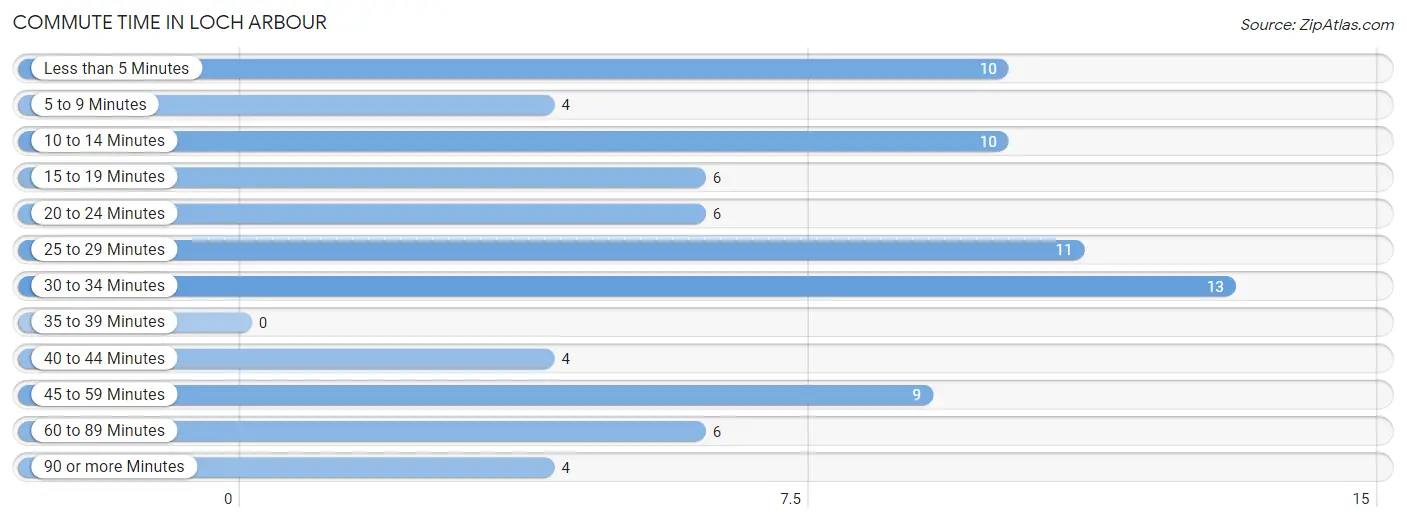
| Commute Time | # Commuters | % Commuters |
| Less than 5 Minutes | 10 | 12.0% |
| 5 to 9 Minutes | 4 | 4.8% |
| 10 to 14 Minutes | 10 | 12.0% |
| 15 to 19 Minutes | 6 | 7.2% |
| 20 to 24 Minutes | 6 | 7.2% |
| 25 to 29 Minutes | 11 | 13.3% |
| 30 to 34 Minutes | 13 | 15.7% |
| 35 to 39 Minutes | 0 | 0.0% |
| 40 to 44 Minutes | 4 | 4.8% |
| 45 to 59 Minutes | 9 | 10.8% |
| 60 to 89 Minutes | 6 | 7.2% |
| 90 or more Minutes | 4 | 4.8% |
Commute Time by Sex in Loch Arbour
The most common commute times in Loch Arbour are 25 to 29 minutes (9 commuters, 23.7%) for males and 30 to 34 minutes (9 commuters, 20.0%) for females.
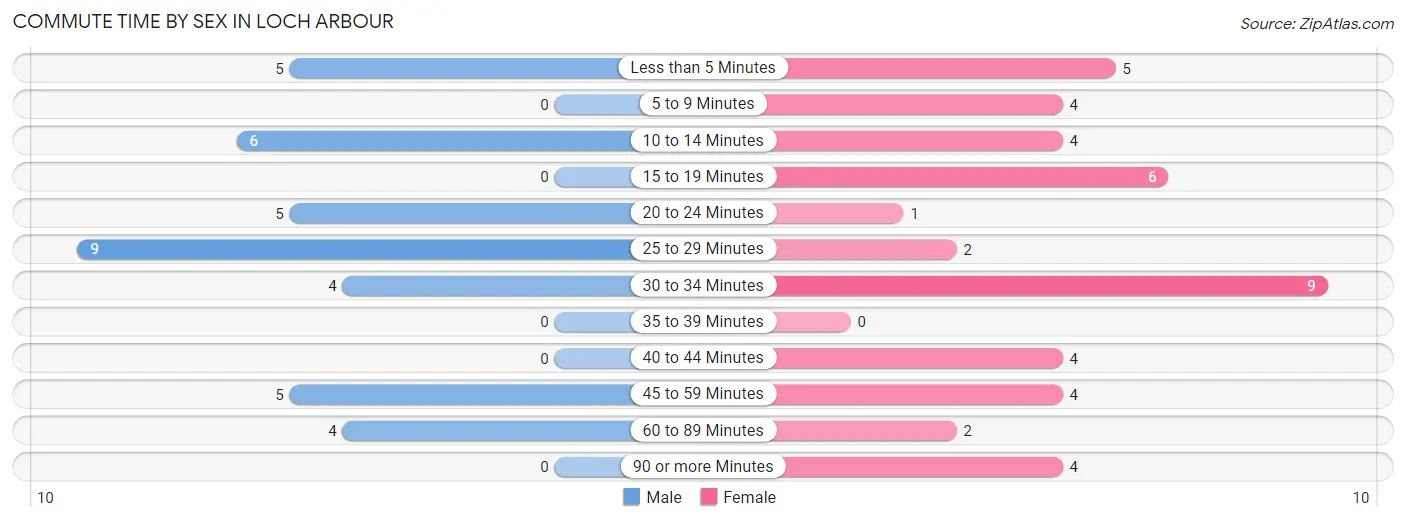
| Commute Time | Male | Female |
| Less than 5 Minutes | 5 (13.2%) | 5 (11.1%) |
| 5 to 9 Minutes | 0 (0.0%) | 4 (8.9%) |
| 10 to 14 Minutes | 6 (15.8%) | 4 (8.9%) |
| 15 to 19 Minutes | 0 (0.0%) | 6 (13.3%) |
| 20 to 24 Minutes | 5 (13.2%) | 1 (2.2%) |
| 25 to 29 Minutes | 9 (23.7%) | 2 (4.4%) |
| 30 to 34 Minutes | 4 (10.5%) | 9 (20.0%) |
| 35 to 39 Minutes | 0 (0.0%) | 0 (0.0%) |
| 40 to 44 Minutes | 0 (0.0%) | 4 (8.9%) |
| 45 to 59 Minutes | 5 (13.2%) | 4 (8.9%) |
| 60 to 89 Minutes | 4 (10.5%) | 2 (4.4%) |
| 90 or more Minutes | 0 (0.0%) | 4 (8.9%) |
Time of Departure to Work by Sex in Loch Arbour
The most frequent times of departure to work in Loch Arbour are 8:00 AM to 8:29 AM (19, 50.0%) for males and 7:00 AM to 7:29 AM (9, 20.0%) for females.
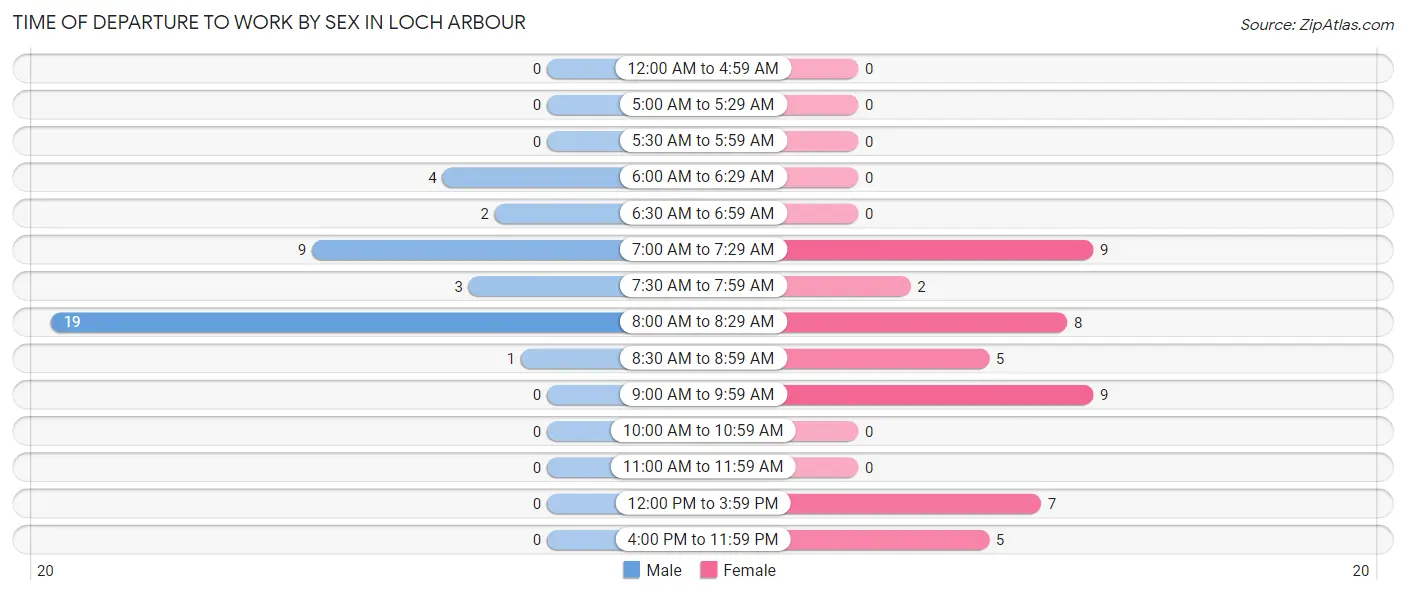
| Time of Departure | Male | Female |
| 12:00 AM to 4:59 AM | 0 (0.0%) | 0 (0.0%) |
| 5:00 AM to 5:29 AM | 0 (0.0%) | 0 (0.0%) |
| 5:30 AM to 5:59 AM | 0 (0.0%) | 0 (0.0%) |
| 6:00 AM to 6:29 AM | 4 (10.5%) | 0 (0.0%) |
| 6:30 AM to 6:59 AM | 2 (5.3%) | 0 (0.0%) |
| 7:00 AM to 7:29 AM | 9 (23.7%) | 9 (20.0%) |
| 7:30 AM to 7:59 AM | 3 (7.9%) | 2 (4.4%) |
| 8:00 AM to 8:29 AM | 19 (50.0%) | 8 (17.8%) |
| 8:30 AM to 8:59 AM | 1 (2.6%) | 5 (11.1%) |
| 9:00 AM to 9:59 AM | 0 (0.0%) | 9 (20.0%) |
| 10:00 AM to 10:59 AM | 0 (0.0%) | 0 (0.0%) |
| 11:00 AM to 11:59 AM | 0 (0.0%) | 0 (0.0%) |
| 12:00 PM to 3:59 PM | 0 (0.0%) | 7 (15.6%) |
| 4:00 PM to 11:59 PM | 0 (0.0%) | 5 (11.1%) |
| Total | 38 (100.0%) | 45 (100.0%) |
Housing Occupancy in Loch Arbour
Occupancy by Ownership in Loch Arbour
Of the total 84 dwellings in Loch Arbour, owner-occupied units account for 75 (89.3%), while renter-occupied units make up 9 (10.7%).
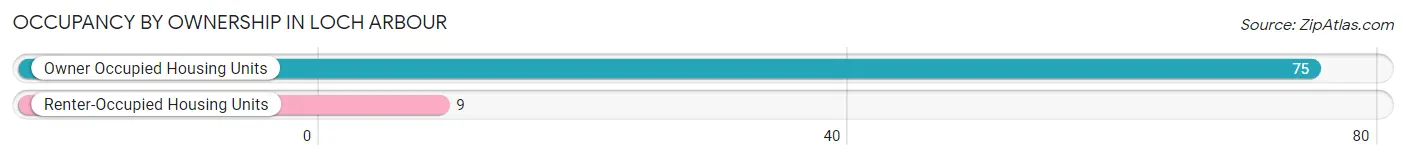
| Occupancy | # Housing Units | % Housing Units |
| Owner Occupied Housing Units | 75 | 89.3% |
| Renter-Occupied Housing Units | 9 | 10.7% |
| Total Occupied Housing Units | 84 | 100.0% |
Occupancy by Household Size in Loch Arbour
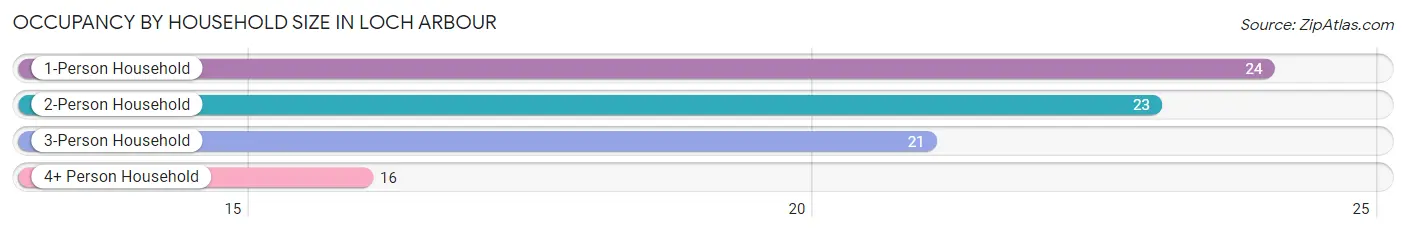
| Household Size | # Housing Units | % Housing Units |
| 1-Person Household | 24 | 28.6% |
| 2-Person Household | 23 | 27.4% |
| 3-Person Household | 21 | 25.0% |
| 4+ Person Household | 16 | 19.1% |
| Total Housing Units | 84 | 100.0% |
Occupancy by Ownership by Household Size in Loch Arbour
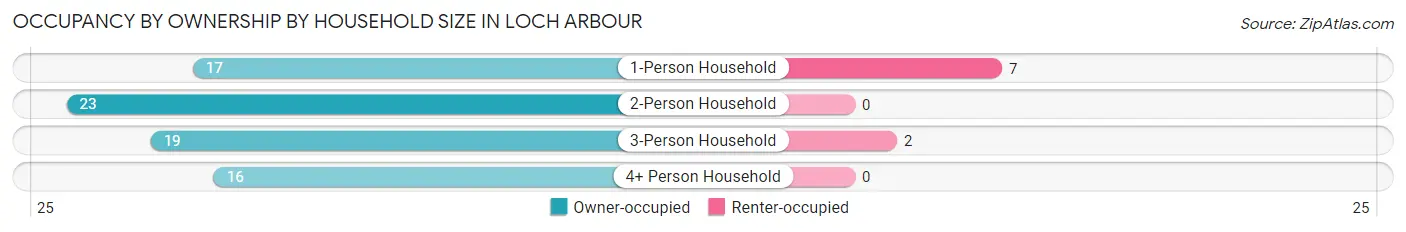
| Household Size | Owner-occupied | Renter-occupied |
| 1-Person Household | 17 (70.8%) | 7 (29.2%) |
| 2-Person Household | 23 (100.0%) | 0 (0.0%) |
| 3-Person Household | 19 (90.5%) | 2 (9.5%) |
| 4+ Person Household | 16 (100.0%) | 0 (0.0%) |
| Total Housing Units | 75 (89.3%) | 9 (10.7%) |
Occupancy by Educational Attainment in Loch Arbour
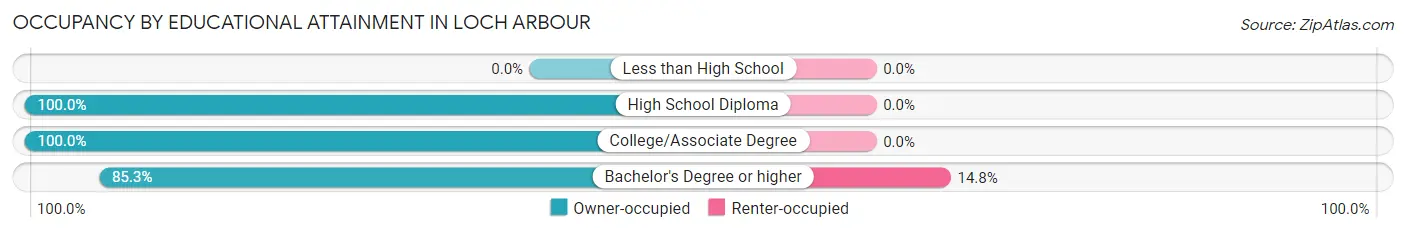
| Household Size | Owner-occupied | Renter-occupied |
| Less than High School | 0 (0.0%) | 0 (0.0%) |
| High School Diploma | 9 (100.0%) | 0 (0.0%) |
| College/Associate Degree | 14 (100.0%) | 0 (0.0%) |
| Bachelor's Degree or higher | 52 (85.3%) | 9 (14.7%) |
Occupancy by Age of Householder in Loch Arbour
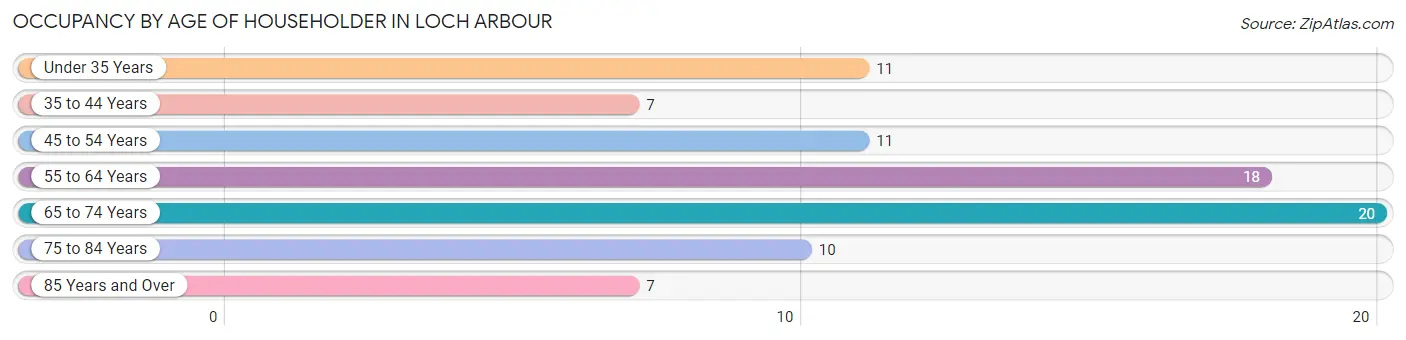
| Age Bracket | # Households | % Households |
| Under 35 Years | 11 | 13.1% |
| 35 to 44 Years | 7 | 8.3% |
| 45 to 54 Years | 11 | 13.1% |
| 55 to 64 Years | 18 | 21.4% |
| 65 to 74 Years | 20 | 23.8% |
| 75 to 84 Years | 10 | 11.9% |
| 85 Years and Over | 7 | 8.3% |
| Total | 84 | 100.0% |
Housing Finances in Loch Arbour
Median Income by Occupancy in Loch Arbour
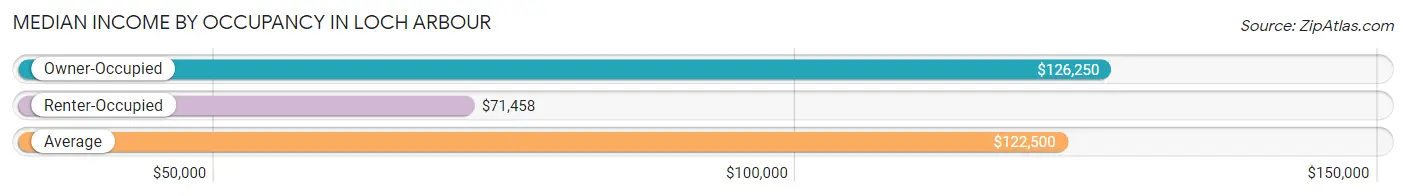
| Occupancy Type | # Households | Median Income |
| Owner-Occupied | 75 (89.3%) | $126,250 |
| Renter-Occupied | 9 (10.7%) | $71,458 |
| Average | 84 (100.0%) | $122,500 |
Occupancy by Householder Income Bracket in Loch Arbour
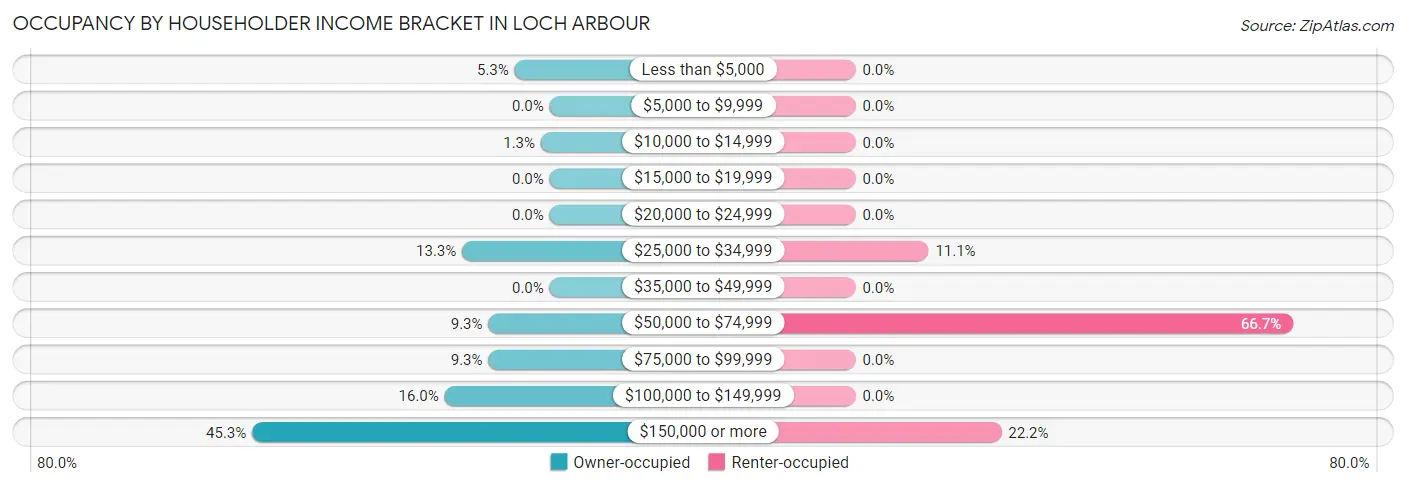
| Income Bracket | Owner-occupied | Renter-occupied |
| Less than $5,000 | 4 (5.3%) | 0 (0.0%) |
| $5,000 to $9,999 | 0 (0.0%) | 0 (0.0%) |
| $10,000 to $14,999 | 1 (1.3%) | 0 (0.0%) |
| $15,000 to $19,999 | 0 (0.0%) | 0 (0.0%) |
| $20,000 to $24,999 | 0 (0.0%) | 0 (0.0%) |
| $25,000 to $34,999 | 10 (13.3%) | 1 (11.1%) |
| $35,000 to $49,999 | 0 (0.0%) | 0 (0.0%) |
| $50,000 to $74,999 | 7 (9.3%) | 6 (66.7%) |
| $75,000 to $99,999 | 7 (9.3%) | 0 (0.0%) |
| $100,000 to $149,999 | 12 (16.0%) | 0 (0.0%) |
| $150,000 or more | 34 (45.3%) | 2 (22.2%) |
| Total | 75 (100.0%) | 9 (100.0%) |
Monthly Housing Cost Tiers in Loch Arbour
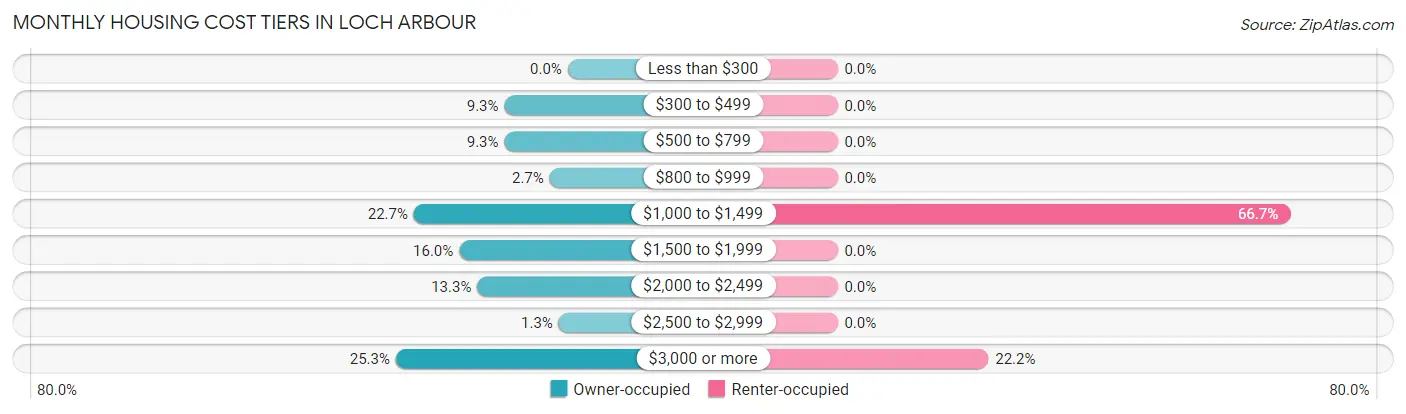
| Monthly Cost | Owner-occupied | Renter-occupied |
| Less than $300 | 0 (0.0%) | 0 (0.0%) |
| $300 to $499 | 7 (9.3%) | 0 (0.0%) |
| $500 to $799 | 7 (9.3%) | 0 (0.0%) |
| $800 to $999 | 2 (2.7%) | 0 (0.0%) |
| $1,000 to $1,499 | 17 (22.7%) | 6 (66.7%) |
| $1,500 to $1,999 | 12 (16.0%) | 0 (0.0%) |
| $2,000 to $2,499 | 10 (13.3%) | 0 (0.0%) |
| $2,500 to $2,999 | 1 (1.3%) | 0 (0.0%) |
| $3,000 or more | 19 (25.3%) | 2 (22.2%) |
| Total | 75 (100.0%) | 9 (100.0%) |
Physical Housing Characteristics in Loch Arbour
Housing Structures in Loch Arbour
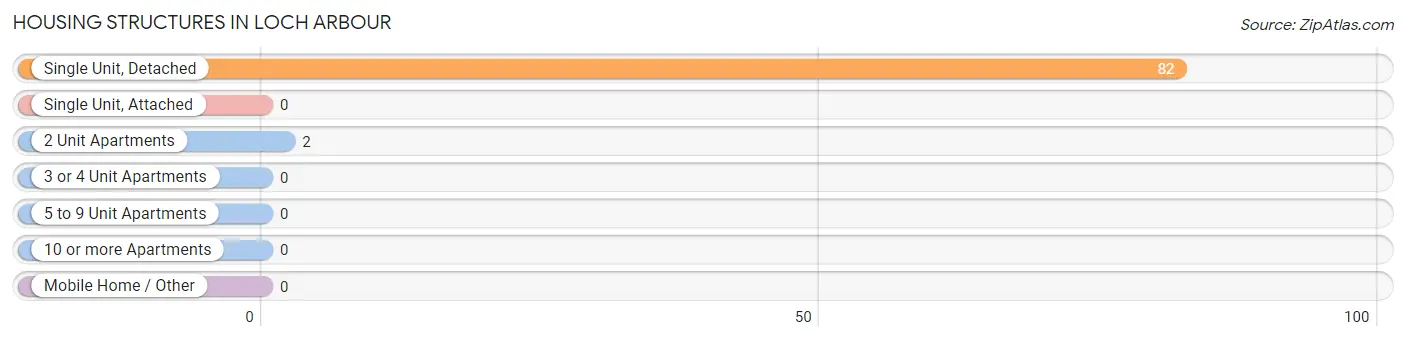
| Structure Type | # Housing Units | % Housing Units |
| Single Unit, Detached | 82 | 97.6% |
| Single Unit, Attached | 0 | 0.0% |
| 2 Unit Apartments | 2 | 2.4% |
| 3 or 4 Unit Apartments | 0 | 0.0% |
| 5 to 9 Unit Apartments | 0 | 0.0% |
| 10 or more Apartments | 0 | 0.0% |
| Mobile Home / Other | 0 | 0.0% |
| Total | 84 | 100.0% |
Housing Structures by Occupancy in Loch Arbour
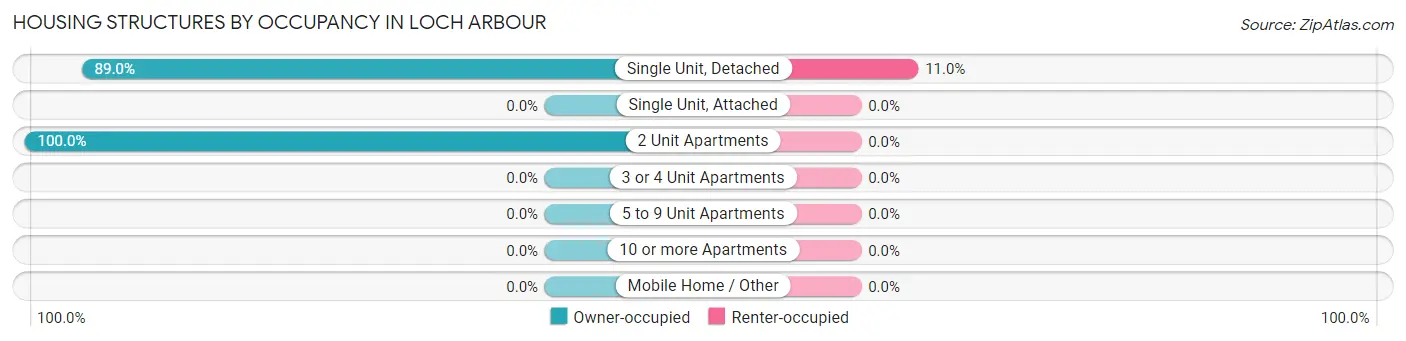
| Structure Type | Owner-occupied | Renter-occupied |
| Single Unit, Detached | 73 (89.0%) | 9 (11.0%) |
| Single Unit, Attached | 0 (0.0%) | 0 (0.0%) |
| 2 Unit Apartments | 2 (100.0%) | 0 (0.0%) |
| 3 or 4 Unit Apartments | 0 (0.0%) | 0 (0.0%) |
| 5 to 9 Unit Apartments | 0 (0.0%) | 0 (0.0%) |
| 10 or more Apartments | 0 (0.0%) | 0 (0.0%) |
| Mobile Home / Other | 0 (0.0%) | 0 (0.0%) |
| Total | 75 (89.3%) | 9 (10.7%) |
Housing Structures by Number of Rooms in Loch Arbour
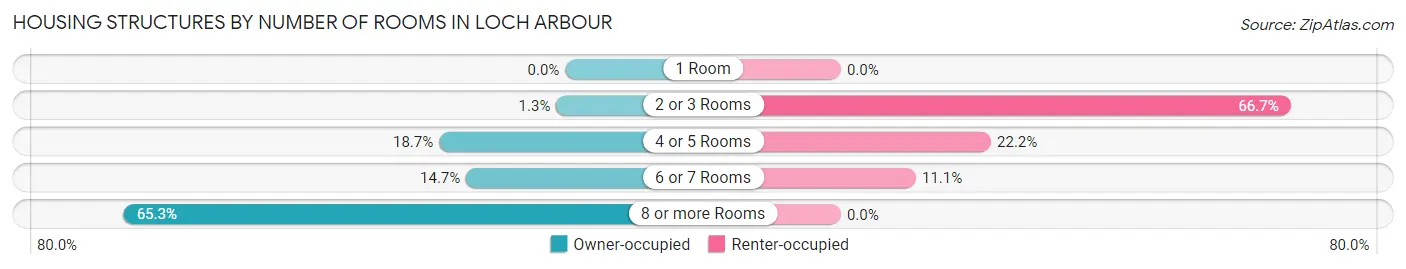
| Number of Rooms | Owner-occupied | Renter-occupied |
| 1 Room | 0 (0.0%) | 0 (0.0%) |
| 2 or 3 Rooms | 1 (1.3%) | 6 (66.7%) |
| 4 or 5 Rooms | 14 (18.7%) | 2 (22.2%) |
| 6 or 7 Rooms | 11 (14.7%) | 1 (11.1%) |
| 8 or more Rooms | 49 (65.3%) | 0 (0.0%) |
| Total | 75 (100.0%) | 9 (100.0%) |
Housing Structure by Heating Type in Loch Arbour
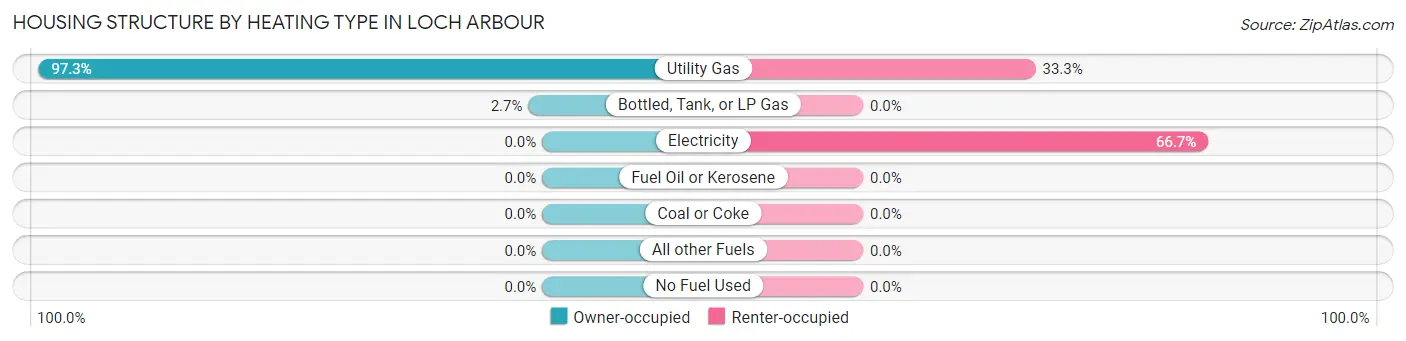
| Heating Type | Owner-occupied | Renter-occupied |
| Utility Gas | 73 (97.3%) | 3 (33.3%) |
| Bottled, Tank, or LP Gas | 2 (2.7%) | 0 (0.0%) |
| Electricity | 0 (0.0%) | 6 (66.7%) |
| Fuel Oil or Kerosene | 0 (0.0%) | 0 (0.0%) |
| Coal or Coke | 0 (0.0%) | 0 (0.0%) |
| All other Fuels | 0 (0.0%) | 0 (0.0%) |
| No Fuel Used | 0 (0.0%) | 0 (0.0%) |
| Total | 75 (100.0%) | 9 (100.0%) |
Household Vehicle Usage in Loch Arbour
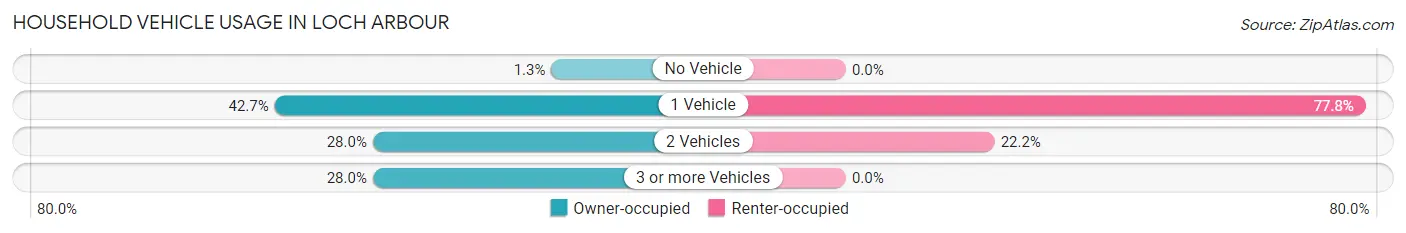
| Vehicles per Household | Owner-occupied | Renter-occupied |
| No Vehicle | 1 (1.3%) | 0 (0.0%) |
| 1 Vehicle | 32 (42.7%) | 7 (77.8%) |
| 2 Vehicles | 21 (28.0%) | 2 (22.2%) |
| 3 or more Vehicles | 21 (28.0%) | 0 (0.0%) |
| Total | 75 (100.0%) | 9 (100.0%) |
Real Estate & Mortgages in Loch Arbour
Real Estate and Mortgage Overview in Loch Arbour
| Characteristic | Without Mortgage | With Mortgage |
| Housing Units | 50 | 25 |
| Median Property Value | $1,125,000 | $1,468,800 |
| Median Household Income | $110,833 | $17 |
| Monthly Housing Costs | $1,200 | $19 |
| Real Estate Taxes | $9,583 | $0 |
Property Value by Mortgage Status in Loch Arbour
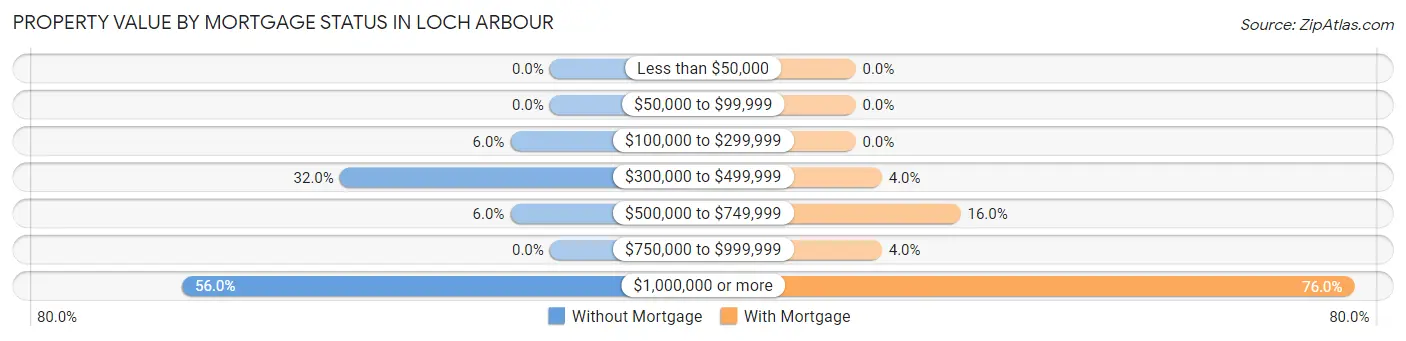
| Property Value | Without Mortgage | With Mortgage |
| Less than $50,000 | 0 (0.0%) | 0 (0.0%) |
| $50,000 to $99,999 | 0 (0.0%) | 0 (0.0%) |
| $100,000 to $299,999 | 3 (6.0%) | 0 (0.0%) |
| $300,000 to $499,999 | 16 (32.0%) | 1 (4.0%) |
| $500,000 to $749,999 | 3 (6.0%) | 4 (16.0%) |
| $750,000 to $999,999 | 0 (0.0%) | 1 (4.0%) |
| $1,000,000 or more | 28 (56.0%) | 19 (76.0%) |
| Total | 50 (100.0%) | 25 (100.0%) |
Household Income by Mortgage Status in Loch Arbour
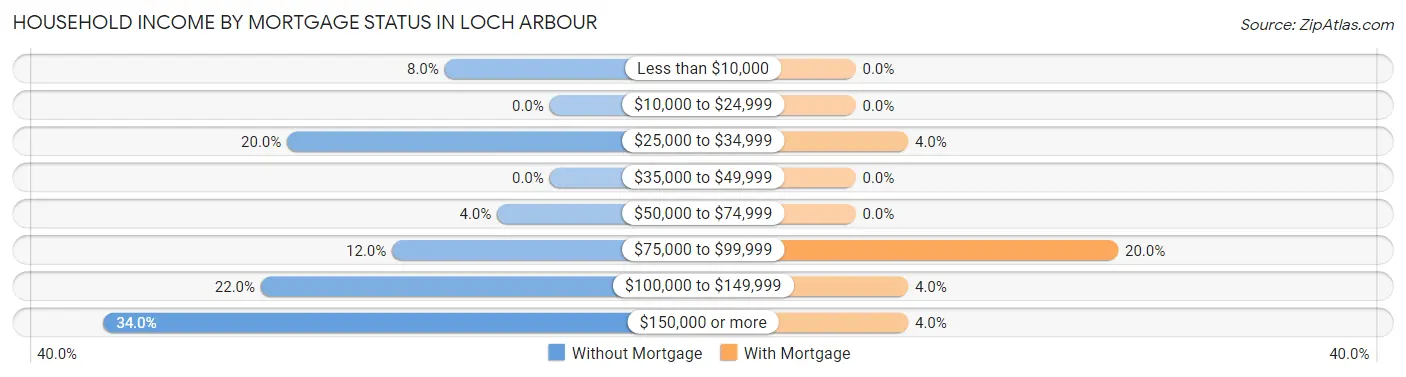
| Household Income | Without Mortgage | With Mortgage |
| Less than $10,000 | 4 (8.0%) | 0 (0.0%) |
| $10,000 to $24,999 | 0 (0.0%) | 0 (0.0%) |
| $25,000 to $34,999 | 10 (20.0%) | 1 (4.0%) |
| $35,000 to $49,999 | 0 (0.0%) | 0 (0.0%) |
| $50,000 to $74,999 | 2 (4.0%) | 0 (0.0%) |
| $75,000 to $99,999 | 6 (12.0%) | 5 (20.0%) |
| $100,000 to $149,999 | 11 (22.0%) | 1 (4.0%) |
| $150,000 or more | 17 (34.0%) | 1 (4.0%) |
| Total | 50 (100.0%) | 25 (100.0%) |
Property Value to Household Income Ratio in Loch Arbour
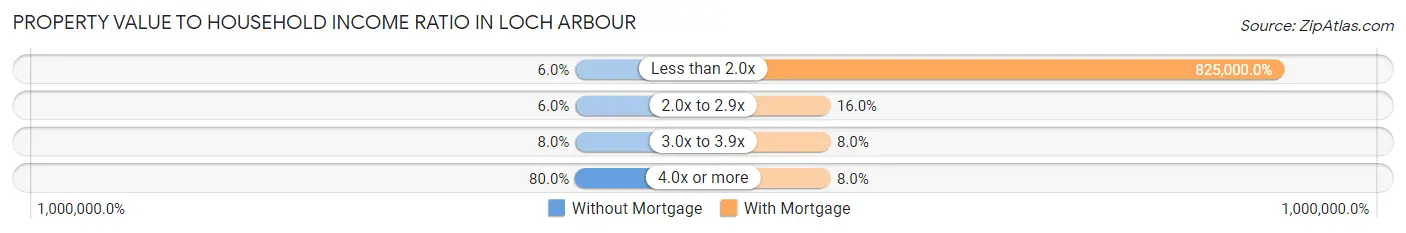
| Value-to-Income Ratio | Without Mortgage | With Mortgage |
| Less than 2.0x | 3 (6.0%) | 206,250 (825,000.0%) |
| 2.0x to 2.9x | 3 (6.0%) | 4 (16.0%) |
| 3.0x to 3.9x | 4 (8.0%) | 2 (8.0%) |
| 4.0x or more | 40 (80.0%) | 2 (8.0%) |
| Total | 50 (100.0%) | 25 (100.0%) |
Real Estate Taxes by Mortgage Status in Loch Arbour
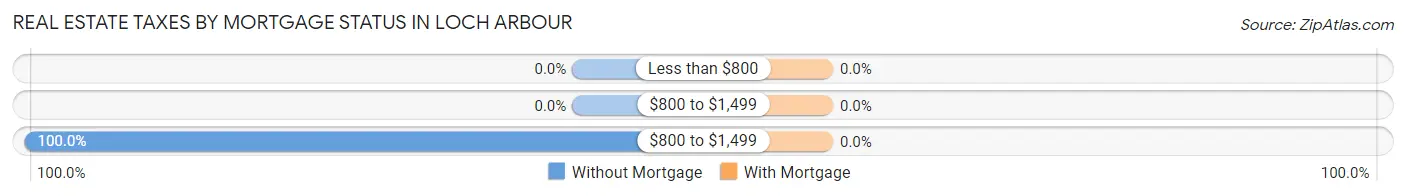
| Property Taxes | Without Mortgage | With Mortgage |
| Less than $800 | 0 (0.0%) | 0 (0.0%) |
| $800 to $1,499 | 0 (0.0%) | 0 (0.0%) |
| $800 to $1,499 | 50 (100.0%) | 0 (0.0%) |
| Total | 50 (100.0%) | 25 (100.0%) |
Health & Disability in Loch Arbour
Health Insurance Coverage by Age in Loch Arbour
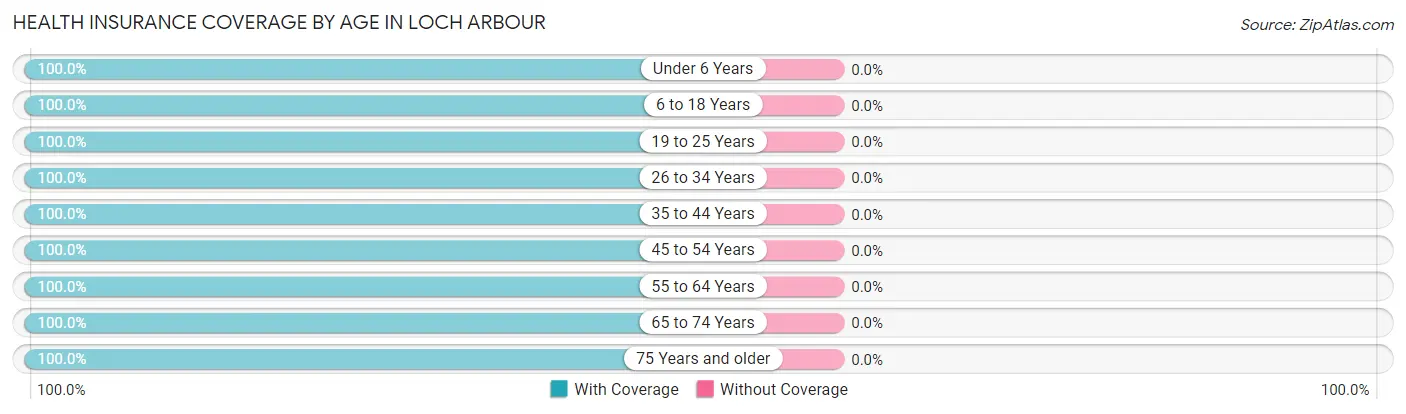
| Age Bracket | With Coverage | Without Coverage |
| Under 6 Years | 11 (100.0%) | 0 (0.0%) |
| 6 to 18 Years | 30 (100.0%) | 0 (0.0%) |
| 19 to 25 Years | 31 (100.0%) | 0 (0.0%) |
| 26 to 34 Years | 11 (100.0%) | 0 (0.0%) |
| 35 to 44 Years | 12 (100.0%) | 0 (0.0%) |
| 45 to 54 Years | 27 (100.0%) | 0 (0.0%) |
| 55 to 64 Years | 44 (100.0%) | 0 (0.0%) |
| 65 to 74 Years | 24 (100.0%) | 0 (0.0%) |
| 75 Years and older | 30 (100.0%) | 0 (0.0%) |
| Total | 220 (100.0%) | 0 (0.0%) |
Health Insurance Coverage by Citizenship Status in Loch Arbour
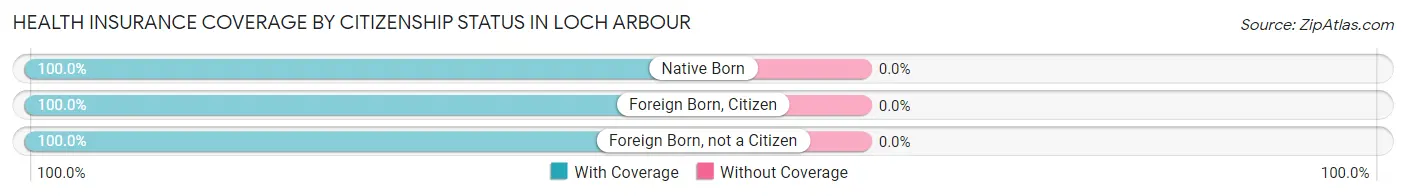
| Citizenship Status | With Coverage | Without Coverage |
| Native Born | 11 (100.0%) | 0 (0.0%) |
| Foreign Born, Citizen | 30 (100.0%) | 0 (0.0%) |
| Foreign Born, not a Citizen | 31 (100.0%) | 0 (0.0%) |
Health Insurance Coverage by Household Income in Loch Arbour
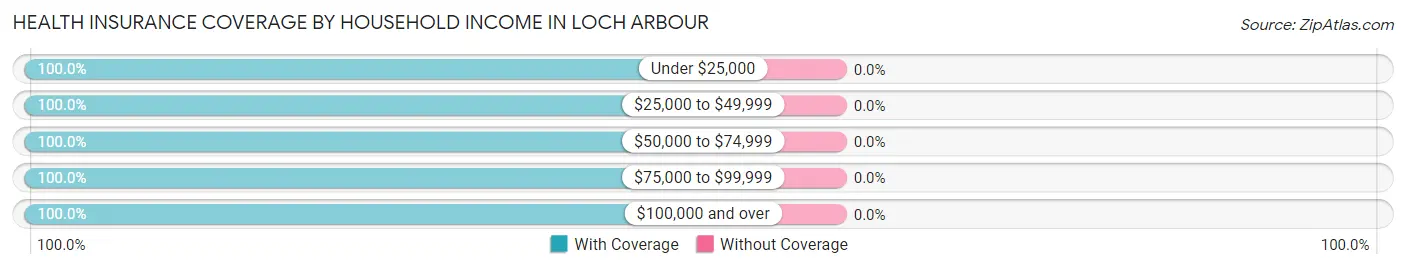
| Household Income | With Coverage | Without Coverage |
| Under $25,000 | 21 (100.0%) | 0 (0.0%) |
| $25,000 to $49,999 | 12 (100.0%) | 0 (0.0%) |
| $50,000 to $74,999 | 26 (100.0%) | 0 (0.0%) |
| $75,000 to $99,999 | 14 (100.0%) | 0 (0.0%) |
| $100,000 and over | 147 (100.0%) | 0 (0.0%) |
Public vs Private Health Insurance Coverage by Age in Loch Arbour
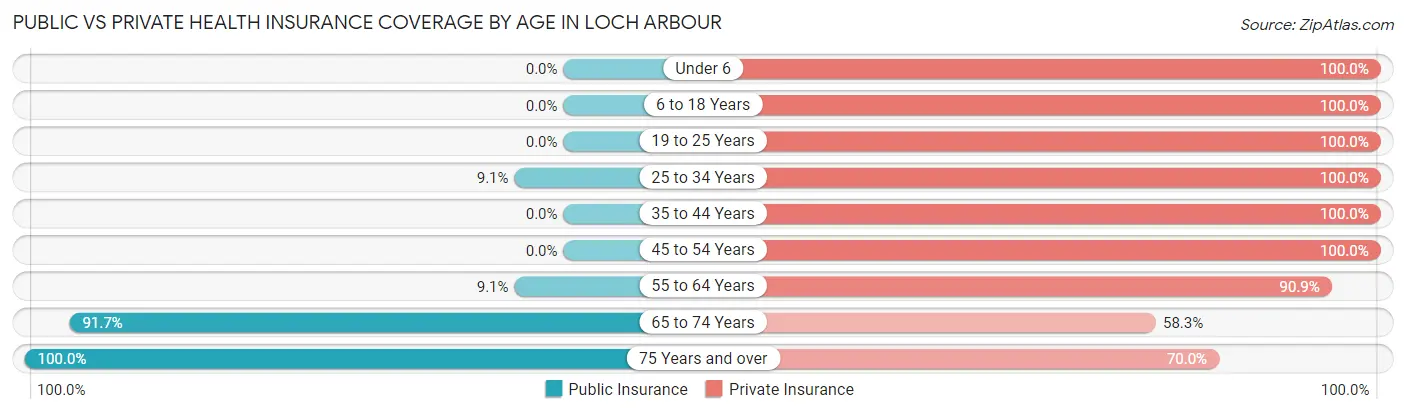
| Age Bracket | Public Insurance | Private Insurance |
| Under 6 | 0 (0.0%) | 11 (100.0%) |
| 6 to 18 Years | 0 (0.0%) | 30 (100.0%) |
| 19 to 25 Years | 0 (0.0%) | 31 (100.0%) |
| 25 to 34 Years | 1 (9.1%) | 11 (100.0%) |
| 35 to 44 Years | 0 (0.0%) | 12 (100.0%) |
| 45 to 54 Years | 0 (0.0%) | 27 (100.0%) |
| 55 to 64 Years | 4 (9.1%) | 40 (90.9%) |
| 65 to 74 Years | 22 (91.7%) | 14 (58.3%) |
| 75 Years and over | 30 (100.0%) | 21 (70.0%) |
| Total | 57 (25.9%) | 197 (89.5%) |
Disability Status by Sex by Age in Loch Arbour
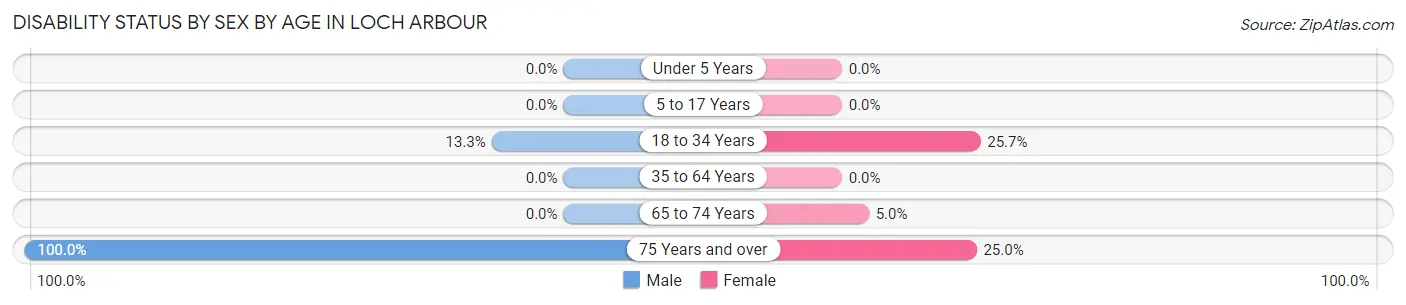
| Age Bracket | Male | Female |
| Under 5 Years | 0 (0.0%) | 0 (0.0%) |
| 5 to 17 Years | 0 (0.0%) | 0 (0.0%) |
| 18 to 34 Years | 2 (13.3%) | 9 (25.7%) |
| 35 to 64 Years | 0 (0.0%) | 0 (0.0%) |
| 65 to 74 Years | 0 (0.0%) | 1 (5.0%) |
| 75 Years and over | 18 (100.0%) | 3 (25.0%) |
Disability Class by Sex by Age in Loch Arbour
Disability Class: Hearing Difficulty
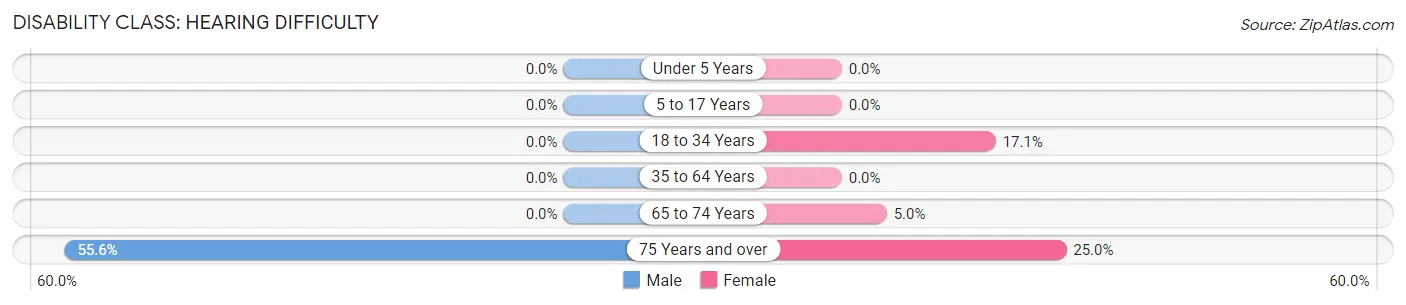
| Age Bracket | Male | Female |
| Under 5 Years | 0 (0.0%) | 0 (0.0%) |
| 5 to 17 Years | 0 (0.0%) | 0 (0.0%) |
| 18 to 34 Years | 0 (0.0%) | 6 (17.1%) |
| 35 to 64 Years | 0 (0.0%) | 0 (0.0%) |
| 65 to 74 Years | 0 (0.0%) | 1 (5.0%) |
| 75 Years and over | 10 (55.6%) | 3 (25.0%) |
Disability Class: Vision Difficulty
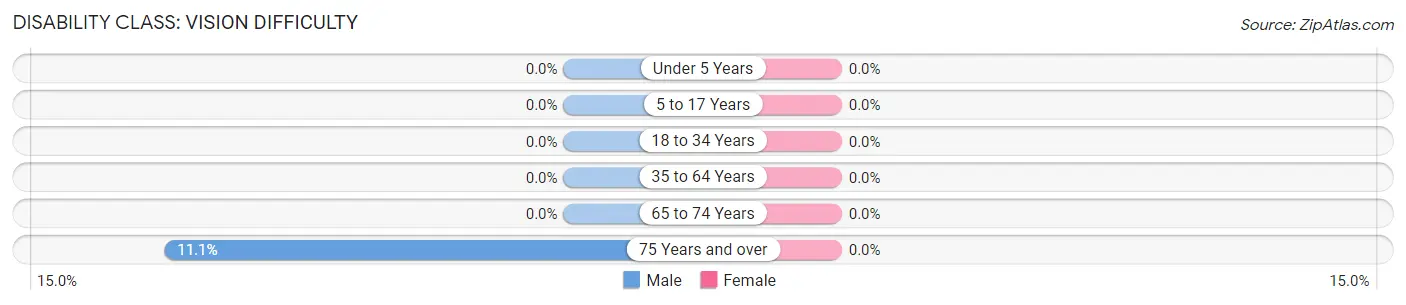
| Age Bracket | Male | Female |
| Under 5 Years | 0 (0.0%) | 0 (0.0%) |
| 5 to 17 Years | 0 (0.0%) | 0 (0.0%) |
| 18 to 34 Years | 0 (0.0%) | 0 (0.0%) |
| 35 to 64 Years | 0 (0.0%) | 0 (0.0%) |
| 65 to 74 Years | 0 (0.0%) | 0 (0.0%) |
| 75 Years and over | 2 (11.1%) | 0 (0.0%) |
Disability Class: Cognitive Difficulty
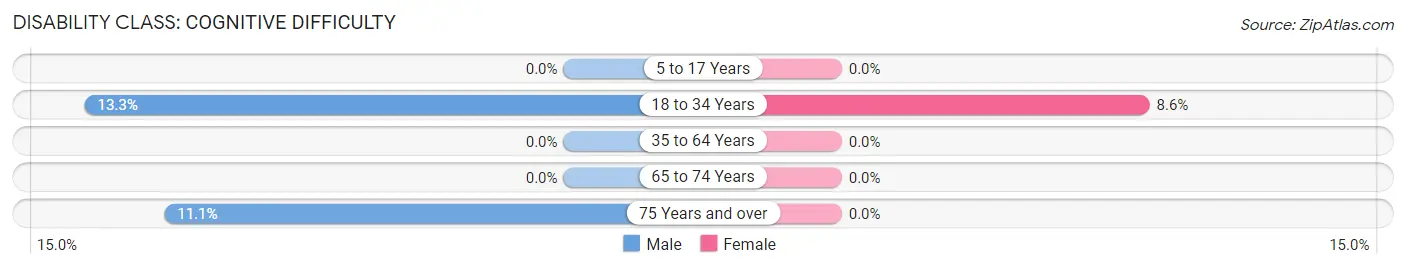
| Age Bracket | Male | Female |
| 5 to 17 Years | 0 (0.0%) | 0 (0.0%) |
| 18 to 34 Years | 2 (13.3%) | 3 (8.6%) |
| 35 to 64 Years | 0 (0.0%) | 0 (0.0%) |
| 65 to 74 Years | 0 (0.0%) | 0 (0.0%) |
| 75 Years and over | 2 (11.1%) | 0 (0.0%) |
Disability Class: Ambulatory Difficulty
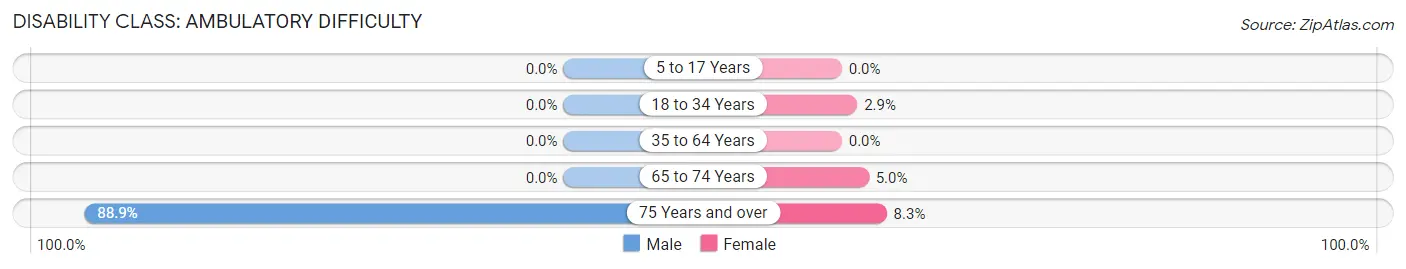
| Age Bracket | Male | Female |
| 5 to 17 Years | 0 (0.0%) | 0 (0.0%) |
| 18 to 34 Years | 0 (0.0%) | 1 (2.9%) |
| 35 to 64 Years | 0 (0.0%) | 0 (0.0%) |
| 65 to 74 Years | 0 (0.0%) | 1 (5.0%) |
| 75 Years and over | 16 (88.9%) | 1 (8.3%) |
Disability Class: Self-Care Difficulty
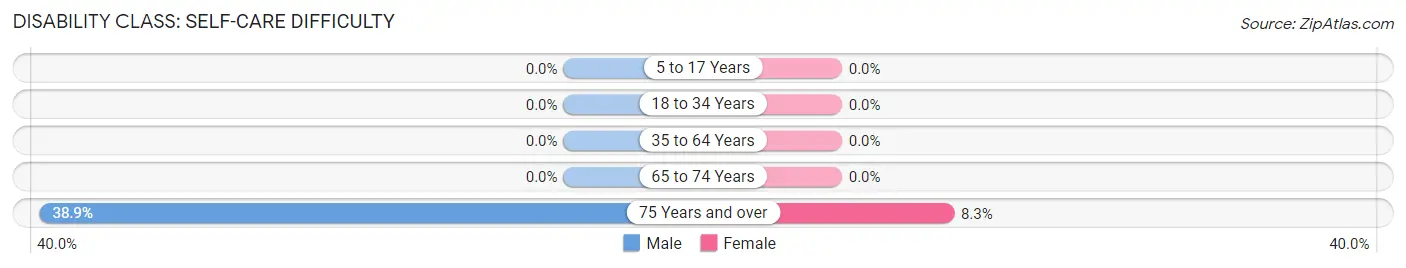
| Age Bracket | Male | Female |
| 5 to 17 Years | 0 (0.0%) | 0 (0.0%) |
| 18 to 34 Years | 0 (0.0%) | 0 (0.0%) |
| 35 to 64 Years | 0 (0.0%) | 0 (0.0%) |
| 65 to 74 Years | 0 (0.0%) | 0 (0.0%) |
| 75 Years and over | 7 (38.9%) | 1 (8.3%) |
Technology Access in Loch Arbour
Computing Device Access in Loch Arbour
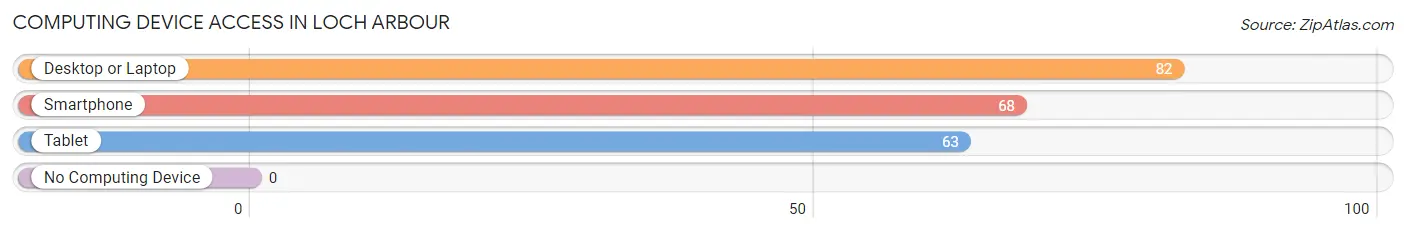
| Device Type | # Households | % Households |
| Desktop or Laptop | 82 | 97.6% |
| Smartphone | 68 | 80.9% |
| Tablet | 63 | 75.0% |
| No Computing Device | 0 | 0.0% |
| Total | 84 | 100.0% |
Internet Access in Loch Arbour
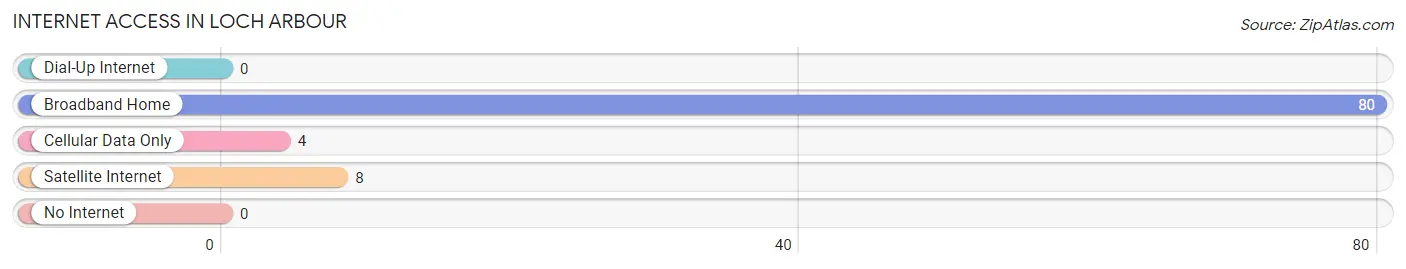
| Internet Type | # Households | % Households |
| Dial-Up Internet | 0 | 0.0% |
| Broadband Home | 80 | 95.2% |
| Cellular Data Only | 4 | 4.8% |
| Satellite Internet | 8 | 9.5% |
| No Internet | 0 | 0.0% |
| Total | 84 | 100.0% |
Loch Arbour Summary
Loch Arbour is a small village located in Monmouth County, New Jersey. It is situated on the Atlantic Ocean, just south of Asbury Park. The village has a population of just over 200 people and covers an area of 0.2 square miles.
History
Loch Arbour was originally part of Ocean Township, which was established in 1849. In 1894, the village was incorporated as a separate municipality. The name “Loch Arbour” is derived from the Scottish term for “lake of the harbor”. The village was named after the nearby Loch Arbour in Scotland.
The village was a popular summer resort destination in the late 19th and early 20th centuries. It was known for its beautiful beaches and boardwalk. The village was also home to several large hotels, including the Loch Arbour Hotel and the Oceanic Hotel.
Geography
Loch Arbour is located at 40°17'25"N, 74°02'45"W (40.290278, -74.045556). It is situated on the Atlantic Ocean, just south of Asbury Park. The village is bordered by Allenhurst to the north, Deal to the east, and Ocean Township to the south and west.
The village is located on a barrier island, which is separated from the mainland by the Shark River. The village is located on the northern end of the island, which is known as the “Loch Arbour Neck”. The village is surrounded by the Shark River Estuary, which is a popular spot for fishing and boating.
Economy
The economy of Loch Arbour is largely based on tourism. The village is home to several small businesses, including restaurants, shops, and bed and breakfasts. The village is also home to a marina, which offers boat rentals and fishing charters.
The village is also home to several large employers, including the Monmouth County Park System and the Monmouth County Library System. The village is also home to several private schools, including the Ranney School and the Ranney School Summer Camp.
Demographics
As of the 2010 census, the population of Loch Arbour was 203. The racial makeup of the village was 97.5% White, 0.5% African American, 0.5% Asian, and 1.5% from two or more races. The median household income was $90,000, and the median family income was $100,000.
The village is home to a large number of retirees, with nearly 40% of the population over the age of 65. The village is also home to a large number of families, with nearly 30% of the population under the age of 18.
Conclusion
Loch Arbour is a small village located in Monmouth County, New Jersey. It is situated on the Atlantic Ocean, just south of Asbury Park. The village has a population of just over 200 people and covers an area of 0.2 square miles. The economy of the village is largely based on tourism, and the village is home to several small businesses, large employers, and private schools. The village is also home to a large number of retirees and families.
Common Questions
What is Per Capita Income in Loch Arbour?
Per Capita income in Loch Arbour is $68,603.
What is the Median Family Income in Loch Arbour?
Median Family Income in Loch Arbour is $162,083.
What is the Median Household income in Loch Arbour?
Median Household Income in Loch Arbour is $122,500.
What is Inequality or Gini Index in Loch Arbour?
Inequality or Gini Index in Loch Arbour is 0.47.
What is the Total Population of Loch Arbour?
Total Population of Loch Arbour is 220.
What is the Total Male Population of Loch Arbour?
Total Male Population of Loch Arbour is 90.
What is the Total Female Population of Loch Arbour?
Total Female Population of Loch Arbour is 130.
What is the Ratio of Males per 100 Females in Loch Arbour?
There are 69.23 Males per 100 Females in Loch Arbour.
What is the Ratio of Females per 100 Males in Loch Arbour?
There are 144.44 Females per 100 Males in Loch Arbour.
What is the Median Population Age in Loch Arbour?
Median Population Age in Loch Arbour is 51.0 Years.
What is the Average Family Size in Loch Arbour
Average Family Size in Loch Arbour is 3.3 People.
What is the Average Household Size in Loch Arbour
Average Household Size in Loch Arbour is 2.6 People.
How Large is the Labor Force in Loch Arbour?
There are 107 People in the Labor Forcein in Loch Arbour.
What is the Percentage of People in the Labor Force in Loch Arbour?
56.3% of People are in the Labor Force in Loch Arbour.
What is the Unemployment Rate in Loch Arbour?
Unemployment Rate in Loch Arbour is 8.4%.