Englewood Cliffs borough, NJ Map & Demographics
Englewood Cliffs borough Overview
$102,113
PER CAPITA INCOME
$250,001
AVG FAMILY INCOME
$213,261
AVG HOUSEHOLD INCOME
44.2%
WAGE / INCOME GAP [ % ]
55.8¢/ $1
WAGE / INCOME GAP [ $ ]
0.51
INEQUALITY / GINI INDEX
5,347
TOTAL POPULATION
2,627
MALE POPULATION
2,720
FEMALE POPULATION
96.58
MALES / 100 FEMALES
103.54
FEMALES / 100 MALES
49.0
MEDIAN AGE
3.2
AVG FAMILY SIZE
2.9
AVG HOUSEHOLD SIZE
2,842
LABOR FORCE [ PEOPLE ]
65.0%
PERCENT IN LABOR FORCE
6.8%
UNEMPLOYMENT RATE
Income in Englewood Cliffs borough
Income Overview in Englewood Cliffs borough
Per Capita Income in Englewood Cliffs borough is $102,113, while median incomes of families and households are $250,001 and $213,261 respectively.
| Characteristic | Number | Measure |
| Per Capita Income | 5,347 | $102,113 |
| Median Family Income | 1,581 | $250,001 |
| Mean Family Income | 1,581 | $339,965 |
| Median Household Income | 1,860 | $213,261 |
| Mean Household Income | 1,860 | $301,952 |
| Income Deficit | 1,581 | $0 |
| Wage / Income Gap (%) | 5,347 | 44.24% |
| Wage / Income Gap ($) | 5,347 | 55.76¢ per $1 |
| Gini / Inequality Index | 5,347 | 0.51 |
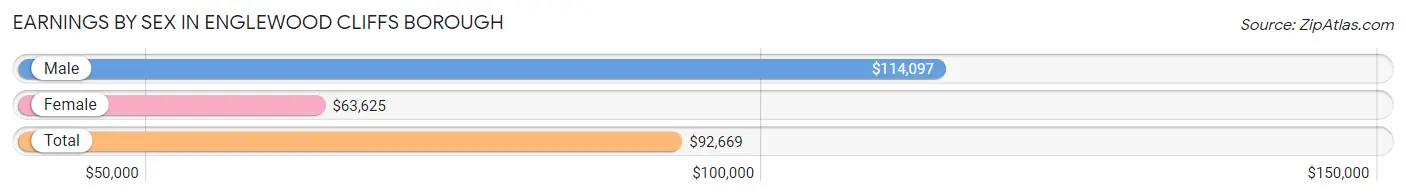
Earnings by Sex in Englewood Cliffs borough
Average Earnings in Englewood Cliffs borough are $92,669, $114,097 for men and $63,625 for women, a difference of 44.2%.
| Sex | Number | Average Earnings |
| Male | 1,539 (53.2%) | $114,097 |
| Female | 1,356 (46.8%) | $63,625 |
| Total | 2,895 (100.0%) | $92,669 |
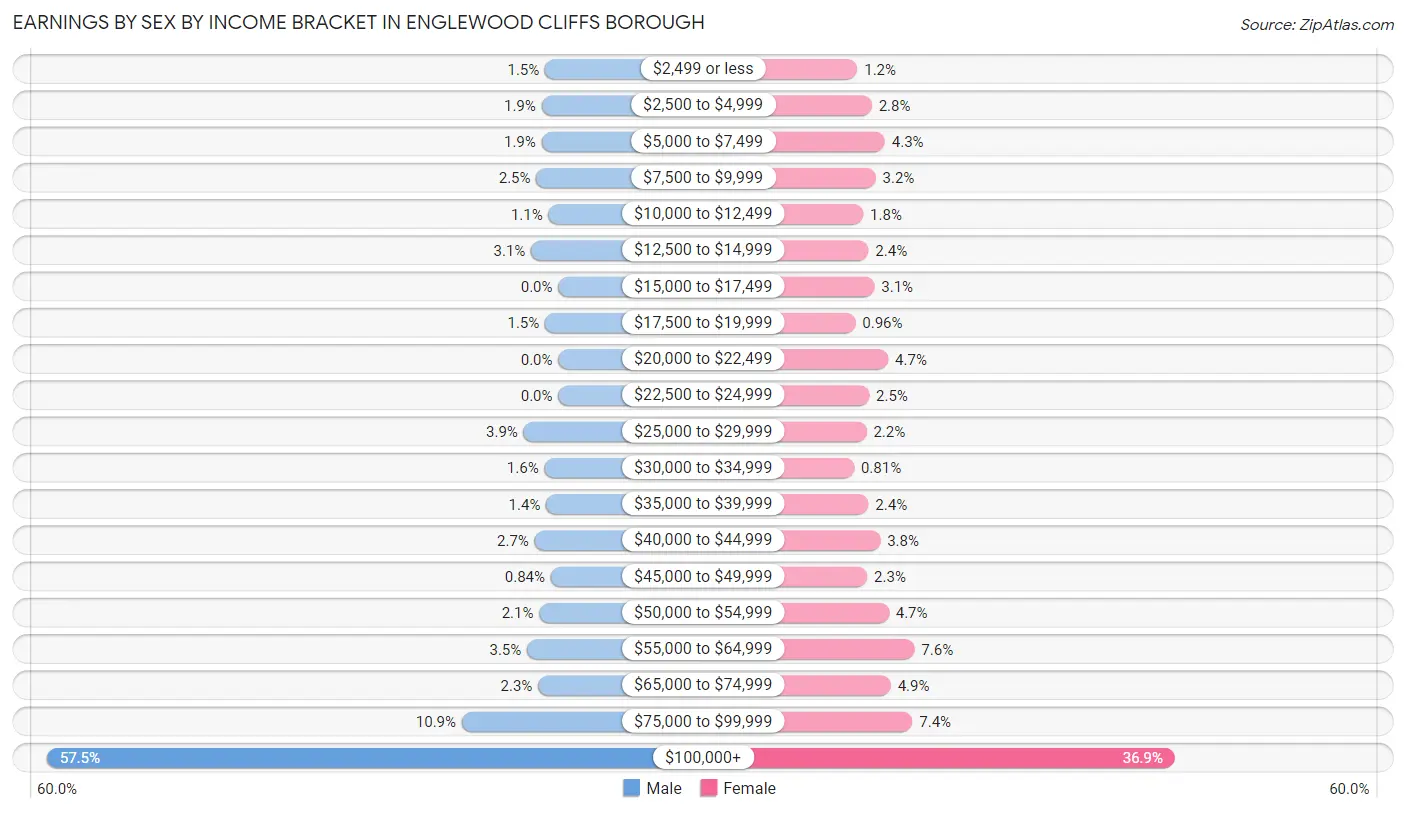
Earnings by Sex by Income Bracket in Englewood Cliffs borough
The most common earnings brackets in Englewood Cliffs borough are $100,000+ for men (885 | 57.5%) and $100,000+ for women (500 | 36.9%).
| Income | Male | Female |
| $2,499 or less | 23 (1.5%) | 16 (1.2%) |
| $2,500 to $4,999 | 29 (1.9%) | 38 (2.8%) |
| $5,000 to $7,499 | 29 (1.9%) | 58 (4.3%) |
| $7,500 to $9,999 | 38 (2.5%) | 44 (3.2%) |
| $10,000 to $12,499 | 17 (1.1%) | 25 (1.8%) |
| $12,500 to $14,999 | 47 (3.0%) | 33 (2.4%) |
| $15,000 to $17,499 | 0 (0.0%) | 42 (3.1%) |
| $17,500 to $19,999 | 23 (1.5%) | 13 (1.0%) |
| $20,000 to $22,499 | 0 (0.0%) | 63 (4.6%) |
| $22,500 to $24,999 | 0 (0.0%) | 34 (2.5%) |
| $25,000 to $29,999 | 60 (3.9%) | 30 (2.2%) |
| $30,000 to $34,999 | 24 (1.6%) | 11 (0.8%) |
| $35,000 to $39,999 | 21 (1.4%) | 33 (2.4%) |
| $40,000 to $44,999 | 41 (2.7%) | 51 (3.8%) |
| $45,000 to $49,999 | 13 (0.8%) | 31 (2.3%) |
| $50,000 to $54,999 | 33 (2.1%) | 64 (4.7%) |
| $55,000 to $64,999 | 54 (3.5%) | 103 (7.6%) |
| $65,000 to $74,999 | 35 (2.3%) | 67 (4.9%) |
| $75,000 to $99,999 | 167 (10.8%) | 100 (7.4%) |
| $100,000+ | 885 (57.5%) | 500 (36.9%) |
| Total | 1,539 (100.0%) | 1,356 (100.0%) |
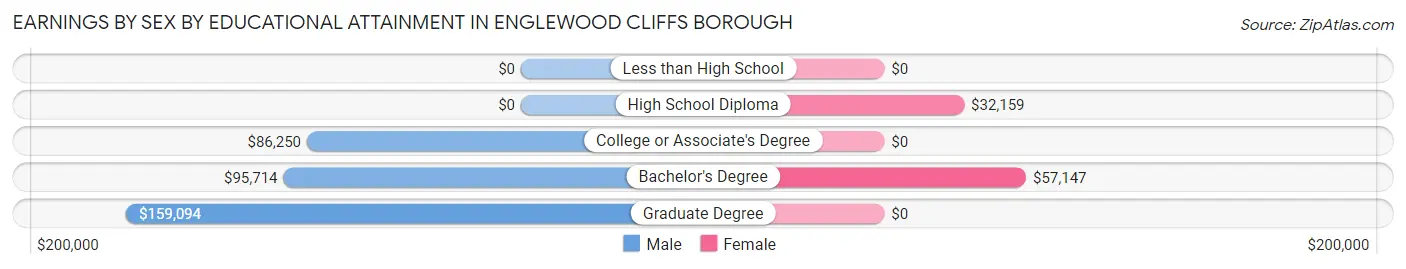
Earnings by Sex by Educational Attainment in Englewood Cliffs borough
Average earnings in Englewood Cliffs borough are $118,036 for men and $69,855 for women, a difference of 40.8%. Men with an educational attainment of graduate degree enjoy the highest average annual earnings of $159,094, while those with college or associate's degree education earn the least with $86,250. Women with an educational attainment of bachelor's degree earn the most with the average annual earnings of $57,147, while those with high school diploma education have the smallest earnings of $32,159.
| Educational Attainment | Male Income | Female Income |
| Less than High School | - | - |
| High School Diploma | - | - |
| College or Associate's Degree | $86,250 | $0 |
| Bachelor's Degree | $95,714 | $57,147 |
| Graduate Degree | $159,094 | $0 |
| Total | $118,036 | $69,855 |
Family Income in Englewood Cliffs borough
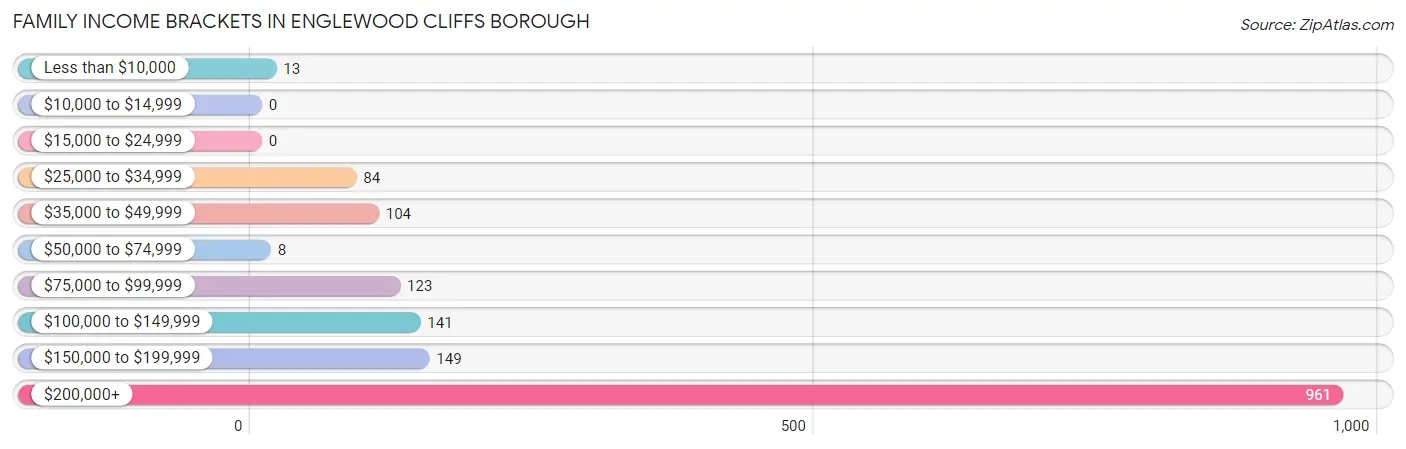
Family Income Brackets in Englewood Cliffs borough
According to the Englewood Cliffs borough family income data, there are 961 families falling into the $200,000+ income range, which is the most common income bracket and makes up 60.8% of all families.
| Income Bracket | # Families | % Families |
| Less than $10,000 | 13 | 0.8% |
| $10,000 to $14,999 | 0 | 0.0% |
| $15,000 to $24,999 | 0 | 0.0% |
| $25,000 to $34,999 | 84 | 5.3% |
| $35,000 to $49,999 | 104 | 6.6% |
| $50,000 to $74,999 | 8 | 0.5% |
| $75,000 to $99,999 | 123 | 7.8% |
| $100,000 to $149,999 | 141 | 8.9% |
| $150,000 to $199,999 | 149 | 9.4% |
| $200,000+ | 961 | 60.8% |
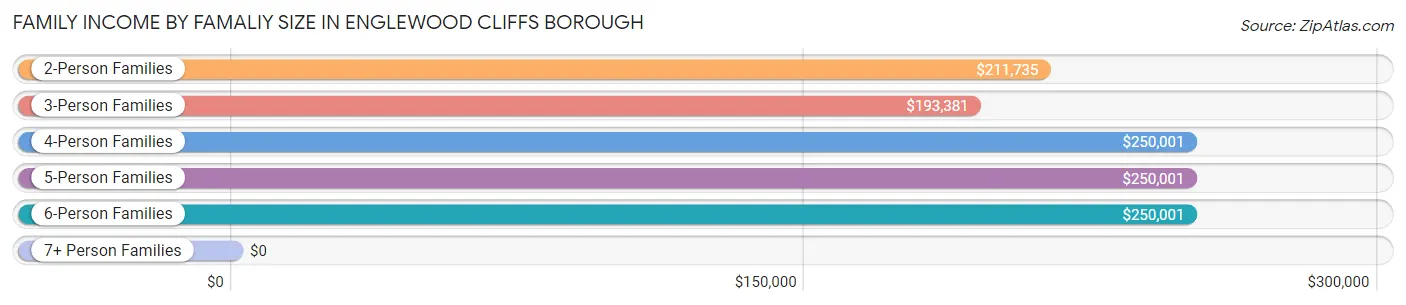
Family Income by Famaliy Size in Englewood Cliffs borough
4-person families (455 | 28.8%) account for the highest median family income in Englewood Cliffs borough with $250,001 per family, while 2-person families (530 | 33.5%) have the highest median income of $105,868 per family member.
| Income Bracket | # Families | Median Income |
| 2-Person Families | 530 (33.5%) | $211,735 |
| 3-Person Families | 443 (28.0%) | $193,381 |
| 4-Person Families | 455 (28.8%) | $250,001 |
| 5-Person Families | 92 (5.8%) | $250,001 |
| 6-Person Families | 53 (3.4%) | $250,001 |
| 7+ Person Families | 8 (0.5%) | $0 |
| Total | 1,581 (100.0%) | $250,001 |
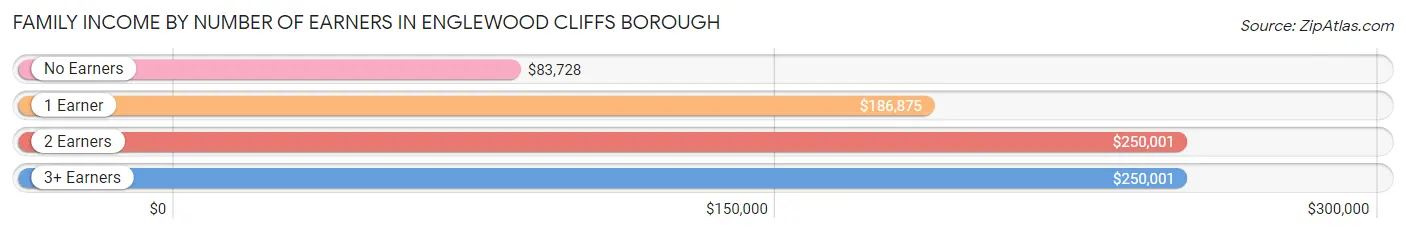
Family Income by Number of Earners in Englewood Cliffs borough
The median family income in Englewood Cliffs borough is $250,001, with families comprising 2 earners (615) having the highest median family income of $250,001, while families with no earners (199) have the lowest median family income of $83,728, accounting for 38.9% and 12.6% of families, respectively.
| Number of Earners | # Families | Median Income |
| No Earners | 199 (12.6%) | $83,728 |
| 1 Earner | 441 (27.9%) | $186,875 |
| 2 Earners | 615 (38.9%) | $250,001 |
| 3+ Earners | 326 (20.6%) | $250,001 |
| Total | 1,581 (100.0%) | $250,001 |
Household Income in Englewood Cliffs borough
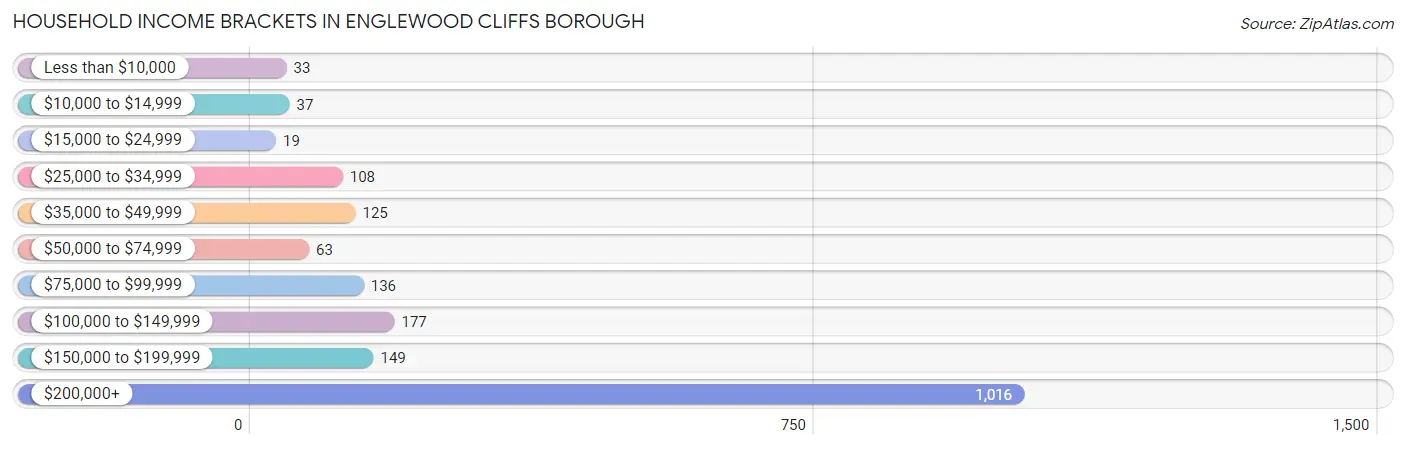
Household Income Brackets in Englewood Cliffs borough
With 1,016 households falling in the category, the $200,000+ income range is the most frequent in Englewood Cliffs borough, accounting for 54.6% of all households. In contrast, only 19 households (1.0%) fall into the $15,000 to $24,999 income bracket, making it the least populous group.
| Income Bracket | # Households | % Households |
| Less than $10,000 | 33 | 1.8% |
| $10,000 to $14,999 | 37 | 2.0% |
| $15,000 to $24,999 | 19 | 1.0% |
| $25,000 to $34,999 | 108 | 5.8% |
| $35,000 to $49,999 | 125 | 6.7% |
| $50,000 to $74,999 | 63 | 3.4% |
| $75,000 to $99,999 | 136 | 7.3% |
| $100,000 to $149,999 | 177 | 9.5% |
| $150,000 to $199,999 | 149 | 8.0% |
| $200,000+ | 1,016 | 54.6% |
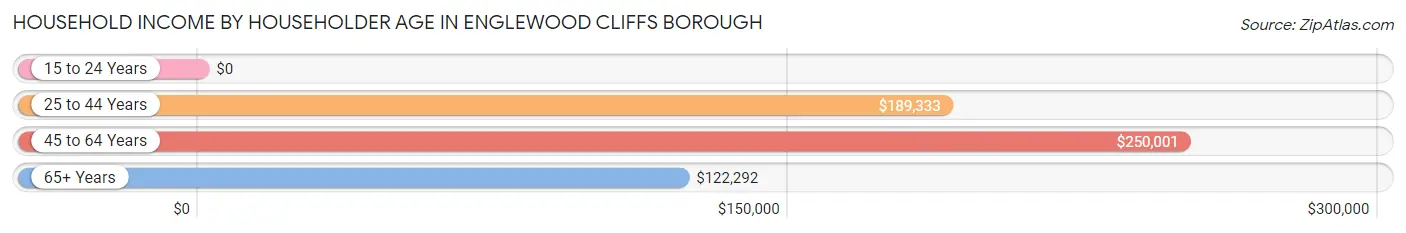
Household Income by Householder Age in Englewood Cliffs borough
The median household income in Englewood Cliffs borough is $213,261, with the highest median household income of $250,001 found in the 45 to 64 years age bracket for the primary householder. A total of 964 households (51.8%) fall into this category.
| Income Bracket | # Households | Median Income |
| 15 to 24 Years | 0 (0.0%) | $0 |
| 25 to 44 Years | 332 (17.8%) | $189,333 |
| 45 to 64 Years | 964 (51.8%) | $250,001 |
| 65+ Years | 564 (30.3%) | $122,292 |
| Total | 1,860 (100.0%) | $213,261 |
Poverty in Englewood Cliffs borough
Income Below Poverty by Sex and Age in Englewood Cliffs borough
With 1.3% poverty level for males and 3.1% for females among the residents of Englewood Cliffs borough, 75 year old and over males and 75 year old and over females are the most vulnerable to poverty, with 23 males (14.3%) and 39 females (10.8%) in their respective age groups living below the poverty level.
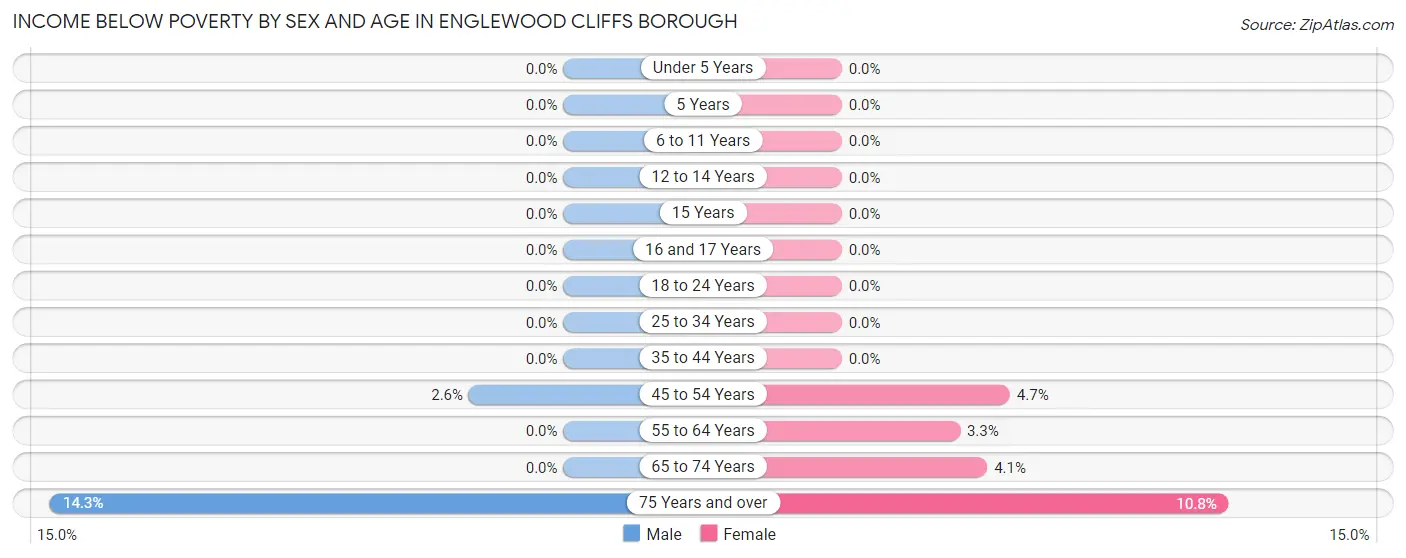
| Age Bracket | Male | Female |
| Under 5 Years | 0 (0.0%) | 0 (0.0%) |
| 5 Years | 0 (0.0%) | 0 (0.0%) |
| 6 to 11 Years | 0 (0.0%) | 0 (0.0%) |
| 12 to 14 Years | 0 (0.0%) | 0 (0.0%) |
| 15 Years | 0 (0.0%) | 0 (0.0%) |
| 16 and 17 Years | 0 (0.0%) | 0 (0.0%) |
| 18 to 24 Years | 0 (0.0%) | 0 (0.0%) |
| 25 to 34 Years | 0 (0.0%) | 0 (0.0%) |
| 35 to 44 Years | 0 (0.0%) | 0 (0.0%) |
| 45 to 54 Years | 12 (2.6%) | 19 (4.7%) |
| 55 to 64 Years | 0 (0.0%) | 17 (3.3%) |
| 65 to 74 Years | 0 (0.0%) | 10 (4.1%) |
| 75 Years and over | 23 (14.3%) | 39 (10.8%) |
| Total | 35 (1.3%) | 85 (3.1%) |
Income Above Poverty by Sex and Age in Englewood Cliffs borough
According to the poverty statistics in Englewood Cliffs borough, males aged under 5 years and females aged under 5 years are the age groups that are most secure financially, with 100.0% of males and 100.0% of females in these age groups living above the poverty line.
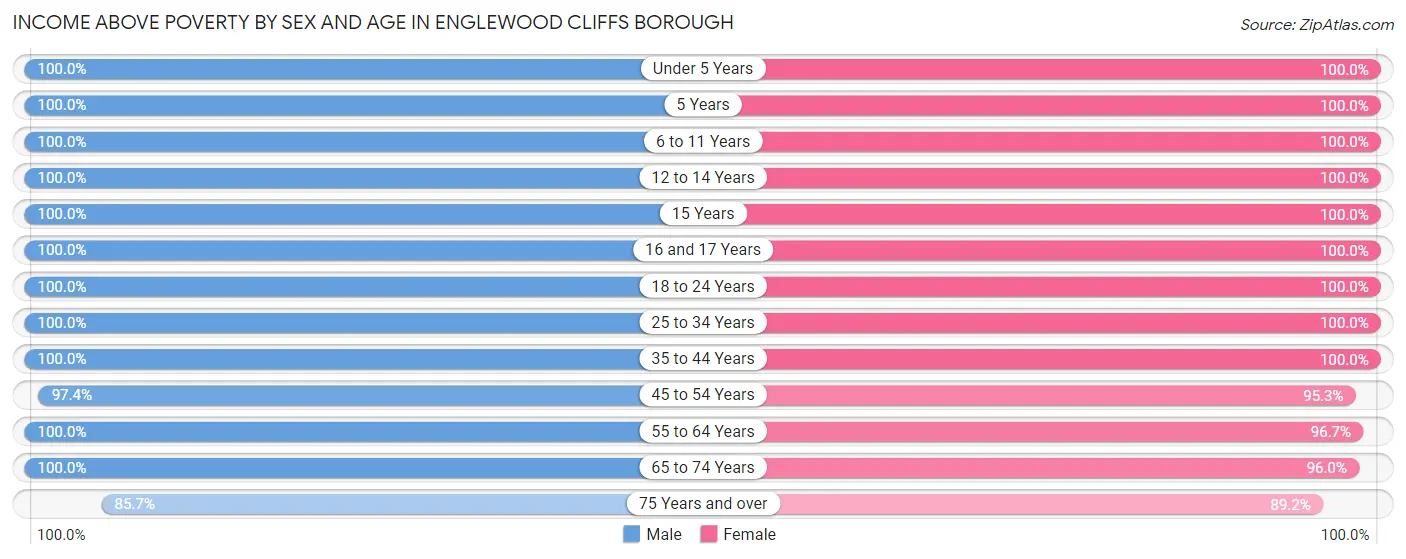
| Age Bracket | Male | Female |
| Under 5 Years | 92 (100.0%) | 117 (100.0%) |
| 5 Years | 15 (100.0%) | 10 (100.0%) |
| 6 to 11 Years | 234 (100.0%) | 252 (100.0%) |
| 12 to 14 Years | 160 (100.0%) | 41 (100.0%) |
| 15 Years | 7 (100.0%) | 35 (100.0%) |
| 16 and 17 Years | 159 (100.0%) | 21 (100.0%) |
| 18 to 24 Years | 158 (100.0%) | 130 (100.0%) |
| 25 to 34 Years | 133 (100.0%) | 161 (100.0%) |
| 35 to 44 Years | 258 (100.0%) | 421 (100.0%) |
| 45 to 54 Years | 445 (97.4%) | 387 (95.3%) |
| 55 to 64 Years | 469 (100.0%) | 500 (96.7%) |
| 65 to 74 Years | 313 (100.0%) | 237 (96.0%) |
| 75 Years and over | 138 (85.7%) | 323 (89.2%) |
| Total | 2,581 (98.7%) | 2,635 (96.9%) |
Income Below Poverty Among Married-Couple Families in Englewood Cliffs borough
The poverty statistics for married-couple families in Englewood Cliffs borough show that 0.9% or 12 of the total 1,393 families live below the poverty line. Families with no children have the highest poverty rate of 1.5%, comprising of 12 families. On the other hand, families with 1 or 2 children have the lowest poverty rate of 0.0%, which includes 0 families.
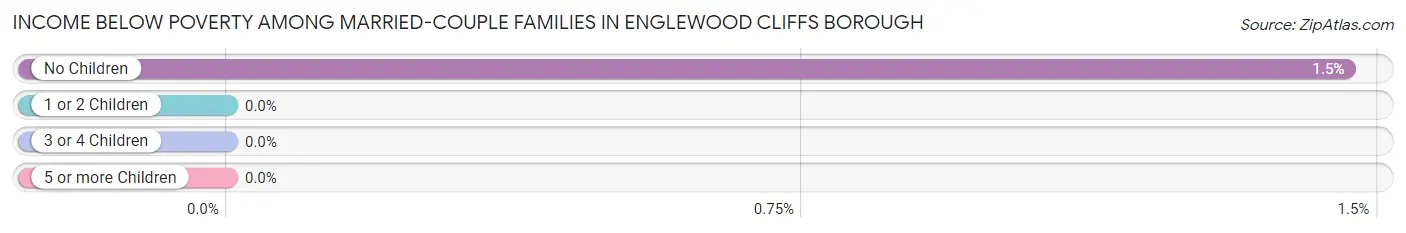
| Children | Above Poverty | Below Poverty |
| No Children | 811 (98.5%) | 12 (1.5%) |
| 1 or 2 Children | 475 (100.0%) | 0 (0.0%) |
| 3 or 4 Children | 95 (100.0%) | 0 (0.0%) |
| 5 or more Children | 0 (0.0%) | 0 (0.0%) |
| Total | 1,381 (99.1%) | 12 (0.9%) |
Income Below Poverty Among Single-Parent Households in Englewood Cliffs borough
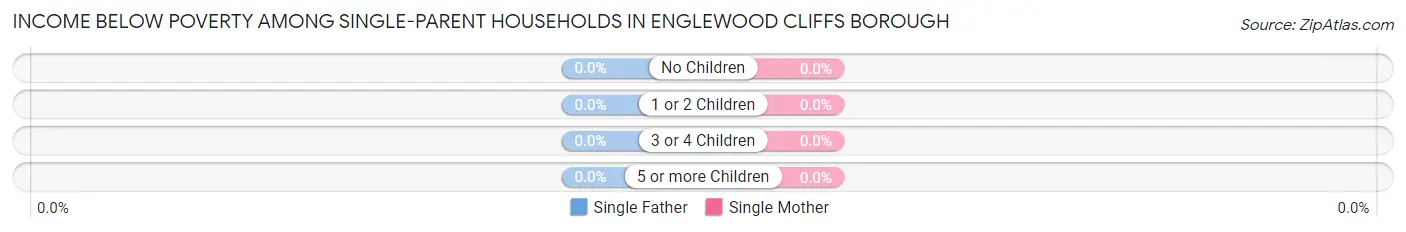
| Children | Single Father | Single Mother |
| No Children | 0 (0.0%) | 0 (0.0%) |
| 1 or 2 Children | 0 (0.0%) | 0 (0.0%) |
| 3 or 4 Children | 0 (0.0%) | 0 (0.0%) |
| 5 or more Children | 0 (0.0%) | 0 (0.0%) |
| Total | 0 (0.0%) | 0 (0.0%) |
Income Below Poverty Among Married-Couple vs Single-Parent Households in Englewood Cliffs borough
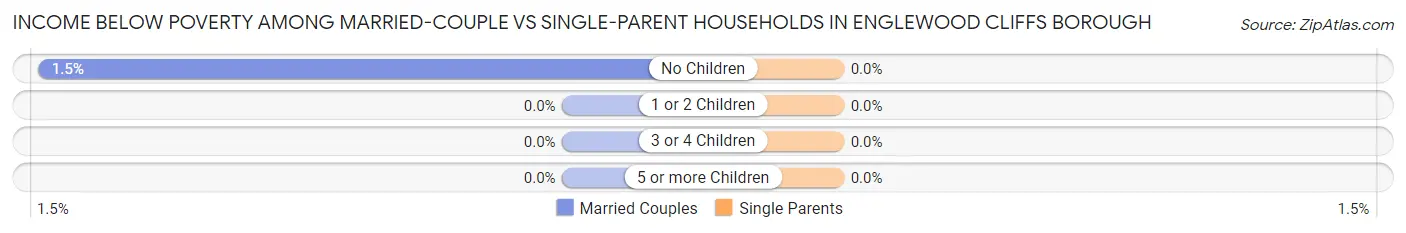
| Children | Married-Couple Families | Single-Parent Households |
| No Children | 12 (1.5%) | 0 (0.0%) |
| 1 or 2 Children | 0 (0.0%) | 0 (0.0%) |
| 3 or 4 Children | 0 (0.0%) | 0 (0.0%) |
| 5 or more Children | 0 (0.0%) | 0 (0.0%) |
| Total | 12 (0.9%) | 0 (0.0%) |
Race in Englewood Cliffs borough
The most populous races in Englewood Cliffs borough are White / Caucasian (2,466 | 46.1%), Asian (2,303 | 43.1%), and Hispanic or Latino (511 | 9.6%).
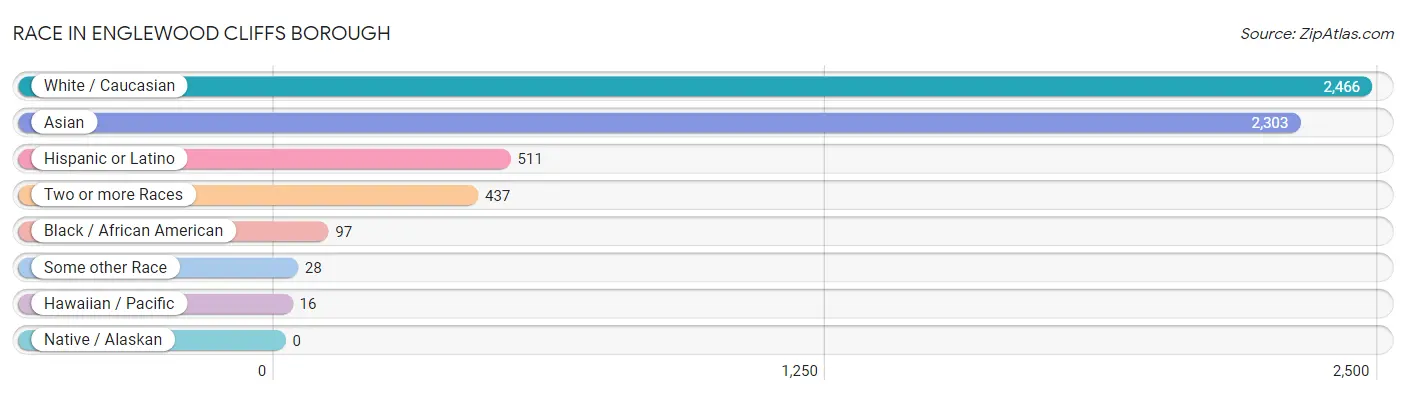
| Race | # Population | % Population |
| Asian | 2,303 | 43.1% |
| Black / African American | 97 | 1.8% |
| Hawaiian / Pacific | 16 | 0.3% |
| Hispanic or Latino | 511 | 9.6% |
| Native / Alaskan | 0 | 0.0% |
| White / Caucasian | 2,466 | 46.1% |
| Two or more Races | 437 | 8.2% |
| Some other Race | 28 | 0.5% |
| Total | 5,347 | 100.0% |
Ancestry in Englewood Cliffs borough
The most populous ancestries reported in Englewood Cliffs borough are Burmese (1,054 | 19.7%), Indian (Asian) (659 | 12.3%), Italian (655 | 12.2%), Korean (300 | 5.6%), and Thai (291 | 5.4%), together accounting for 55.3% of all Englewood Cliffs borough residents.
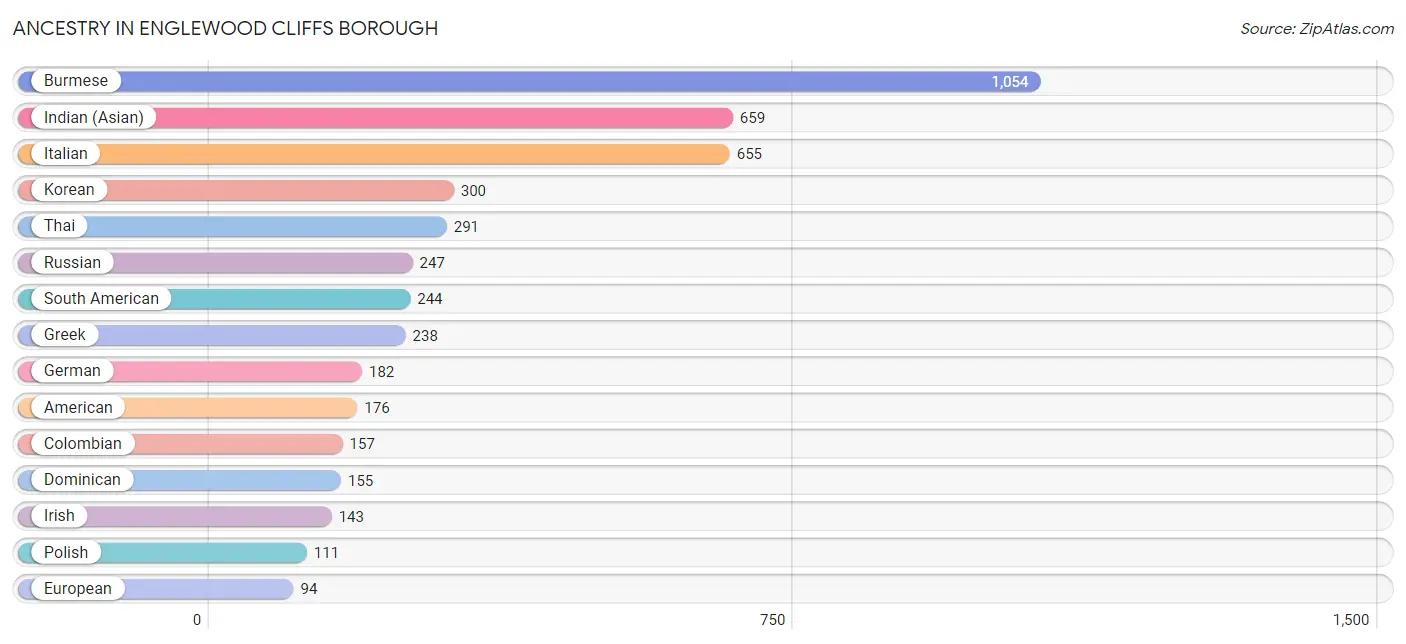
| Ancestry | # Population | % Population |
| American | 176 | 3.3% |
| Arab | 14 | 0.3% |
| Argentinean | 50 | 0.9% |
| Armenian | 72 | 1.3% |
| Bhutanese | 60 | 1.1% |
| Burmese | 1,054 | 19.7% |
| Chilean | 37 | 0.7% |
| Colombian | 157 | 2.9% |
| Cuban | 45 | 0.8% |
| Cypriot | 46 | 0.9% |
| Czechoslovakian | 19 | 0.4% |
| Dominican | 155 | 2.9% |
| Eastern European | 10 | 0.2% |
| English | 31 | 0.6% |
| European | 94 | 1.8% |
| French | 27 | 0.5% |
| German | 182 | 3.4% |
| Greek | 238 | 4.4% |
| Hungarian | 40 | 0.7% |
| Indian (Asian) | 659 | 12.3% |
| Iranian | 71 | 1.3% |
| Irish | 143 | 2.7% |
| Italian | 655 | 12.2% |
| Korean | 300 | 5.6% |
| Native Hawaiian | 11 | 0.2% |
| New Zealander | 42 | 0.8% |
| Northern European | 14 | 0.3% |
| Palestinian | 14 | 0.3% |
| Polish | 111 | 2.1% |
| Puerto Rican | 58 | 1.1% |
| Russian | 247 | 4.6% |
| Scottish | 20 | 0.4% |
| South American | 244 | 4.6% |
| Sri Lankan | 94 | 1.8% |
| Swedish | 12 | 0.2% |
| Thai | 291 | 5.4% |
| Ukrainian | 36 | 0.7% | View All 37 Rows |
Immigrants in Englewood Cliffs borough
The most numerous immigrant groups reported in Englewood Cliffs borough came from Asia (1,799 | 33.7%), Eastern Asia (1,105 | 20.7%), Korea (696 | 13.0%), Europe (408 | 7.6%), and China (382 | 7.1%), together accounting for 82.1% of all Englewood Cliffs borough residents.
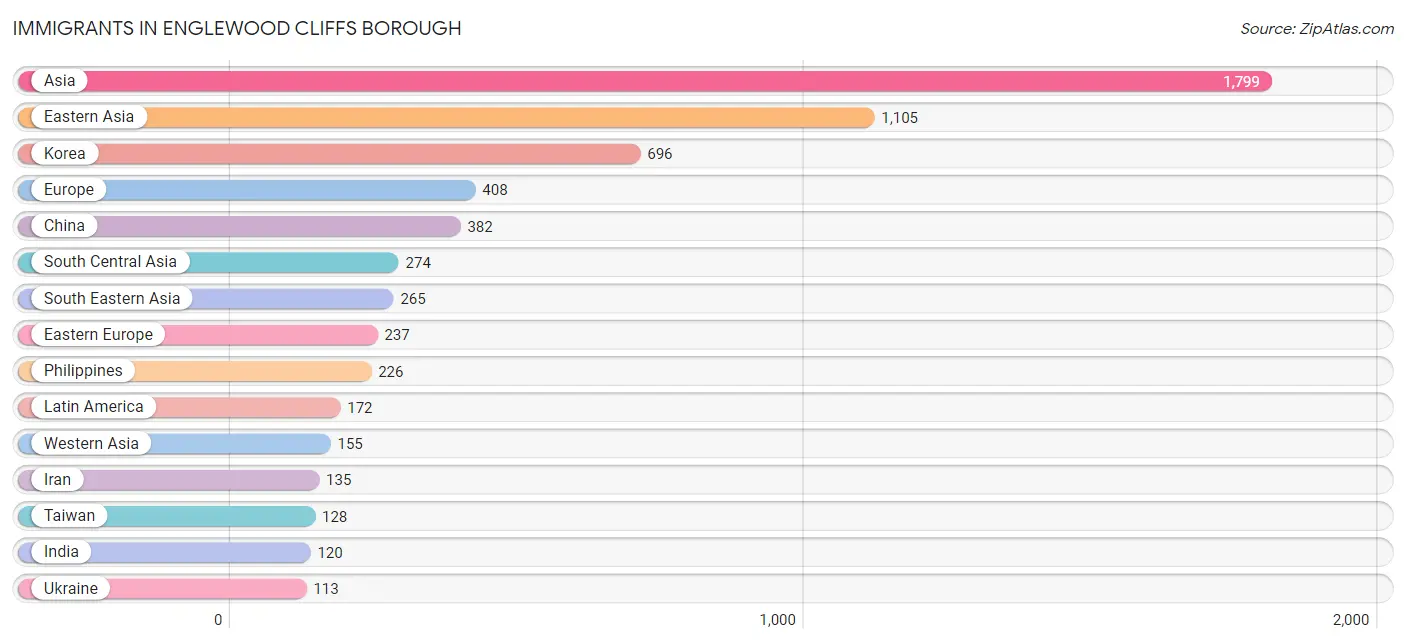
| Immigration Origin | # Population | % Population |
| Africa | 44 | 0.8% |
| Argentina | 34 | 0.6% |
| Asia | 1,799 | 33.7% |
| Australia | 28 | 0.5% |
| Belgium | 19 | 0.4% |
| Caribbean | 91 | 1.7% |
| China | 382 | 7.1% |
| Colombia | 47 | 0.9% |
| Cuba | 20 | 0.4% |
| Dominican Republic | 71 | 1.3% |
| Eastern Africa | 34 | 0.6% |
| Eastern Asia | 1,105 | 20.7% |
| Eastern Europe | 237 | 4.4% |
| Egypt | 10 | 0.2% |
| Europe | 408 | 7.6% |
| France | 14 | 0.3% |
| Greece | 61 | 1.1% |
| Hong Kong | 22 | 0.4% |
| Hungary | 19 | 0.4% |
| India | 120 | 2.2% |
| Iran | 135 | 2.5% |
| Israel | 106 | 2.0% |
| Italy | 11 | 0.2% |
| Japan | 27 | 0.5% |
| Korea | 696 | 13.0% |
| Latin America | 172 | 3.2% |
| Malaysia | 19 | 0.4% |
| North Macedonia | 10 | 0.2% |
| Northern Africa | 10 | 0.2% |
| Northern Europe | 66 | 1.2% |
| Oceania | 42 | 0.8% |
| Pakistan | 19 | 0.4% |
| Philippines | 226 | 4.2% |
| Poland | 41 | 0.8% |
| Russia | 33 | 0.6% |
| South America | 81 | 1.5% |
| South Central Asia | 274 | 5.1% |
| South Eastern Asia | 265 | 5.0% |
| Southern Europe | 72 | 1.3% |
| Taiwan | 128 | 2.4% |
| Turkey | 49 | 0.9% |
| Ukraine | 113 | 2.1% |
| Vietnam | 20 | 0.4% |
| Western Asia | 155 | 2.9% |
| Western Europe | 33 | 0.6% | View All 45 Rows |
Sex and Age in Englewood Cliffs borough
Sex and Age in Englewood Cliffs borough
The most populous age groups in Englewood Cliffs borough are 55 to 59 Years (303 | 11.5%) for men and 60 to 64 Years (269 | 9.9%) for women.
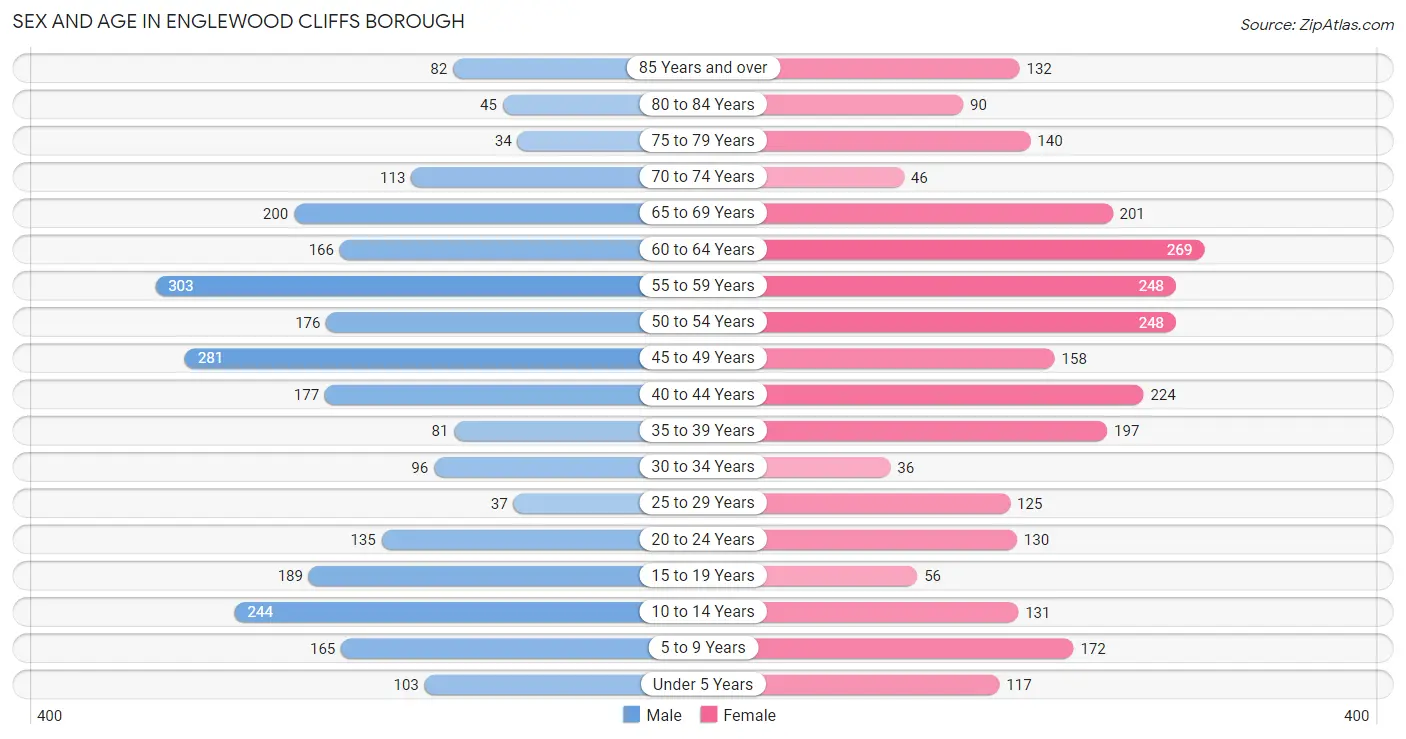
| Age Bracket | Male | Female |
| Under 5 Years | 103 (3.9%) | 117 (4.3%) |
| 5 to 9 Years | 165 (6.3%) | 172 (6.3%) |
| 10 to 14 Years | 244 (9.3%) | 131 (4.8%) |
| 15 to 19 Years | 189 (7.2%) | 56 (2.1%) |
| 20 to 24 Years | 135 (5.1%) | 130 (4.8%) |
| 25 to 29 Years | 37 (1.4%) | 125 (4.6%) |
| 30 to 34 Years | 96 (3.6%) | 36 (1.3%) |
| 35 to 39 Years | 81 (3.1%) | 197 (7.2%) |
| 40 to 44 Years | 177 (6.7%) | 224 (8.2%) |
| 45 to 49 Years | 281 (10.7%) | 158 (5.8%) |
| 50 to 54 Years | 176 (6.7%) | 248 (9.1%) |
| 55 to 59 Years | 303 (11.5%) | 248 (9.1%) |
| 60 to 64 Years | 166 (6.3%) | 269 (9.9%) |
| 65 to 69 Years | 200 (7.6%) | 201 (7.4%) |
| 70 to 74 Years | 113 (4.3%) | 46 (1.7%) |
| 75 to 79 Years | 34 (1.3%) | 140 (5.1%) |
| 80 to 84 Years | 45 (1.7%) | 90 (3.3%) |
| 85 Years and over | 82 (3.1%) | 132 (4.9%) |
| Total | 2,627 (100.0%) | 2,720 (100.0%) |
Families and Households in Englewood Cliffs borough
Median Family Size in Englewood Cliffs borough
The median family size in Englewood Cliffs borough is 3.16 persons per family, with married-couple families (1,393 | 88.1%) accounting for the largest median family size of 3.24 persons per family. On the other hand, single male/father families (32 | 2.0%) represent the smallest median family size with 2.31 persons per family.
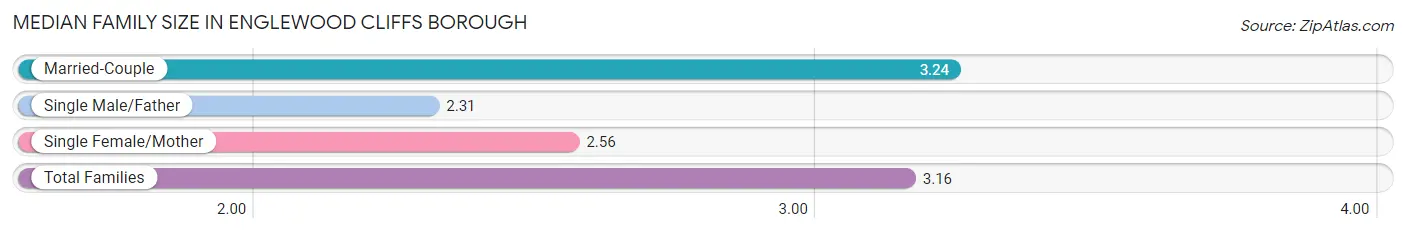
| Family Type | # Families | Family Size |
| Married-Couple | 1,393 (88.1%) | 3.24 |
| Single Male/Father | 32 (2.0%) | 2.31 |
| Single Female/Mother | 156 (9.9%) | 2.56 |
| Total Families | 1,581 (100.0%) | 3.16 |
Median Household Size in Englewood Cliffs borough
The median household size in Englewood Cliffs borough is 2.85 persons per household, with married-couple households (1,393 | 74.9%) accounting for the largest median household size of 3.26 persons per household. non-family households (279 | 15.0%) represent the smallest median household size with 1.05 persons per household.
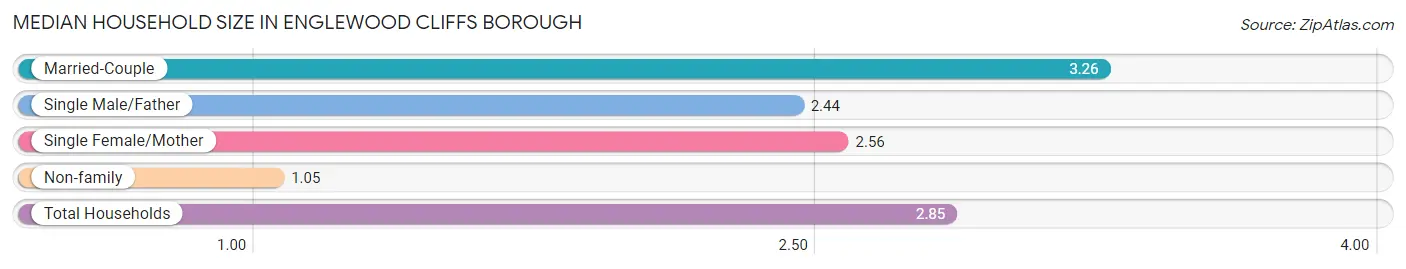
| Household Type | # Households | Household Size |
| Married-Couple | 1,393 (74.9%) | 3.26 |
| Single Male/Father | 32 (1.7%) | 2.44 |
| Single Female/Mother | 156 (8.4%) | 2.56 |
| Non-family | 279 (15.0%) | 1.05 |
| Total Households | 1,860 (100.0%) | 2.85 |
Household Size by Marriage Status in Englewood Cliffs borough
Out of a total of 1,860 households in Englewood Cliffs borough, 1,581 (85.0%) are family households, while 279 (15.0%) are nonfamily households. The most numerous type of family households are 2-person households, comprising 521, and the most common type of nonfamily households are 1-person households, comprising 268.
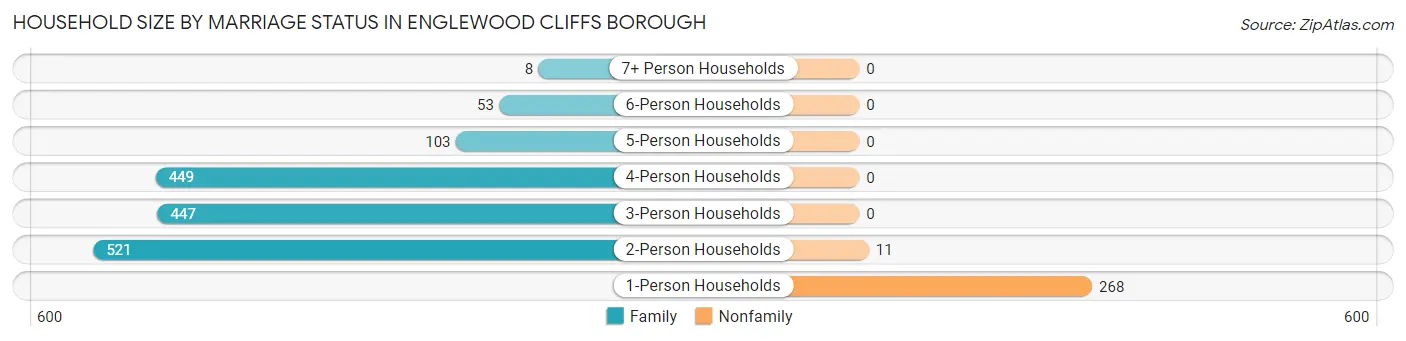
| Household Size | Family Households | Nonfamily Households |
| 1-Person Households | - | 268 (14.4%) |
| 2-Person Households | 521 (28.0%) | 11 (0.6%) |
| 3-Person Households | 447 (24.0%) | 0 (0.0%) |
| 4-Person Households | 449 (24.1%) | 0 (0.0%) |
| 5-Person Households | 103 (5.5%) | 0 (0.0%) |
| 6-Person Households | 53 (2.9%) | 0 (0.0%) |
| 7+ Person Households | 8 (0.4%) | 0 (0.0%) |
| Total | 1,581 (85.0%) | 279 (15.0%) |
Female Fertility in Englewood Cliffs borough
Fertility by Age in Englewood Cliffs borough
Average fertility rate in Englewood Cliffs borough is 56.0 births per 1,000 women. Women in the age bracket of 35 to 50 years have the highest fertility rate with 63.0 births per 1,000 women. Women in the age bracket of 35 to 50 years acount for 71.2% of all women with births.
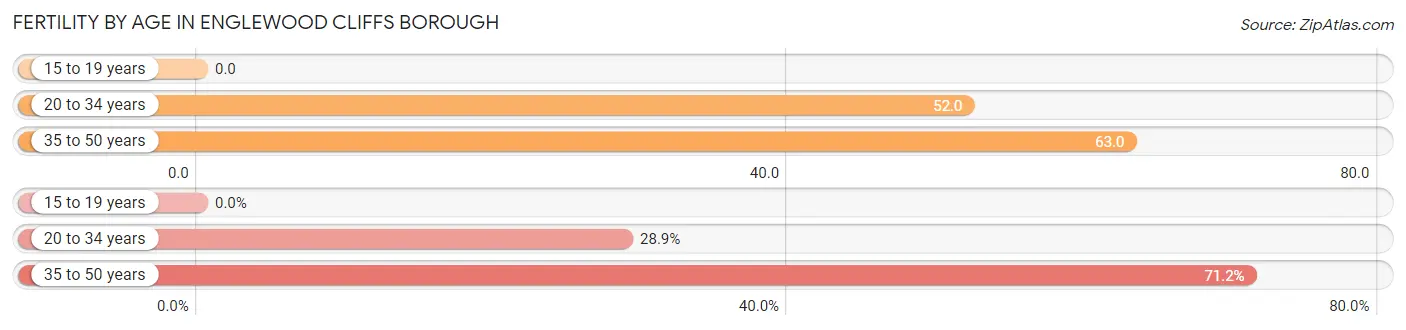
| Age Bracket | Women with Births | Births / 1,000 Women |
| 15 to 19 years | 0 (0.0%) | 0.0 |
| 20 to 34 years | 15 (28.8%) | 52.0 |
| 35 to 50 years | 37 (71.2%) | 63.0 |
| Total | 52 (100.0%) | 56.0 |
Fertility by Age by Marriage Status in Englewood Cliffs borough
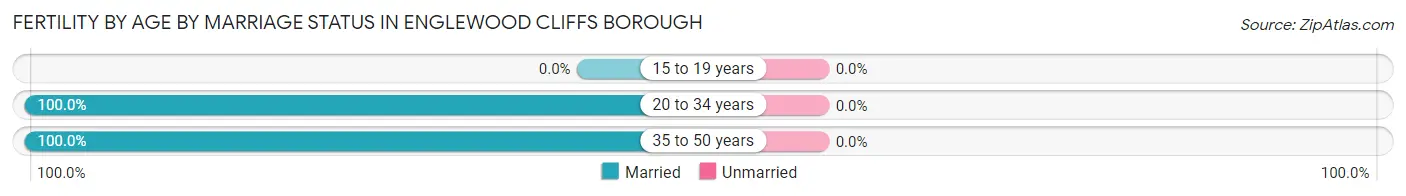
| Age Bracket | Married | Unmarried |
| 15 to 19 years | 0 (0.0%) | 0 (0.0%) |
| 20 to 34 years | 15 (100.0%) | 0 (0.0%) |
| 35 to 50 years | 37 (100.0%) | 0 (0.0%) |
| Total | 52 (100.0%) | 0 (0.0%) |
Fertility by Education in Englewood Cliffs borough
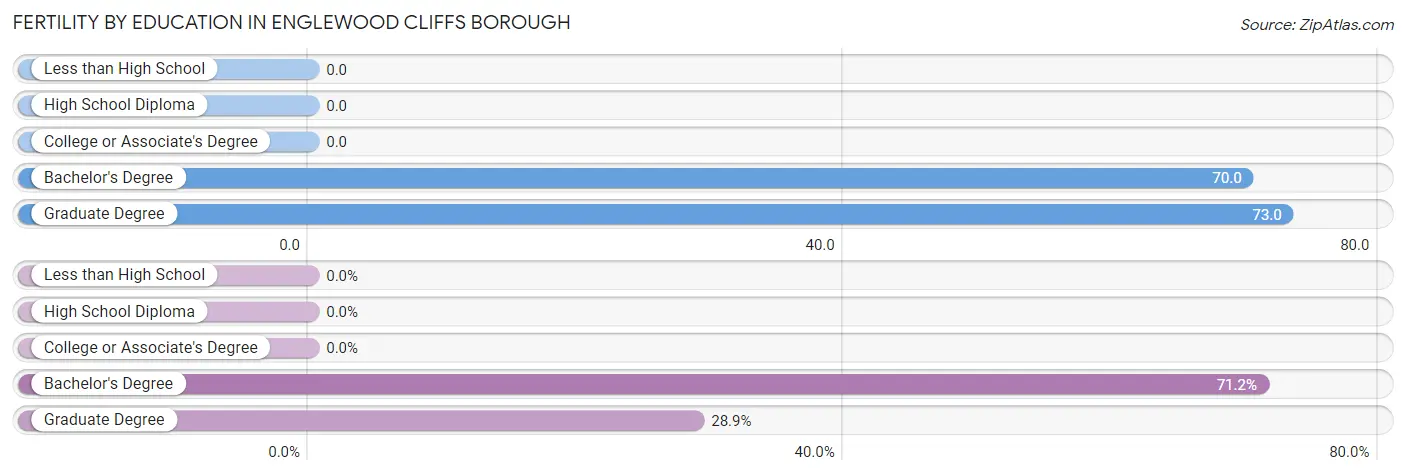
| Educational Attainment | Women with Births | Births / 1,000 Women |
| Less than High School | 0 (0.0%) | 0.0 |
| High School Diploma | 0 (0.0%) | 0.0 |
| College or Associate's Degree | 0 (0.0%) | 0.0 |
| Bachelor's Degree | 37 (71.2%) | 70.0 |
| Graduate Degree | 15 (28.8%) | 73.0 |
| Total | 52 (100.0%) | 56.0 |
Fertility by Education by Marriage Status in Englewood Cliffs borough
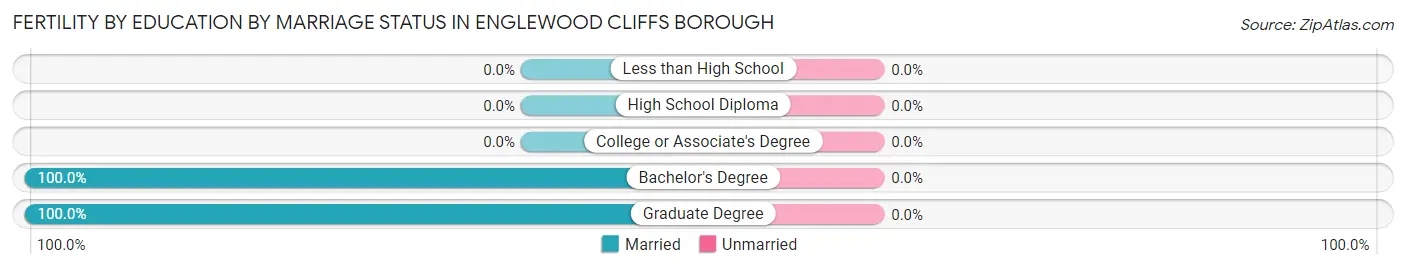
| Educational Attainment | Married | Unmarried |
| Less than High School | 0 (0.0%) | 0 (0.0%) |
| High School Diploma | 0 (0.0%) | 0 (0.0%) |
| College or Associate's Degree | 0 (0.0%) | 0 (0.0%) |
| Bachelor's Degree | 37 (100.0%) | 0 (0.0%) |
| Graduate Degree | 15 (100.0%) | 0 (0.0%) |
| Total | 52 (100.0%) | 0 (0.0%) |
Employment Characteristics in Englewood Cliffs borough
Employment by Class of Employer in Englewood Cliffs borough
Among the 2,610 employed individuals in Englewood Cliffs borough, private company employees (1,479 | 56.7%), self-employed (incorporated) (477 | 18.3%), and self-employed (not incorporated) (216 | 8.3%) make up the most common classes of employment.
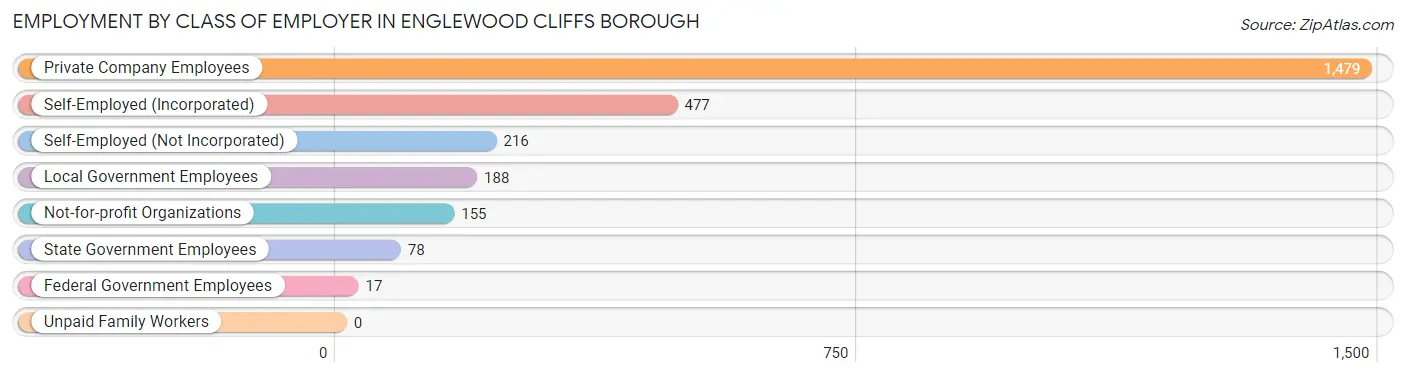
| Employer Class | # Employees | % Employees |
| Private Company Employees | 1,479 | 56.7% |
| Self-Employed (Incorporated) | 477 | 18.3% |
| Self-Employed (Not Incorporated) | 216 | 8.3% |
| Not-for-profit Organizations | 155 | 5.9% |
| Local Government Employees | 188 | 7.2% |
| State Government Employees | 78 | 3.0% |
| Federal Government Employees | 17 | 0.6% |
| Unpaid Family Workers | 0 | 0.0% |
| Total | 2,610 | 100.0% |
Employment Status by Age in Englewood Cliffs borough
According to the labor force statistics for Englewood Cliffs borough, out of the total population over 16 years of age (4,373), 65.0% or 2,842 individuals are in the labor force, with 6.8% or 193 of them unemployed. The age group with the highest labor force participation rate is 25 to 29 years, with 100.0% or 162 individuals in the labor force. Within the labor force, the 20 to 24 years age range has the highest percentage of unemployed individuals, with 38.5% or 62 of them being unemployed.
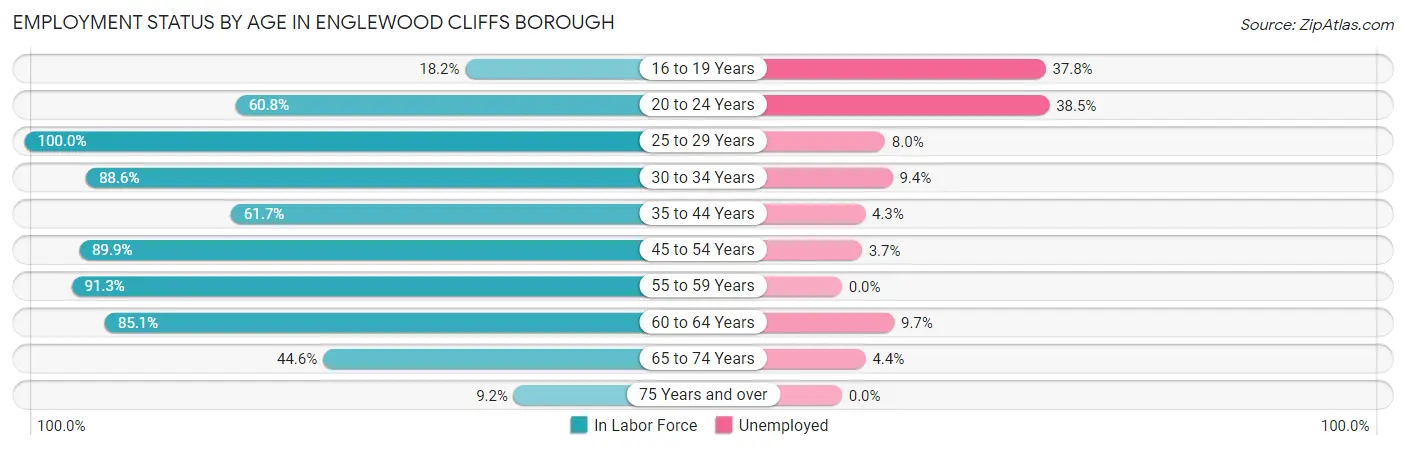
| Age Bracket | In Labor Force | Unemployed |
| 16 to 19 Years | 37 (18.2%) | 14 (37.8%) |
| 20 to 24 Years | 161 (60.8%) | 62 (38.5%) |
| 25 to 29 Years | 162 (100.0%) | 13 (8.0%) |
| 30 to 34 Years | 117 (88.6%) | 11 (9.4%) |
| 35 to 44 Years | 419 (61.7%) | 18 (4.3%) |
| 45 to 54 Years | 776 (89.9%) | 29 (3.7%) |
| 55 to 59 Years | 503 (91.3%) | 0 (0.0%) |
| 60 to 64 Years | 370 (85.1%) | 36 (9.7%) |
| 65 to 74 Years | 250 (44.6%) | 11 (4.4%) |
| 75 Years and over | 48 (9.2%) | 0 (0.0%) |
| Total | 2,842 (65.0%) | 193 (6.8%) |
Employment Status by Educational Attainment in Englewood Cliffs borough
According to labor force statistics for Englewood Cliffs borough, 83.2% of individuals (2,348) out of the total population between 25 and 64 years of age (2,822) are in the labor force, with 4.6% or 108 of them being unemployed. The group with the highest labor force participation rate are those with the educational attainment of high school diploma, with 86.8% or 210 individuals in the labor force. Within the labor force, individuals with college / associate degree education have the highest percentage of unemployment, with 11.0% or 26 of them being unemployed.
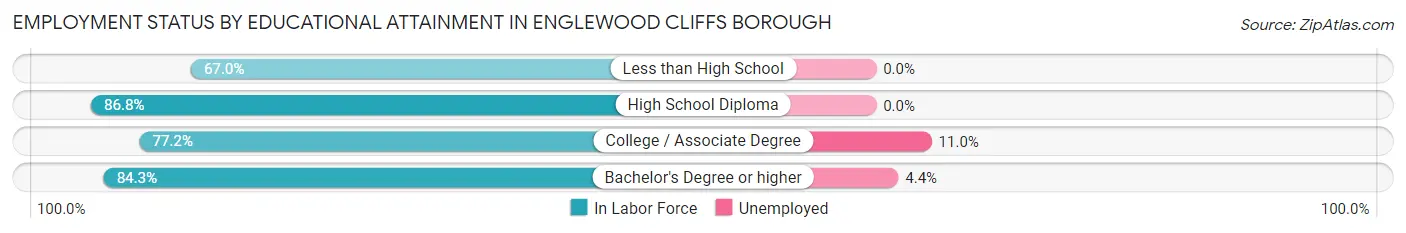
| Educational Attainment | In Labor Force | Unemployed |
| Less than High School | 61 (67.0%) | 0 (0.0%) |
| High School Diploma | 210 (86.8%) | 0 (0.0%) |
| College / Associate Degree | 237 (77.2%) | 34 (11.0%) |
| Bachelor's Degree or higher | 1,839 (84.3%) | 96 (4.4%) |
| Total | 2,348 (83.2%) | 130 (4.6%) |
Employment Occupations by Sex in Englewood Cliffs borough
Management, Business, Science and Arts Occupations
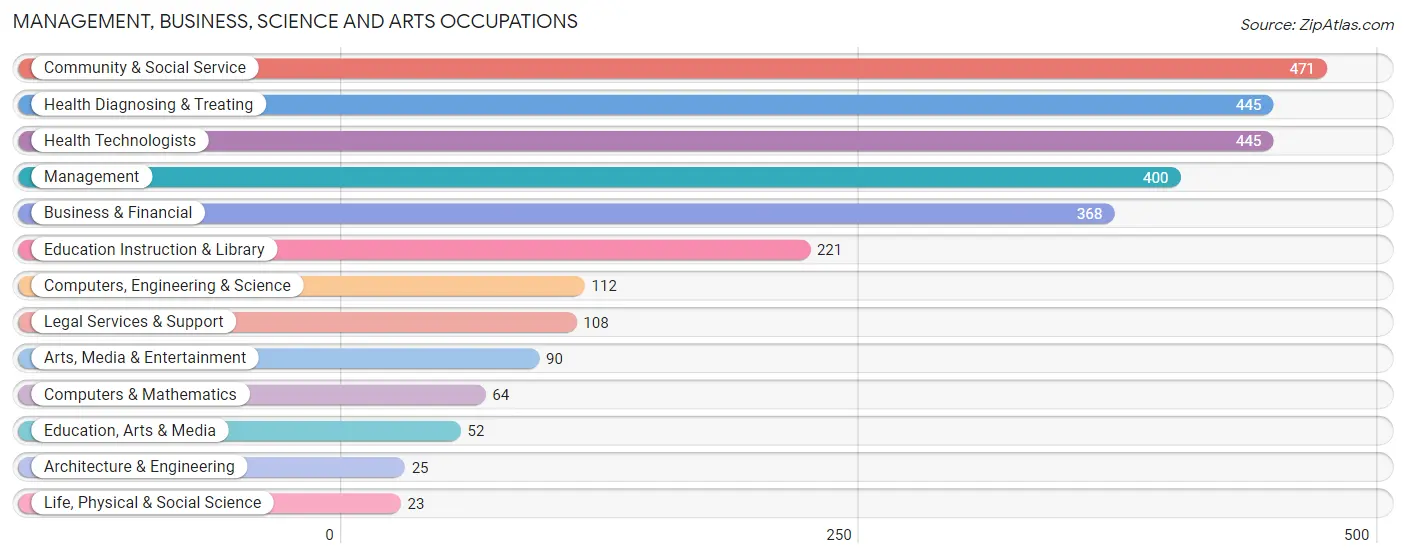
The most common Management, Business, Science and Arts occupations in Englewood Cliffs borough are Community & Social Service (471 | 17.8%), Health Diagnosing & Treating (445 | 16.8%), Health Technologists (445 | 16.8%), Management (400 | 15.1%), and Business & Financial (368 | 13.9%).
Management, Business, Science and Arts Occupations by Sex
Within the Management, Business, Science and Arts occupations in Englewood Cliffs borough, the most male-oriented occupations are Architecture & Engineering (100.0%), Arts, Media & Entertainment (76.7%), and Management (72.3%), while the most female-oriented occupations are Education, Arts & Media (100.0%), Legal Services & Support (69.4%), and Education Instruction & Library (63.8%).
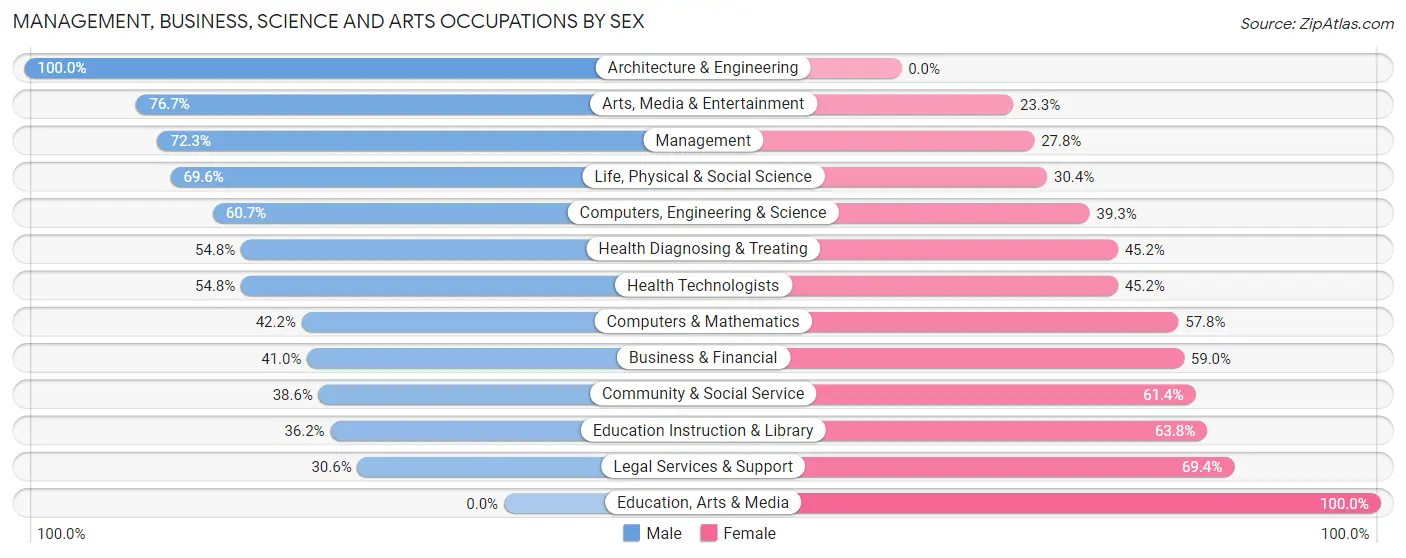
| Occupation | Male | Female |
| Management | 289 (72.3%) | 111 (27.8%) |
| Business & Financial | 151 (41.0%) | 217 (59.0%) |
| Computers, Engineering & Science | 68 (60.7%) | 44 (39.3%) |
| Computers & Mathematics | 27 (42.2%) | 37 (57.8%) |
| Architecture & Engineering | 25 (100.0%) | 0 (0.0%) |
| Life, Physical & Social Science | 16 (69.6%) | 7 (30.4%) |
| Community & Social Service | 182 (38.6%) | 289 (61.4%) |
| Education, Arts & Media | 0 (0.0%) | 52 (100.0%) |
| Legal Services & Support | 33 (30.6%) | 75 (69.4%) |
| Education Instruction & Library | 80 (36.2%) | 141 (63.8%) |
| Arts, Media & Entertainment | 69 (76.7%) | 21 (23.3%) |
| Health Diagnosing & Treating | 244 (54.8%) | 201 (45.2%) |
| Health Technologists | 244 (54.8%) | 201 (45.2%) |
| Total (Category) | 934 (52.0%) | 862 (48.0%) |
| Total (Overall) | 1,408 (53.1%) | 1,241 (46.9%) |
Services Occupations
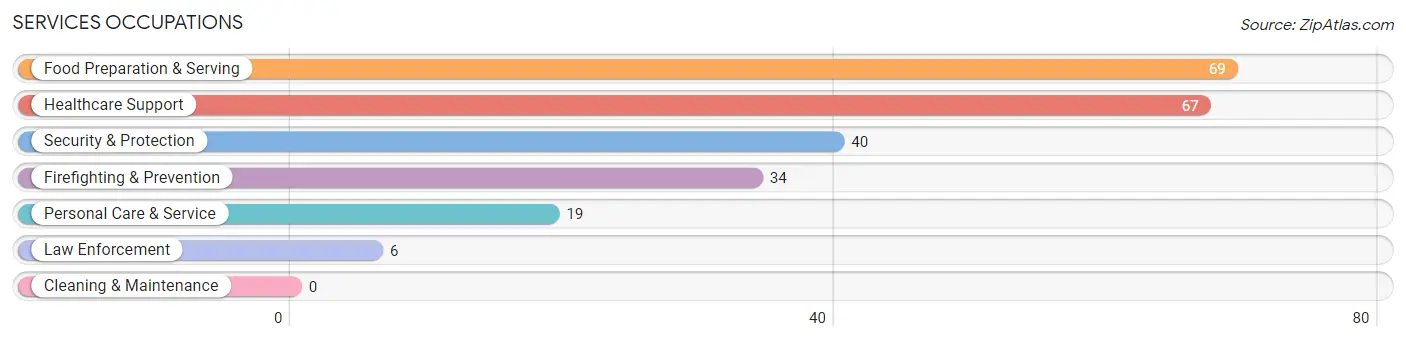
The most common Services occupations in Englewood Cliffs borough are Food Preparation & Serving (69 | 2.6%), Healthcare Support (67 | 2.5%), Security & Protection (40 | 1.5%), Firefighting & Prevention (34 | 1.3%), and Personal Care & Service (19 | 0.7%).
Services Occupations by Sex
Within the Services occupations in Englewood Cliffs borough, the most male-oriented occupations are Law Enforcement (100.0%), Security & Protection (52.5%), and Food Preparation & Serving (44.9%), while the most female-oriented occupations are Healthcare Support (100.0%), Personal Care & Service (100.0%), and Firefighting & Prevention (55.9%).
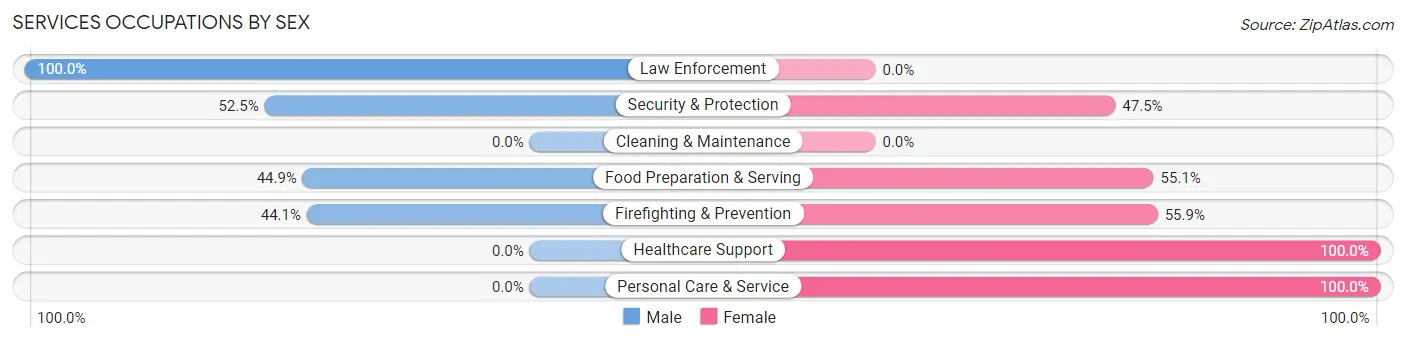
| Occupation | Male | Female |
| Healthcare Support | 0 (0.0%) | 67 (100.0%) |
| Security & Protection | 21 (52.5%) | 19 (47.5%) |
| Firefighting & Prevention | 15 (44.1%) | 19 (55.9%) |
| Law Enforcement | 6 (100.0%) | 0 (0.0%) |
| Food Preparation & Serving | 31 (44.9%) | 38 (55.1%) |
| Cleaning & Maintenance | 0 (0.0%) | 0 (0.0%) |
| Personal Care & Service | 0 (0.0%) | 19 (100.0%) |
| Total (Category) | 52 (26.7%) | 143 (73.3%) |
| Total (Overall) | 1,408 (53.1%) | 1,241 (46.9%) |
Sales and Office Occupations
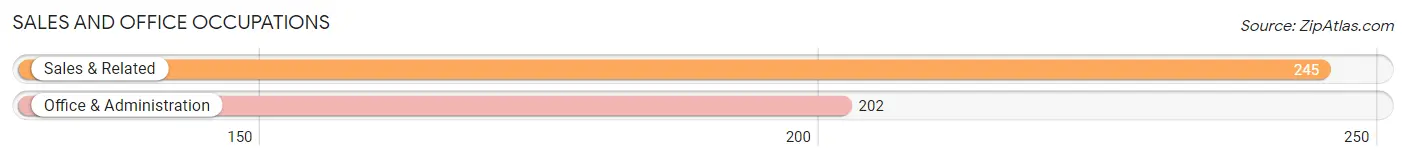
The most common Sales and Office occupations in Englewood Cliffs borough are Sales & Related (245 | 9.2%), and Office & Administration (202 | 7.6%).
Sales and Office Occupations by Sex
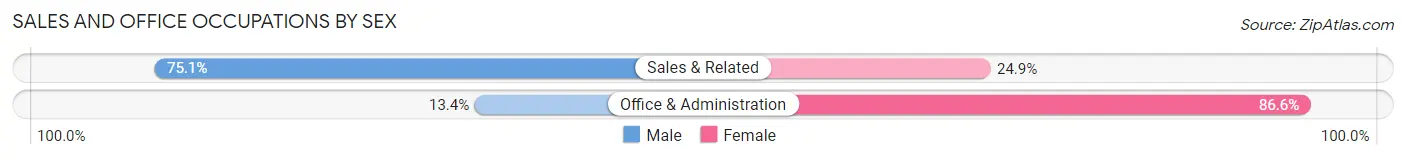
| Occupation | Male | Female |
| Sales & Related | 184 (75.1%) | 61 (24.9%) |
| Office & Administration | 27 (13.4%) | 175 (86.6%) |
| Total (Category) | 211 (47.2%) | 236 (52.8%) |
| Total (Overall) | 1,408 (53.1%) | 1,241 (46.9%) |
Natural Resources, Construction and Maintenance Occupations
The most common Natural Resources, Construction and Maintenance occupations in Englewood Cliffs borough are Installation, Maintenance & Repair (56 | 2.1%), and Construction & Extraction (54 | 2.0%).
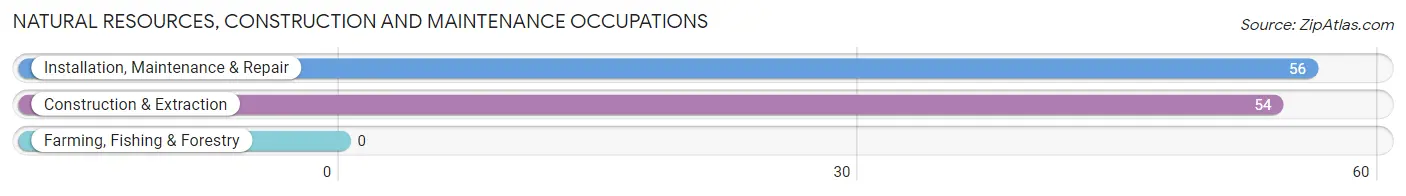
Natural Resources, Construction and Maintenance Occupations by Sex
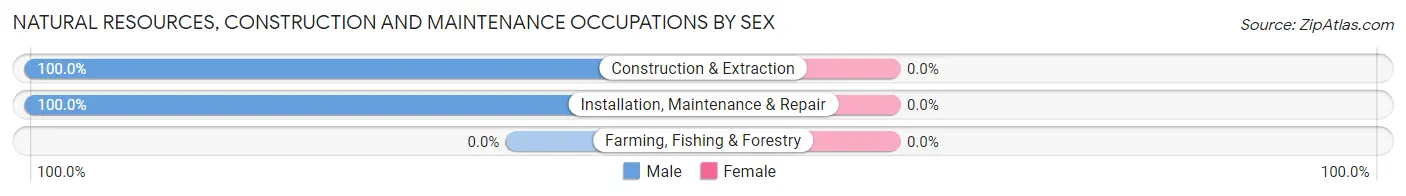
| Occupation | Male | Female |
| Farming, Fishing & Forestry | 0 (0.0%) | 0 (0.0%) |
| Construction & Extraction | 54 (100.0%) | 0 (0.0%) |
| Installation, Maintenance & Repair | 56 (100.0%) | 0 (0.0%) |
| Total (Category) | 110 (100.0%) | 0 (0.0%) |
| Total (Overall) | 1,408 (53.1%) | 1,241 (46.9%) |
Production, Transportation and Moving Occupations
The most common Production, Transportation and Moving occupations in Englewood Cliffs borough are Transportation (73 | 2.8%), and Production (28 | 1.1%).
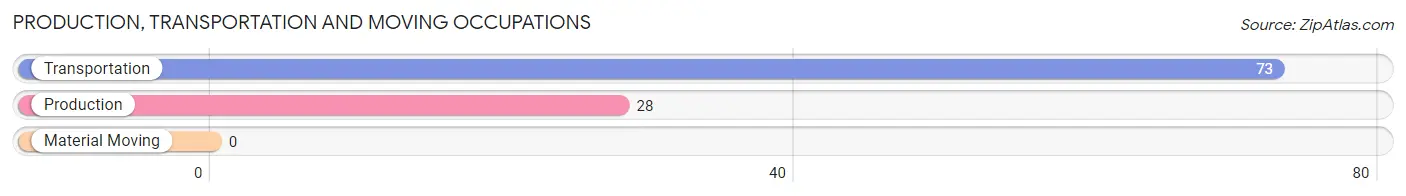
Production, Transportation and Moving Occupations by Sex
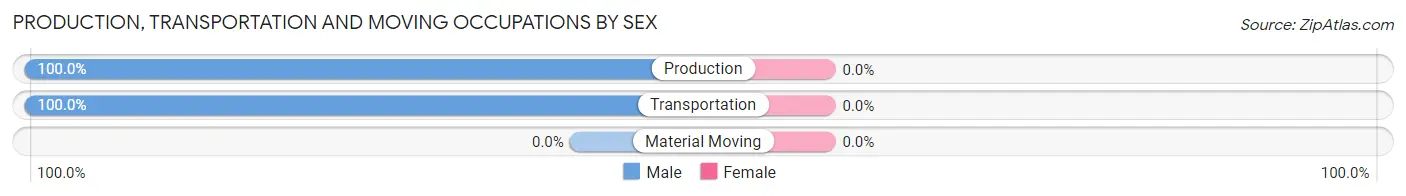
| Occupation | Male | Female |
| Production | 28 (100.0%) | 0 (0.0%) |
| Transportation | 73 (100.0%) | 0 (0.0%) |
| Material Moving | 0 (0.0%) | 0 (0.0%) |
| Total (Category) | 101 (100.0%) | 0 (0.0%) |
| Total (Overall) | 1,408 (53.1%) | 1,241 (46.9%) |
Employment Industries by Sex in Englewood Cliffs borough
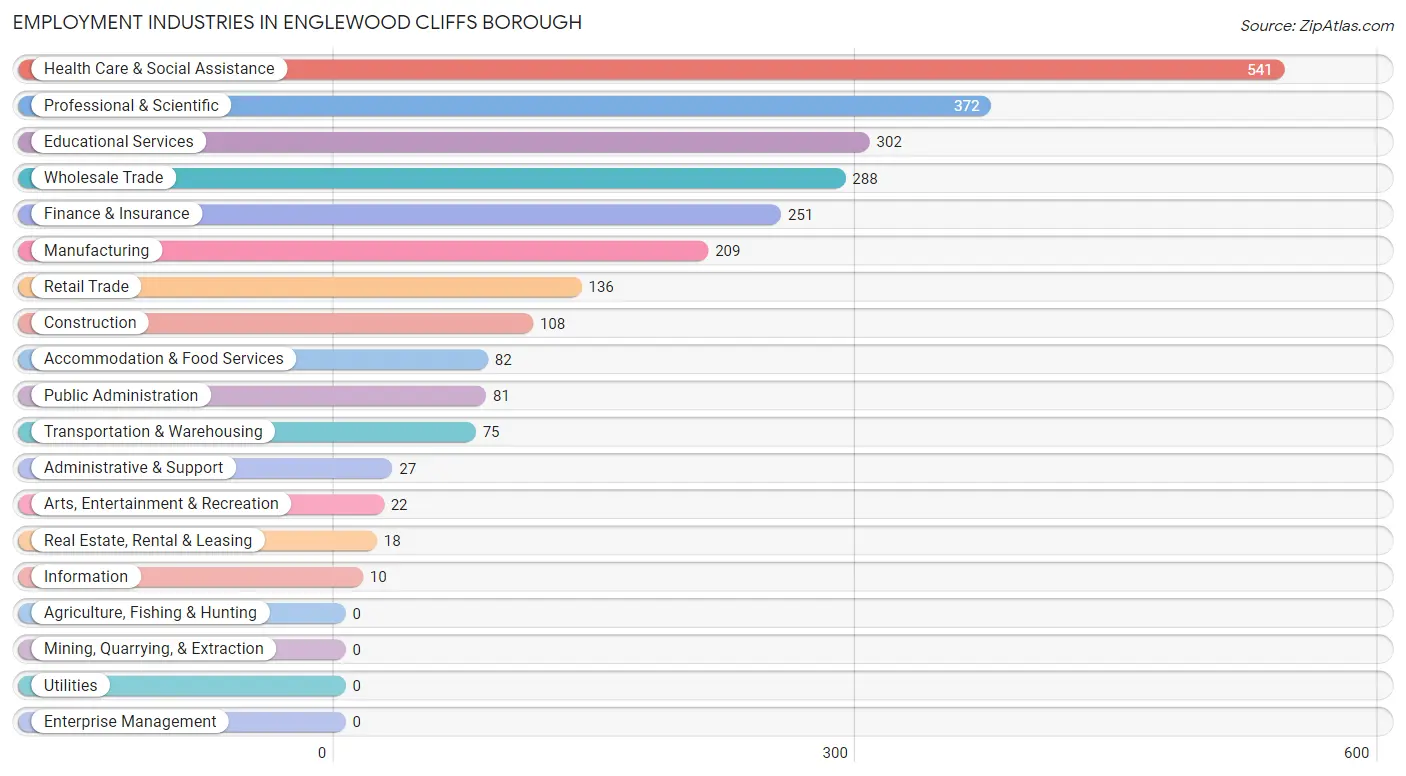
Employment Industries in Englewood Cliffs borough
The major employment industries in Englewood Cliffs borough include Health Care & Social Assistance (541 | 20.4%), Professional & Scientific (372 | 14.0%), Educational Services (302 | 11.4%), Wholesale Trade (288 | 10.9%), and Finance & Insurance (251 | 9.5%).
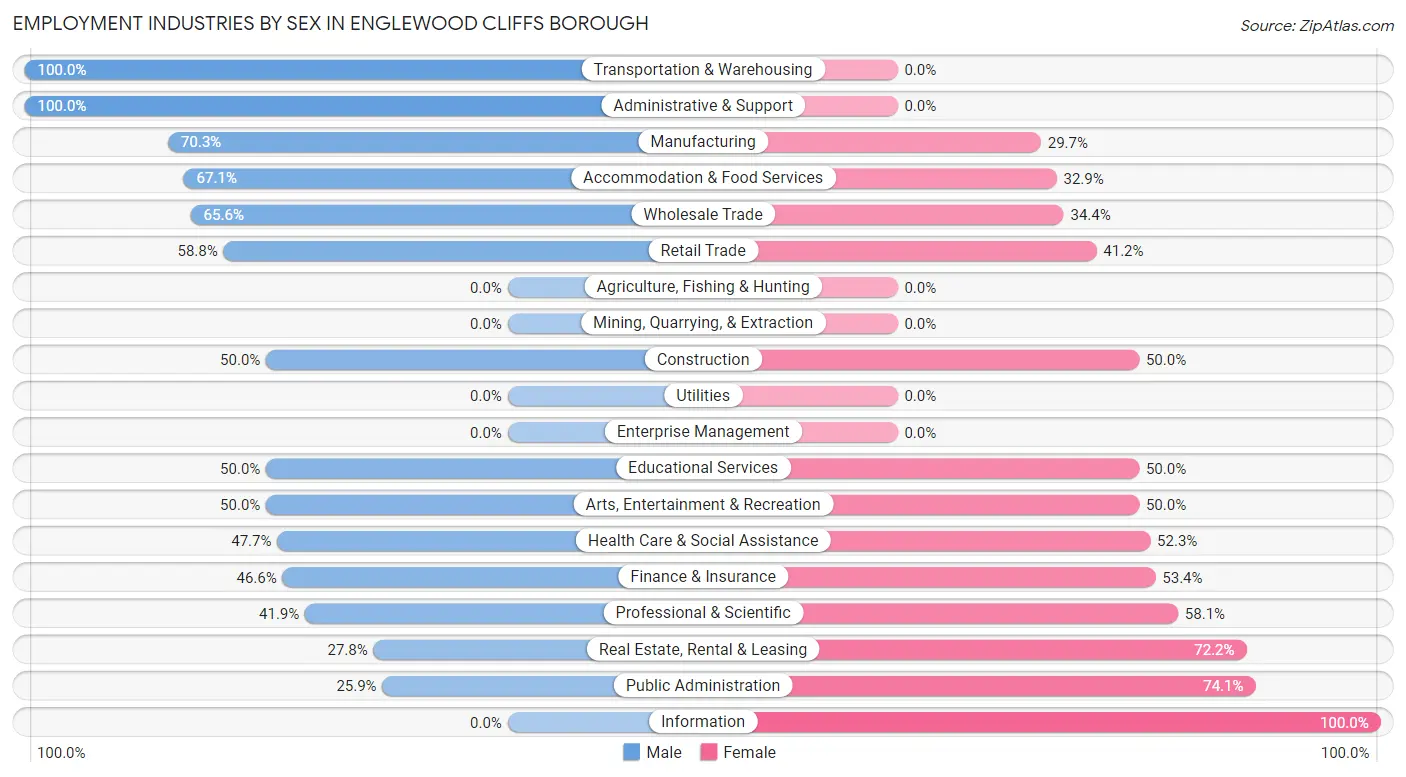
Employment Industries by Sex in Englewood Cliffs borough
The Englewood Cliffs borough industries that see more men than women are Transportation & Warehousing (100.0%), Administrative & Support (100.0%), and Manufacturing (70.3%), whereas the industries that tend to have a higher number of women are Information (100.0%), Public Administration (74.1%), and Real Estate, Rental & Leasing (72.2%).
| Industry | Male | Female |
| Agriculture, Fishing & Hunting | 0 (0.0%) | 0 (0.0%) |
| Mining, Quarrying, & Extraction | 0 (0.0%) | 0 (0.0%) |
| Construction | 54 (50.0%) | 54 (50.0%) |
| Manufacturing | 147 (70.3%) | 62 (29.7%) |
| Wholesale Trade | 189 (65.6%) | 99 (34.4%) |
| Retail Trade | 80 (58.8%) | 56 (41.2%) |
| Transportation & Warehousing | 75 (100.0%) | 0 (0.0%) |
| Utilities | 0 (0.0%) | 0 (0.0%) |
| Information | 0 (0.0%) | 10 (100.0%) |
| Finance & Insurance | 117 (46.6%) | 134 (53.4%) |
| Real Estate, Rental & Leasing | 5 (27.8%) | 13 (72.2%) |
| Professional & Scientific | 156 (41.9%) | 216 (58.1%) |
| Enterprise Management | 0 (0.0%) | 0 (0.0%) |
| Administrative & Support | 27 (100.0%) | 0 (0.0%) |
| Educational Services | 151 (50.0%) | 151 (50.0%) |
| Health Care & Social Assistance | 258 (47.7%) | 283 (52.3%) |
| Arts, Entertainment & Recreation | 11 (50.0%) | 11 (50.0%) |
| Accommodation & Food Services | 55 (67.1%) | 27 (32.9%) |
| Public Administration | 21 (25.9%) | 60 (74.1%) |
| Total | 1,408 (53.1%) | 1,241 (46.9%) |
Education in Englewood Cliffs borough
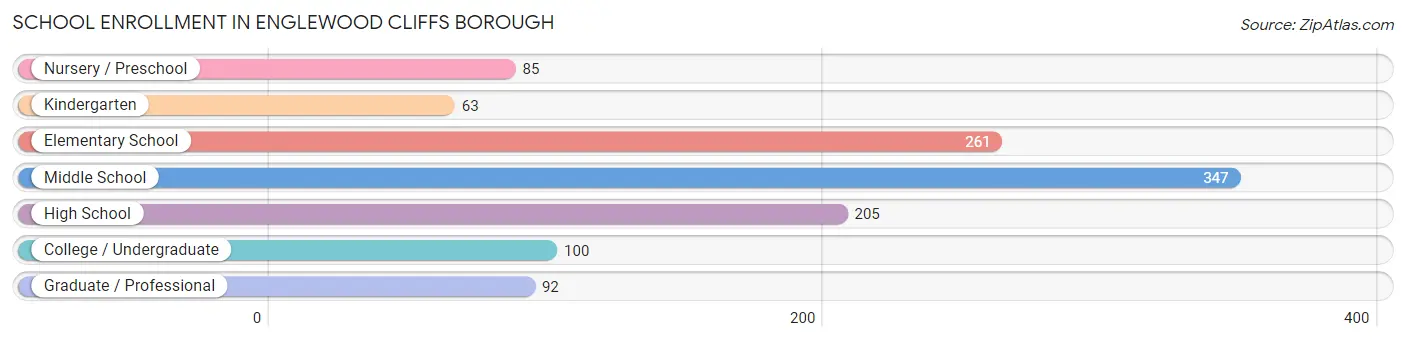
School Enrollment in Englewood Cliffs borough
The most common levels of schooling among the 1,153 students in Englewood Cliffs borough are middle school (347 | 30.1%), elementary school (261 | 22.6%), and high school (205 | 17.8%).
| School Level | # Students | % Students |
| Nursery / Preschool | 85 | 7.4% |
| Kindergarten | 63 | 5.5% |
| Elementary School | 261 | 22.6% |
| Middle School | 347 | 30.1% |
| High School | 205 | 17.8% |
| College / Undergraduate | 100 | 8.7% |
| Graduate / Professional | 92 | 8.0% |
| Total | 1,153 | 100.0% |
School Enrollment by Age by Funding Source in Englewood Cliffs borough
Out of a total of 1,153 students who are enrolled in schools in Englewood Cliffs borough, 386 (33.5%) attend a private institution, while the remaining 767 (66.5%) are enrolled in public schools. The age group of 25 to 34 year olds has the highest likelihood of being enrolled in private schools, with 16 (100.0% in the age bracket) enrolled. Conversely, the age group of 5 to 9 year old has the lowest likelihood of being enrolled in a private school, with 274 (90.7% in the age bracket) attending a public institution.
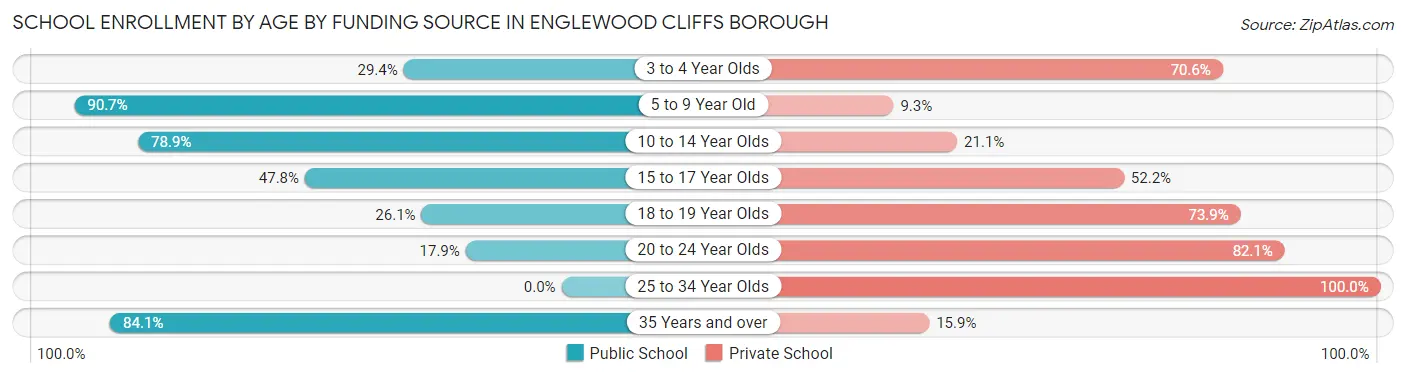
| Age Bracket | Public School | Private School |
| 3 to 4 Year Olds | 25 (29.4%) | 60 (70.6%) |
| 5 to 9 Year Old | 274 (90.7%) | 28 (9.3%) |
| 10 to 14 Year Olds | 291 (78.9%) | 78 (21.1%) |
| 15 to 17 Year Olds | 98 (47.8%) | 107 (52.2%) |
| 18 to 19 Year Olds | 6 (26.1%) | 17 (73.9%) |
| 20 to 24 Year Olds | 15 (17.9%) | 69 (82.1%) |
| 25 to 34 Year Olds | 0 (0.0%) | 16 (100.0%) |
| 35 Years and over | 58 (84.1%) | 11 (15.9%) |
| Total | 767 (66.5%) | 386 (33.5%) |
Educational Attainment by Field of Study in Englewood Cliffs borough
Business (703 | 21.8%), science & technology (376 | 11.7%), social sciences (359 | 11.1%), bio, nature & agricultural (285 | 8.8%), and psychology (225 | 7.0%) are the most common fields of study among 3,225 individuals in Englewood Cliffs borough who have obtained a bachelor's degree or higher.
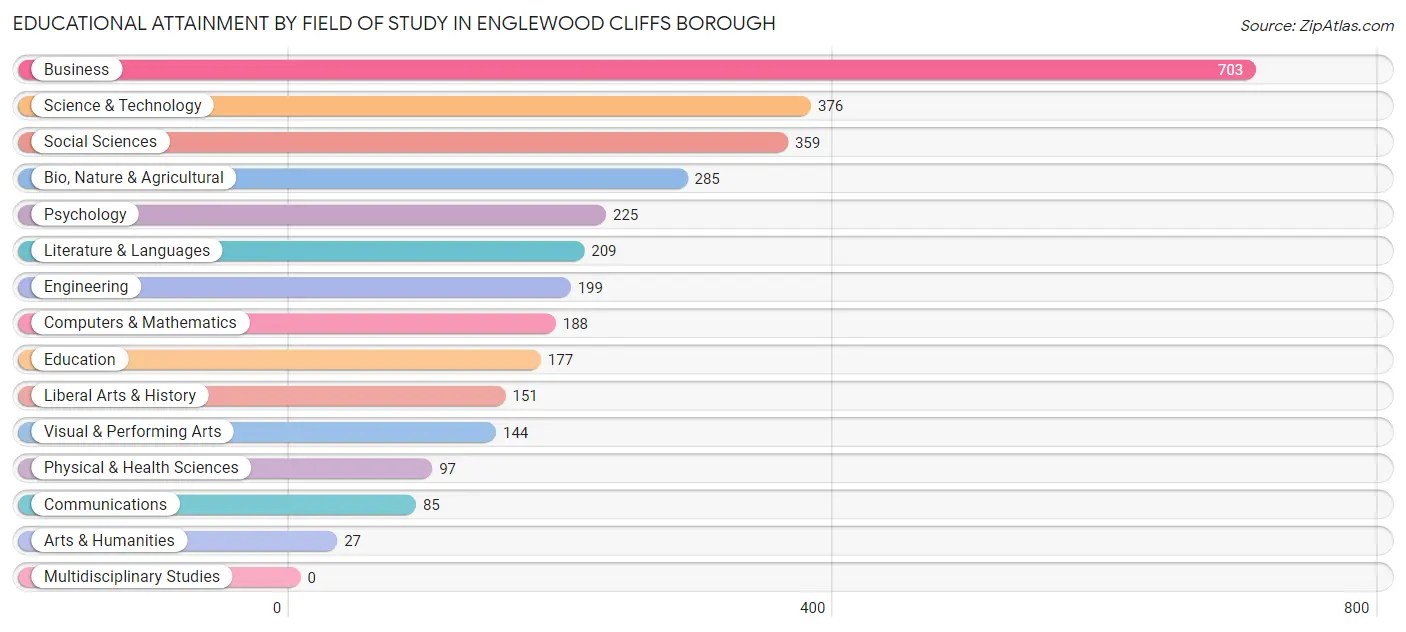
| Field of Study | # Graduates | % Graduates |
| Computers & Mathematics | 188 | 5.8% |
| Bio, Nature & Agricultural | 285 | 8.8% |
| Physical & Health Sciences | 97 | 3.0% |
| Psychology | 225 | 7.0% |
| Social Sciences | 359 | 11.1% |
| Engineering | 199 | 6.2% |
| Multidisciplinary Studies | 0 | 0.0% |
| Science & Technology | 376 | 11.7% |
| Business | 703 | 21.8% |
| Education | 177 | 5.5% |
| Literature & Languages | 209 | 6.5% |
| Liberal Arts & History | 151 | 4.7% |
| Visual & Performing Arts | 144 | 4.5% |
| Communications | 85 | 2.6% |
| Arts & Humanities | 27 | 0.8% |
| Total | 3,225 | 100.0% |
Transportation & Commute in Englewood Cliffs borough
Vehicle Availability by Sex in Englewood Cliffs borough
The most prevalent vehicle ownership categories in Englewood Cliffs borough are males with 2 vehicles (889, accounting for 63.1%) and females with 2 vehicles (601, making up 74.0%).
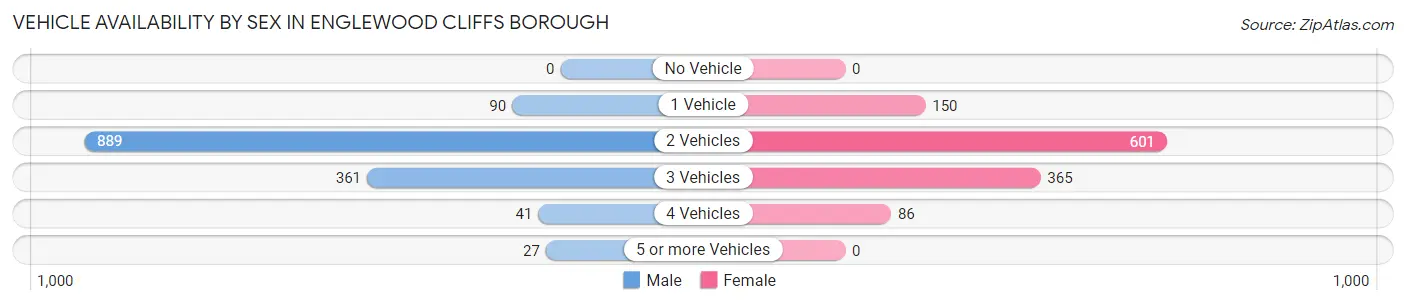
| Vehicles Available | Male | Female |
| No Vehicle | 0 (0.0%) | 0 (0.0%) |
| 1 Vehicle | 90 (6.4%) | 150 (12.5%) |
| 2 Vehicles | 889 (63.1%) | 601 (50.0%) |
| 3 Vehicles | 361 (25.6%) | 365 (30.4%) |
| 4 Vehicles | 41 (2.9%) | 86 (7.1%) |
| 5 or more Vehicles | 27 (1.9%) | 0 (0.0%) |
| Total | 1,408 (100.0%) | 1,202 (100.0%) |
Commute Time in Englewood Cliffs borough
The most frequently occuring commute durations in Englewood Cliffs borough are 60 to 89 minutes (615 commuters, 28.6%), 10 to 14 minutes (333 commuters, 15.5%), and 45 to 59 minutes (251 commuters, 11.7%).
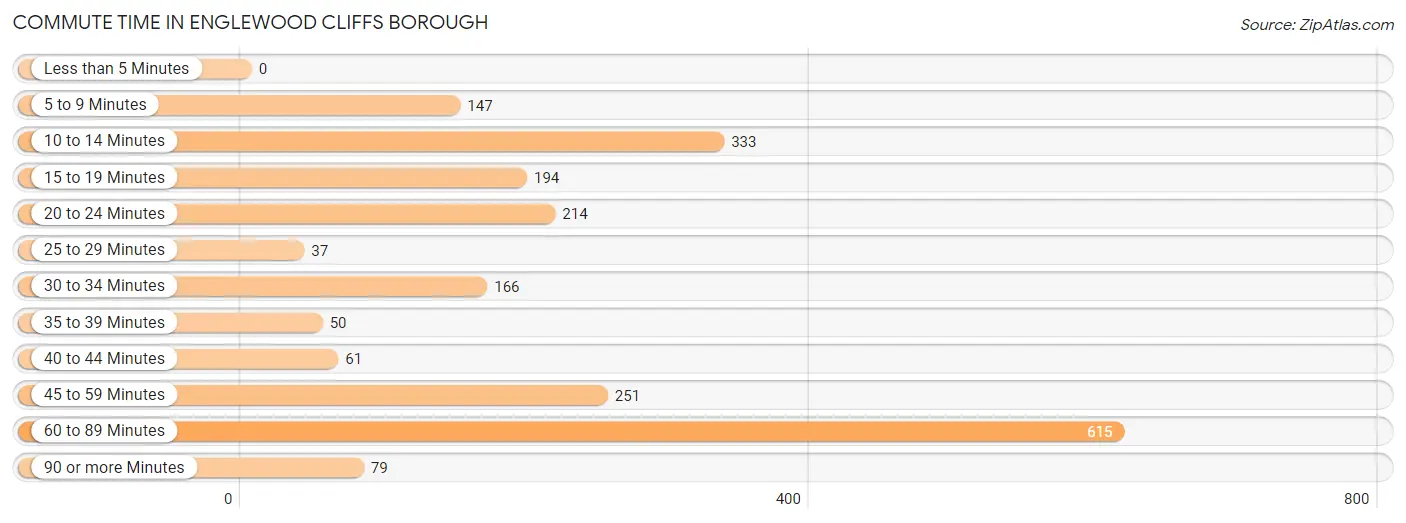
| Commute Time | # Commuters | % Commuters |
| Less than 5 Minutes | 0 | 0.0% |
| 5 to 9 Minutes | 147 | 6.9% |
| 10 to 14 Minutes | 333 | 15.5% |
| 15 to 19 Minutes | 194 | 9.0% |
| 20 to 24 Minutes | 214 | 10.0% |
| 25 to 29 Minutes | 37 | 1.7% |
| 30 to 34 Minutes | 166 | 7.7% |
| 35 to 39 Minutes | 50 | 2.3% |
| 40 to 44 Minutes | 61 | 2.8% |
| 45 to 59 Minutes | 251 | 11.7% |
| 60 to 89 Minutes | 615 | 28.6% |
| 90 or more Minutes | 79 | 3.7% |
Commute Time by Sex in Englewood Cliffs borough
The most common commute times in Englewood Cliffs borough are 60 to 89 minutes (406 commuters, 32.7%) for males and 60 to 89 minutes (209 commuters, 23.0%) for females.
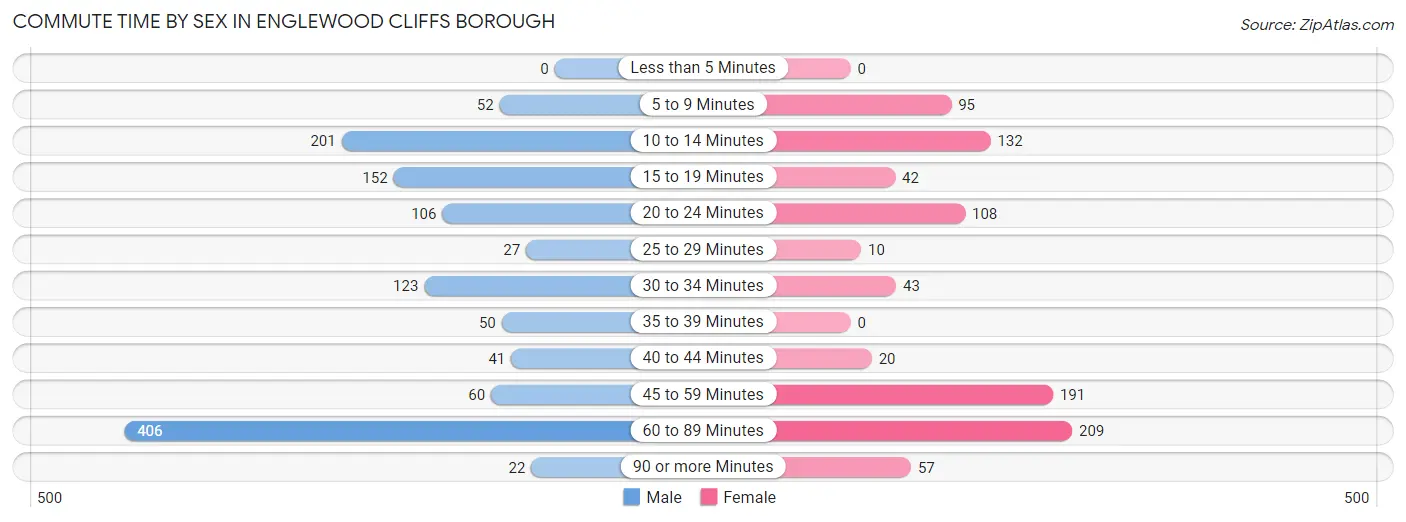
| Commute Time | Male | Female |
| Less than 5 Minutes | 0 (0.0%) | 0 (0.0%) |
| 5 to 9 Minutes | 52 (4.2%) | 95 (10.5%) |
| 10 to 14 Minutes | 201 (16.2%) | 132 (14.5%) |
| 15 to 19 Minutes | 152 (12.3%) | 42 (4.6%) |
| 20 to 24 Minutes | 106 (8.6%) | 108 (11.9%) |
| 25 to 29 Minutes | 27 (2.2%) | 10 (1.1%) |
| 30 to 34 Minutes | 123 (9.9%) | 43 (4.7%) |
| 35 to 39 Minutes | 50 (4.0%) | 0 (0.0%) |
| 40 to 44 Minutes | 41 (3.3%) | 20 (2.2%) |
| 45 to 59 Minutes | 60 (4.8%) | 191 (21.1%) |
| 60 to 89 Minutes | 406 (32.7%) | 209 (23.0%) |
| 90 or more Minutes | 22 (1.8%) | 57 (6.3%) |
Time of Departure to Work by Sex in Englewood Cliffs borough
The most frequent times of departure to work in Englewood Cliffs borough are 9:00 AM to 9:59 AM (221, 17.8%) for males and 7:00 AM to 7:29 AM (292, 32.2%) for females.
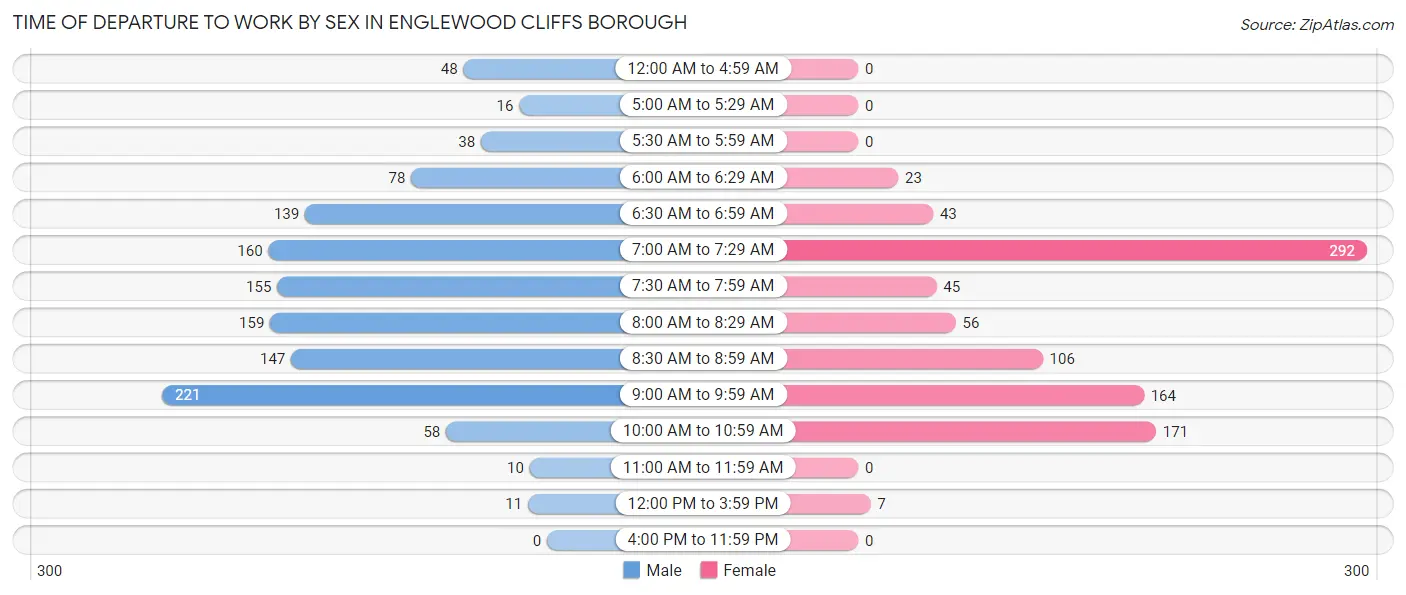
| Time of Departure | Male | Female |
| 12:00 AM to 4:59 AM | 48 (3.9%) | 0 (0.0%) |
| 5:00 AM to 5:29 AM | 16 (1.3%) | 0 (0.0%) |
| 5:30 AM to 5:59 AM | 38 (3.1%) | 0 (0.0%) |
| 6:00 AM to 6:29 AM | 78 (6.3%) | 23 (2.5%) |
| 6:30 AM to 6:59 AM | 139 (11.2%) | 43 (4.7%) |
| 7:00 AM to 7:29 AM | 160 (12.9%) | 292 (32.2%) |
| 7:30 AM to 7:59 AM | 155 (12.5%) | 45 (5.0%) |
| 8:00 AM to 8:29 AM | 159 (12.8%) | 56 (6.2%) |
| 8:30 AM to 8:59 AM | 147 (11.8%) | 106 (11.7%) |
| 9:00 AM to 9:59 AM | 221 (17.8%) | 164 (18.1%) |
| 10:00 AM to 10:59 AM | 58 (4.7%) | 171 (18.9%) |
| 11:00 AM to 11:59 AM | 10 (0.8%) | 0 (0.0%) |
| 12:00 PM to 3:59 PM | 11 (0.9%) | 7 (0.8%) |
| 4:00 PM to 11:59 PM | 0 (0.0%) | 0 (0.0%) |
| Total | 1,240 (100.0%) | 907 (100.0%) |
Housing Occupancy in Englewood Cliffs borough
Occupancy by Ownership in Englewood Cliffs borough
Of the total 1,860 dwellings in Englewood Cliffs borough, owner-occupied units account for 1,539 (82.7%), while renter-occupied units make up 321 (17.3%).
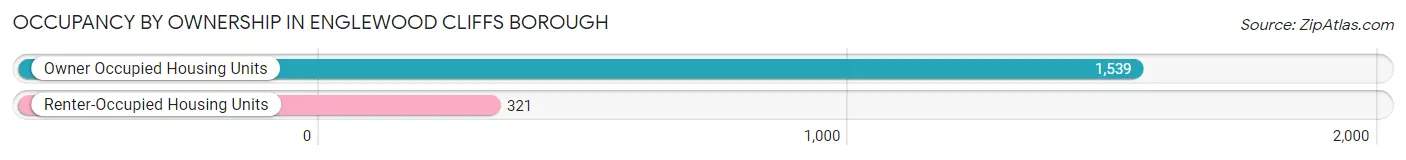
| Occupancy | # Housing Units | % Housing Units |
| Owner Occupied Housing Units | 1,539 | 82.7% |
| Renter-Occupied Housing Units | 321 | 17.3% |
| Total Occupied Housing Units | 1,860 | 100.0% |
Occupancy by Household Size in Englewood Cliffs borough
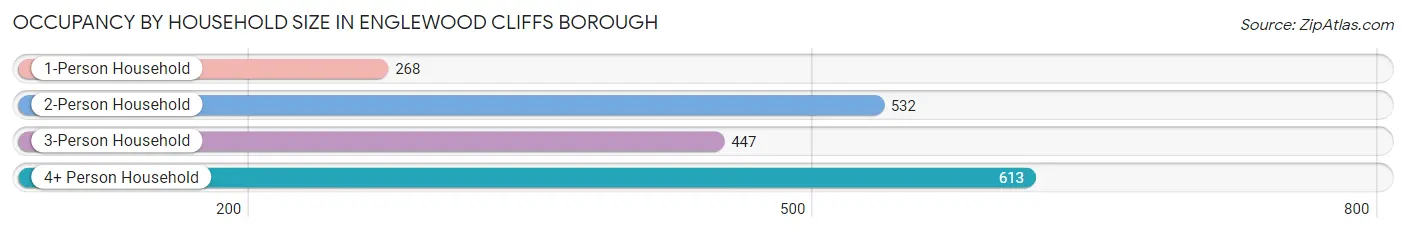
| Household Size | # Housing Units | % Housing Units |
| 1-Person Household | 268 | 14.4% |
| 2-Person Household | 532 | 28.6% |
| 3-Person Household | 447 | 24.0% |
| 4+ Person Household | 613 | 33.0% |
| Total Housing Units | 1,860 | 100.0% |
Occupancy by Ownership by Household Size in Englewood Cliffs borough
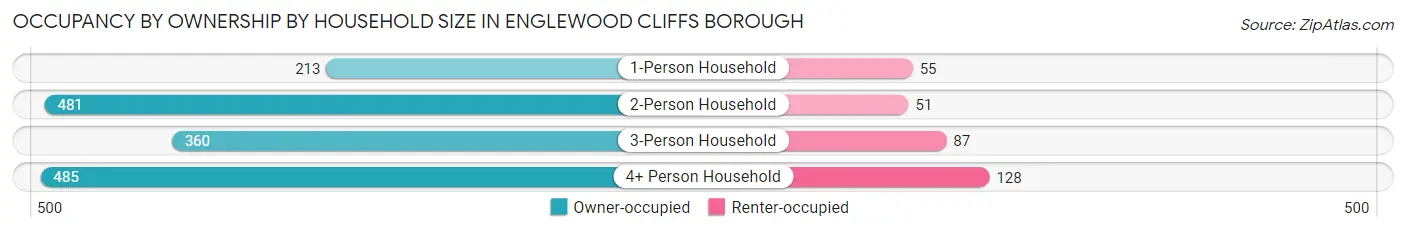
| Household Size | Owner-occupied | Renter-occupied |
| 1-Person Household | 213 (79.5%) | 55 (20.5%) |
| 2-Person Household | 481 (90.4%) | 51 (9.6%) |
| 3-Person Household | 360 (80.5%) | 87 (19.5%) |
| 4+ Person Household | 485 (79.1%) | 128 (20.9%) |
| Total Housing Units | 1,539 (82.7%) | 321 (17.3%) |
Occupancy by Educational Attainment in Englewood Cliffs borough
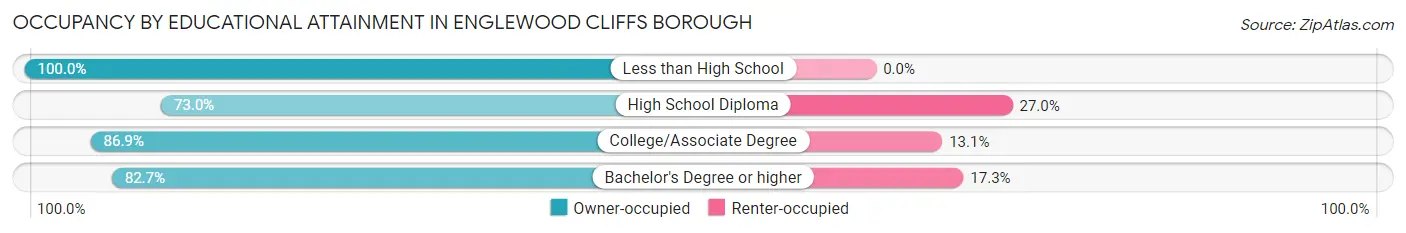
| Household Size | Owner-occupied | Renter-occupied |
| Less than High School | 74 (100.0%) | 0 (0.0%) |
| High School Diploma | 143 (73.0%) | 53 (27.0%) |
| College/Associate Degree | 146 (86.9%) | 22 (13.1%) |
| Bachelor's Degree or higher | 1,176 (82.7%) | 246 (17.3%) |
Occupancy by Age of Householder in Englewood Cliffs borough
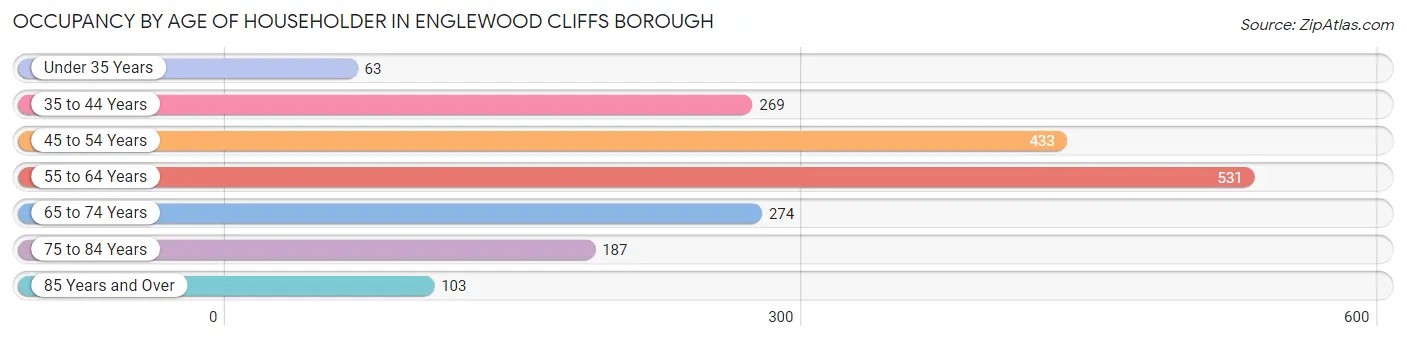
| Age Bracket | # Households | % Households |
| Under 35 Years | 63 | 3.4% |
| 35 to 44 Years | 269 | 14.5% |
| 45 to 54 Years | 433 | 23.3% |
| 55 to 64 Years | 531 | 28.5% |
| 65 to 74 Years | 274 | 14.7% |
| 75 to 84 Years | 187 | 10.1% |
| 85 Years and Over | 103 | 5.5% |
| Total | 1,860 | 100.0% |
Housing Finances in Englewood Cliffs borough
Median Income by Occupancy in Englewood Cliffs borough
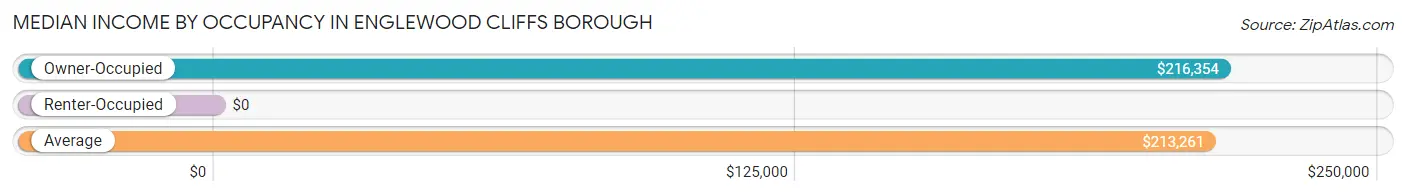
| Occupancy Type | # Households | Median Income |
| Owner-Occupied | 1,539 (82.7%) | $216,354 |
| Renter-Occupied | 321 (17.3%) | $0 |
| Average | 1,860 (100.0%) | $213,261 |
Occupancy by Householder Income Bracket in Englewood Cliffs borough
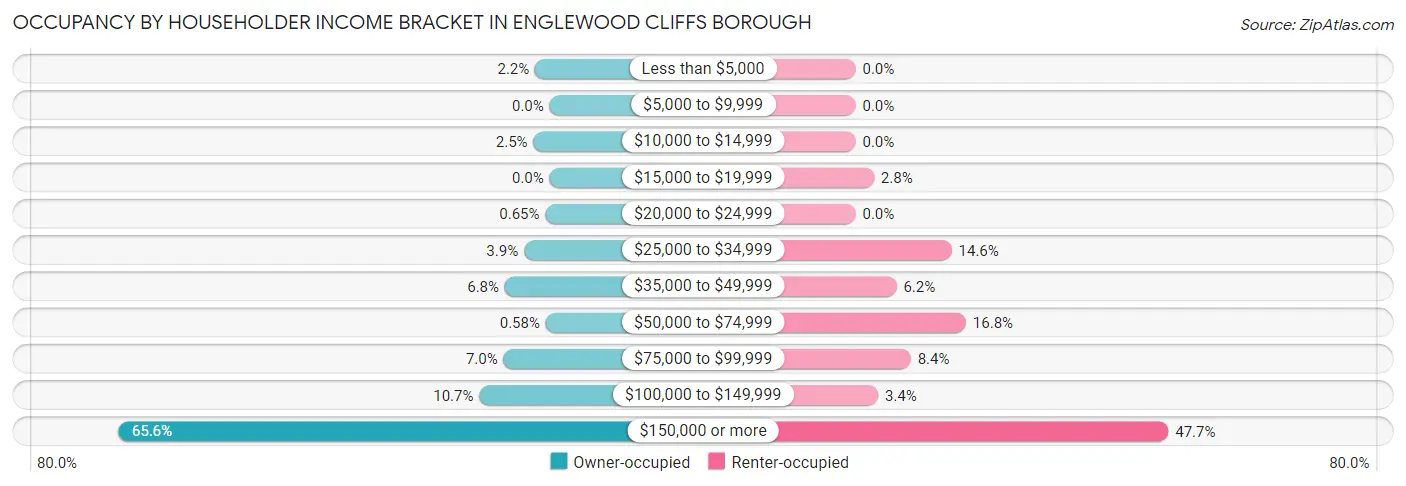
| Income Bracket | Owner-occupied | Renter-occupied |
| Less than $5,000 | 34 (2.2%) | 0 (0.0%) |
| $5,000 to $9,999 | 0 (0.0%) | 0 (0.0%) |
| $10,000 to $14,999 | 38 (2.5%) | 0 (0.0%) |
| $15,000 to $19,999 | 0 (0.0%) | 9 (2.8%) |
| $20,000 to $24,999 | 10 (0.6%) | 0 (0.0%) |
| $25,000 to $34,999 | 60 (3.9%) | 47 (14.6%) |
| $35,000 to $49,999 | 105 (6.8%) | 20 (6.2%) |
| $50,000 to $74,999 | 9 (0.6%) | 54 (16.8%) |
| $75,000 to $99,999 | 108 (7.0%) | 27 (8.4%) |
| $100,000 to $149,999 | 165 (10.7%) | 11 (3.4%) |
| $150,000 or more | 1,010 (65.6%) | 153 (47.7%) |
| Total | 1,539 (100.0%) | 321 (100.0%) |
Monthly Housing Cost Tiers in Englewood Cliffs borough
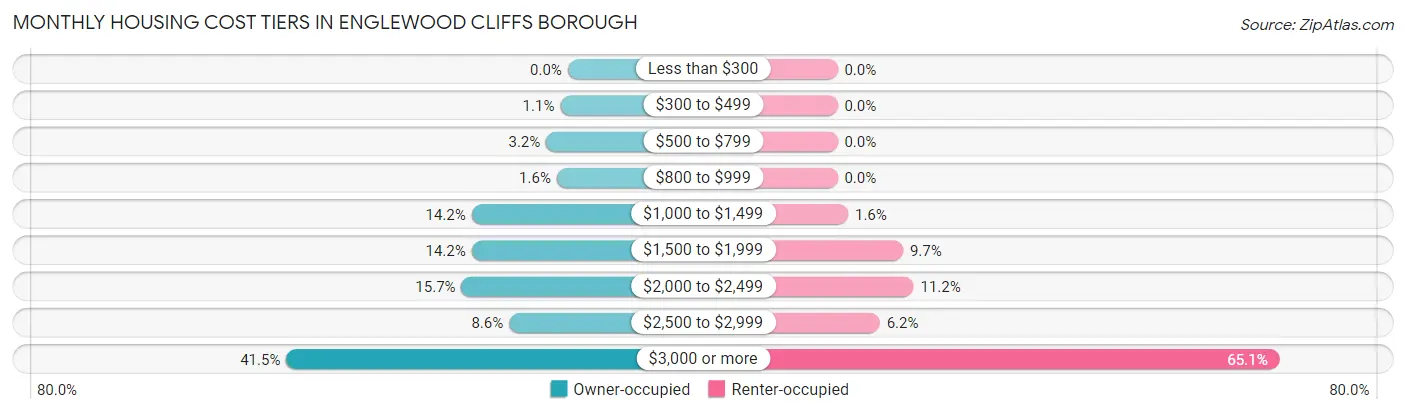
| Monthly Cost | Owner-occupied | Renter-occupied |
| Less than $300 | 0 (0.0%) | 0 (0.0%) |
| $300 to $499 | 17 (1.1%) | 0 (0.0%) |
| $500 to $799 | 49 (3.2%) | 0 (0.0%) |
| $800 to $999 | 25 (1.6%) | 0 (0.0%) |
| $1,000 to $1,499 | 218 (14.2%) | 5 (1.6%) |
| $1,500 to $1,999 | 218 (14.2%) | 31 (9.7%) |
| $2,000 to $2,499 | 241 (15.7%) | 36 (11.2%) |
| $2,500 to $2,999 | 133 (8.6%) | 20 (6.2%) |
| $3,000 or more | 638 (41.5%) | 209 (65.1%) |
| Total | 1,539 (100.0%) | 321 (100.0%) |
Physical Housing Characteristics in Englewood Cliffs borough
Housing Structures in Englewood Cliffs borough
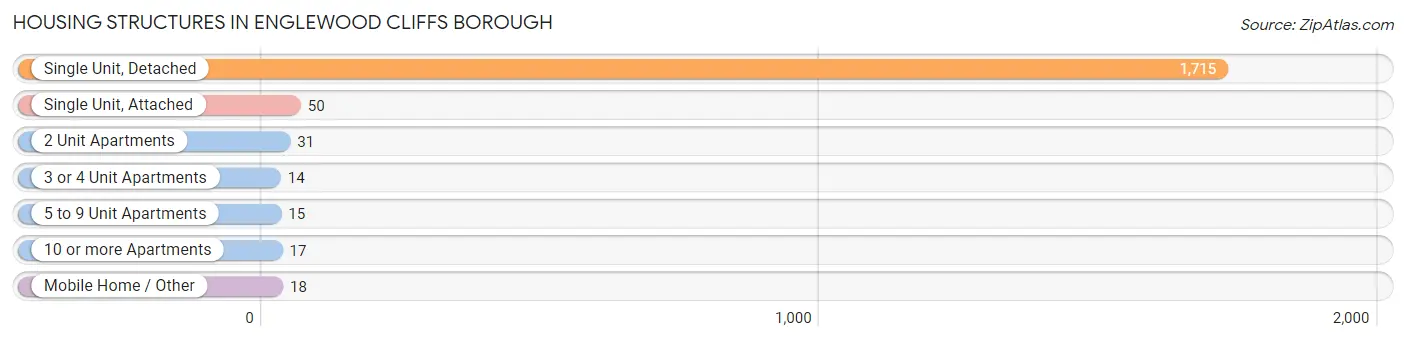
| Structure Type | # Housing Units | % Housing Units |
| Single Unit, Detached | 1,715 | 92.2% |
| Single Unit, Attached | 50 | 2.7% |
| 2 Unit Apartments | 31 | 1.7% |
| 3 or 4 Unit Apartments | 14 | 0.7% |
| 5 to 9 Unit Apartments | 15 | 0.8% |
| 10 or more Apartments | 17 | 0.9% |
| Mobile Home / Other | 18 | 1.0% |
| Total | 1,860 | 100.0% |
Housing Structures by Occupancy in Englewood Cliffs borough
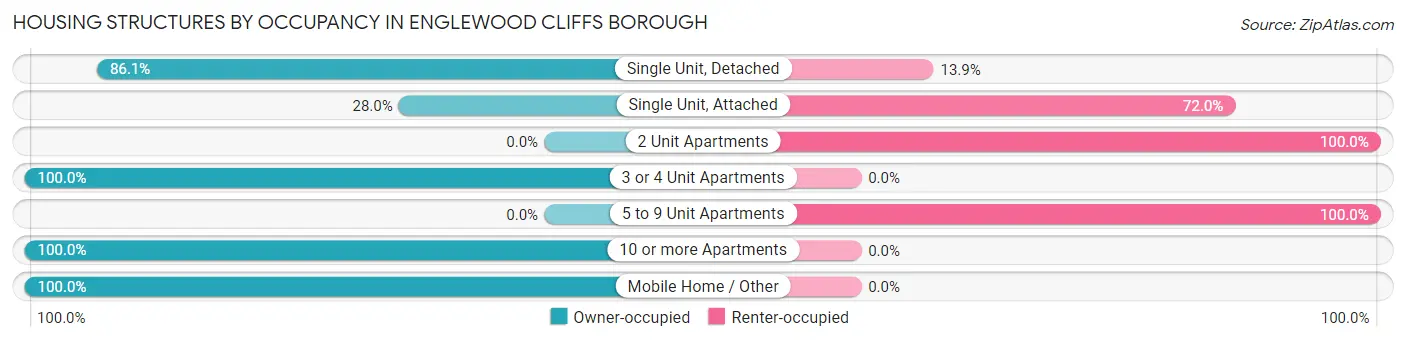
| Structure Type | Owner-occupied | Renter-occupied |
| Single Unit, Detached | 1,476 (86.1%) | 239 (13.9%) |
| Single Unit, Attached | 14 (28.0%) | 36 (72.0%) |
| 2 Unit Apartments | 0 (0.0%) | 31 (100.0%) |
| 3 or 4 Unit Apartments | 14 (100.0%) | 0 (0.0%) |
| 5 to 9 Unit Apartments | 0 (0.0%) | 15 (100.0%) |
| 10 or more Apartments | 17 (100.0%) | 0 (0.0%) |
| Mobile Home / Other | 18 (100.0%) | 0 (0.0%) |
| Total | 1,539 (82.7%) | 321 (17.3%) |
Housing Structures by Number of Rooms in Englewood Cliffs borough
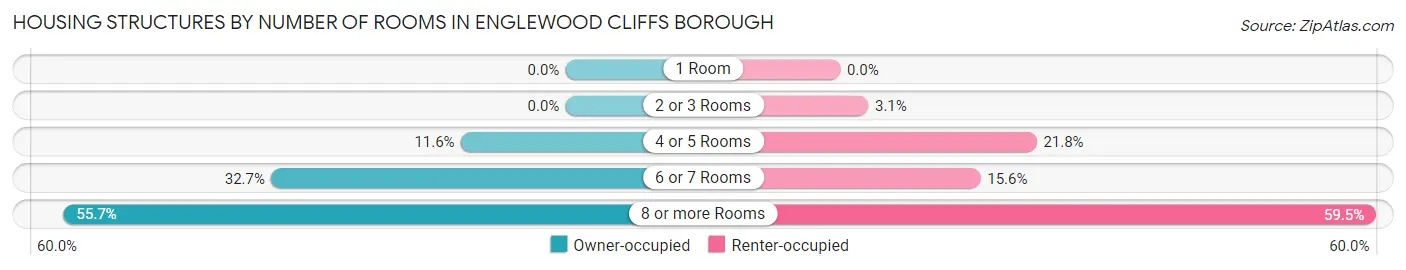
| Number of Rooms | Owner-occupied | Renter-occupied |
| 1 Room | 0 (0.0%) | 0 (0.0%) |
| 2 or 3 Rooms | 0 (0.0%) | 10 (3.1%) |
| 4 or 5 Rooms | 179 (11.6%) | 70 (21.8%) |
| 6 or 7 Rooms | 503 (32.7%) | 50 (15.6%) |
| 8 or more Rooms | 857 (55.7%) | 191 (59.5%) |
| Total | 1,539 (100.0%) | 321 (100.0%) |
Housing Structure by Heating Type in Englewood Cliffs borough
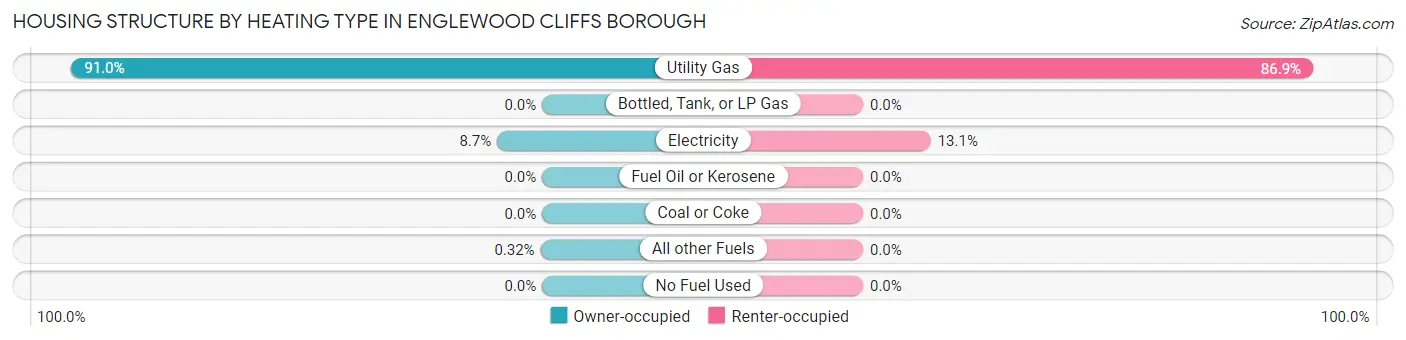
| Heating Type | Owner-occupied | Renter-occupied |
| Utility Gas | 1,400 (91.0%) | 279 (86.9%) |
| Bottled, Tank, or LP Gas | 0 (0.0%) | 0 (0.0%) |
| Electricity | 134 (8.7%) | 42 (13.1%) |
| Fuel Oil or Kerosene | 0 (0.0%) | 0 (0.0%) |
| Coal or Coke | 0 (0.0%) | 0 (0.0%) |
| All other Fuels | 5 (0.3%) | 0 (0.0%) |
| No Fuel Used | 0 (0.0%) | 0 (0.0%) |
| Total | 1,539 (100.0%) | 321 (100.0%) |
Household Vehicle Usage in Englewood Cliffs borough
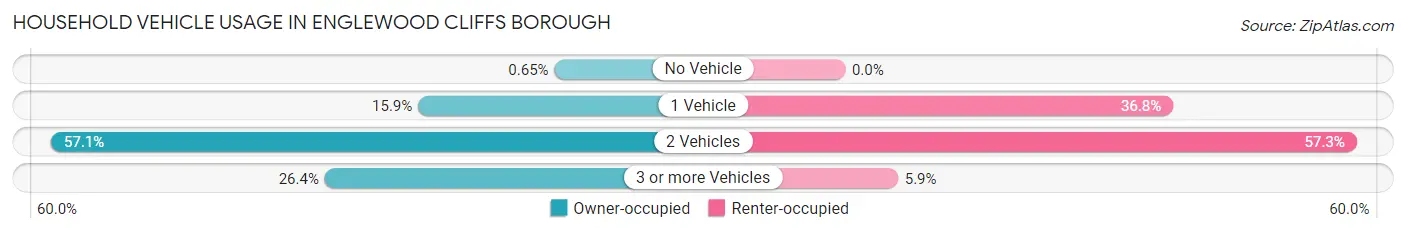
| Vehicles per Household | Owner-occupied | Renter-occupied |
| No Vehicle | 10 (0.6%) | 0 (0.0%) |
| 1 Vehicle | 245 (15.9%) | 118 (36.8%) |
| 2 Vehicles | 878 (57.1%) | 184 (57.3%) |
| 3 or more Vehicles | 406 (26.4%) | 19 (5.9%) |
| Total | 1,539 (100.0%) | 321 (100.0%) |
Real Estate & Mortgages in Englewood Cliffs borough
Real Estate and Mortgage Overview in Englewood Cliffs borough
| Characteristic | Without Mortgage | With Mortgage |
| Housing Units | 828 | 711 |
| Median Property Value | $1,219,700 | $1,242,100 |
| Median Household Income | $193,450 | $521 |
| Monthly Housing Costs | $1,501 | $544 |
| Real Estate Taxes | $10,001 | $33 |
Property Value by Mortgage Status in Englewood Cliffs borough
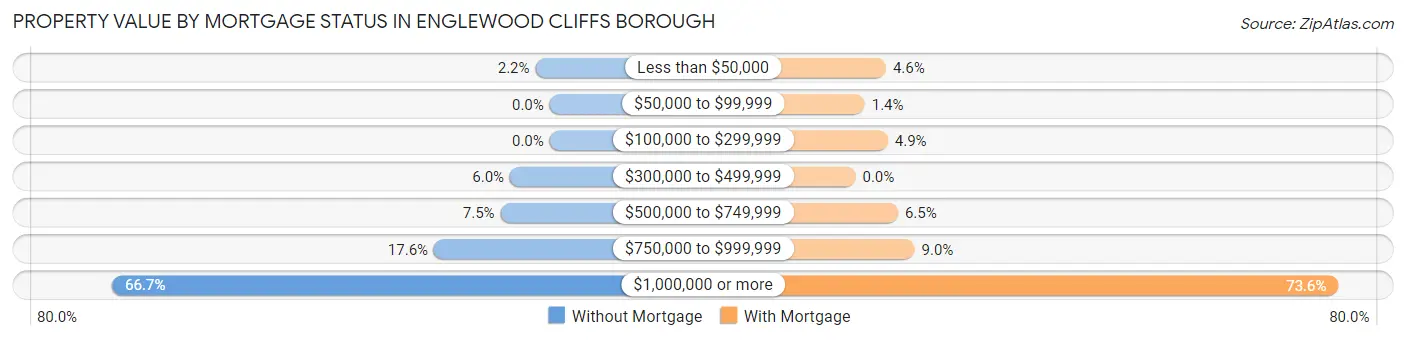
| Property Value | Without Mortgage | With Mortgage |
| Less than $50,000 | 18 (2.2%) | 33 (4.6%) |
| $50,000 to $99,999 | 0 (0.0%) | 10 (1.4%) |
| $100,000 to $299,999 | 0 (0.0%) | 35 (4.9%) |
| $300,000 to $499,999 | 50 (6.0%) | 0 (0.0%) |
| $500,000 to $749,999 | 62 (7.5%) | 46 (6.5%) |
| $750,000 to $999,999 | 146 (17.6%) | 64 (9.0%) |
| $1,000,000 or more | 552 (66.7%) | 523 (73.6%) |
| Total | 828 (100.0%) | 711 (100.0%) |
Household Income by Mortgage Status in Englewood Cliffs borough
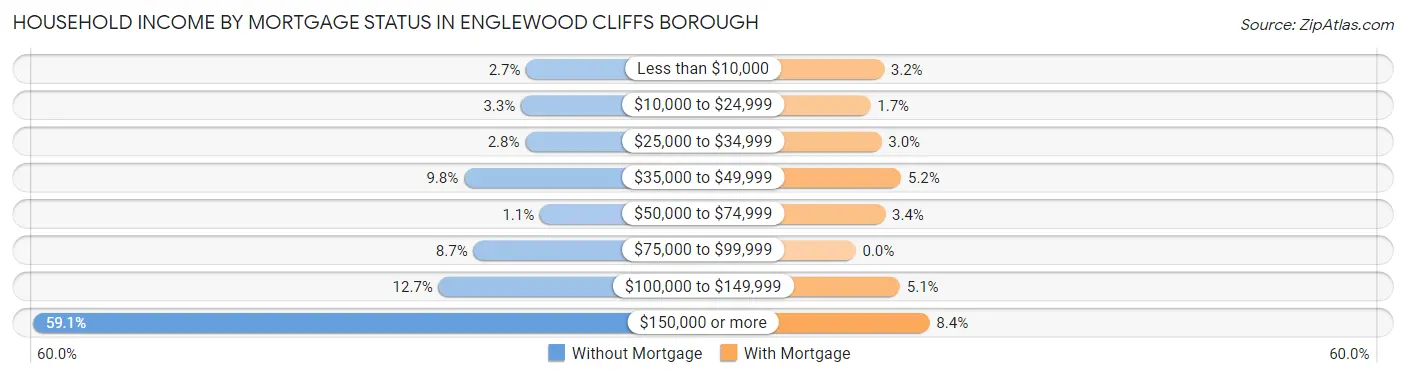
| Household Income | Without Mortgage | With Mortgage |
| Less than $10,000 | 22 (2.7%) | 23 (3.2%) |
| $10,000 to $24,999 | 27 (3.3%) | 12 (1.7%) |
| $25,000 to $34,999 | 23 (2.8%) | 21 (2.9%) |
| $35,000 to $49,999 | 81 (9.8%) | 37 (5.2%) |
| $50,000 to $74,999 | 9 (1.1%) | 24 (3.4%) |
| $75,000 to $99,999 | 72 (8.7%) | 0 (0.0%) |
| $100,000 to $149,999 | 105 (12.7%) | 36 (5.1%) |
| $150,000 or more | 489 (59.1%) | 60 (8.4%) |
| Total | 828 (100.0%) | 711 (100.0%) |
Property Value to Household Income Ratio in Englewood Cliffs borough
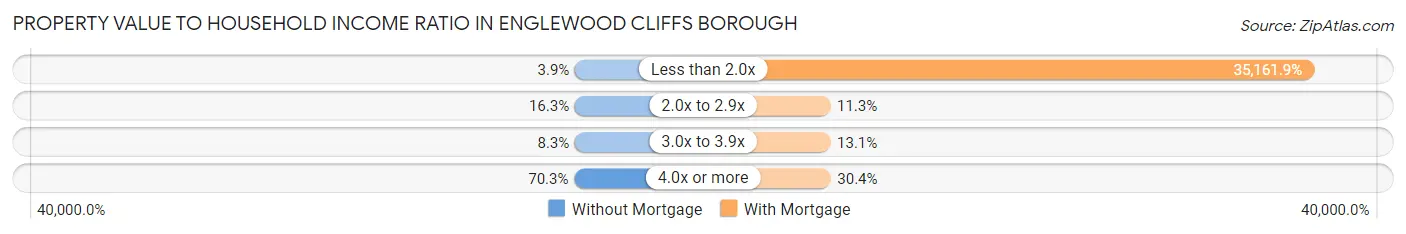
| Value-to-Income Ratio | Without Mortgage | With Mortgage |
| Less than 2.0x | 32 (3.9%) | 250,001 (35,161.9%) |
| 2.0x to 2.9x | 135 (16.3%) | 80 (11.3%) |
| 3.0x to 3.9x | 69 (8.3%) | 93 (13.1%) |
| 4.0x or more | 582 (70.3%) | 216 (30.4%) |
| Total | 828 (100.0%) | 711 (100.0%) |
Real Estate Taxes by Mortgage Status in Englewood Cliffs borough
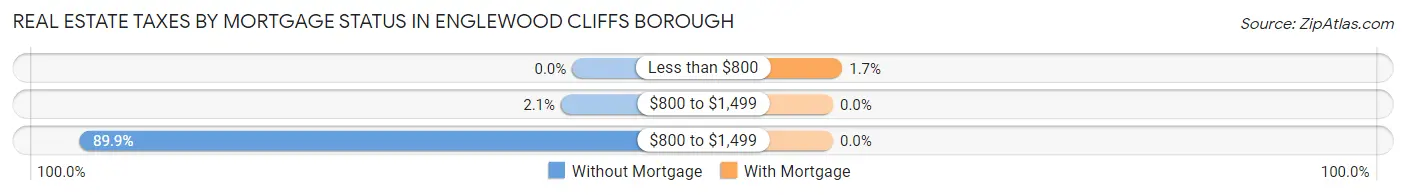
| Property Taxes | Without Mortgage | With Mortgage |
| Less than $800 | 0 (0.0%) | 12 (1.7%) |
| $800 to $1,499 | 17 (2.1%) | 0 (0.0%) |
| $800 to $1,499 | 744 (89.9%) | 0 (0.0%) |
| Total | 828 (100.0%) | 711 (100.0%) |
Health & Disability in Englewood Cliffs borough
Health Insurance Coverage by Age in Englewood Cliffs borough
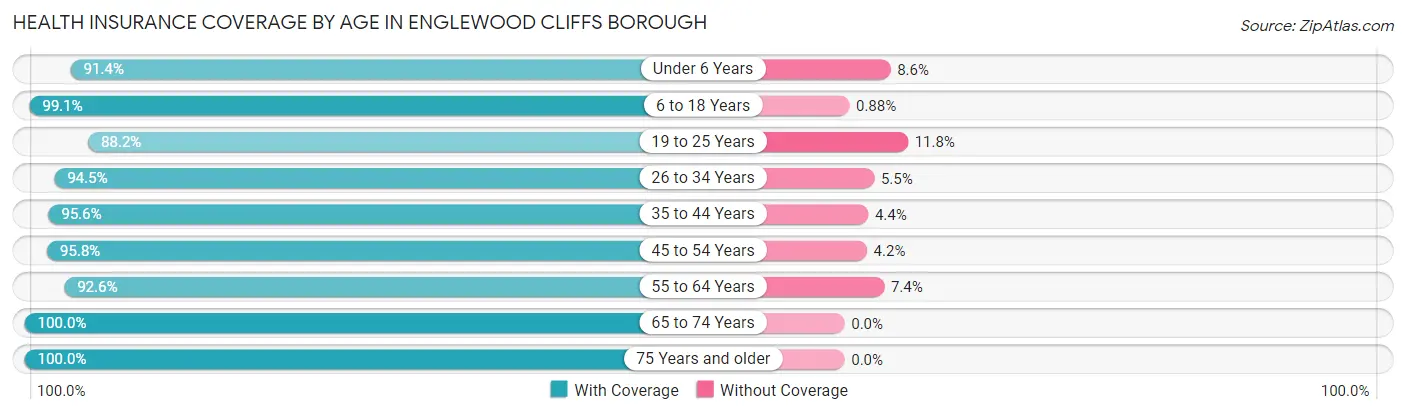
| Age Bracket | With Coverage | Without Coverage |
| Under 6 Years | 224 (91.4%) | 21 (8.6%) |
| 6 to 18 Years | 901 (99.1%) | 8 (0.9%) |
| 19 to 25 Years | 306 (88.2%) | 41 (11.8%) |
| 26 to 34 Years | 222 (94.5%) | 13 (5.5%) |
| 35 to 44 Years | 649 (95.6%) | 30 (4.4%) |
| 45 to 54 Years | 827 (95.8%) | 36 (4.2%) |
| 55 to 64 Years | 913 (92.6%) | 73 (7.4%) |
| 65 to 74 Years | 560 (100.0%) | 0 (0.0%) |
| 75 Years and older | 523 (100.0%) | 0 (0.0%) |
| Total | 5,125 (95.9%) | 222 (4.2%) |
Health Insurance Coverage by Citizenship Status in Englewood Cliffs borough
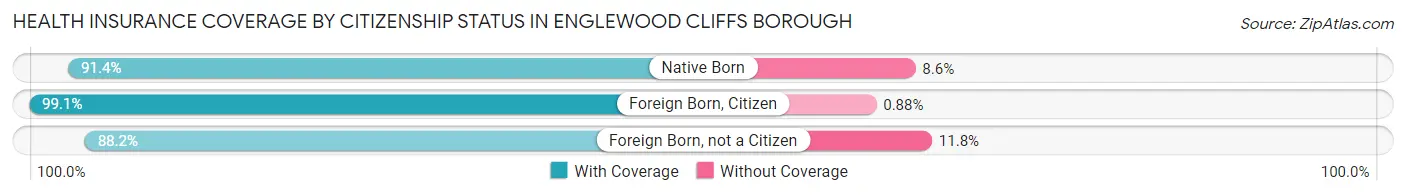
| Citizenship Status | With Coverage | Without Coverage |
| Native Born | 224 (91.4%) | 21 (8.6%) |
| Foreign Born, Citizen | 901 (99.1%) | 8 (0.9%) |
| Foreign Born, not a Citizen | 306 (88.2%) | 41 (11.8%) |
Health Insurance Coverage by Household Income in Englewood Cliffs borough
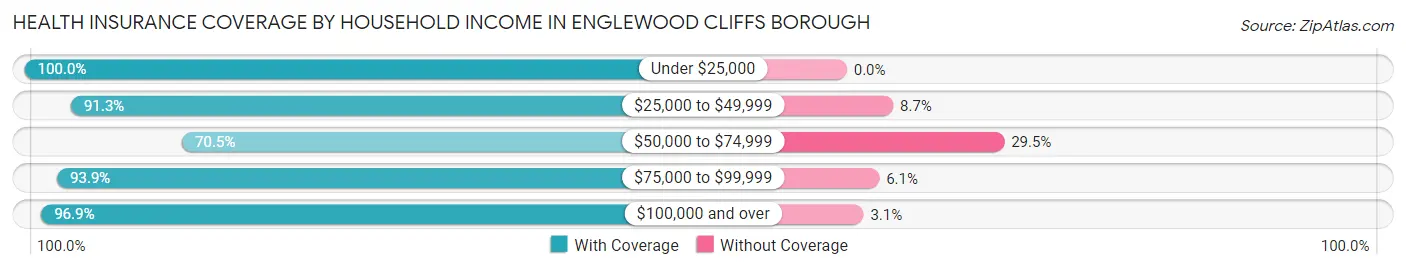
| Household Income | With Coverage | Without Coverage |
| Under $25,000 | 106 (100.0%) | 0 (0.0%) |
| $25,000 to $49,999 | 505 (91.3%) | 48 (8.7%) |
| $50,000 to $74,999 | 55 (70.5%) | 23 (29.5%) |
| $75,000 to $99,999 | 263 (93.9%) | 17 (6.1%) |
| $100,000 and over | 4,157 (96.9%) | 134 (3.1%) |
Public vs Private Health Insurance Coverage by Age in Englewood Cliffs borough
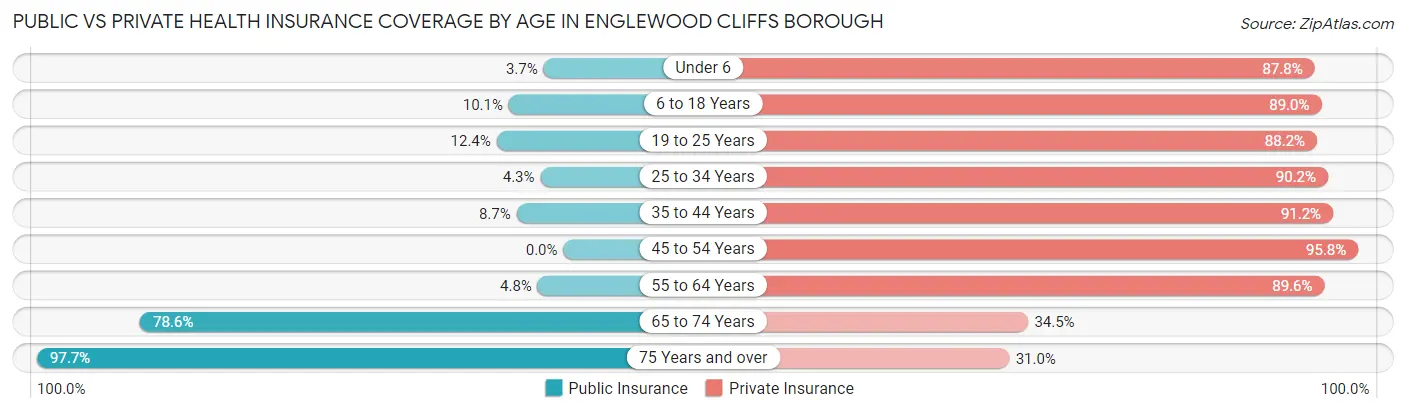
| Age Bracket | Public Insurance | Private Insurance |
| Under 6 | 9 (3.7%) | 215 (87.8%) |
| 6 to 18 Years | 92 (10.1%) | 809 (89.0%) |
| 19 to 25 Years | 43 (12.4%) | 306 (88.2%) |
| 25 to 34 Years | 10 (4.3%) | 212 (90.2%) |
| 35 to 44 Years | 59 (8.7%) | 619 (91.2%) |
| 45 to 54 Years | 0 (0.0%) | 827 (95.8%) |
| 55 to 64 Years | 47 (4.8%) | 883 (89.5%) |
| 65 to 74 Years | 440 (78.6%) | 193 (34.5%) |
| 75 Years and over | 511 (97.7%) | 162 (31.0%) |
| Total | 1,211 (22.7%) | 4,226 (79.0%) |
Disability Status by Sex by Age in Englewood Cliffs borough
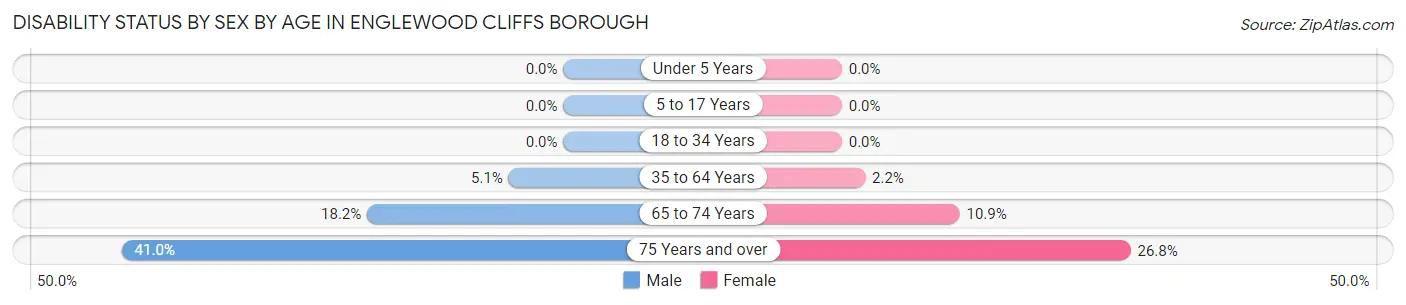
| Age Bracket | Male | Female |
| Under 5 Years | 0 (0.0%) | 0 (0.0%) |
| 5 to 17 Years | 0 (0.0%) | 0 (0.0%) |
| 18 to 34 Years | 0 (0.0%) | 0 (0.0%) |
| 35 to 64 Years | 60 (5.1%) | 29 (2.2%) |
| 65 to 74 Years | 57 (18.2%) | 27 (10.9%) |
| 75 Years and over | 66 (41.0%) | 97 (26.8%) |
Disability Class by Sex by Age in Englewood Cliffs borough
Disability Class: Hearing Difficulty
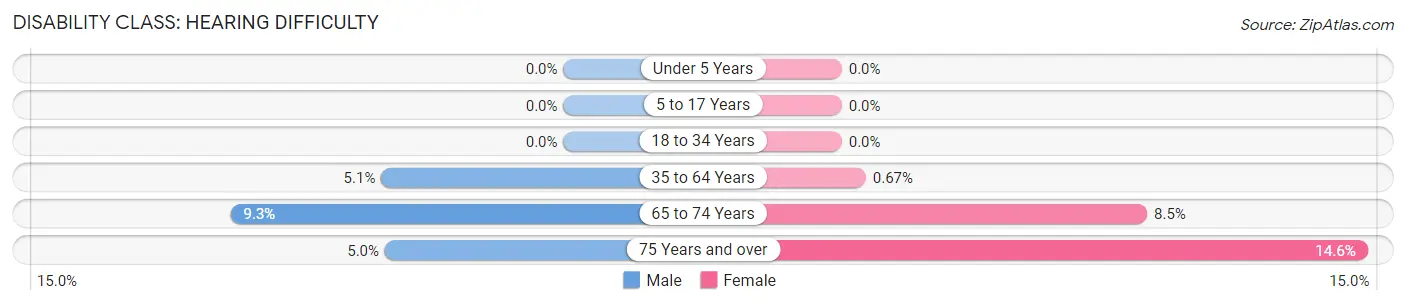
| Age Bracket | Male | Female |
| Under 5 Years | 0 (0.0%) | 0 (0.0%) |
| 5 to 17 Years | 0 (0.0%) | 0 (0.0%) |
| 18 to 34 Years | 0 (0.0%) | 0 (0.0%) |
| 35 to 64 Years | 60 (5.1%) | 9 (0.7%) |
| 65 to 74 Years | 29 (9.3%) | 21 (8.5%) |
| 75 Years and over | 8 (5.0%) | 53 (14.6%) |
Disability Class: Vision Difficulty
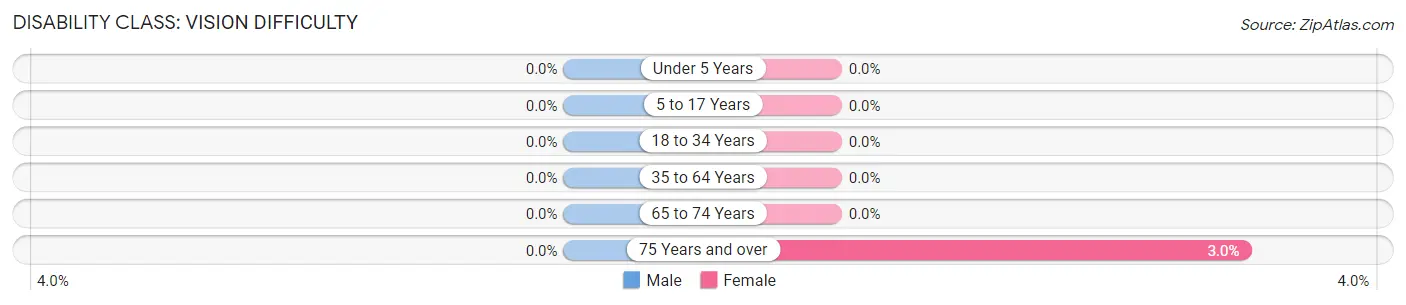
| Age Bracket | Male | Female |
| Under 5 Years | 0 (0.0%) | 0 (0.0%) |
| 5 to 17 Years | 0 (0.0%) | 0 (0.0%) |
| 18 to 34 Years | 0 (0.0%) | 0 (0.0%) |
| 35 to 64 Years | 0 (0.0%) | 0 (0.0%) |
| 65 to 74 Years | 0 (0.0%) | 0 (0.0%) |
| 75 Years and over | 0 (0.0%) | 11 (3.0%) |
Disability Class: Cognitive Difficulty
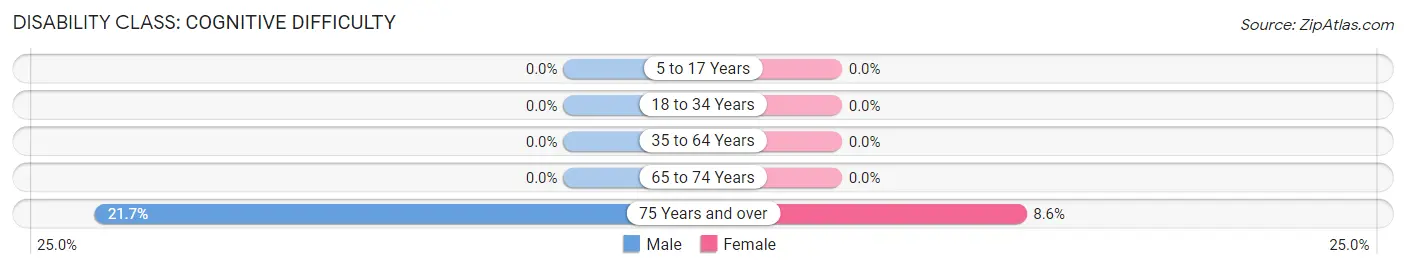
| Age Bracket | Male | Female |
| 5 to 17 Years | 0 (0.0%) | 0 (0.0%) |
| 18 to 34 Years | 0 (0.0%) | 0 (0.0%) |
| 35 to 64 Years | 0 (0.0%) | 0 (0.0%) |
| 65 to 74 Years | 0 (0.0%) | 0 (0.0%) |
| 75 Years and over | 35 (21.7%) | 31 (8.6%) |
Disability Class: Ambulatory Difficulty
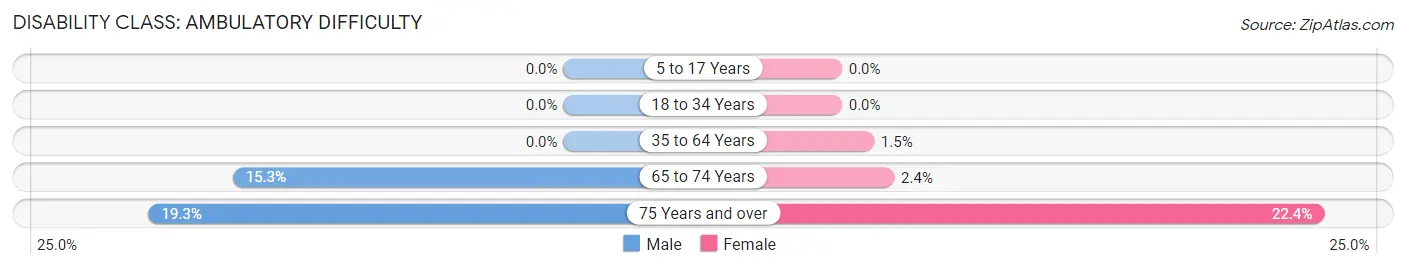
| Age Bracket | Male | Female |
| 5 to 17 Years | 0 (0.0%) | 0 (0.0%) |
| 18 to 34 Years | 0 (0.0%) | 0 (0.0%) |
| 35 to 64 Years | 0 (0.0%) | 20 (1.5%) |
| 65 to 74 Years | 48 (15.3%) | 6 (2.4%) |
| 75 Years and over | 31 (19.3%) | 81 (22.4%) |
Disability Class: Self-Care Difficulty
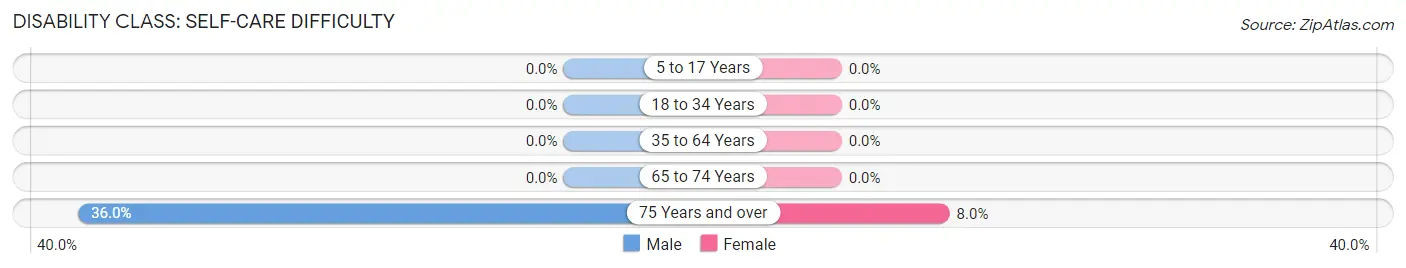
| Age Bracket | Male | Female |
| 5 to 17 Years | 0 (0.0%) | 0 (0.0%) |
| 18 to 34 Years | 0 (0.0%) | 0 (0.0%) |
| 35 to 64 Years | 0 (0.0%) | 0 (0.0%) |
| 65 to 74 Years | 0 (0.0%) | 0 (0.0%) |
| 75 Years and over | 58 (36.0%) | 29 (8.0%) |
Technology Access in Englewood Cliffs borough
Computing Device Access in Englewood Cliffs borough
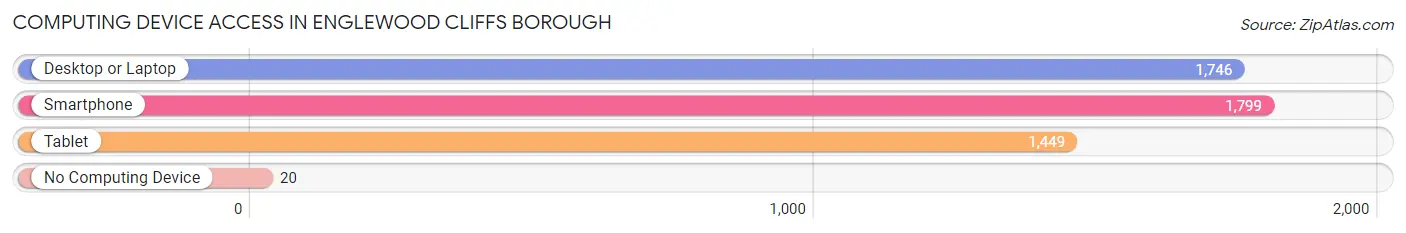
| Device Type | # Households | % Households |
| Desktop or Laptop | 1,746 | 93.9% |
| Smartphone | 1,799 | 96.7% |
| Tablet | 1,449 | 77.9% |
| No Computing Device | 20 | 1.1% |
| Total | 1,860 | 100.0% |
Internet Access in Englewood Cliffs borough
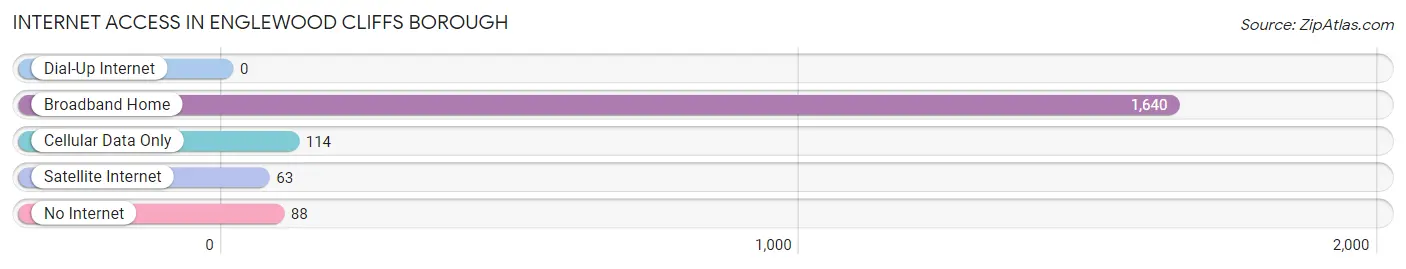
| Internet Type | # Households | % Households |
| Dial-Up Internet | 0 | 0.0% |
| Broadband Home | 1,640 | 88.2% |
| Cellular Data Only | 114 | 6.1% |
| Satellite Internet | 63 | 3.4% |
| No Internet | 88 | 4.7% |
| Total | 1,860 | 100.0% |
Englewood Cliffs borough Summary
Englewood Cliffs Borough is a small borough located in Bergen County, New Jersey. It is situated on the Palisades, a line of steep cliffs along the Hudson River. The borough is home to a population of 5,281 people, as of the 2010 census.
History
Englewood Cliffs was originally inhabited by the Lenape Native Americans. The area was first settled by Europeans in the late 17th century. The first settlers were Dutch farmers who established small farms in the area. In the early 19th century, the area was developed as a resort community. The Palisades Amusement Park was built in the late 19th century and was a popular destination for visitors from New York City.
In the early 20th century, the area began to be developed as a residential community. The borough was incorporated in 1894 and was named after the nearby Englewood Cliffs.
Geography
Englewood Cliffs is located in Bergen County, New Jersey. It is situated on the Palisades, a line of steep cliffs along the Hudson River. The borough is bordered by the towns of Englewood, Fort Lee, and Tenafly. The borough covers an area of 1.9 square miles and has a population of 5,281 people, as of the 2010 census.
The borough is home to several parks, including Palisades Interstate Park, which is a National Historic Landmark. The park offers a variety of recreational activities, including hiking, biking, and fishing.
Economy
Englewood Cliffs is home to a variety of businesses, including financial services, retail, and manufacturing. The borough is also home to several corporate headquarters, including Unilever, LG Electronics, and CNBC.
Demographics
As of the 2010 census, Englewood Cliffs had a population of 5,281 people. The racial makeup of the borough was 73.3% White, 11.2% African American, 0.2% Native American, 11.7% Asian, and 3.6% from other races. The median household income was $117,917, and the median family income was $136,917.
The borough is home to a variety of religious denominations, including Roman Catholic, Protestant, and Jewish. The borough is also home to a variety of educational institutions, including Englewood Cliffs Public Schools, which serves students in grades K-8.
Conclusion
Englewood Cliffs is a small borough located in Bergen County, New Jersey. It is situated on the Palisades, a line of steep cliffs along the Hudson River. The borough is home to a population of 5,281 people, as of the 2010 census. The borough is home to a variety of businesses, including financial services, retail, and manufacturing. The borough is also home to several corporate headquarters, including Unilever, LG Electronics, and CNBC. The borough is home to a variety of religious denominations, including Roman Catholic, Protestant, and Jewish. The borough is also home to a variety of educational institutions, including Englewood Cliffs Public Schools, which serves students in grades K-8.
Common Questions
What is Per Capita Income in Englewood Cliffs borough?
Per Capita income in Englewood Cliffs borough is $102,113.
What is the Median Family Income in Englewood Cliffs borough?
Median Family Income in Englewood Cliffs borough is $250,001.
What is the Median Household income in Englewood Cliffs borough?
Median Household Income in Englewood Cliffs borough is $213,261.
What is Income or Wage Gap in Englewood Cliffs borough?
Income or Wage Gap in Englewood Cliffs borough is 44.2%.
Women in Englewood Cliffs borough earn 55.8 cents for every dollar earned by a man.
What is Inequality or Gini Index in Englewood Cliffs borough?
Inequality or Gini Index in Englewood Cliffs borough is 0.51.
What is the Total Population of Englewood Cliffs borough?
Total Population of Englewood Cliffs borough is 5,347.
What is the Total Male Population of Englewood Cliffs borough?
Total Male Population of Englewood Cliffs borough is 2,627.
What is the Total Female Population of Englewood Cliffs borough?
Total Female Population of Englewood Cliffs borough is 2,720.
What is the Ratio of Males per 100 Females in Englewood Cliffs borough?
There are 96.58 Males per 100 Females in Englewood Cliffs borough.
What is the Ratio of Females per 100 Males in Englewood Cliffs borough?
There are 103.54 Females per 100 Males in Englewood Cliffs borough.
What is the Median Population Age in Englewood Cliffs borough?
Median Population Age in Englewood Cliffs borough is 49.0 Years.
What is the Average Family Size in Englewood Cliffs borough
Average Family Size in Englewood Cliffs borough is 3.2 People.
What is the Average Household Size in Englewood Cliffs borough
Average Household Size in Englewood Cliffs borough is 2.9 People.
How Large is the Labor Force in Englewood Cliffs borough?
There are 2,842 People in the Labor Forcein in Englewood Cliffs borough.
What is the Percentage of People in the Labor Force in Englewood Cliffs borough?
65.0% of People are in the Labor Force in Englewood Cliffs borough.
What is the Unemployment Rate in Englewood Cliffs borough?
Unemployment Rate in Englewood Cliffs borough is 6.8%.