Monmouth Beach borough, NJ Map & Demographics
Monmouth Beach borough Overview
$116,528
PER CAPITA INCOME
$220,500
AVG FAMILY INCOME
$144,792
AVG HOUSEHOLD INCOME
43.9%
WAGE / INCOME GAP [ % ]
56.1¢/ $1
WAGE / INCOME GAP [ $ ]
0.52
INEQUALITY / GINI INDEX
3,199
TOTAL POPULATION
1,514
MALE POPULATION
1,685
FEMALE POPULATION
89.85
MALES / 100 FEMALES
111.29
FEMALES / 100 MALES
57.9
MEDIAN AGE
2.8
AVG FAMILY SIZE
2.1
AVG HOUSEHOLD SIZE
1,705
LABOR FORCE [ PEOPLE ]
59.8%
PERCENT IN LABOR FORCE
4.2%
UNEMPLOYMENT RATE
Income in Monmouth Beach borough
Income Overview in Monmouth Beach borough
Per Capita Income in Monmouth Beach borough is $116,528, while median incomes of families and households are $220,500 and $144,792 respectively.
| Characteristic | Number | Measure |
| Per Capita Income | 3,199 | $116,528 |
| Median Family Income | 914 | $220,500 |
| Mean Family Income | 914 | $333,293 |
| Median Household Income | 1,520 | $144,792 |
| Mean Household Income | 1,520 | $249,545 |
| Income Deficit | 914 | $0 |
| Wage / Income Gap (%) | 3,199 | 43.87% |
| Wage / Income Gap ($) | 3,199 | 56.13¢ per $1 |
| Gini / Inequality Index | 3,199 | 0.52 |
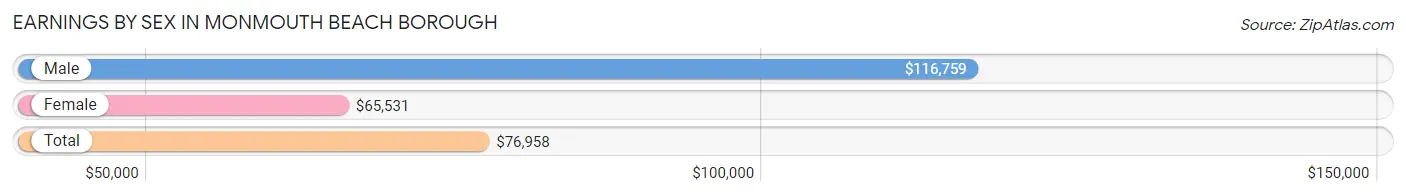
Earnings by Sex in Monmouth Beach borough
Average Earnings in Monmouth Beach borough are $76,958, $116,759 for men and $65,531 for women, a difference of 43.9%.
| Sex | Number | Average Earnings |
| Male | 900 (49.3%) | $116,759 |
| Female | 927 (50.7%) | $65,531 |
| Total | 1,827 (100.0%) | $76,958 |
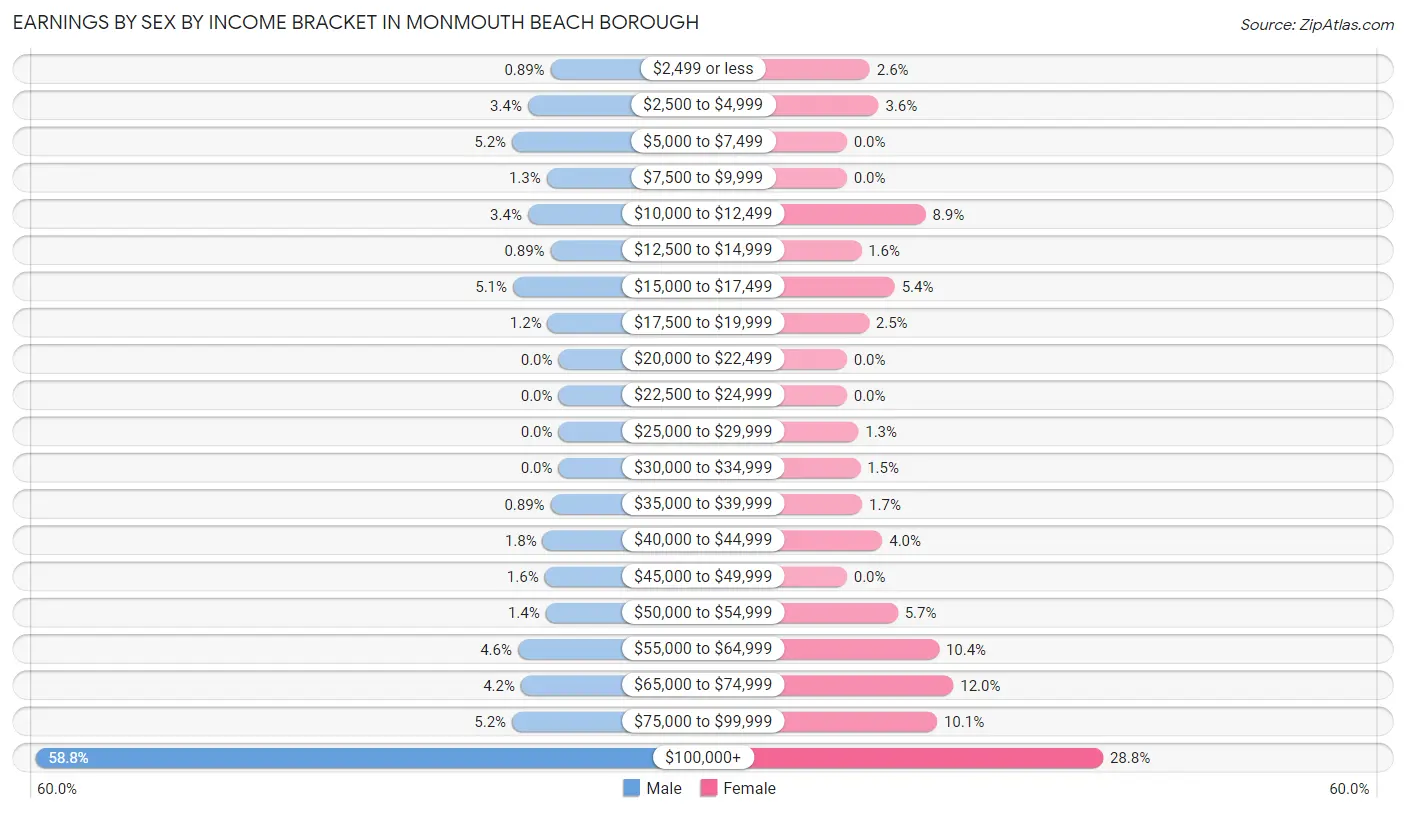
Earnings by Sex by Income Bracket in Monmouth Beach borough
The most common earnings brackets in Monmouth Beach borough are $100,000+ for men (529 | 58.8%) and $100,000+ for women (267 | 28.8%).
| Income | Male | Female |
| $2,499 or less | 8 (0.9%) | 24 (2.6%) |
| $2,500 to $4,999 | 31 (3.4%) | 33 (3.6%) |
| $5,000 to $7,499 | 47 (5.2%) | 0 (0.0%) |
| $7,500 to $9,999 | 12 (1.3%) | 0 (0.0%) |
| $10,000 to $12,499 | 31 (3.4%) | 82 (8.8%) |
| $12,500 to $14,999 | 8 (0.9%) | 15 (1.6%) |
| $15,000 to $17,499 | 46 (5.1%) | 50 (5.4%) |
| $17,500 to $19,999 | 11 (1.2%) | 23 (2.5%) |
| $20,000 to $22,499 | 0 (0.0%) | 0 (0.0%) |
| $22,500 to $24,999 | 0 (0.0%) | 0 (0.0%) |
| $25,000 to $29,999 | 0 (0.0%) | 12 (1.3%) |
| $30,000 to $34,999 | 0 (0.0%) | 14 (1.5%) |
| $35,000 to $39,999 | 8 (0.9%) | 16 (1.7%) |
| $40,000 to $44,999 | 16 (1.8%) | 37 (4.0%) |
| $45,000 to $49,999 | 14 (1.6%) | 0 (0.0%) |
| $50,000 to $54,999 | 13 (1.4%) | 53 (5.7%) |
| $55,000 to $64,999 | 41 (4.6%) | 96 (10.4%) |
| $65,000 to $74,999 | 38 (4.2%) | 111 (12.0%) |
| $75,000 to $99,999 | 47 (5.2%) | 94 (10.1%) |
| $100,000+ | 529 (58.8%) | 267 (28.8%) |
| Total | 900 (100.0%) | 927 (100.0%) |
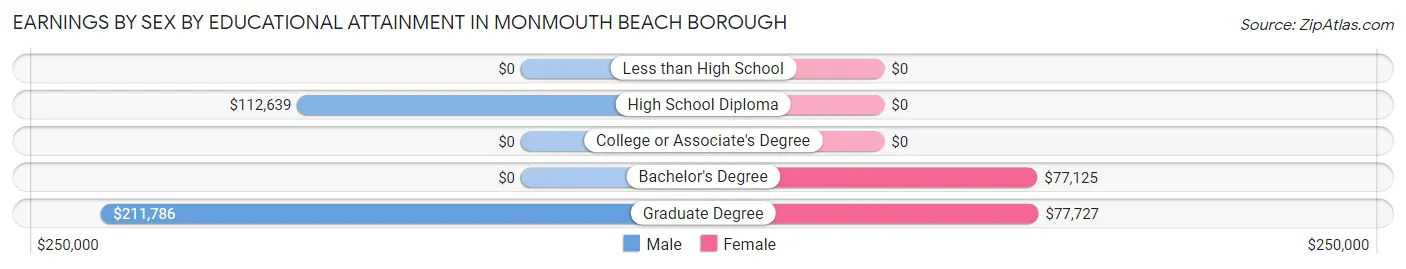
Earnings by Sex by Educational Attainment in Monmouth Beach borough
Average earnings in Monmouth Beach borough are $146,458 for men and $67,582 for women, a difference of 53.9%. Men with an educational attainment of graduate degree enjoy the highest average annual earnings of $211,786, while those with high school diploma education earn the least with $112,639. Women with an educational attainment of graduate degree earn the most with the average annual earnings of $77,727, while those with bachelor's degree education have the smallest earnings of $77,125.
| Educational Attainment | Male Income | Female Income |
| Less than High School | - | - |
| High School Diploma | $112,639 | $0 |
| College or Associate's Degree | - | - |
| Bachelor's Degree | - | - |
| Graduate Degree | $211,786 | $77,727 |
| Total | $146,458 | $67,582 |
Family Income in Monmouth Beach borough
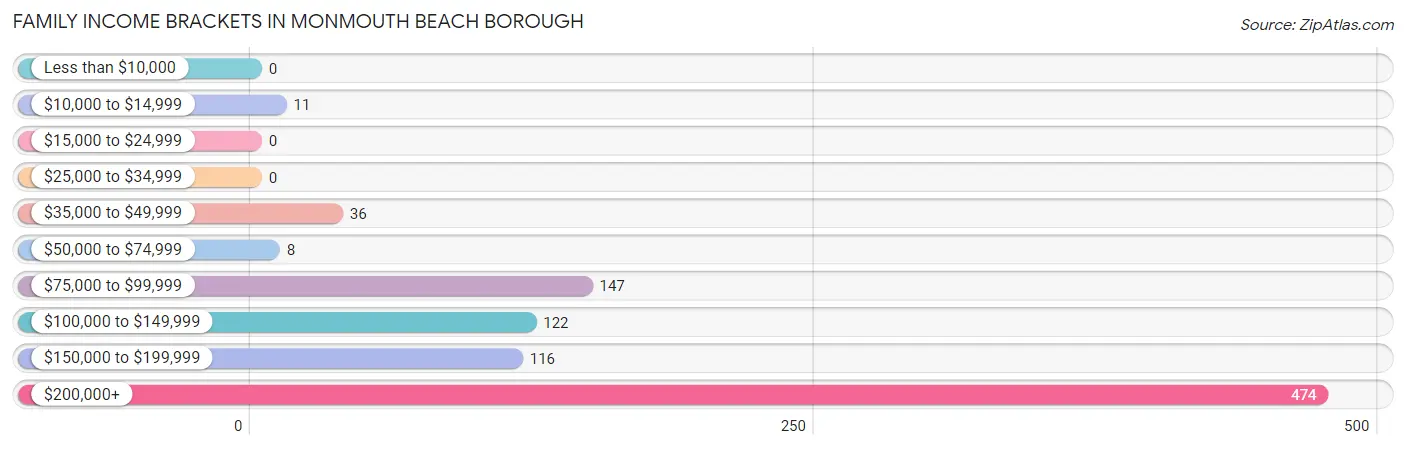
Family Income Brackets in Monmouth Beach borough
According to the Monmouth Beach borough family income data, there are 474 families falling into the $200,000+ income range, which is the most common income bracket and makes up 51.9% of all families.
| Income Bracket | # Families | % Families |
| Less than $10,000 | 0 | 0.0% |
| $10,000 to $14,999 | 11 | 1.2% |
| $15,000 to $24,999 | 0 | 0.0% |
| $25,000 to $34,999 | 0 | 0.0% |
| $35,000 to $49,999 | 36 | 3.9% |
| $50,000 to $74,999 | 8 | 0.9% |
| $75,000 to $99,999 | 147 | 16.1% |
| $100,000 to $149,999 | 122 | 13.3% |
| $150,000 to $199,999 | 116 | 12.7% |
| $200,000+ | 474 | 51.9% |
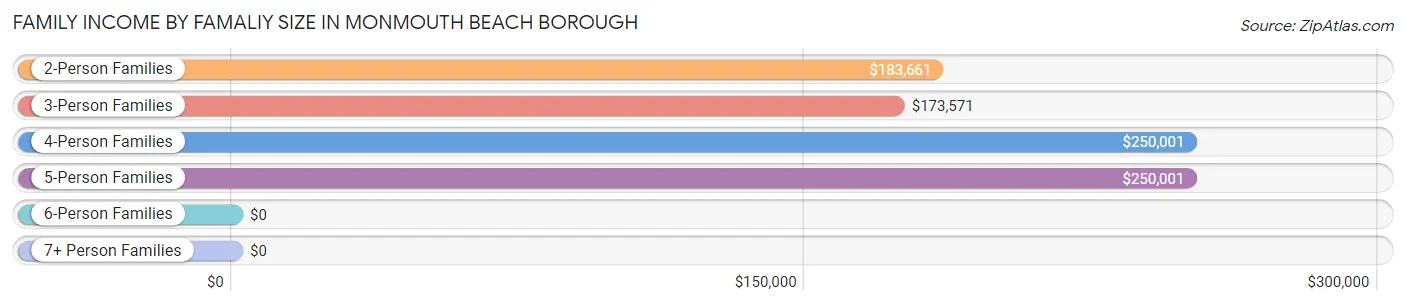
Family Income by Famaliy Size in Monmouth Beach borough
4-person families (72 | 7.9%) account for the highest median family income in Monmouth Beach borough with $250,001 per family, while 2-person families (491 | 53.7%) have the highest median income of $91,830 per family member.
| Income Bracket | # Families | Median Income |
| 2-Person Families | 491 (53.7%) | $183,661 |
| 3-Person Families | 274 (30.0%) | $173,571 |
| 4-Person Families | 72 (7.9%) | $250,001 |
| 5-Person Families | 54 (5.9%) | $250,001 |
| 6-Person Families | 23 (2.5%) | $0 |
| 7+ Person Families | 0 (0.0%) | $0 |
| Total | 914 (100.0%) | $220,500 |
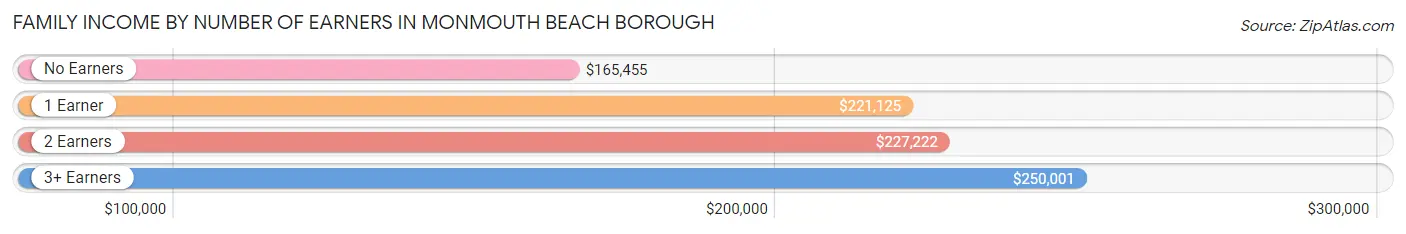
Family Income by Number of Earners in Monmouth Beach borough
The median family income in Monmouth Beach borough is $220,500, with families comprising 3+ earners (147) having the highest median family income of $250,001, while families with no earners (216) have the lowest median family income of $165,455, accounting for 16.1% and 23.6% of families, respectively.
| Number of Earners | # Families | Median Income |
| No Earners | 216 (23.6%) | $165,455 |
| 1 Earner | 209 (22.9%) | $221,125 |
| 2 Earners | 342 (37.4%) | $227,222 |
| 3+ Earners | 147 (16.1%) | $250,001 |
| Total | 914 (100.0%) | $220,500 |
Household Income in Monmouth Beach borough
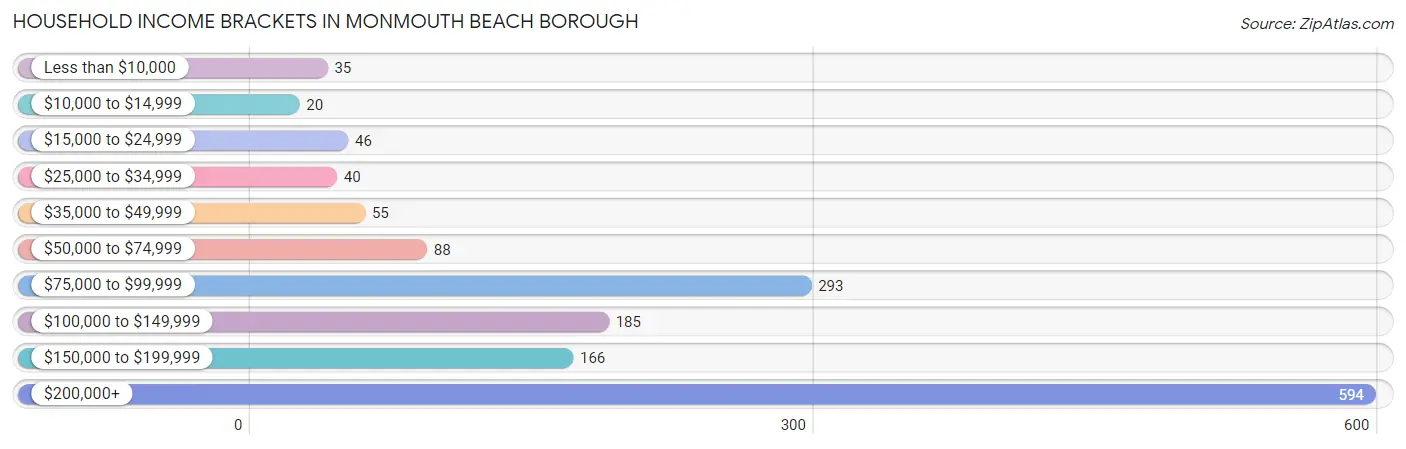
Household Income Brackets in Monmouth Beach borough
With 594 households falling in the category, the $200,000+ income range is the most frequent in Monmouth Beach borough, accounting for 39.1% of all households. In contrast, only 20 households (1.3%) fall into the $10,000 to $14,999 income bracket, making it the least populous group.
| Income Bracket | # Households | % Households |
| Less than $10,000 | 35 | 2.3% |
| $10,000 to $14,999 | 20 | 1.3% |
| $15,000 to $24,999 | 46 | 3.0% |
| $25,000 to $34,999 | 40 | 2.6% |
| $35,000 to $49,999 | 55 | 3.6% |
| $50,000 to $74,999 | 88 | 5.8% |
| $75,000 to $99,999 | 293 | 19.3% |
| $100,000 to $149,999 | 185 | 12.2% |
| $150,000 to $199,999 | 166 | 10.9% |
| $200,000+ | 594 | 39.1% |
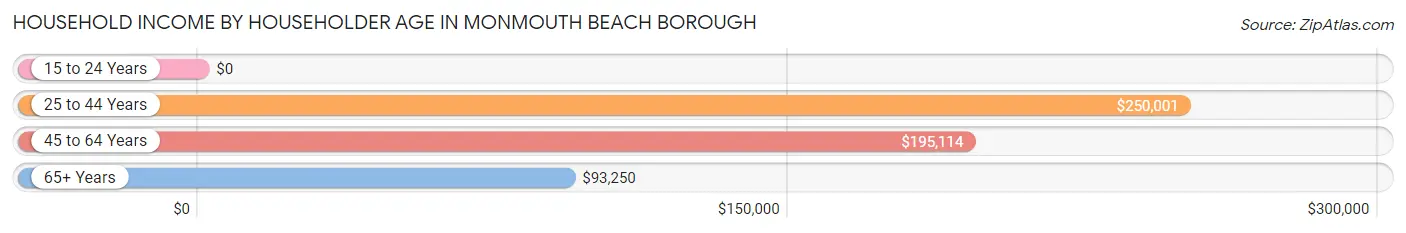
Household Income by Householder Age in Monmouth Beach borough
The median household income in Monmouth Beach borough is $144,792, with the highest median household income of $250,001 found in the 25 to 44 years age bracket for the primary householder. A total of 202 households (13.3%) fall into this category.
| Income Bracket | # Households | Median Income |
| 15 to 24 Years | 0 (0.0%) | $0 |
| 25 to 44 Years | 202 (13.3%) | $250,001 |
| 45 to 64 Years | 713 (46.9%) | $195,114 |
| 65+ Years | 605 (39.8%) | $93,250 |
| Total | 1,520 (100.0%) | $144,792 |
Poverty in Monmouth Beach borough
Income Below Poverty by Sex and Age in Monmouth Beach borough
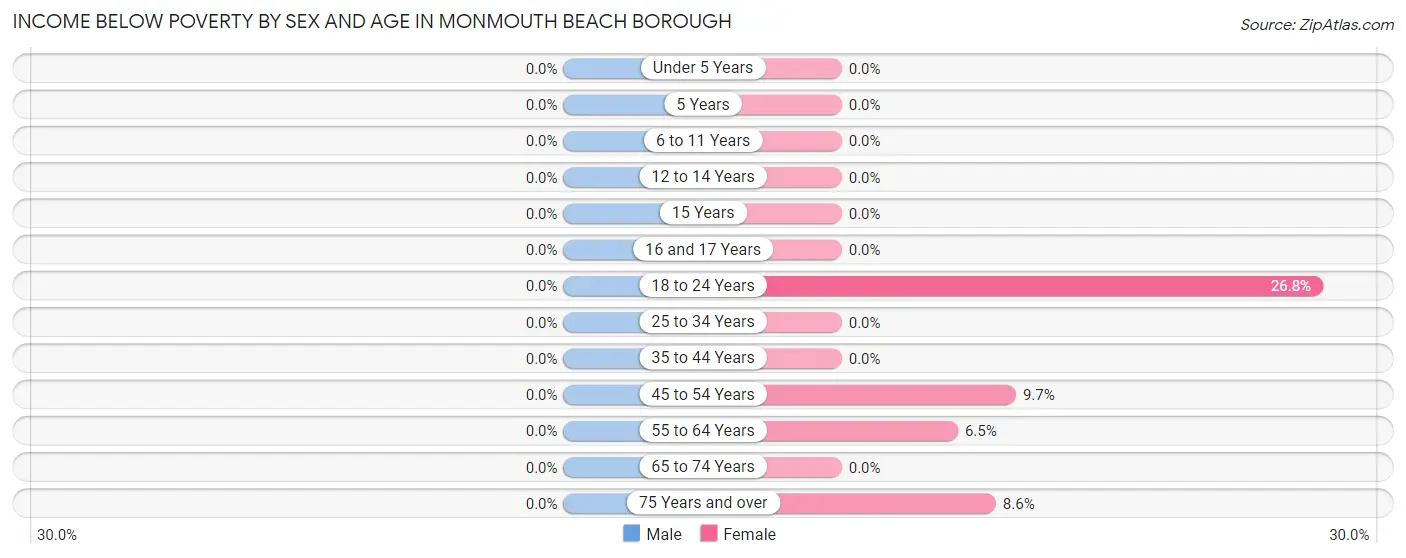
| Age Bracket | Male | Female |
| Under 5 Years | 0 (0.0%) | 0 (0.0%) |
| 5 Years | 0 (0.0%) | 0 (0.0%) |
| 6 to 11 Years | 0 (0.0%) | 0 (0.0%) |
| 12 to 14 Years | 0 (0.0%) | 0 (0.0%) |
| 15 Years | 0 (0.0%) | 0 (0.0%) |
| 16 and 17 Years | 0 (0.0%) | 0 (0.0%) |
| 18 to 24 Years | 0 (0.0%) | 15 (26.8%) |
| 25 to 34 Years | 0 (0.0%) | 0 (0.0%) |
| 35 to 44 Years | 0 (0.0%) | 0 (0.0%) |
| 45 to 54 Years | 0 (0.0%) | 13 (9.7%) |
| 55 to 64 Years | 0 (0.0%) | 31 (6.5%) |
| 65 to 74 Years | 0 (0.0%) | 0 (0.0%) |
| 75 Years and over | 0 (0.0%) | 23 (8.6%) |
| Total | 0 (0.0%) | 82 (4.9%) |
Income Above Poverty by Sex and Age in Monmouth Beach borough
According to the poverty statistics in Monmouth Beach borough, males aged under 5 years and females aged under 5 years are the age groups that are most secure financially, with 100.0% of males and 100.0% of females in these age groups living above the poverty line.
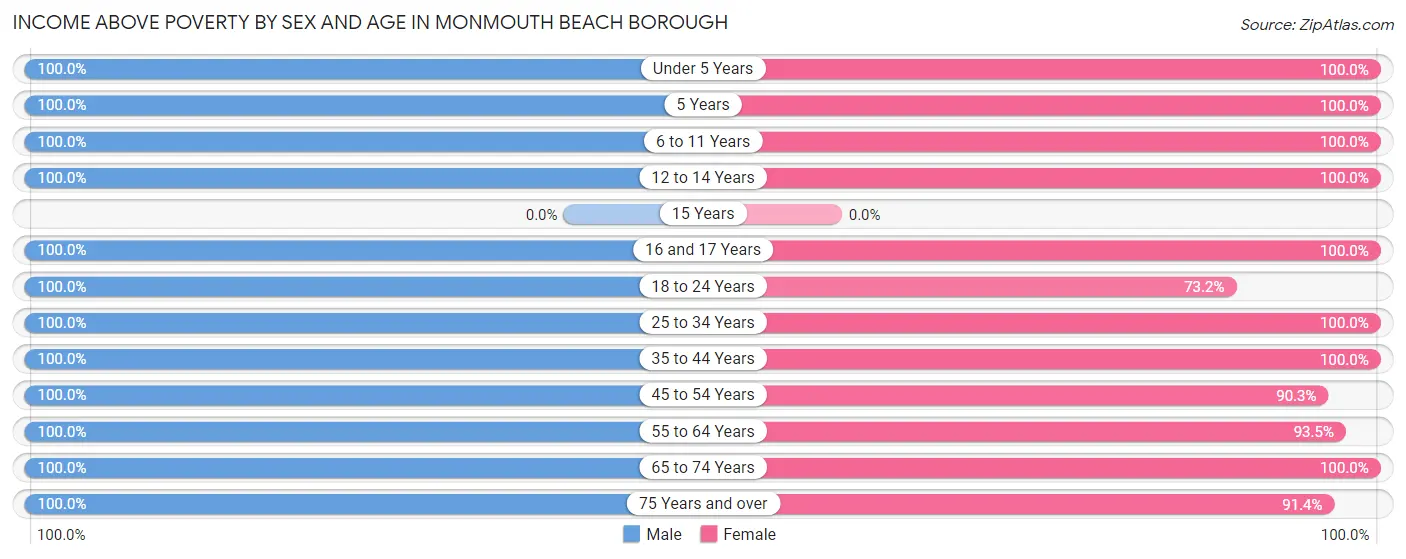
| Age Bracket | Male | Female |
| Under 5 Years | 47 (100.0%) | 29 (100.0%) |
| 5 Years | 11 (100.0%) | 64 (100.0%) |
| 6 to 11 Years | 108 (100.0%) | 47 (100.0%) |
| 12 to 14 Years | 13 (100.0%) | 28 (100.0%) |
| 15 Years | 0 (0.0%) | 0 (0.0%) |
| 16 and 17 Years | 13 (100.0%) | 11 (100.0%) |
| 18 to 24 Years | 158 (100.0%) | 41 (73.2%) |
| 25 to 34 Years | 91 (100.0%) | 229 (100.0%) |
| 35 to 44 Years | 45 (100.0%) | 43 (100.0%) |
| 45 to 54 Years | 265 (100.0%) | 121 (90.3%) |
| 55 to 64 Years | 356 (100.0%) | 448 (93.5%) |
| 65 to 74 Years | 221 (100.0%) | 297 (100.0%) |
| 75 Years and over | 186 (100.0%) | 245 (91.4%) |
| Total | 1,514 (100.0%) | 1,603 (95.1%) |
Income Below Poverty Among Married-Couple Families in Monmouth Beach borough
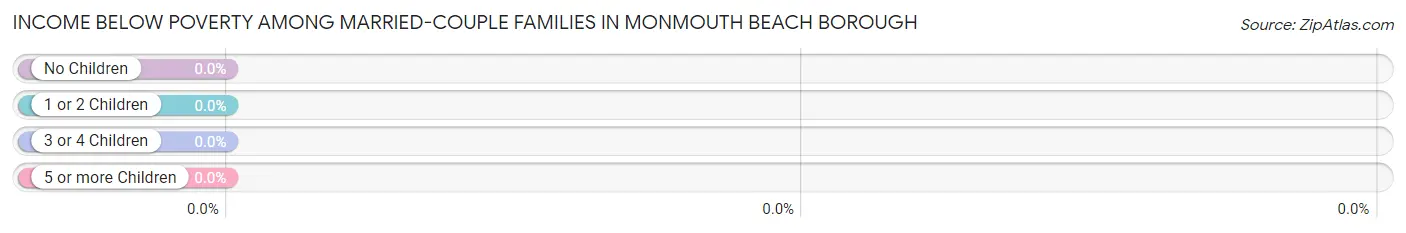
| Children | Above Poverty | Below Poverty |
| No Children | 612 (100.0%) | 0 (0.0%) |
| 1 or 2 Children | 131 (100.0%) | 0 (0.0%) |
| 3 or 4 Children | 59 (100.0%) | 0 (0.0%) |
| 5 or more Children | 0 (0.0%) | 0 (0.0%) |
| Total | 802 (100.0%) | 0 (0.0%) |
Income Below Poverty Among Single-Parent Households in Monmouth Beach borough
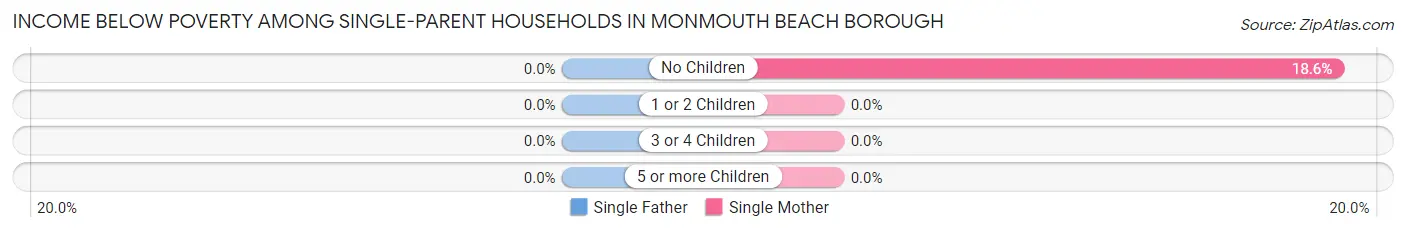
| Children | Single Father | Single Mother |
| No Children | 0 (0.0%) | 11 (18.6%) |
| 1 or 2 Children | 0 (0.0%) | 0 (0.0%) |
| 3 or 4 Children | 0 (0.0%) | 0 (0.0%) |
| 5 or more Children | 0 (0.0%) | 0 (0.0%) |
| Total | 0 (0.0%) | 11 (18.6%) |
Income Below Poverty Among Married-Couple vs Single-Parent Households in Monmouth Beach borough
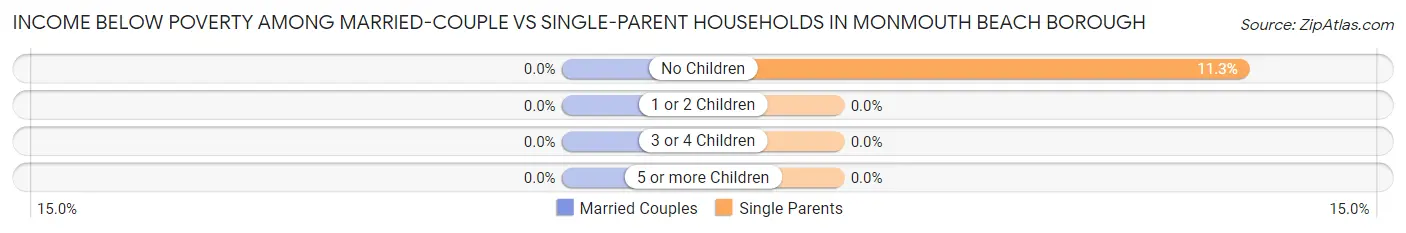
| Children | Married-Couple Families | Single-Parent Households |
| No Children | 0 (0.0%) | 11 (11.3%) |
| 1 or 2 Children | 0 (0.0%) | 0 (0.0%) |
| 3 or 4 Children | 0 (0.0%) | 0 (0.0%) |
| 5 or more Children | 0 (0.0%) | 0 (0.0%) |
| Total | 0 (0.0%) | 11 (9.8%) |
Race in Monmouth Beach borough
The most populous races in Monmouth Beach borough are White / Caucasian (2,786 | 87.1%), Hispanic or Latino (314 | 9.8%), and Some other Race (133 | 4.2%).
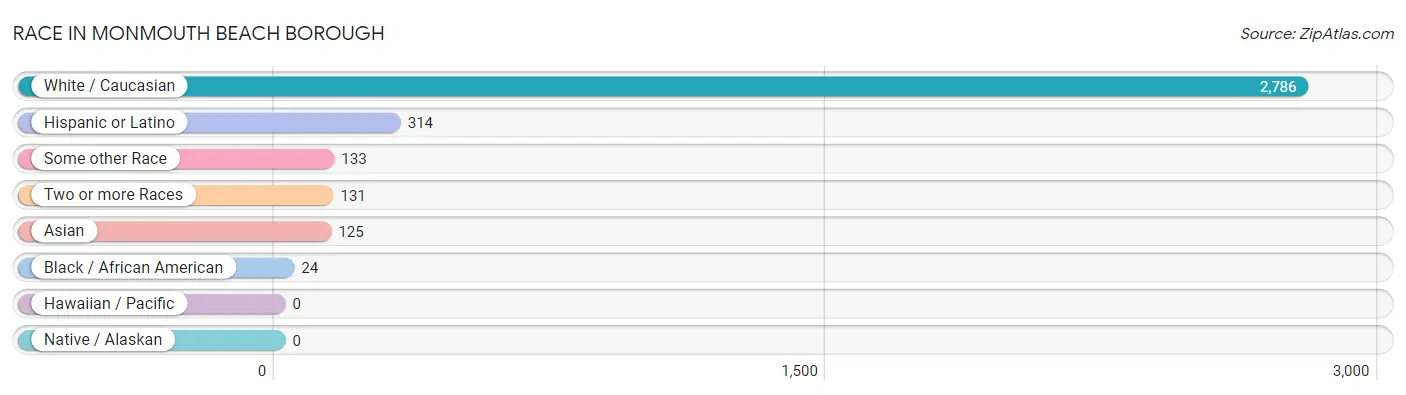
| Race | # Population | % Population |
| Asian | 125 | 3.9% |
| Black / African American | 24 | 0.7% |
| Hawaiian / Pacific | 0 | 0.0% |
| Hispanic or Latino | 314 | 9.8% |
| Native / Alaskan | 0 | 0.0% |
| White / Caucasian | 2,786 | 87.1% |
| Two or more Races | 131 | 4.1% |
| Some other Race | 133 | 4.2% |
| Total | 3,199 | 100.0% |
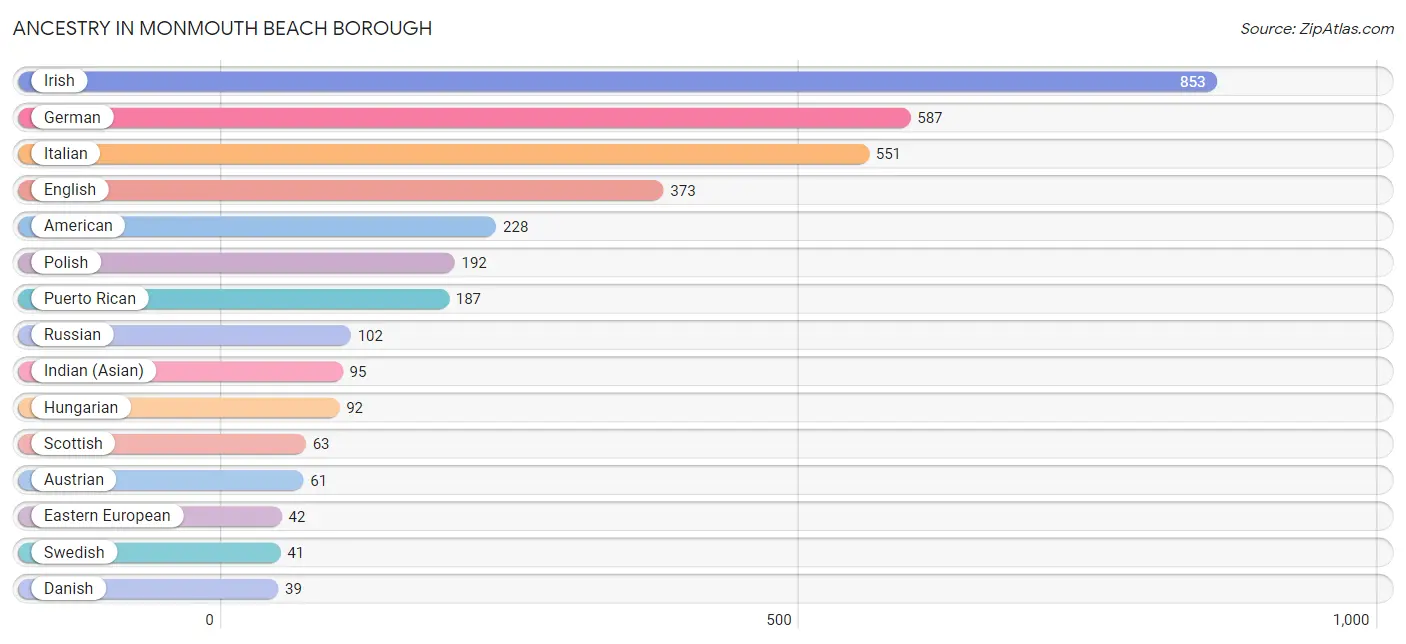
Ancestry in Monmouth Beach borough
The most populous ancestries reported in Monmouth Beach borough are Irish (853 | 26.7%), German (587 | 18.3%), Italian (551 | 17.2%), English (373 | 11.7%), and American (228 | 7.1%), together accounting for 81.0% of all Monmouth Beach borough residents.
| Ancestry | # Population | % Population |
| American | 228 | 7.1% |
| Arab | 25 | 0.8% |
| Argentinean | 8 | 0.3% |
| Armenian | 20 | 0.6% |
| Austrian | 61 | 1.9% |
| British | 9 | 0.3% |
| Burmese | 6 | 0.2% |
| Cherokee | 6 | 0.2% |
| Cuban | 30 | 0.9% |
| Czech | 12 | 0.4% |
| Czechoslovakian | 12 | 0.4% |
| Danish | 39 | 1.2% |
| Dutch | 36 | 1.1% |
| Eastern European | 42 | 1.3% |
| Egyptian | 16 | 0.5% |
| English | 373 | 11.7% |
| French | 14 | 0.4% |
| German | 587 | 18.3% |
| Greek | 10 | 0.3% |
| Hungarian | 92 | 2.9% |
| Indian (Asian) | 95 | 3.0% |
| Irish | 853 | 26.7% |
| Italian | 551 | 17.2% |
| Korean | 24 | 0.7% |
| Mexican | 36 | 1.1% |
| Moroccan | 9 | 0.3% |
| Norwegian | 10 | 0.3% |
| Polish | 192 | 6.0% |
| Puerto Rican | 187 | 5.9% |
| Russian | 102 | 3.2% |
| Scotch-Irish | 18 | 0.6% |
| Scottish | 63 | 2.0% |
| South African | 10 | 0.3% |
| South American | 8 | 0.3% |
| Spanish | 12 | 0.4% |
| Subsaharan African | 10 | 0.3% |
| Swedish | 41 | 1.3% |
| Ukrainian | 17 | 0.5% |
| Welsh | 39 | 1.2% |
| Yugoslavian | 14 | 0.4% | View All 40 Rows |
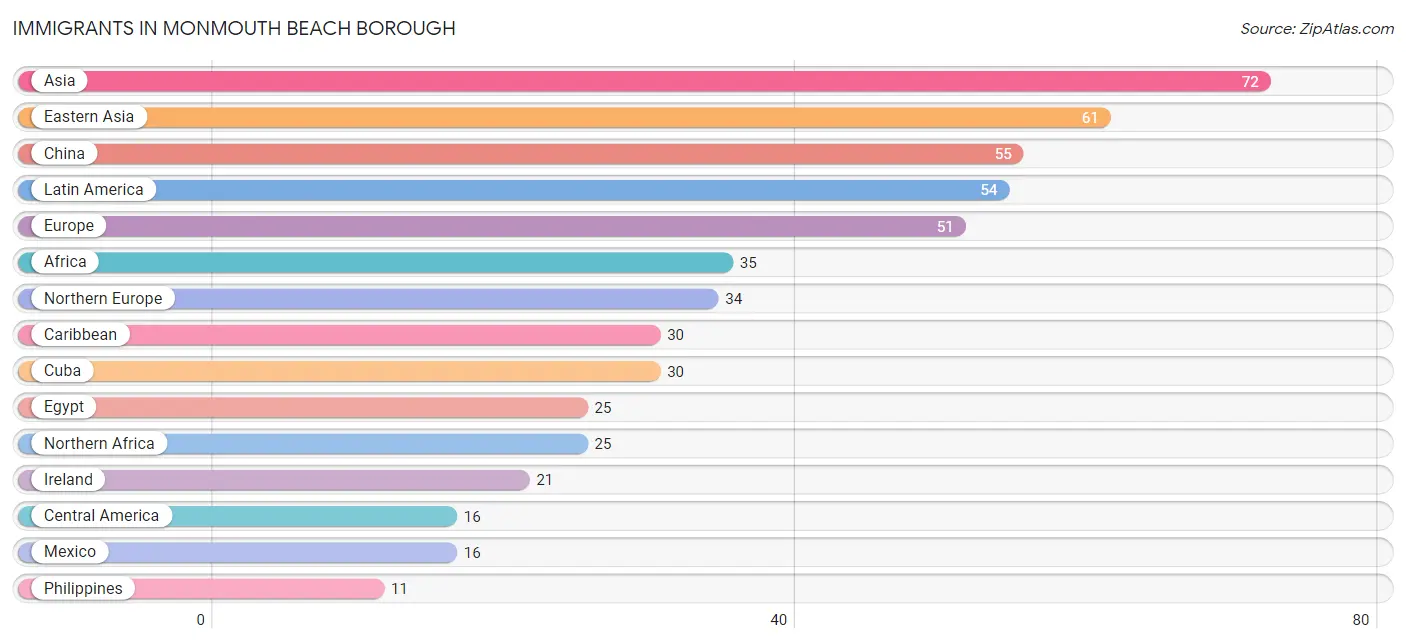
Immigrants in Monmouth Beach borough
The most numerous immigrant groups reported in Monmouth Beach borough came from Asia (72 | 2.2%), Eastern Asia (61 | 1.9%), China (55 | 1.7%), Latin America (54 | 1.7%), and Europe (51 | 1.6%), together accounting for 9.2% of all Monmouth Beach borough residents.
| Immigration Origin | # Population | % Population |
| Africa | 35 | 1.1% |
| Argentina | 8 | 0.3% |
| Asia | 72 | 2.2% |
| Caribbean | 30 | 0.9% |
| Central America | 16 | 0.5% |
| China | 55 | 1.7% |
| Cuba | 30 | 0.9% |
| Eastern Asia | 61 | 1.9% |
| Eastern Europe | 7 | 0.2% |
| Egypt | 25 | 0.8% |
| Europe | 51 | 1.6% |
| Ireland | 21 | 0.7% |
| Italy | 10 | 0.3% |
| Korea | 6 | 0.2% |
| Latin America | 54 | 1.7% |
| Mexico | 16 | 0.5% |
| Northern Africa | 25 | 0.8% |
| Northern Europe | 34 | 1.1% |
| Philippines | 11 | 0.3% |
| Poland | 7 | 0.2% |
| South Africa | 10 | 0.3% |
| South America | 8 | 0.3% |
| South Eastern Asia | 11 | 0.3% |
| Southern Europe | 10 | 0.3% | View All 24 Rows |
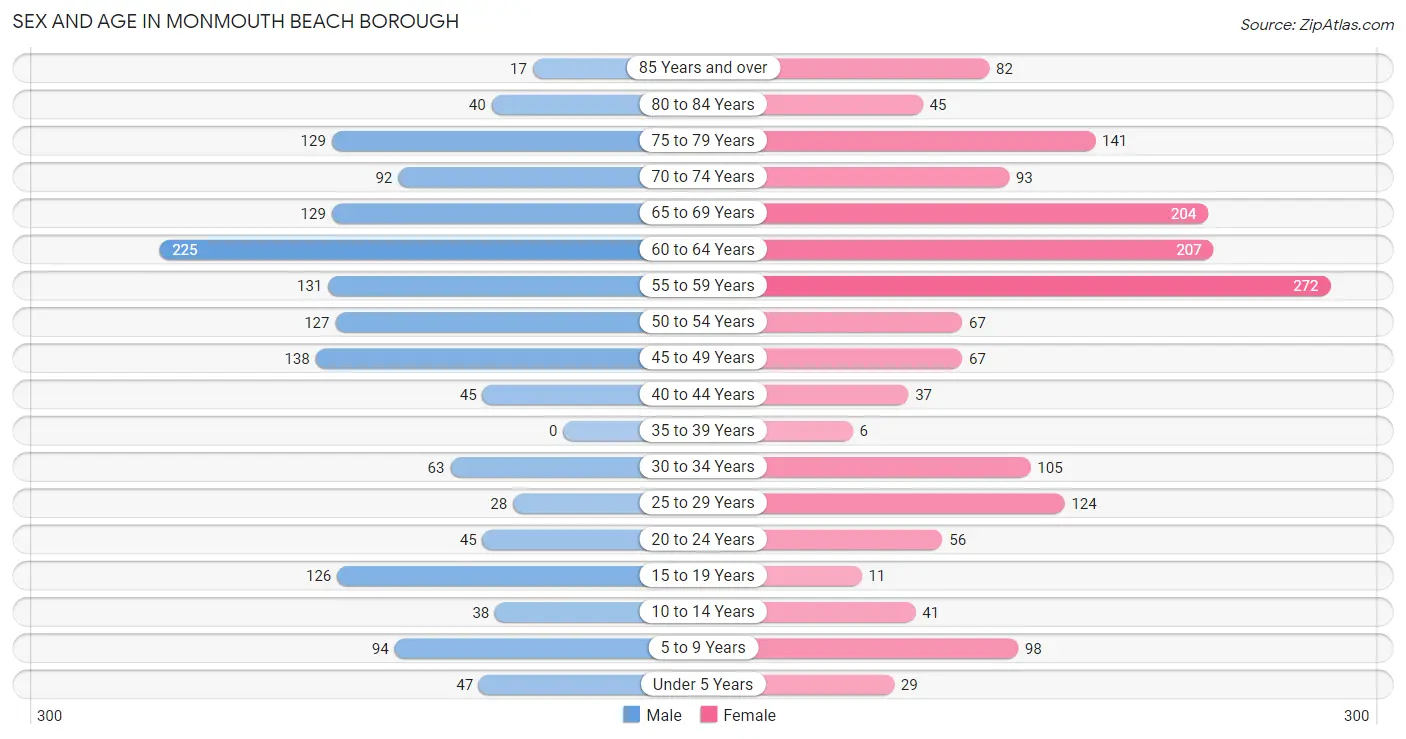
Sex and Age in Monmouth Beach borough
Sex and Age in Monmouth Beach borough
The most populous age groups in Monmouth Beach borough are 60 to 64 Years (225 | 14.9%) for men and 55 to 59 Years (272 | 16.1%) for women.
| Age Bracket | Male | Female |
| Under 5 Years | 47 (3.1%) | 29 (1.7%) |
| 5 to 9 Years | 94 (6.2%) | 98 (5.8%) |
| 10 to 14 Years | 38 (2.5%) | 41 (2.4%) |
| 15 to 19 Years | 126 (8.3%) | 11 (0.6%) |
| 20 to 24 Years | 45 (3.0%) | 56 (3.3%) |
| 25 to 29 Years | 28 (1.8%) | 124 (7.4%) |
| 30 to 34 Years | 63 (4.2%) | 105 (6.2%) |
| 35 to 39 Years | 0 (0.0%) | 6 (0.4%) |
| 40 to 44 Years | 45 (3.0%) | 37 (2.2%) |
| 45 to 49 Years | 138 (9.1%) | 67 (4.0%) |
| 50 to 54 Years | 127 (8.4%) | 67 (4.0%) |
| 55 to 59 Years | 131 (8.6%) | 272 (16.1%) |
| 60 to 64 Years | 225 (14.9%) | 207 (12.3%) |
| 65 to 69 Years | 129 (8.5%) | 204 (12.1%) |
| 70 to 74 Years | 92 (6.1%) | 93 (5.5%) |
| 75 to 79 Years | 129 (8.5%) | 141 (8.4%) |
| 80 to 84 Years | 40 (2.6%) | 45 (2.7%) |
| 85 Years and over | 17 (1.1%) | 82 (4.9%) |
| Total | 1,514 (100.0%) | 1,685 (100.0%) |
Families and Households in Monmouth Beach borough
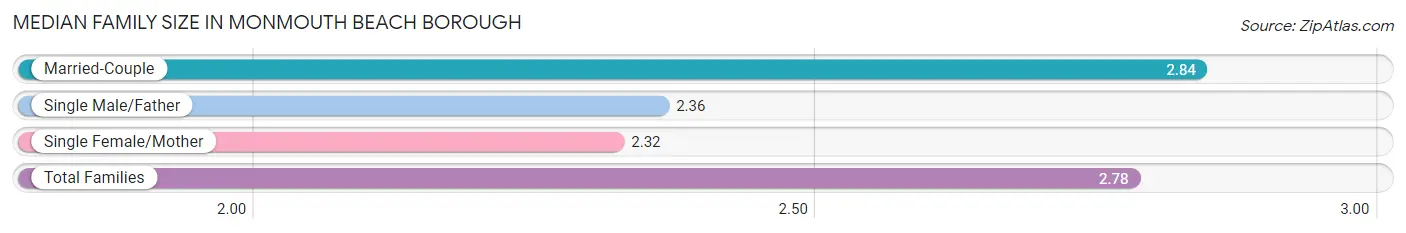
Median Family Size in Monmouth Beach borough
The median family size in Monmouth Beach borough is 2.78 persons per family, with married-couple families (802 | 87.7%) accounting for the largest median family size of 2.84 persons per family. On the other hand, single female/mother families (59 | 6.5%) represent the smallest median family size with 2.32 persons per family.
| Family Type | # Families | Family Size |
| Married-Couple | 802 (87.7%) | 2.84 |
| Single Male/Father | 53 (5.8%) | 2.36 |
| Single Female/Mother | 59 (6.5%) | 2.32 |
| Total Families | 914 (100.0%) | 2.78 |
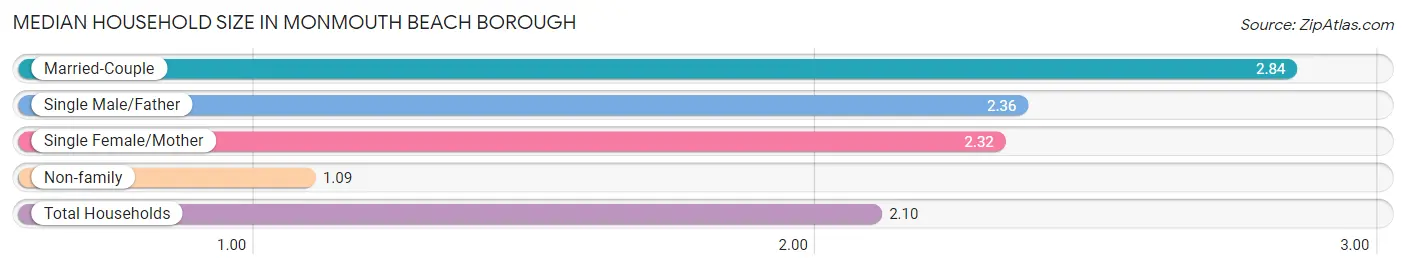
Median Household Size in Monmouth Beach borough
The median household size in Monmouth Beach borough is 2.10 persons per household, with married-couple households (802 | 52.8%) accounting for the largest median household size of 2.84 persons per household. non-family households (606 | 39.9%) represent the smallest median household size with 1.09 persons per household.
| Household Type | # Households | Household Size |
| Married-Couple | 802 (52.8%) | 2.84 |
| Single Male/Father | 53 (3.5%) | 2.36 |
| Single Female/Mother | 59 (3.9%) | 2.32 |
| Non-family | 606 (39.9%) | 1.09 |
| Total Households | 1,520 (100.0%) | 2.10 |
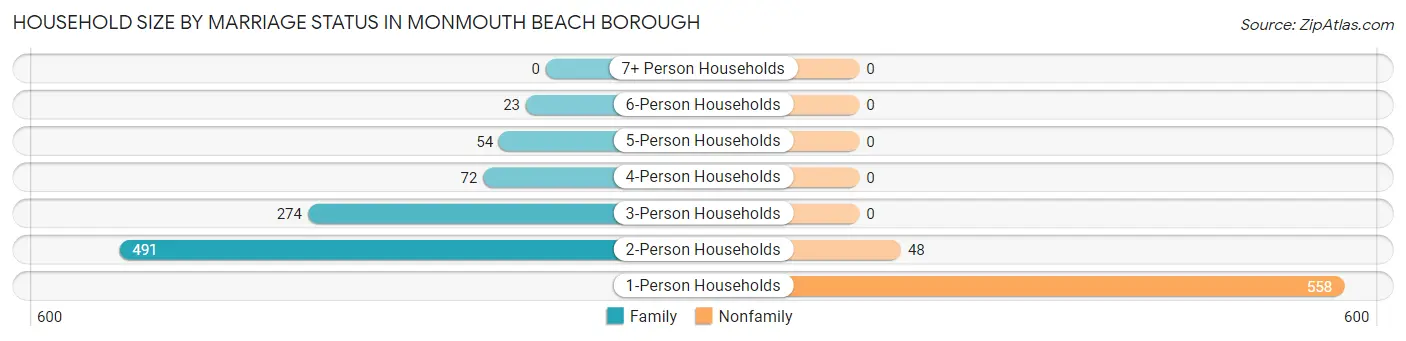
Household Size by Marriage Status in Monmouth Beach borough
Out of a total of 1,520 households in Monmouth Beach borough, 914 (60.1%) are family households, while 606 (39.9%) are nonfamily households. The most numerous type of family households are 2-person households, comprising 491, and the most common type of nonfamily households are 1-person households, comprising 558.
| Household Size | Family Households | Nonfamily Households |
| 1-Person Households | - | 558 (36.7%) |
| 2-Person Households | 491 (32.3%) | 48 (3.2%) |
| 3-Person Households | 274 (18.0%) | 0 (0.0%) |
| 4-Person Households | 72 (4.7%) | 0 (0.0%) |
| 5-Person Households | 54 (3.5%) | 0 (0.0%) |
| 6-Person Households | 23 (1.5%) | 0 (0.0%) |
| 7+ Person Households | 0 (0.0%) | 0 (0.0%) |
| Total | 914 (60.1%) | 606 (39.9%) |
Female Fertility in Monmouth Beach borough
Fertility by Age in Monmouth Beach borough
Average fertility rate in Monmouth Beach borough is 14.0 births per 1,000 women. Women in the age bracket of 20 to 34 years have the highest fertility rate with 21.0 births per 1,000 women. Women in the age bracket of 20 to 34 years acount for 100.0% of all women with births.
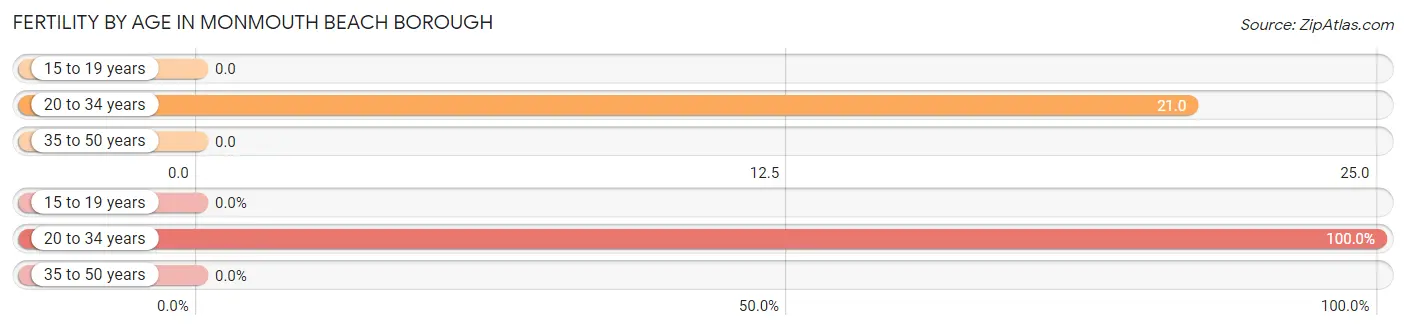
| Age Bracket | Women with Births | Births / 1,000 Women |
| 15 to 19 years | 0 (0.0%) | 0.0 |
| 20 to 34 years | 6 (100.0%) | 21.0 |
| 35 to 50 years | 0 (0.0%) | 0.0 |
| Total | 6 (100.0%) | 14.0 |
Fertility by Age by Marriage Status in Monmouth Beach borough
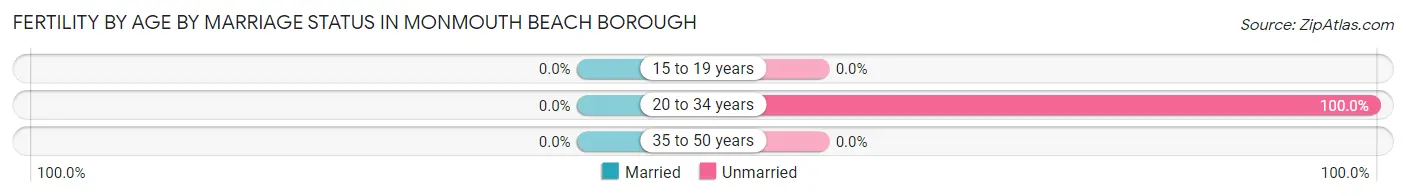
| Age Bracket | Married | Unmarried |
| 15 to 19 years | 0 (0.0%) | 0 (0.0%) |
| 20 to 34 years | 0 (0.0%) | 6 (100.0%) |
| 35 to 50 years | 0 (0.0%) | 0 (0.0%) |
| Total | 0 (0.0%) | 6 (100.0%) |
Fertility by Education in Monmouth Beach borough
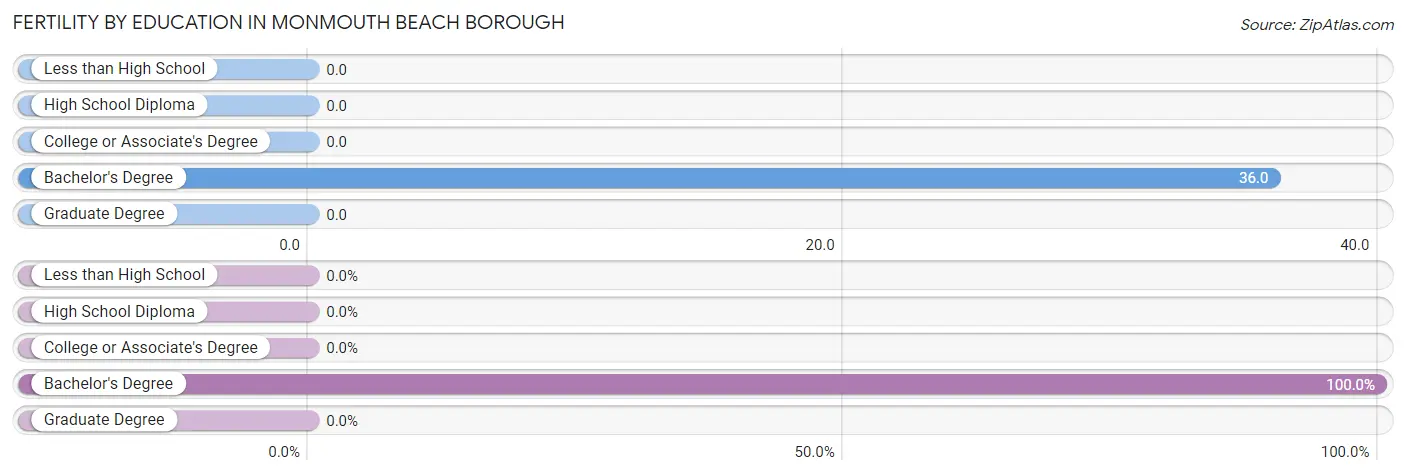
| Educational Attainment | Women with Births | Births / 1,000 Women |
| Less than High School | 0 (0.0%) | 0.0 |
| High School Diploma | 0 (0.0%) | 0.0 |
| College or Associate's Degree | 0 (0.0%) | 0.0 |
| Bachelor's Degree | 6 (100.0%) | 36.0 |
| Graduate Degree | 0 (0.0%) | 0.0 |
| Total | 6 (100.0%) | 14.0 |
Fertility by Education by Marriage Status in Monmouth Beach borough
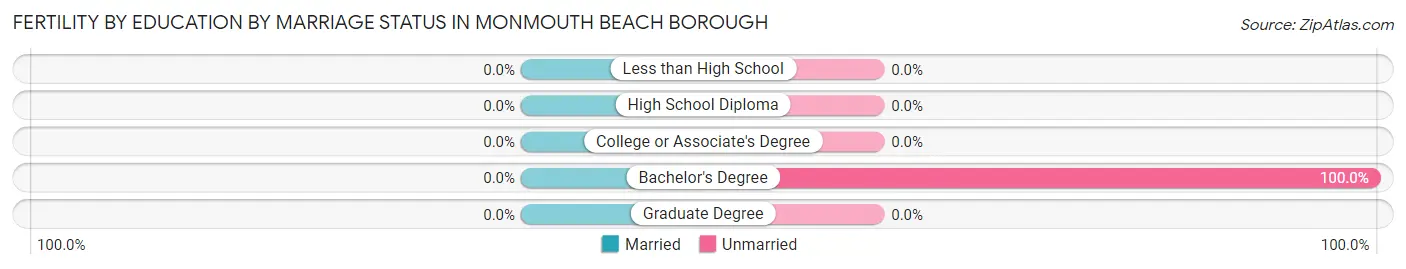
| Educational Attainment | Married | Unmarried |
| Less than High School | 0 (0.0%) | 0 (0.0%) |
| High School Diploma | 0 (0.0%) | 0 (0.0%) |
| College or Associate's Degree | 0 (0.0%) | 0 (0.0%) |
| Bachelor's Degree | 0 (0.0%) | 6 (100.0%) |
| Graduate Degree | 0 (0.0%) | 0 (0.0%) |
| Total | 0 (0.0%) | 6 (100.0%) |
Employment Characteristics in Monmouth Beach borough
Employment by Class of Employer in Monmouth Beach borough
Among the 1,545 employed individuals in Monmouth Beach borough, private company employees (997 | 64.5%), self-employed (not incorporated) (194 | 12.6%), and self-employed (incorporated) (102 | 6.6%) make up the most common classes of employment.
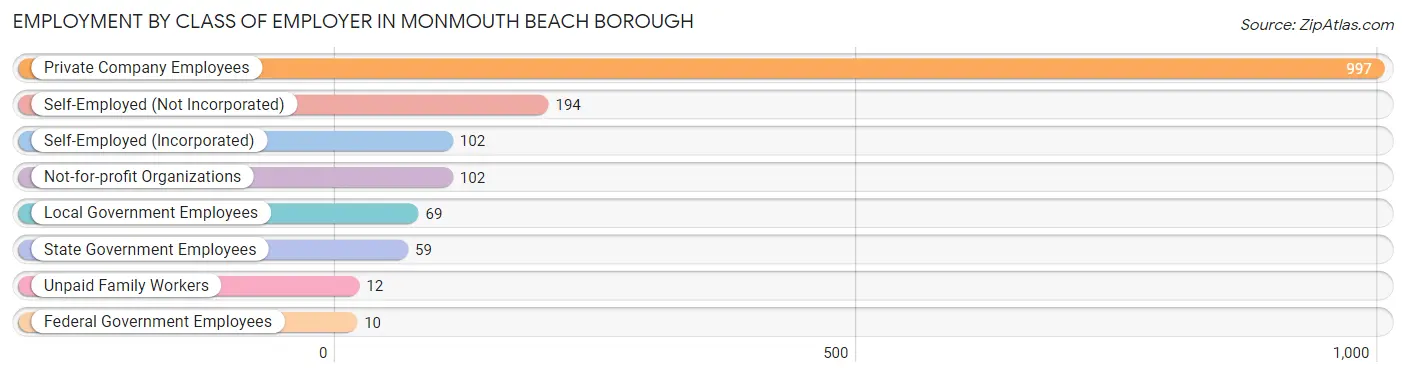
| Employer Class | # Employees | % Employees |
| Private Company Employees | 997 | 64.5% |
| Self-Employed (Incorporated) | 102 | 6.6% |
| Self-Employed (Not Incorporated) | 194 | 12.6% |
| Not-for-profit Organizations | 102 | 6.6% |
| Local Government Employees | 69 | 4.5% |
| State Government Employees | 59 | 3.8% |
| Federal Government Employees | 10 | 0.6% |
| Unpaid Family Workers | 12 | 0.8% |
| Total | 1,545 | 100.0% |
Employment Status by Age in Monmouth Beach borough
According to the labor force statistics for Monmouth Beach borough, out of the total population over 16 years of age (2,852), 59.8% or 1,705 individuals are in the labor force, with 4.2% or 72 of them unemployed. The age group with the highest labor force participation rate is 25 to 29 years, with 100.0% or 152 individuals in the labor force. Within the labor force, the 20 to 24 years age range has the highest percentage of unemployed individuals, with 73.7% or 42 of them being unemployed.
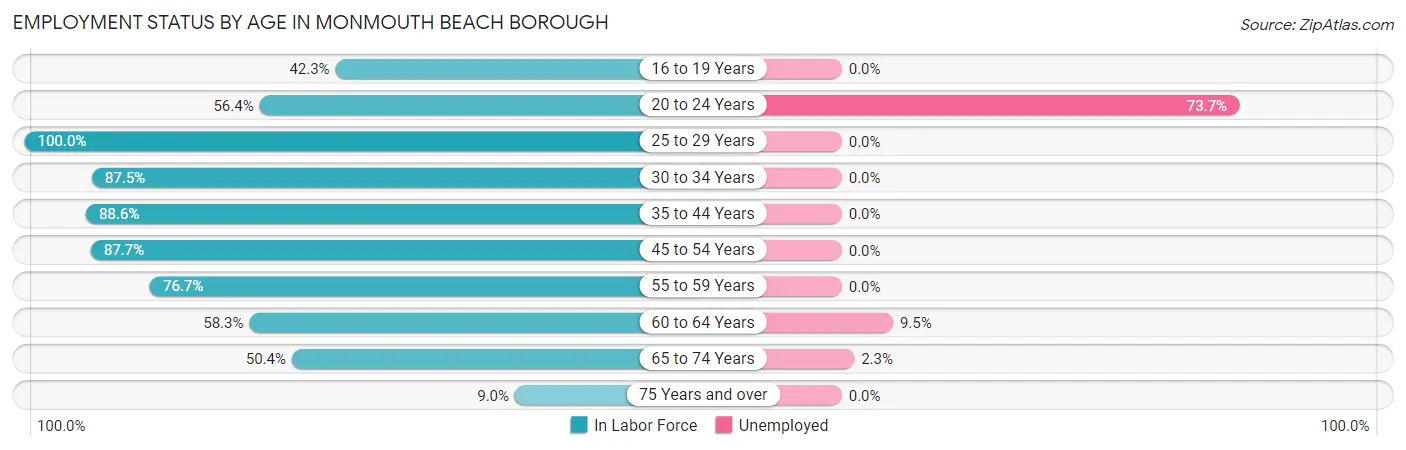
| Age Bracket | In Labor Force | Unemployed |
| 16 to 19 Years | 58 (42.3%) | 0 (0.0%) |
| 20 to 24 Years | 57 (56.4%) | 42 (73.7%) |
| 25 to 29 Years | 152 (100.0%) | 0 (0.0%) |
| 30 to 34 Years | 147 (87.5%) | 0 (0.0%) |
| 35 to 44 Years | 78 (88.6%) | 0 (0.0%) |
| 45 to 54 Years | 350 (87.7%) | 0 (0.0%) |
| 55 to 59 Years | 309 (76.7%) | 0 (0.0%) |
| 60 to 64 Years | 252 (58.3%) | 24 (9.5%) |
| 65 to 74 Years | 261 (50.4%) | 6 (2.3%) |
| 75 Years and over | 41 (9.0%) | 0 (0.0%) |
| Total | 1,705 (59.8%) | 72 (4.2%) |
Employment Status by Educational Attainment in Monmouth Beach borough
According to labor force statistics for Monmouth Beach borough, 78.4% of individuals (1,287) out of the total population between 25 and 64 years of age (1,642) are in the labor force, with 1.9% or 24 of them being unemployed. The group with the highest labor force participation rate are those with the educational attainment of bachelor's degree or higher, with 80.5% or 984 individuals in the labor force. Within the labor force, individuals with college / associate degree education have the highest percentage of unemployment, with 6.2% or 13 of them being unemployed.
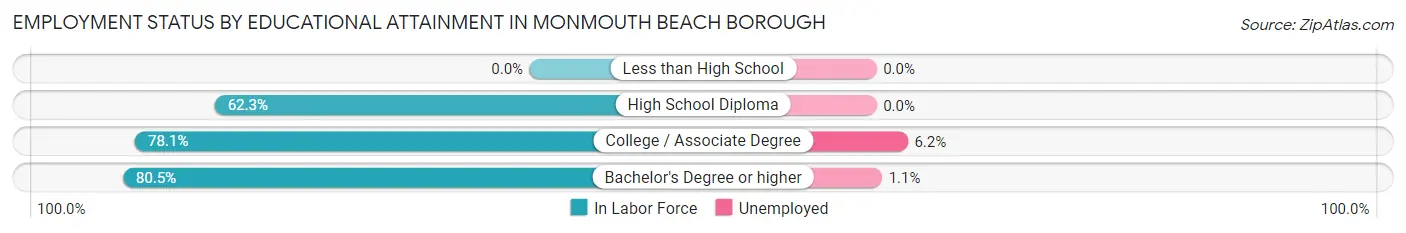
| Educational Attainment | In Labor Force | Unemployed |
| Less than High School | 0 (0.0%) | 0 (0.0%) |
| High School Diploma | 94 (62.3%) | 0 (0.0%) |
| College / Associate Degree | 210 (78.1%) | 17 (6.2%) |
| Bachelor's Degree or higher | 984 (80.5%) | 13 (1.1%) |
| Total | 1,287 (78.4%) | 31 (1.9%) |
Employment Occupations by Sex in Monmouth Beach borough
Management, Business, Science and Arts Occupations
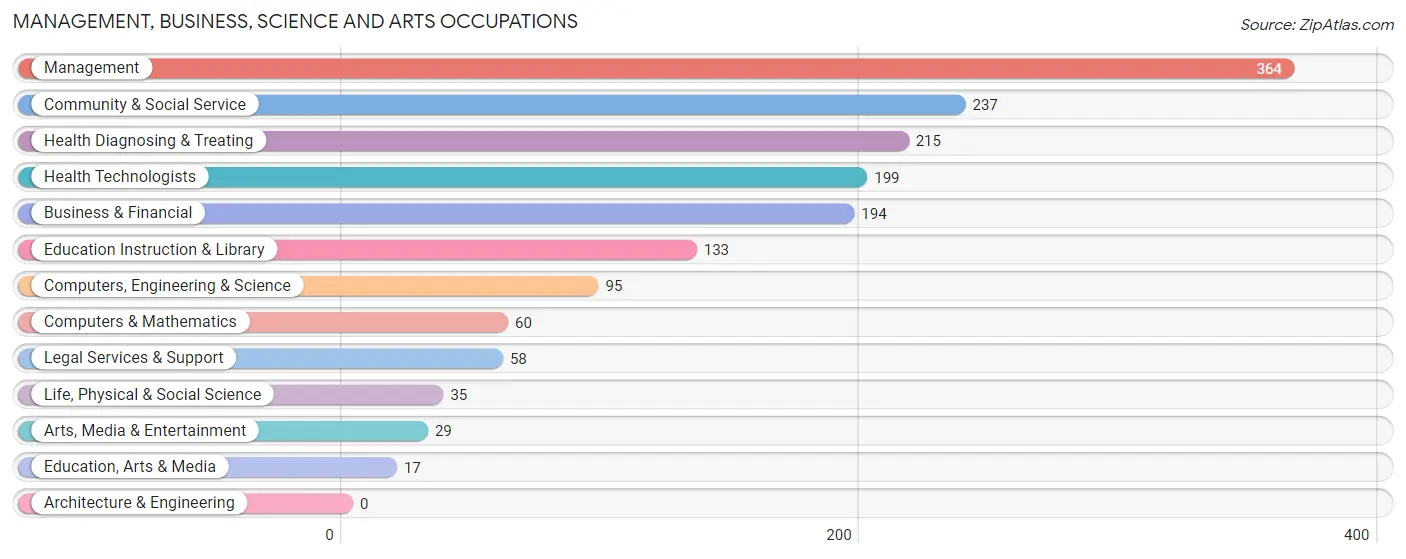
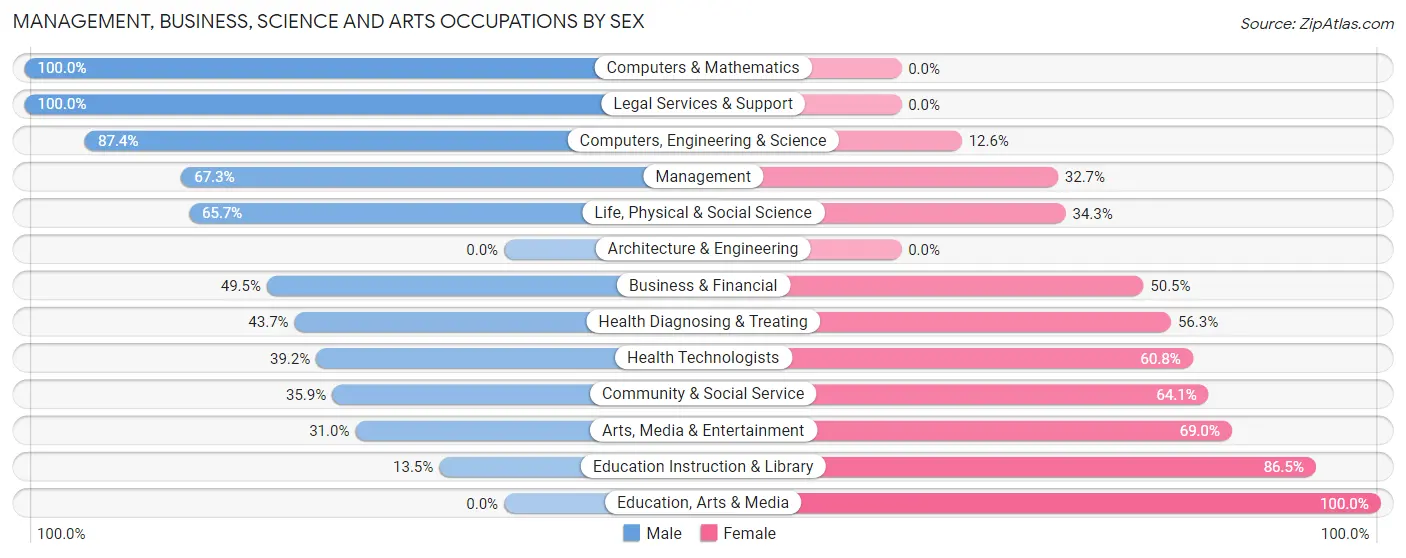
The most common Management, Business, Science and Arts occupations in Monmouth Beach borough are Management (364 | 22.3%), Community & Social Service (237 | 14.5%), Health Diagnosing & Treating (215 | 13.2%), Health Technologists (199 | 12.2%), and Business & Financial (194 | 11.9%).
Management, Business, Science and Arts Occupations by Sex
Within the Management, Business, Science and Arts occupations in Monmouth Beach borough, the most male-oriented occupations are Computers & Mathematics (100.0%), Legal Services & Support (100.0%), and Computers, Engineering & Science (87.4%), while the most female-oriented occupations are Education, Arts & Media (100.0%), Education Instruction & Library (86.5%), and Arts, Media & Entertainment (69.0%).
| Occupation | Male | Female |
| Management | 245 (67.3%) | 119 (32.7%) |
| Business & Financial | 96 (49.5%) | 98 (50.5%) |
| Computers, Engineering & Science | 83 (87.4%) | 12 (12.6%) |
| Computers & Mathematics | 60 (100.0%) | 0 (0.0%) |
| Architecture & Engineering | 0 (0.0%) | 0 (0.0%) |
| Life, Physical & Social Science | 23 (65.7%) | 12 (34.3%) |
| Community & Social Service | 85 (35.9%) | 152 (64.1%) |
| Education, Arts & Media | 0 (0.0%) | 17 (100.0%) |
| Legal Services & Support | 58 (100.0%) | 0 (0.0%) |
| Education Instruction & Library | 18 (13.5%) | 115 (86.5%) |
| Arts, Media & Entertainment | 9 (31.0%) | 20 (69.0%) |
| Health Diagnosing & Treating | 94 (43.7%) | 121 (56.3%) |
| Health Technologists | 78 (39.2%) | 121 (60.8%) |
| Total (Category) | 603 (54.6%) | 502 (45.4%) |
| Total (Overall) | 812 (49.7%) | 821 (50.3%) |
Services Occupations
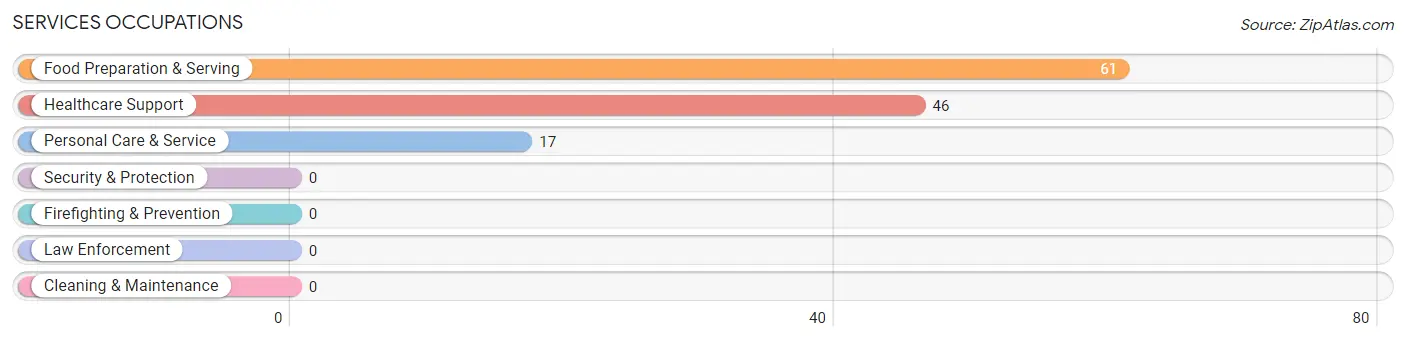
The most common Services occupations in Monmouth Beach borough are Food Preparation & Serving (61 | 3.7%), Healthcare Support (46 | 2.8%), and Personal Care & Service (17 | 1.0%).
Services Occupations by Sex
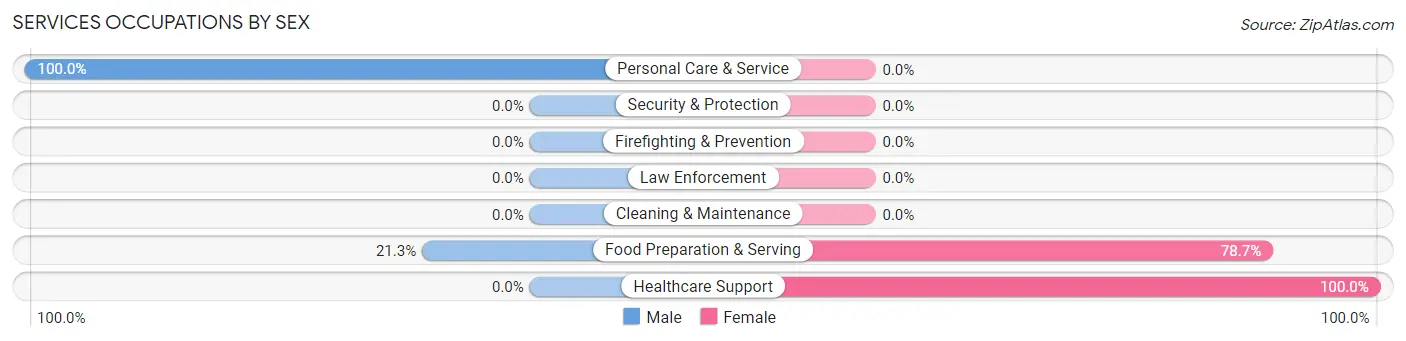
Within the Services occupations in Monmouth Beach borough, the most male-oriented occupations are Personal Care & Service (100.0%), and Food Preparation & Serving (21.3%), while the most female-oriented occupations are Healthcare Support (100.0%), and Food Preparation & Serving (78.7%).
| Occupation | Male | Female |
| Healthcare Support | 0 (0.0%) | 46 (100.0%) |
| Security & Protection | 0 (0.0%) | 0 (0.0%) |
| Firefighting & Prevention | 0 (0.0%) | 0 (0.0%) |
| Law Enforcement | 0 (0.0%) | 0 (0.0%) |
| Food Preparation & Serving | 13 (21.3%) | 48 (78.7%) |
| Cleaning & Maintenance | 0 (0.0%) | 0 (0.0%) |
| Personal Care & Service | 17 (100.0%) | 0 (0.0%) |
| Total (Category) | 30 (24.2%) | 94 (75.8%) |
| Total (Overall) | 812 (49.7%) | 821 (50.3%) |
Sales and Office Occupations
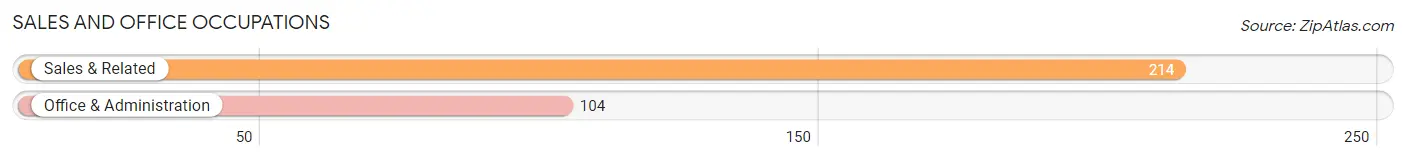
The most common Sales and Office occupations in Monmouth Beach borough are Sales & Related (214 | 13.1%), and Office & Administration (104 | 6.4%).
Sales and Office Occupations by Sex
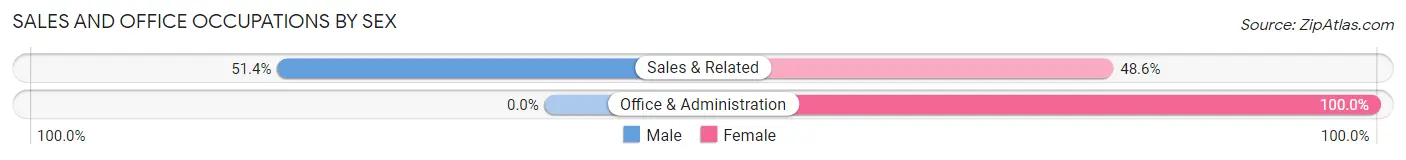
| Occupation | Male | Female |
| Sales & Related | 110 (51.4%) | 104 (48.6%) |
| Office & Administration | 0 (0.0%) | 104 (100.0%) |
| Total (Category) | 110 (34.6%) | 208 (65.4%) |
| Total (Overall) | 812 (49.7%) | 821 (50.3%) |
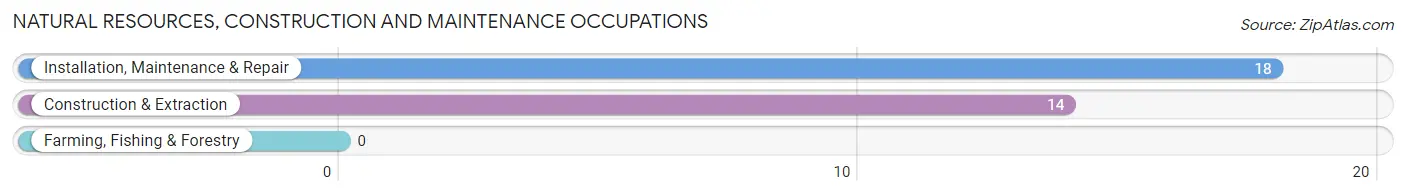
Natural Resources, Construction and Maintenance Occupations
The most common Natural Resources, Construction and Maintenance occupations in Monmouth Beach borough are Installation, Maintenance & Repair (18 | 1.1%), and Construction & Extraction (14 | 0.9%).
Natural Resources, Construction and Maintenance Occupations by Sex
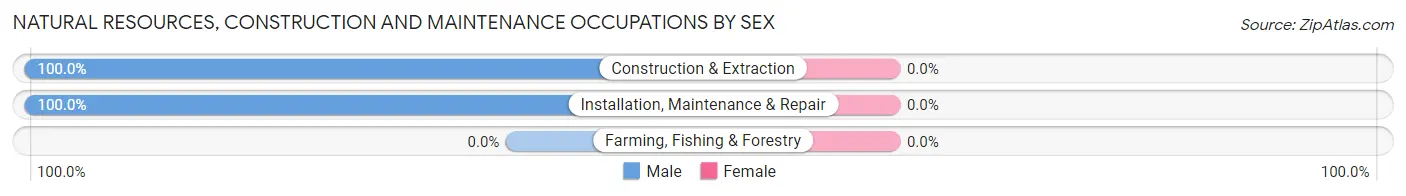
| Occupation | Male | Female |
| Farming, Fishing & Forestry | 0 (0.0%) | 0 (0.0%) |
| Construction & Extraction | 14 (100.0%) | 0 (0.0%) |
| Installation, Maintenance & Repair | 18 (100.0%) | 0 (0.0%) |
| Total (Category) | 32 (100.0%) | 0 (0.0%) |
| Total (Overall) | 812 (49.7%) | 821 (50.3%) |
Production, Transportation and Moving Occupations
The most common Production, Transportation and Moving occupations in Monmouth Beach borough are Transportation (20 | 1.2%), Production (17 | 1.0%), and Material Moving (17 | 1.0%).
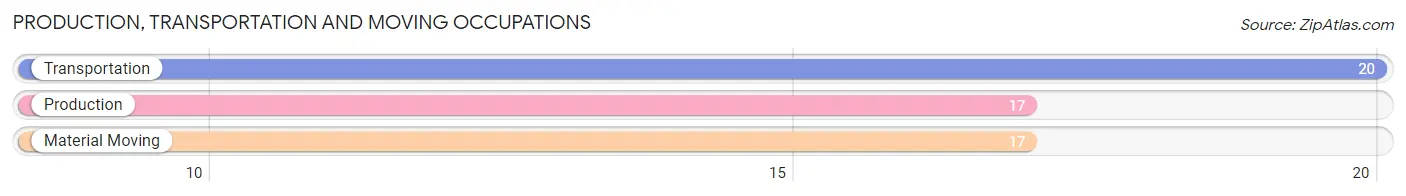
Production, Transportation and Moving Occupations by Sex
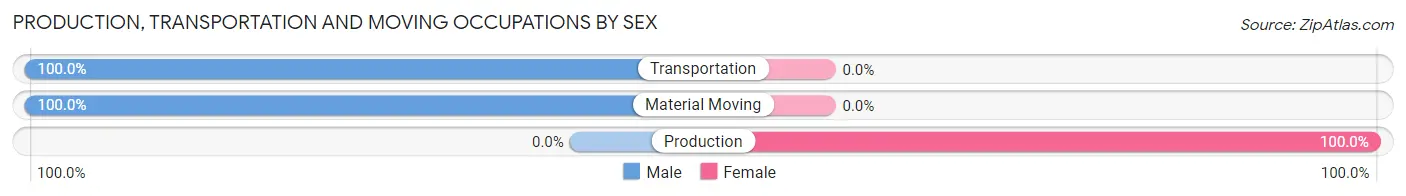
| Occupation | Male | Female |
| Production | 0 (0.0%) | 17 (100.0%) |
| Transportation | 20 (100.0%) | 0 (0.0%) |
| Material Moving | 17 (100.0%) | 0 (0.0%) |
| Total (Category) | 37 (68.5%) | 17 (31.5%) |
| Total (Overall) | 812 (49.7%) | 821 (50.3%) |
Employment Industries by Sex in Monmouth Beach borough
Employment Industries in Monmouth Beach borough
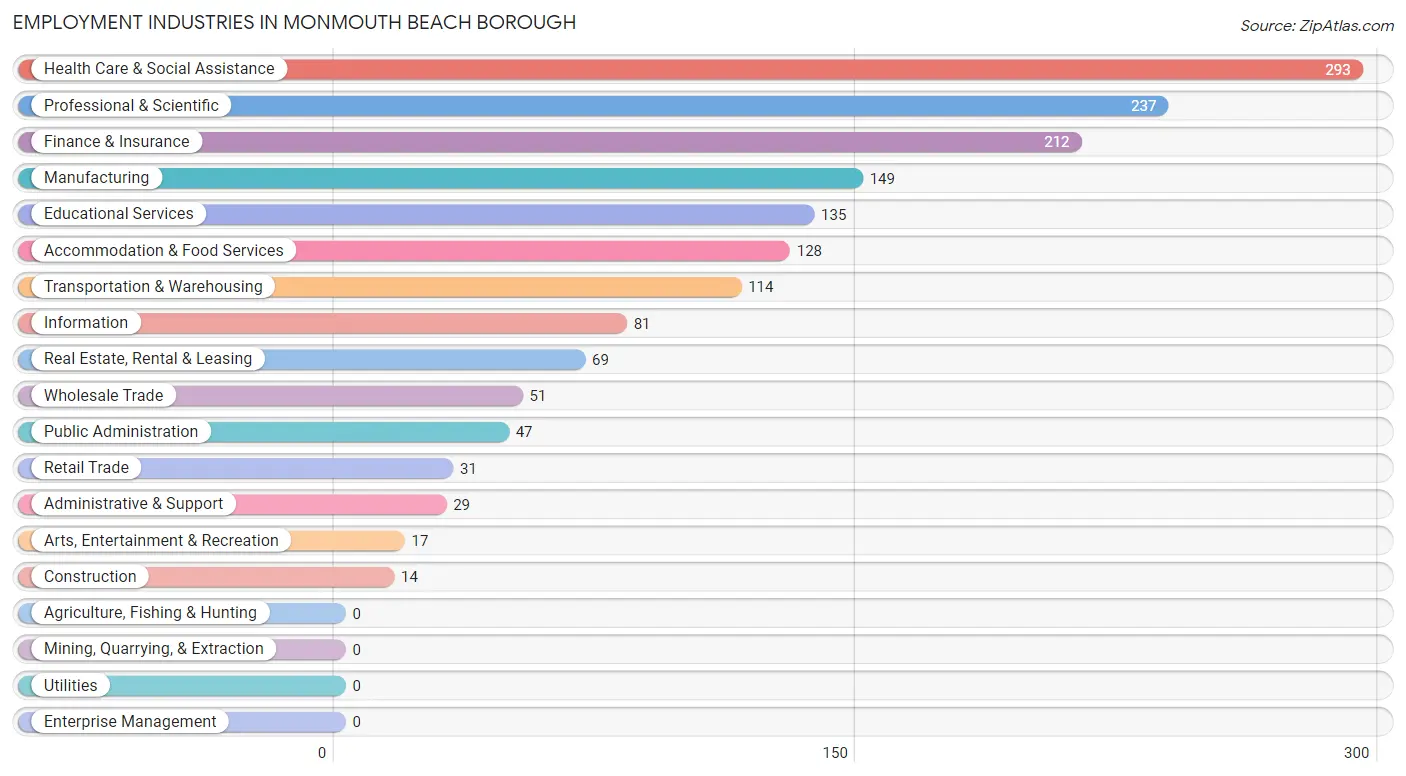
The major employment industries in Monmouth Beach borough include Health Care & Social Assistance (293 | 17.9%), Professional & Scientific (237 | 14.5%), Finance & Insurance (212 | 13.0%), Manufacturing (149 | 9.1%), and Educational Services (135 | 8.3%).
Employment Industries by Sex in Monmouth Beach borough
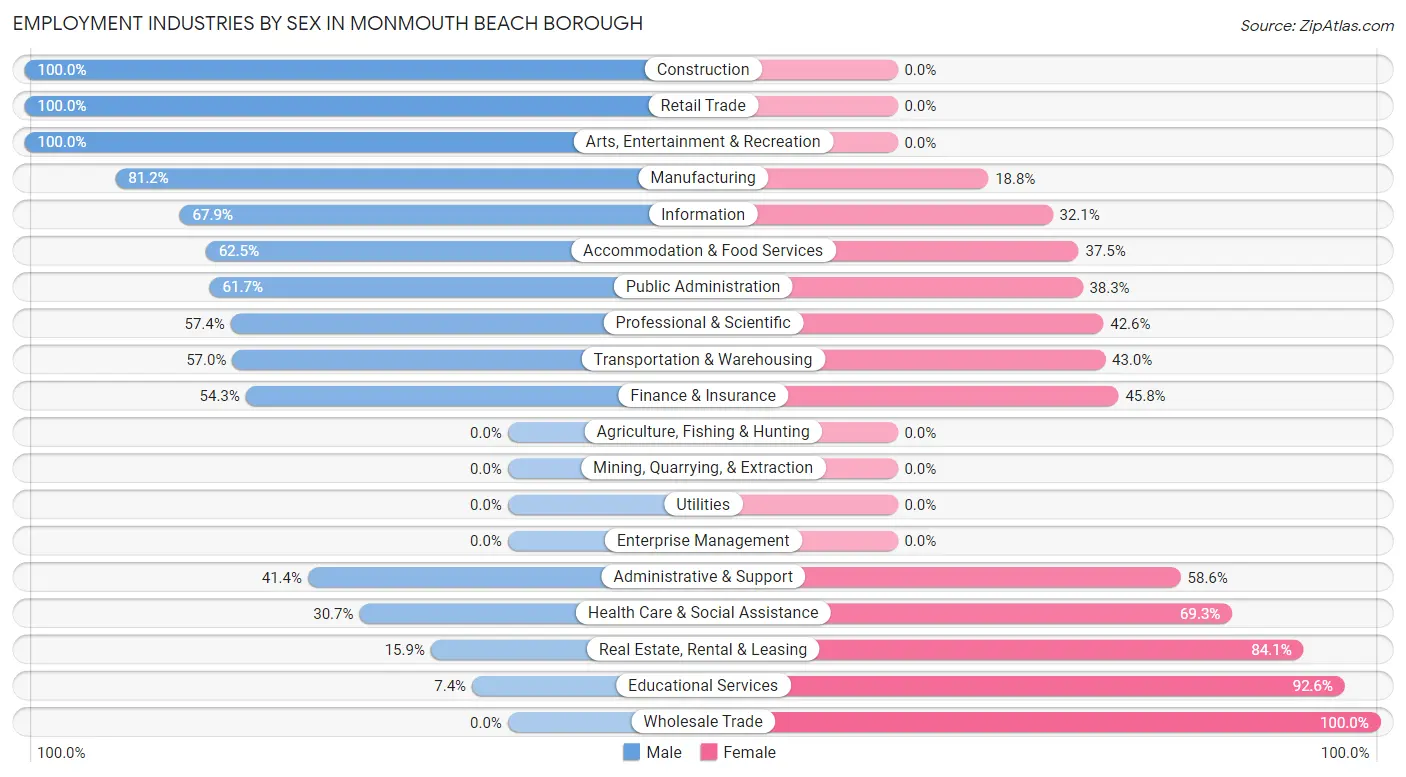
The Monmouth Beach borough industries that see more men than women are Construction (100.0%), Retail Trade (100.0%), and Arts, Entertainment & Recreation (100.0%), whereas the industries that tend to have a higher number of women are Wholesale Trade (100.0%), Educational Services (92.6%), and Real Estate, Rental & Leasing (84.1%).
| Industry | Male | Female |
| Agriculture, Fishing & Hunting | 0 (0.0%) | 0 (0.0%) |
| Mining, Quarrying, & Extraction | 0 (0.0%) | 0 (0.0%) |
| Construction | 14 (100.0%) | 0 (0.0%) |
| Manufacturing | 121 (81.2%) | 28 (18.8%) |
| Wholesale Trade | 0 (0.0%) | 51 (100.0%) |
| Retail Trade | 31 (100.0%) | 0 (0.0%) |
| Transportation & Warehousing | 65 (57.0%) | 49 (43.0%) |
| Utilities | 0 (0.0%) | 0 (0.0%) |
| Information | 55 (67.9%) | 26 (32.1%) |
| Finance & Insurance | 115 (54.2%) | 97 (45.8%) |
| Real Estate, Rental & Leasing | 11 (15.9%) | 58 (84.1%) |
| Professional & Scientific | 136 (57.4%) | 101 (42.6%) |
| Enterprise Management | 0 (0.0%) | 0 (0.0%) |
| Administrative & Support | 12 (41.4%) | 17 (58.6%) |
| Educational Services | 10 (7.4%) | 125 (92.6%) |
| Health Care & Social Assistance | 90 (30.7%) | 203 (69.3%) |
| Arts, Entertainment & Recreation | 17 (100.0%) | 0 (0.0%) |
| Accommodation & Food Services | 80 (62.5%) | 48 (37.5%) |
| Public Administration | 29 (61.7%) | 18 (38.3%) |
| Total | 812 (49.7%) | 821 (50.3%) |
Education in Monmouth Beach borough
School Enrollment in Monmouth Beach borough
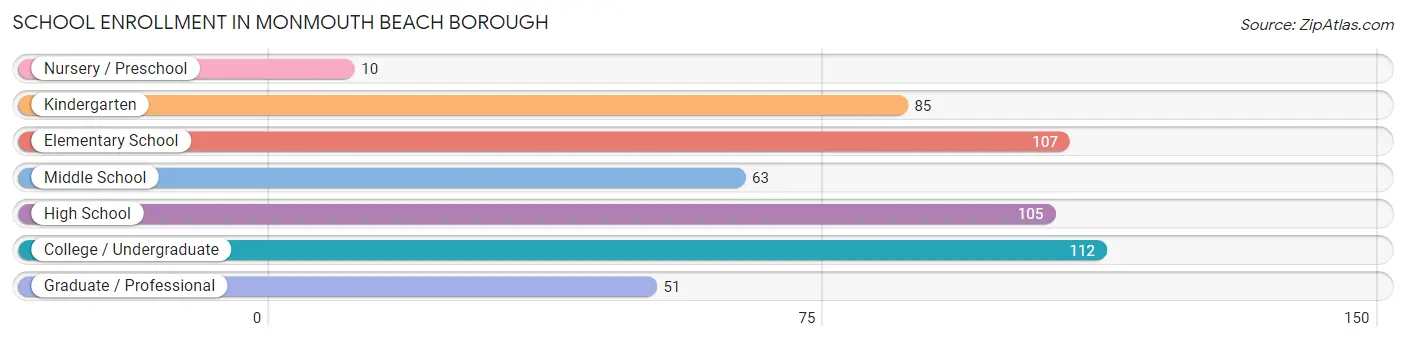
The most common levels of schooling among the 533 students in Monmouth Beach borough are college / undergraduate (112 | 21.0%), elementary school (107 | 20.1%), and high school (105 | 19.7%).
| School Level | # Students | % Students |
| Nursery / Preschool | 10 | 1.9% |
| Kindergarten | 85 | 16.0% |
| Elementary School | 107 | 20.1% |
| Middle School | 63 | 11.8% |
| High School | 105 | 19.7% |
| College / Undergraduate | 112 | 21.0% |
| Graduate / Professional | 51 | 9.6% |
| Total | 533 | 100.0% |
School Enrollment by Age by Funding Source in Monmouth Beach borough
Out of a total of 533 students who are enrolled in schools in Monmouth Beach borough, 162 (30.4%) attend a private institution, while the remaining 371 (69.6%) are enrolled in public schools. The age group of 3 to 4 year olds has the highest likelihood of being enrolled in private schools, with 10 (100.0% in the age bracket) enrolled. Conversely, the age group of 15 to 17 year olds has the lowest likelihood of being enrolled in a private school, with 24 (100.0% in the age bracket) attending a public institution.
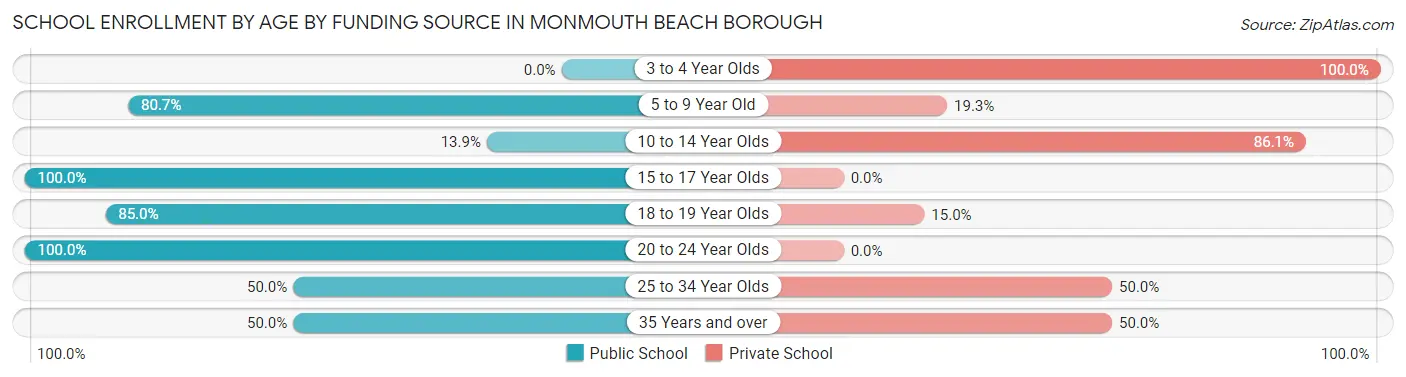
| Age Bracket | Public School | Private School |
| 3 to 4 Year Olds | 0 (0.0%) | 10 (100.0%) |
| 5 to 9 Year Old | 155 (80.7%) | 37 (19.3%) |
| 10 to 14 Year Olds | 11 (13.9%) | 68 (86.1%) |
| 15 to 17 Year Olds | 24 (100.0%) | 0 (0.0%) |
| 18 to 19 Year Olds | 96 (85.0%) | 17 (15.0%) |
| 20 to 24 Year Olds | 55 (100.0%) | 0 (0.0%) |
| 25 to 34 Year Olds | 20 (50.0%) | 20 (50.0%) |
| 35 Years and over | 10 (50.0%) | 10 (50.0%) |
| Total | 371 (69.6%) | 162 (30.4%) |
Educational Attainment by Field of Study in Monmouth Beach borough
Business (419 | 21.5%), social sciences (275 | 14.1%), science & technology (194 | 10.0%), bio, nature & agricultural (161 | 8.3%), and education (141 | 7.2%) are the most common fields of study among 1,949 individuals in Monmouth Beach borough who have obtained a bachelor's degree or higher.
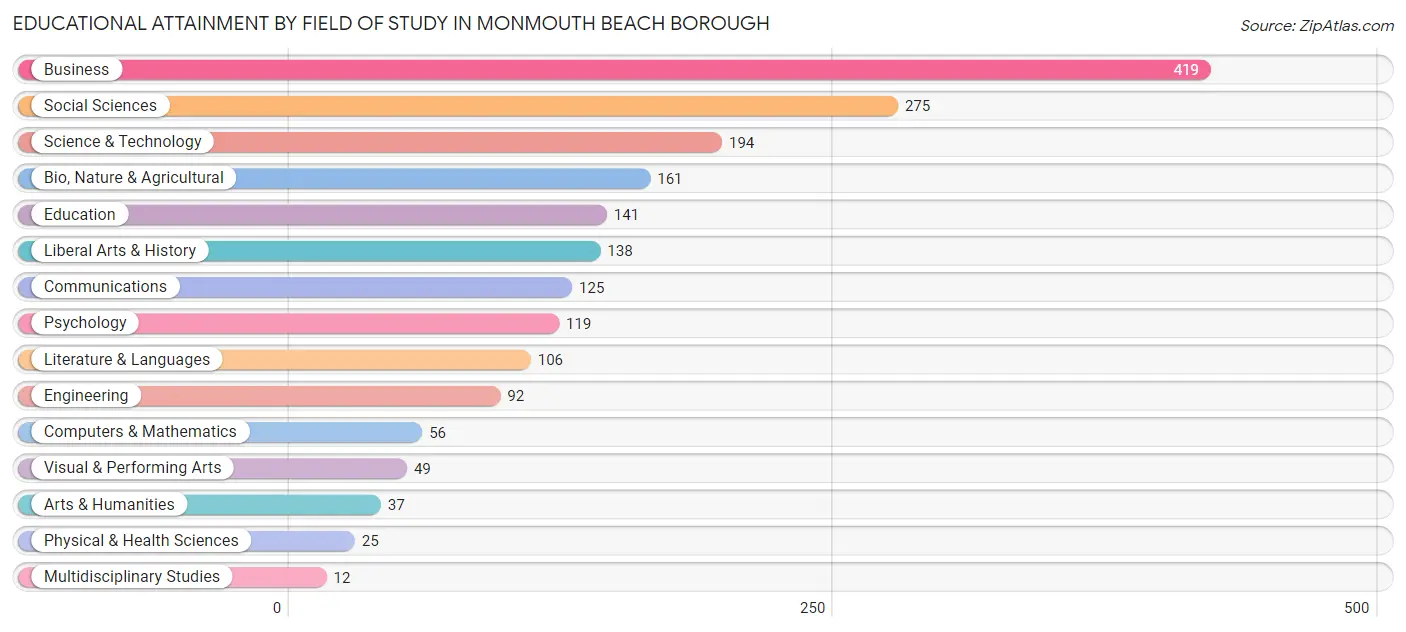
| Field of Study | # Graduates | % Graduates |
| Computers & Mathematics | 56 | 2.9% |
| Bio, Nature & Agricultural | 161 | 8.3% |
| Physical & Health Sciences | 25 | 1.3% |
| Psychology | 119 | 6.1% |
| Social Sciences | 275 | 14.1% |
| Engineering | 92 | 4.7% |
| Multidisciplinary Studies | 12 | 0.6% |
| Science & Technology | 194 | 10.0% |
| Business | 419 | 21.5% |
| Education | 141 | 7.2% |
| Literature & Languages | 106 | 5.4% |
| Liberal Arts & History | 138 | 7.1% |
| Visual & Performing Arts | 49 | 2.5% |
| Communications | 125 | 6.4% |
| Arts & Humanities | 37 | 1.9% |
| Total | 1,949 | 100.0% |
Transportation & Commute in Monmouth Beach borough
Vehicle Availability by Sex in Monmouth Beach borough
The most prevalent vehicle ownership categories in Monmouth Beach borough are males with 2 vehicles (358, accounting for 45.0%) and females with 2 vehicles (331, making up 47.7%).
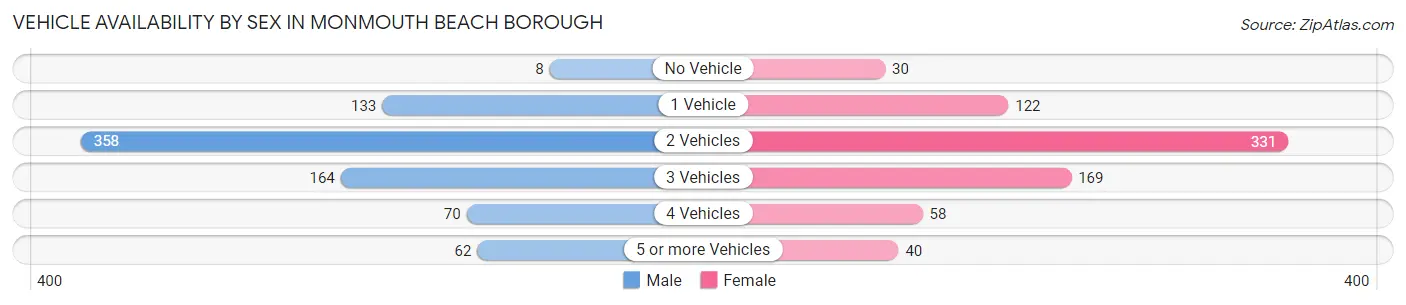
| Vehicles Available | Male | Female |
| No Vehicle | 8 (1.0%) | 30 (4.0%) |
| 1 Vehicle | 133 (16.7%) | 122 (16.3%) |
| 2 Vehicles | 358 (45.0%) | 331 (44.1%) |
| 3 Vehicles | 164 (20.6%) | 169 (22.5%) |
| 4 Vehicles | 70 (8.8%) | 58 (7.7%) |
| 5 or more Vehicles | 62 (7.8%) | 40 (5.3%) |
| Total | 795 (100.0%) | 750 (100.0%) |
Commute Time in Monmouth Beach borough
The most frequently occuring commute durations in Monmouth Beach borough are 30 to 34 minutes (178 commuters, 17.8%), 60 to 89 minutes (178 commuters, 17.8%), and 10 to 14 minutes (143 commuters, 14.3%).
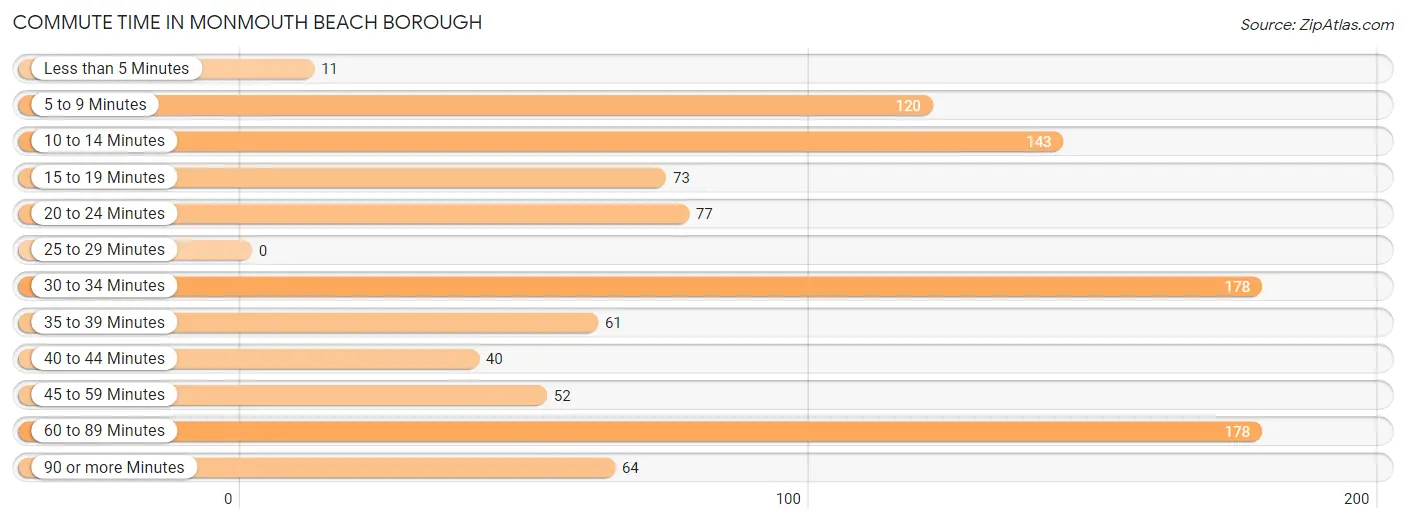
| Commute Time | # Commuters | % Commuters |
| Less than 5 Minutes | 11 | 1.1% |
| 5 to 9 Minutes | 120 | 12.0% |
| 10 to 14 Minutes | 143 | 14.3% |
| 15 to 19 Minutes | 73 | 7.3% |
| 20 to 24 Minutes | 77 | 7.7% |
| 25 to 29 Minutes | 0 | 0.0% |
| 30 to 34 Minutes | 178 | 17.8% |
| 35 to 39 Minutes | 61 | 6.1% |
| 40 to 44 Minutes | 40 | 4.0% |
| 45 to 59 Minutes | 52 | 5.2% |
| 60 to 89 Minutes | 178 | 17.8% |
| 90 or more Minutes | 64 | 6.4% |
Commute Time by Sex in Monmouth Beach borough
The most common commute times in Monmouth Beach borough are 60 to 89 minutes (131 commuters, 27.5%) for males and 30 to 34 minutes (100 commuters, 19.2%) for females.
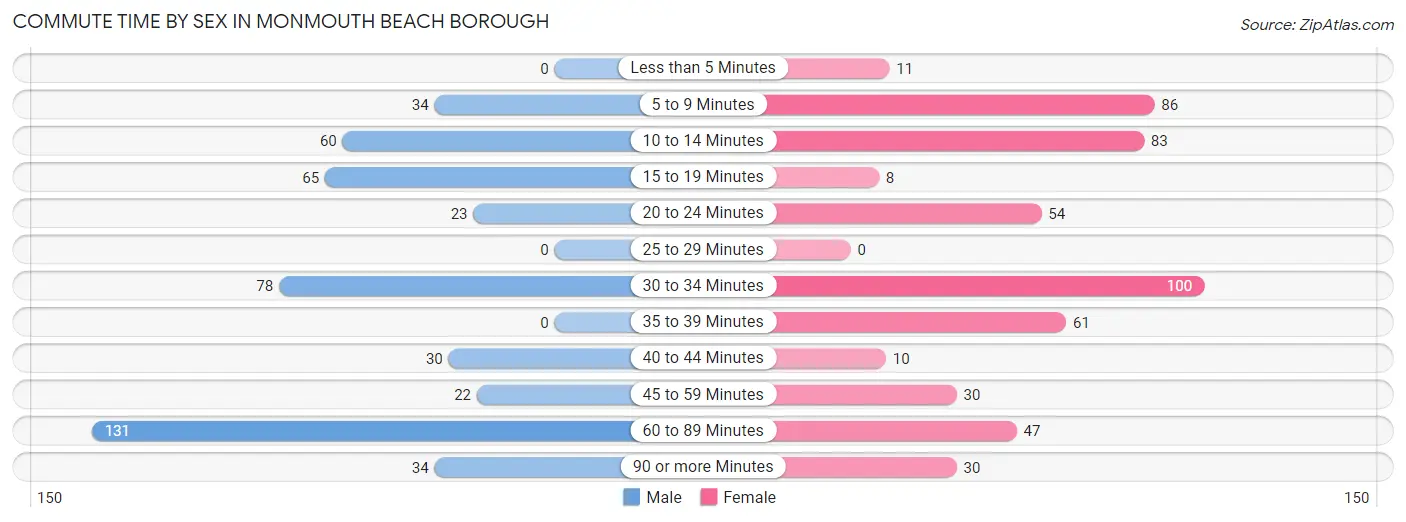
| Commute Time | Male | Female |
| Less than 5 Minutes | 0 (0.0%) | 11 (2.1%) |
| 5 to 9 Minutes | 34 (7.1%) | 86 (16.5%) |
| 10 to 14 Minutes | 60 (12.6%) | 83 (16.0%) |
| 15 to 19 Minutes | 65 (13.6%) | 8 (1.5%) |
| 20 to 24 Minutes | 23 (4.8%) | 54 (10.4%) |
| 25 to 29 Minutes | 0 (0.0%) | 0 (0.0%) |
| 30 to 34 Minutes | 78 (16.4%) | 100 (19.2%) |
| 35 to 39 Minutes | 0 (0.0%) | 61 (11.7%) |
| 40 to 44 Minutes | 30 (6.3%) | 10 (1.9%) |
| 45 to 59 Minutes | 22 (4.6%) | 30 (5.8%) |
| 60 to 89 Minutes | 131 (27.5%) | 47 (9.0%) |
| 90 or more Minutes | 34 (7.1%) | 30 (5.8%) |
Time of Departure to Work by Sex in Monmouth Beach borough
The most frequent times of departure to work in Monmouth Beach borough are 7:00 AM to 7:29 AM (111, 23.3%) for males and 8:00 AM to 8:29 AM (106, 20.4%) for females.
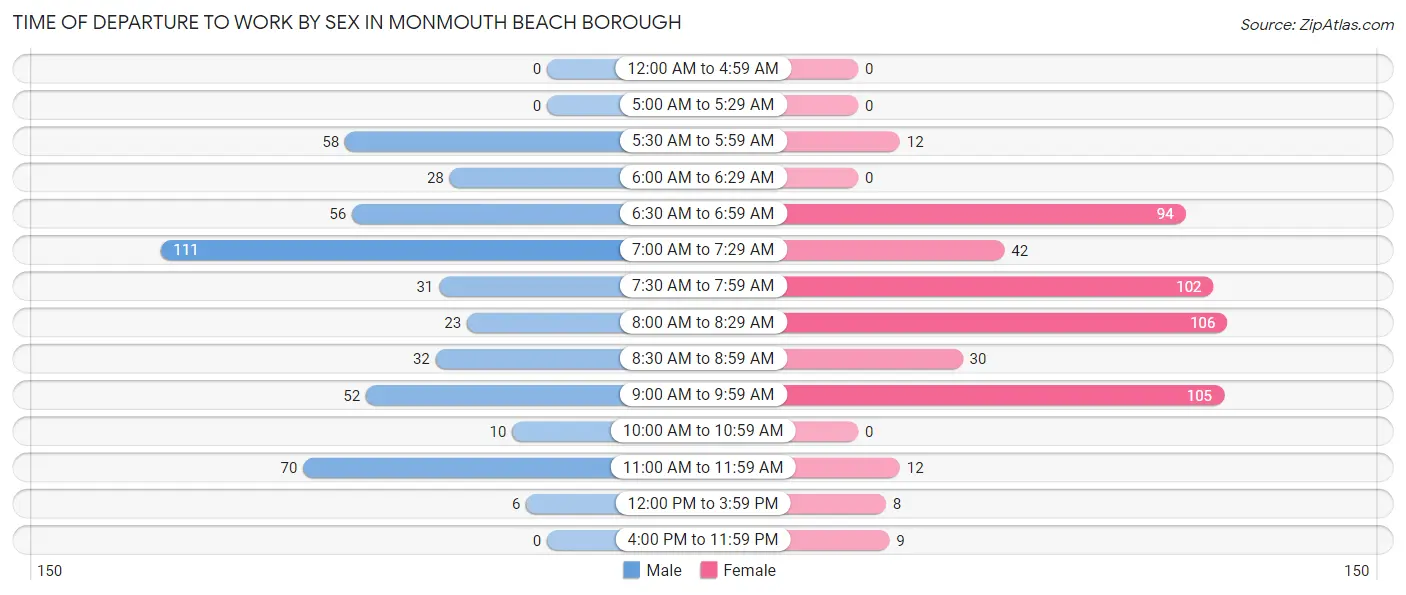
| Time of Departure | Male | Female |
| 12:00 AM to 4:59 AM | 0 (0.0%) | 0 (0.0%) |
| 5:00 AM to 5:29 AM | 0 (0.0%) | 0 (0.0%) |
| 5:30 AM to 5:59 AM | 58 (12.2%) | 12 (2.3%) |
| 6:00 AM to 6:29 AM | 28 (5.9%) | 0 (0.0%) |
| 6:30 AM to 6:59 AM | 56 (11.7%) | 94 (18.1%) |
| 7:00 AM to 7:29 AM | 111 (23.3%) | 42 (8.1%) |
| 7:30 AM to 7:59 AM | 31 (6.5%) | 102 (19.6%) |
| 8:00 AM to 8:29 AM | 23 (4.8%) | 106 (20.4%) |
| 8:30 AM to 8:59 AM | 32 (6.7%) | 30 (5.8%) |
| 9:00 AM to 9:59 AM | 52 (10.9%) | 105 (20.2%) |
| 10:00 AM to 10:59 AM | 10 (2.1%) | 0 (0.0%) |
| 11:00 AM to 11:59 AM | 70 (14.7%) | 12 (2.3%) |
| 12:00 PM to 3:59 PM | 6 (1.3%) | 8 (1.5%) |
| 4:00 PM to 11:59 PM | 0 (0.0%) | 9 (1.7%) |
| Total | 477 (100.0%) | 520 (100.0%) |
Housing Occupancy in Monmouth Beach borough
Occupancy by Ownership in Monmouth Beach borough
Of the total 1,520 dwellings in Monmouth Beach borough, owner-occupied units account for 1,183 (77.8%), while renter-occupied units make up 337 (22.2%).
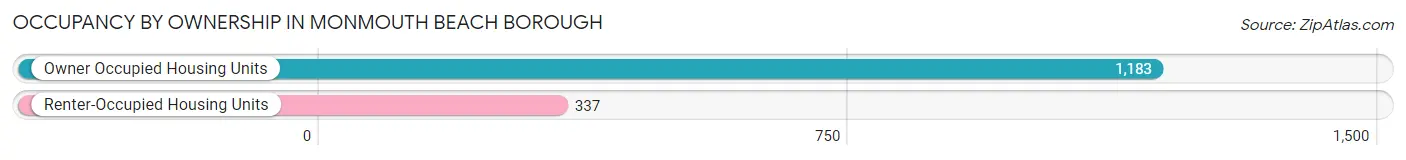
| Occupancy | # Housing Units | % Housing Units |
| Owner Occupied Housing Units | 1,183 | 77.8% |
| Renter-Occupied Housing Units | 337 | 22.2% |
| Total Occupied Housing Units | 1,520 | 100.0% |
Occupancy by Household Size in Monmouth Beach borough
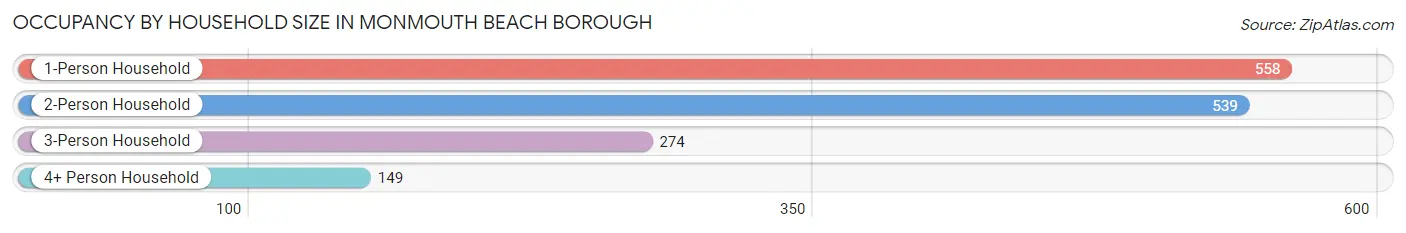
| Household Size | # Housing Units | % Housing Units |
| 1-Person Household | 558 | 36.7% |
| 2-Person Household | 539 | 35.5% |
| 3-Person Household | 274 | 18.0% |
| 4+ Person Household | 149 | 9.8% |
| Total Housing Units | 1,520 | 100.0% |
Occupancy by Ownership by Household Size in Monmouth Beach borough
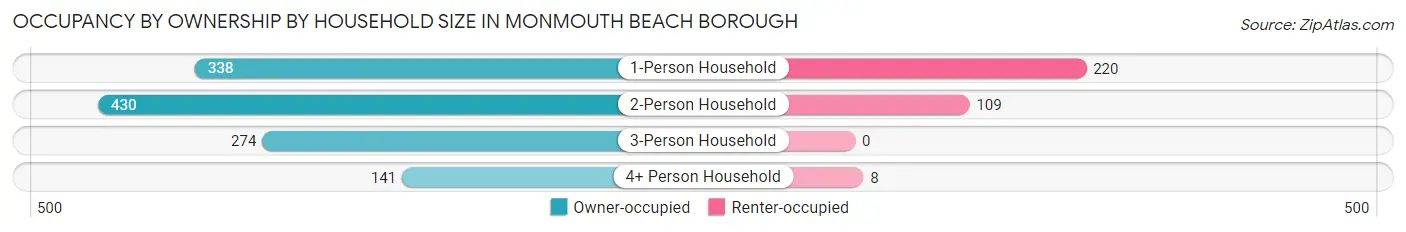
| Household Size | Owner-occupied | Renter-occupied |
| 1-Person Household | 338 (60.6%) | 220 (39.4%) |
| 2-Person Household | 430 (79.8%) | 109 (20.2%) |
| 3-Person Household | 274 (100.0%) | 0 (0.0%) |
| 4+ Person Household | 141 (94.6%) | 8 (5.4%) |
| Total Housing Units | 1,183 (77.8%) | 337 (22.2%) |
Occupancy by Educational Attainment in Monmouth Beach borough
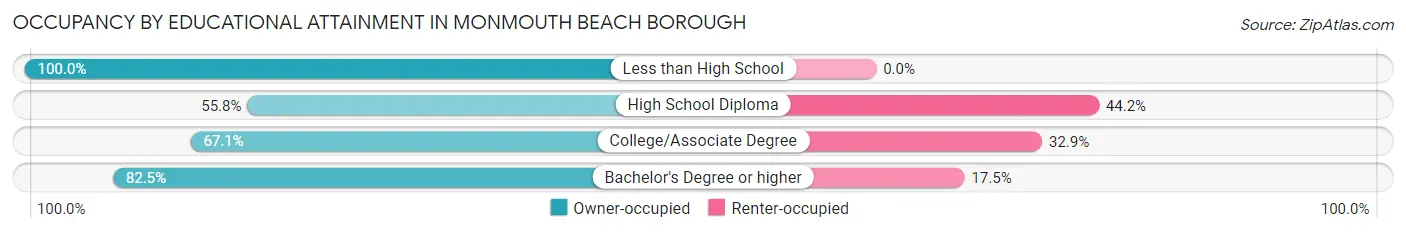
| Household Size | Owner-occupied | Renter-occupied |
| Less than High School | 30 (100.0%) | 0 (0.0%) |
| High School Diploma | 86 (55.8%) | 68 (44.2%) |
| College/Associate Degree | 153 (67.1%) | 75 (32.9%) |
| Bachelor's Degree or higher | 914 (82.5%) | 194 (17.5%) |
Occupancy by Age of Householder in Monmouth Beach borough
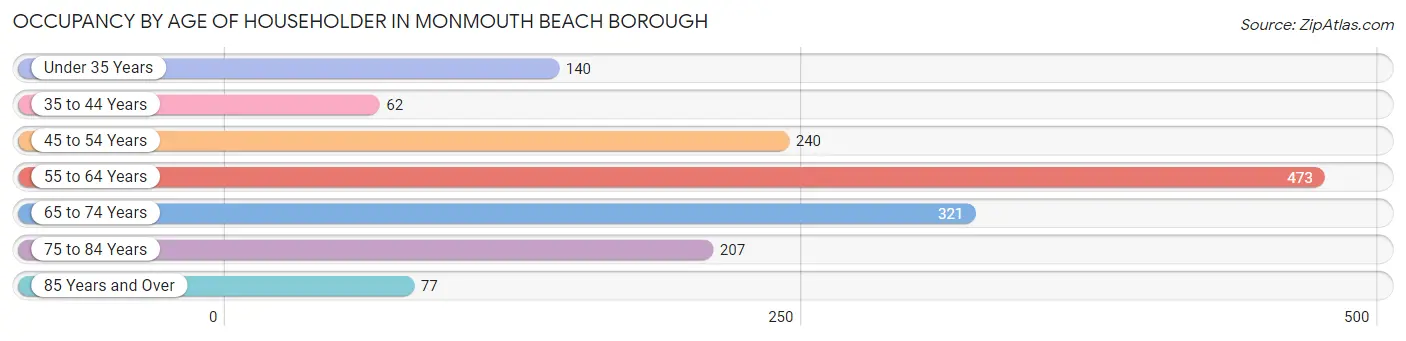
| Age Bracket | # Households | % Households |
| Under 35 Years | 140 | 9.2% |
| 35 to 44 Years | 62 | 4.1% |
| 45 to 54 Years | 240 | 15.8% |
| 55 to 64 Years | 473 | 31.1% |
| 65 to 74 Years | 321 | 21.1% |
| 75 to 84 Years | 207 | 13.6% |
| 85 Years and Over | 77 | 5.1% |
| Total | 1,520 | 100.0% |
Housing Finances in Monmouth Beach borough
Median Income by Occupancy in Monmouth Beach borough
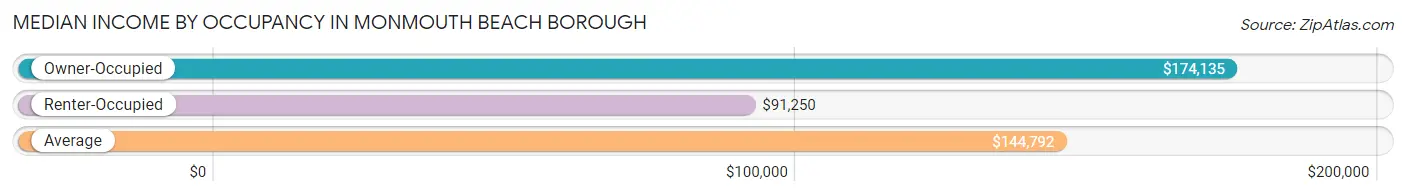
| Occupancy Type | # Households | Median Income |
| Owner-Occupied | 1,183 (77.8%) | $174,135 |
| Renter-Occupied | 337 (22.2%) | $91,250 |
| Average | 1,520 (100.0%) | $144,792 |
Occupancy by Householder Income Bracket in Monmouth Beach borough
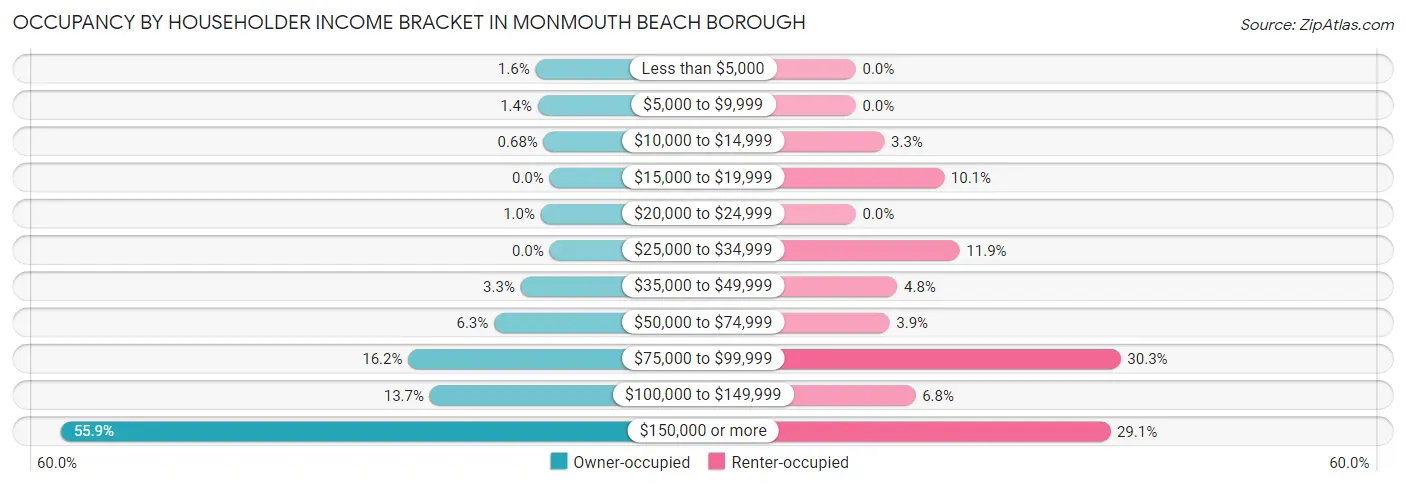
| Income Bracket | Owner-occupied | Renter-occupied |
| Less than $5,000 | 19 (1.6%) | 0 (0.0%) |
| $5,000 to $9,999 | 16 (1.3%) | 0 (0.0%) |
| $10,000 to $14,999 | 8 (0.7%) | 11 (3.3%) |
| $15,000 to $19,999 | 0 (0.0%) | 34 (10.1%) |
| $20,000 to $24,999 | 12 (1.0%) | 0 (0.0%) |
| $25,000 to $34,999 | 0 (0.0%) | 40 (11.9%) |
| $35,000 to $49,999 | 39 (3.3%) | 16 (4.8%) |
| $50,000 to $74,999 | 75 (6.3%) | 13 (3.9%) |
| $75,000 to $99,999 | 191 (16.2%) | 102 (30.3%) |
| $100,000 to $149,999 | 162 (13.7%) | 23 (6.8%) |
| $150,000 or more | 661 (55.9%) | 98 (29.1%) |
| Total | 1,183 (100.0%) | 337 (100.0%) |
Monthly Housing Cost Tiers in Monmouth Beach borough
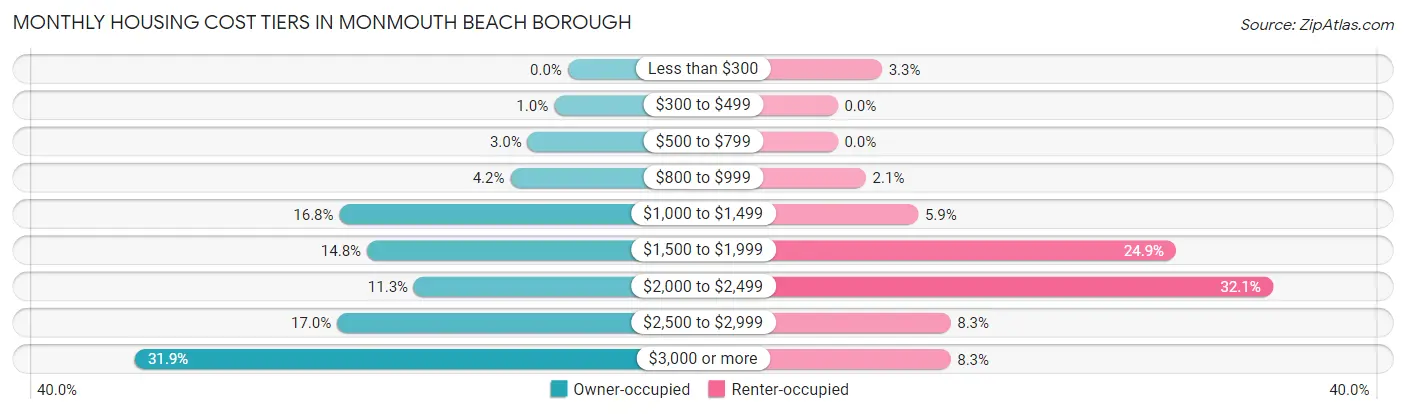
| Monthly Cost | Owner-occupied | Renter-occupied |
| Less than $300 | 0 (0.0%) | 11 (3.3%) |
| $300 to $499 | 12 (1.0%) | 0 (0.0%) |
| $500 to $799 | 35 (3.0%) | 0 (0.0%) |
| $800 to $999 | 50 (4.2%) | 7 (2.1%) |
| $1,000 to $1,499 | 199 (16.8%) | 20 (5.9%) |
| $1,500 to $1,999 | 175 (14.8%) | 84 (24.9%) |
| $2,000 to $2,499 | 134 (11.3%) | 108 (32.1%) |
| $2,500 to $2,999 | 201 (17.0%) | 28 (8.3%) |
| $3,000 or more | 377 (31.9%) | 28 (8.3%) |
| Total | 1,183 (100.0%) | 337 (100.0%) |
Physical Housing Characteristics in Monmouth Beach borough
Housing Structures in Monmouth Beach borough
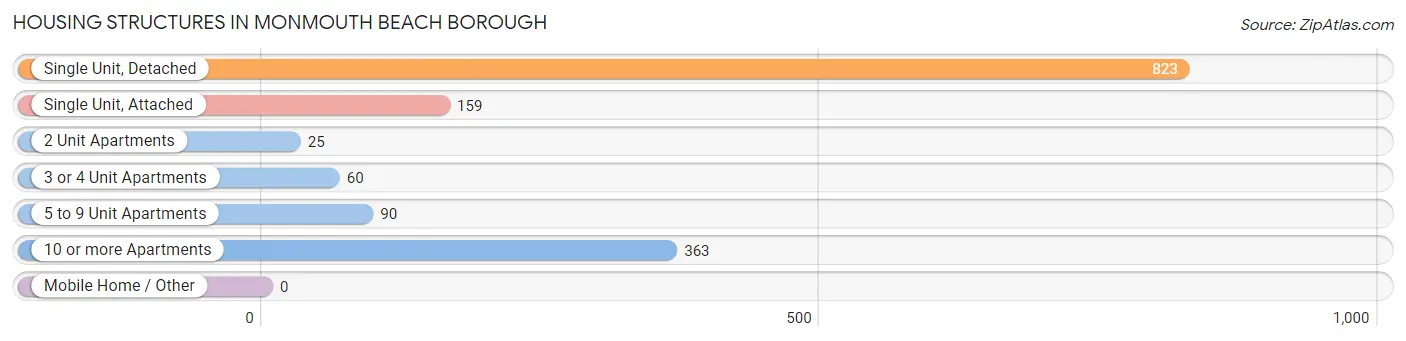
| Structure Type | # Housing Units | % Housing Units |
| Single Unit, Detached | 823 | 54.1% |
| Single Unit, Attached | 159 | 10.5% |
| 2 Unit Apartments | 25 | 1.6% |
| 3 or 4 Unit Apartments | 60 | 4.0% |
| 5 to 9 Unit Apartments | 90 | 5.9% |
| 10 or more Apartments | 363 | 23.9% |
| Mobile Home / Other | 0 | 0.0% |
| Total | 1,520 | 100.0% |
Housing Structures by Occupancy in Monmouth Beach borough
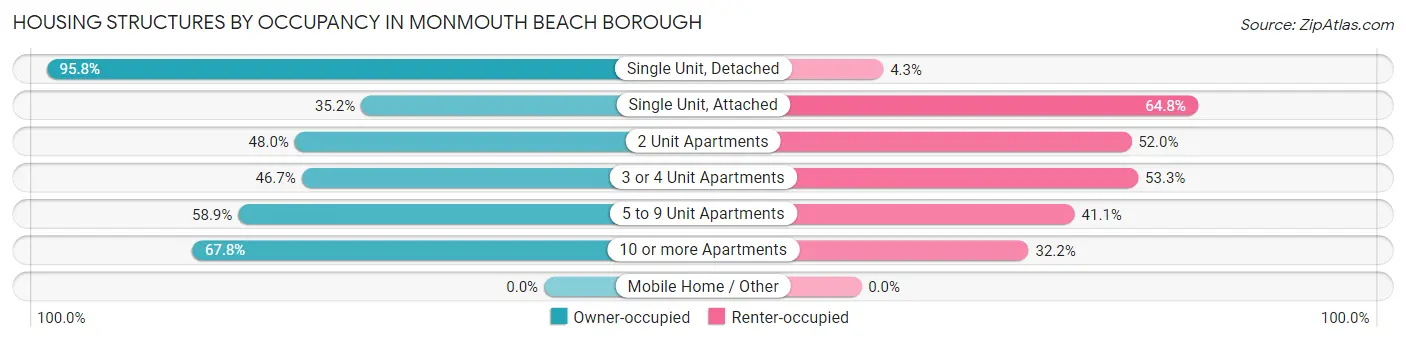
| Structure Type | Owner-occupied | Renter-occupied |
| Single Unit, Detached | 788 (95.8%) | 35 (4.3%) |
| Single Unit, Attached | 56 (35.2%) | 103 (64.8%) |
| 2 Unit Apartments | 12 (48.0%) | 13 (52.0%) |
| 3 or 4 Unit Apartments | 28 (46.7%) | 32 (53.3%) |
| 5 to 9 Unit Apartments | 53 (58.9%) | 37 (41.1%) |
| 10 or more Apartments | 246 (67.8%) | 117 (32.2%) |
| Mobile Home / Other | 0 (0.0%) | 0 (0.0%) |
| Total | 1,183 (77.8%) | 337 (22.2%) |
Housing Structures by Number of Rooms in Monmouth Beach borough
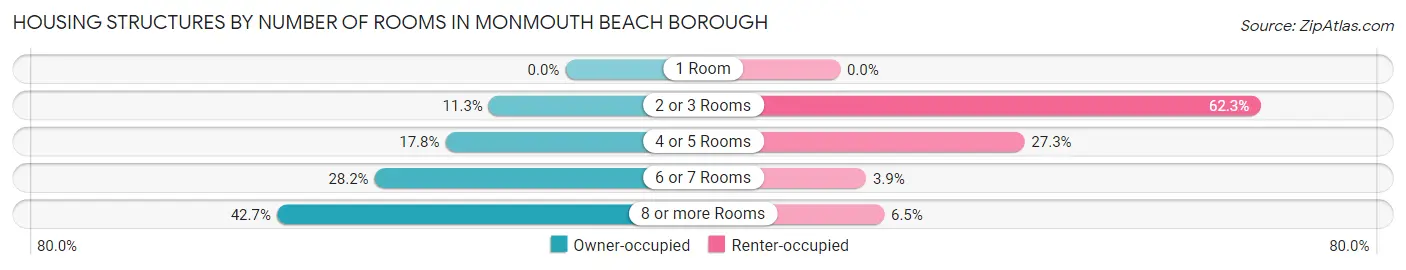
| Number of Rooms | Owner-occupied | Renter-occupied |
| 1 Room | 0 (0.0%) | 0 (0.0%) |
| 2 or 3 Rooms | 134 (11.3%) | 210 (62.3%) |
| 4 or 5 Rooms | 210 (17.7%) | 92 (27.3%) |
| 6 or 7 Rooms | 334 (28.2%) | 13 (3.9%) |
| 8 or more Rooms | 505 (42.7%) | 22 (6.5%) |
| Total | 1,183 (100.0%) | 337 (100.0%) |
Housing Structure by Heating Type in Monmouth Beach borough
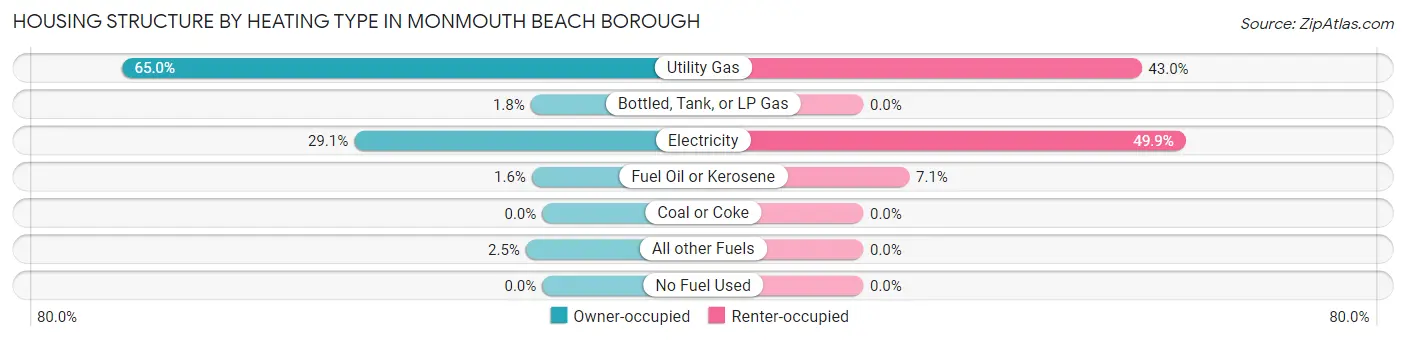
| Heating Type | Owner-occupied | Renter-occupied |
| Utility Gas | 769 (65.0%) | 145 (43.0%) |
| Bottled, Tank, or LP Gas | 21 (1.8%) | 0 (0.0%) |
| Electricity | 344 (29.1%) | 168 (49.8%) |
| Fuel Oil or Kerosene | 19 (1.6%) | 24 (7.1%) |
| Coal or Coke | 0 (0.0%) | 0 (0.0%) |
| All other Fuels | 30 (2.5%) | 0 (0.0%) |
| No Fuel Used | 0 (0.0%) | 0 (0.0%) |
| Total | 1,183 (100.0%) | 337 (100.0%) |
Household Vehicle Usage in Monmouth Beach borough
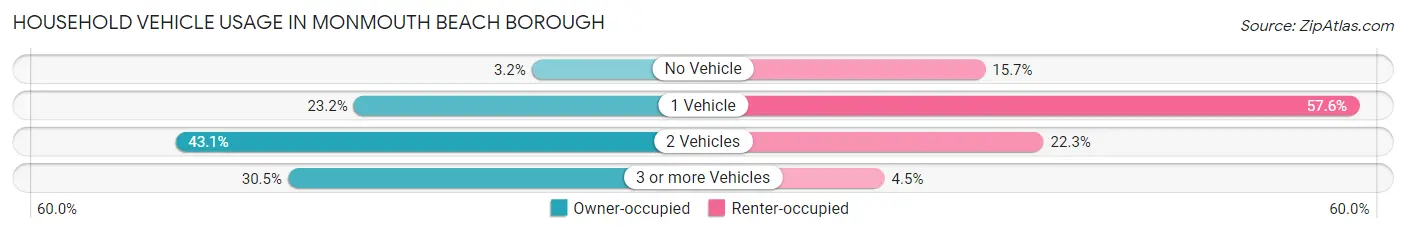
| Vehicles per Household | Owner-occupied | Renter-occupied |
| No Vehicle | 38 (3.2%) | 53 (15.7%) |
| 1 Vehicle | 274 (23.2%) | 194 (57.6%) |
| 2 Vehicles | 510 (43.1%) | 75 (22.3%) |
| 3 or more Vehicles | 361 (30.5%) | 15 (4.4%) |
| Total | 1,183 (100.0%) | 337 (100.0%) |
Real Estate & Mortgages in Monmouth Beach borough
Real Estate and Mortgage Overview in Monmouth Beach borough
| Characteristic | Without Mortgage | With Mortgage |
| Housing Units | 638 | 545 |
| Median Property Value | $891,300 | $940,500 |
| Median Household Income | $126,582 | $396 |
| Monthly Housing Costs | $1,501 | $332 |
| Real Estate Taxes | $9,619 | $0 |
Property Value by Mortgage Status in Monmouth Beach borough
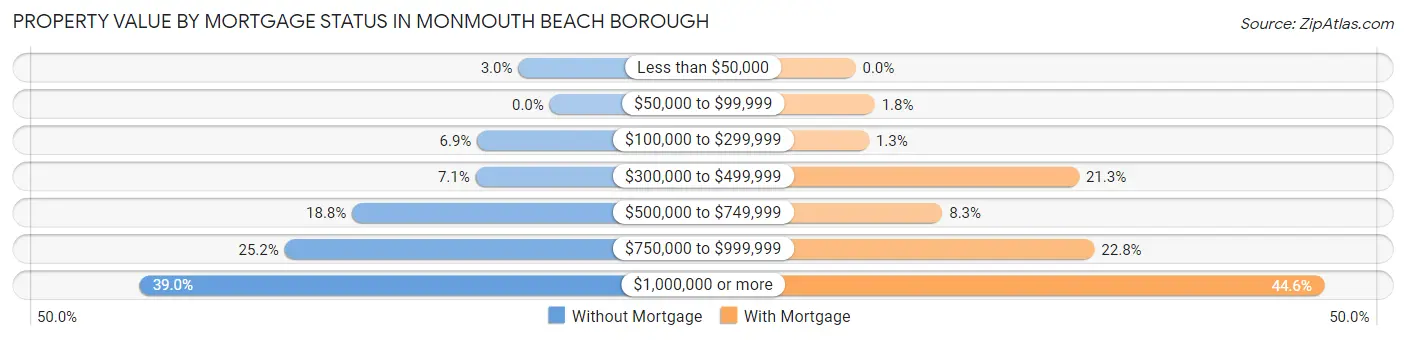
| Property Value | Without Mortgage | With Mortgage |
| Less than $50,000 | 19 (3.0%) | 0 (0.0%) |
| $50,000 to $99,999 | 0 (0.0%) | 10 (1.8%) |
| $100,000 to $299,999 | 44 (6.9%) | 7 (1.3%) |
| $300,000 to $499,999 | 45 (7.0%) | 116 (21.3%) |
| $500,000 to $749,999 | 120 (18.8%) | 45 (8.3%) |
| $750,000 to $999,999 | 161 (25.2%) | 124 (22.8%) |
| $1,000,000 or more | 249 (39.0%) | 243 (44.6%) |
| Total | 638 (100.0%) | 545 (100.0%) |
Household Income by Mortgage Status in Monmouth Beach borough
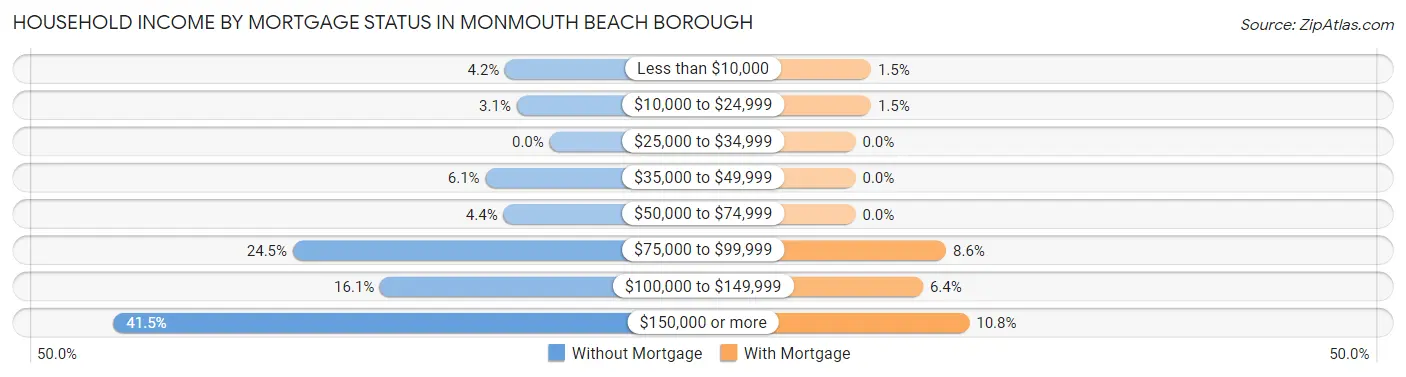
| Household Income | Without Mortgage | With Mortgage |
| Less than $10,000 | 27 (4.2%) | 8 (1.5%) |
| $10,000 to $24,999 | 20 (3.1%) | 8 (1.5%) |
| $25,000 to $34,999 | 0 (0.0%) | 0 (0.0%) |
| $35,000 to $49,999 | 39 (6.1%) | 0 (0.0%) |
| $50,000 to $74,999 | 28 (4.4%) | 0 (0.0%) |
| $75,000 to $99,999 | 156 (24.4%) | 47 (8.6%) |
| $100,000 to $149,999 | 103 (16.1%) | 35 (6.4%) |
| $150,000 or more | 265 (41.5%) | 59 (10.8%) |
| Total | 638 (100.0%) | 545 (100.0%) |
Property Value to Household Income Ratio in Monmouth Beach borough
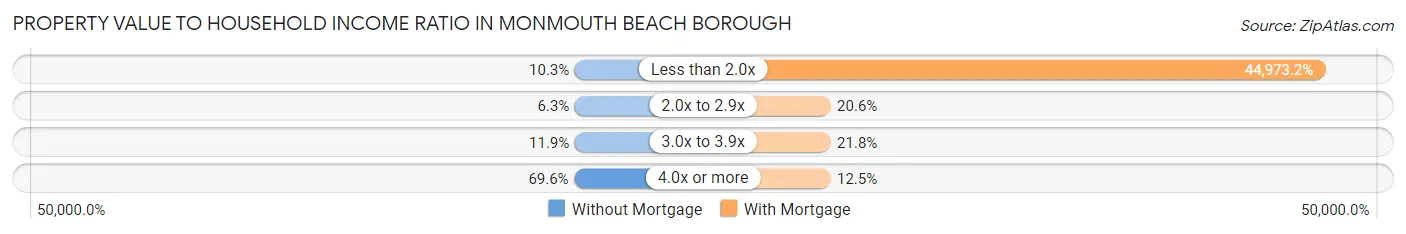
| Value-to-Income Ratio | Without Mortgage | With Mortgage |
| Less than 2.0x | 66 (10.3%) | 245,104 (44,973.2%) |
| 2.0x to 2.9x | 40 (6.3%) | 112 (20.5%) |
| 3.0x to 3.9x | 76 (11.9%) | 119 (21.8%) |
| 4.0x or more | 444 (69.6%) | 68 (12.5%) |
| Total | 638 (100.0%) | 545 (100.0%) |
Real Estate Taxes by Mortgage Status in Monmouth Beach borough
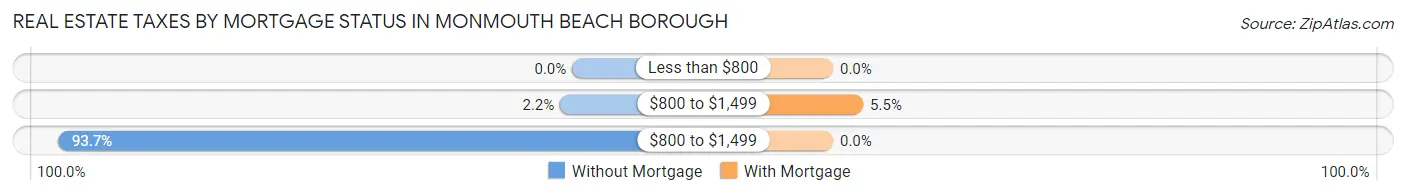
| Property Taxes | Without Mortgage | With Mortgage |
| Less than $800 | 0 (0.0%) | 0 (0.0%) |
| $800 to $1,499 | 14 (2.2%) | 30 (5.5%) |
| $800 to $1,499 | 598 (93.7%) | 0 (0.0%) |
| Total | 638 (100.0%) | 545 (100.0%) |
Health & Disability in Monmouth Beach borough
Health Insurance Coverage by Age in Monmouth Beach borough
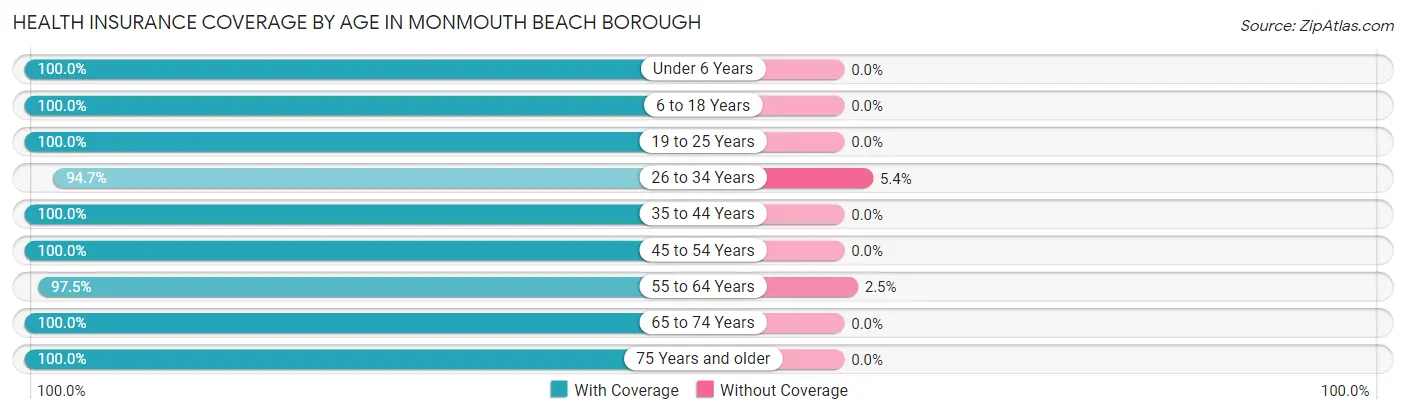
| Age Bracket | With Coverage | Without Coverage |
| Under 6 Years | 151 (100.0%) | 0 (0.0%) |
| 6 to 18 Years | 299 (100.0%) | 0 (0.0%) |
| 19 to 25 Years | 156 (100.0%) | 0 (0.0%) |
| 26 to 34 Years | 283 (94.7%) | 16 (5.3%) |
| 35 to 44 Years | 88 (100.0%) | 0 (0.0%) |
| 45 to 54 Years | 399 (100.0%) | 0 (0.0%) |
| 55 to 64 Years | 814 (97.5%) | 21 (2.5%) |
| 65 to 74 Years | 518 (100.0%) | 0 (0.0%) |
| 75 Years and older | 454 (100.0%) | 0 (0.0%) |
| Total | 3,162 (98.8%) | 37 (1.2%) |
Health Insurance Coverage by Citizenship Status in Monmouth Beach borough
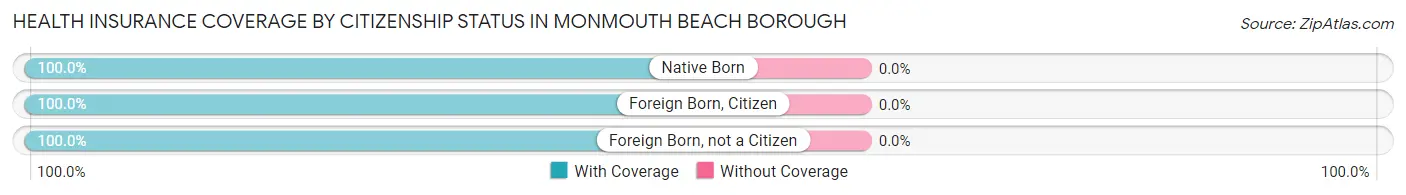
| Citizenship Status | With Coverage | Without Coverage |
| Native Born | 151 (100.0%) | 0 (0.0%) |
| Foreign Born, Citizen | 299 (100.0%) | 0 (0.0%) |
| Foreign Born, not a Citizen | 156 (100.0%) | 0 (0.0%) |
Health Insurance Coverage by Household Income in Monmouth Beach borough
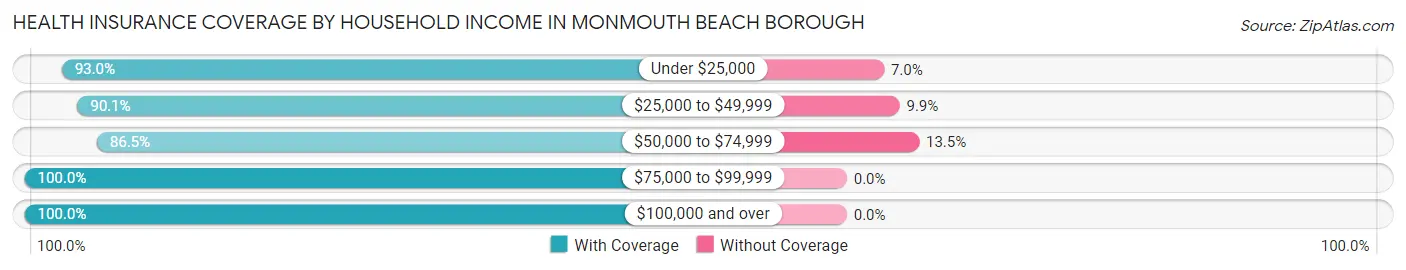
| Household Income | With Coverage | Without Coverage |
| Under $25,000 | 107 (93.0%) | 8 (7.0%) |
| $25,000 to $49,999 | 146 (90.1%) | 16 (9.9%) |
| $50,000 to $74,999 | 83 (86.5%) | 13 (13.5%) |
| $75,000 to $99,999 | 496 (100.0%) | 0 (0.0%) |
| $100,000 and over | 2,330 (100.0%) | 0 (0.0%) |
Public vs Private Health Insurance Coverage by Age in Monmouth Beach borough
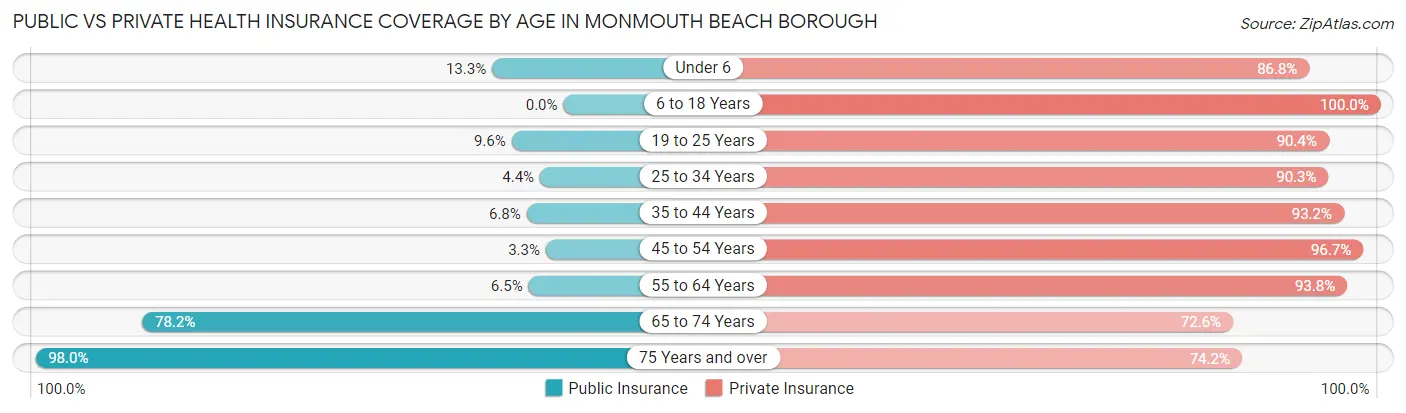
| Age Bracket | Public Insurance | Private Insurance |
| Under 6 | 20 (13.3%) | 131 (86.8%) |
| 6 to 18 Years | 0 (0.0%) | 299 (100.0%) |
| 19 to 25 Years | 15 (9.6%) | 141 (90.4%) |
| 25 to 34 Years | 13 (4.3%) | 270 (90.3%) |
| 35 to 44 Years | 6 (6.8%) | 82 (93.2%) |
| 45 to 54 Years | 13 (3.3%) | 386 (96.7%) |
| 55 to 64 Years | 54 (6.5%) | 783 (93.8%) |
| 65 to 74 Years | 405 (78.2%) | 376 (72.6%) |
| 75 Years and over | 445 (98.0%) | 337 (74.2%) |
| Total | 971 (30.3%) | 2,805 (87.7%) |
Disability Status by Sex by Age in Monmouth Beach borough
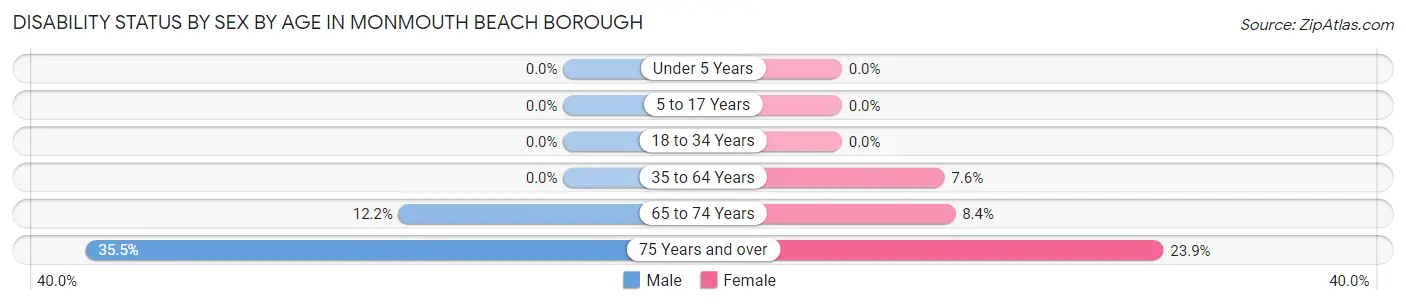
| Age Bracket | Male | Female |
| Under 5 Years | 0 (0.0%) | 0 (0.0%) |
| 5 to 17 Years | 0 (0.0%) | 0 (0.0%) |
| 18 to 34 Years | 0 (0.0%) | 0 (0.0%) |
| 35 to 64 Years | 0 (0.0%) | 50 (7.6%) |
| 65 to 74 Years | 27 (12.2%) | 25 (8.4%) |
| 75 Years and over | 66 (35.5%) | 64 (23.9%) |
Disability Class by Sex by Age in Monmouth Beach borough
Disability Class: Hearing Difficulty
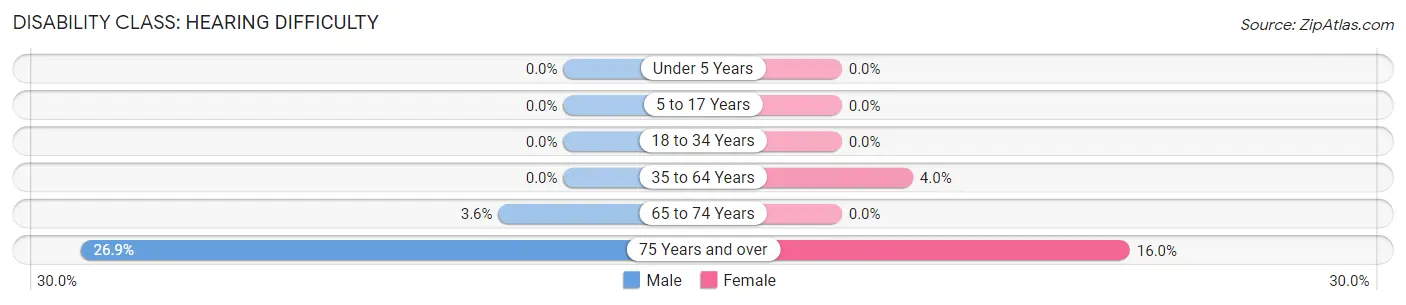
| Age Bracket | Male | Female |
| Under 5 Years | 0 (0.0%) | 0 (0.0%) |
| 5 to 17 Years | 0 (0.0%) | 0 (0.0%) |
| 18 to 34 Years | 0 (0.0%) | 0 (0.0%) |
| 35 to 64 Years | 0 (0.0%) | 26 (4.0%) |
| 65 to 74 Years | 8 (3.6%) | 0 (0.0%) |
| 75 Years and over | 50 (26.9%) | 43 (16.0%) |
Disability Class: Vision Difficulty
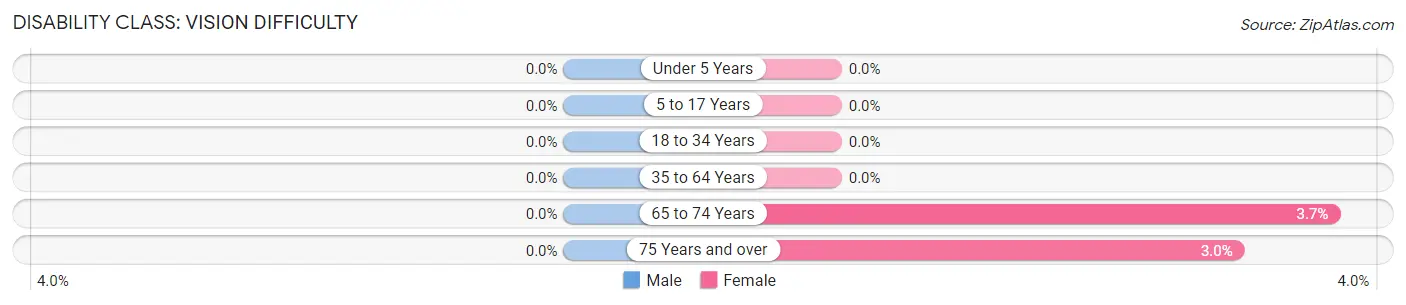
| Age Bracket | Male | Female |
| Under 5 Years | 0 (0.0%) | 0 (0.0%) |
| 5 to 17 Years | 0 (0.0%) | 0 (0.0%) |
| 18 to 34 Years | 0 (0.0%) | 0 (0.0%) |
| 35 to 64 Years | 0 (0.0%) | 0 (0.0%) |
| 65 to 74 Years | 0 (0.0%) | 11 (3.7%) |
| 75 Years and over | 0 (0.0%) | 8 (3.0%) |
Disability Class: Cognitive Difficulty
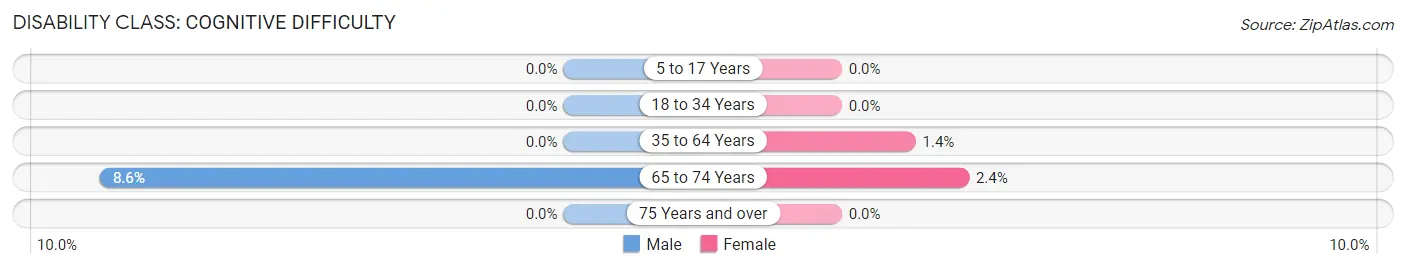
| Age Bracket | Male | Female |
| 5 to 17 Years | 0 (0.0%) | 0 (0.0%) |
| 18 to 34 Years | 0 (0.0%) | 0 (0.0%) |
| 35 to 64 Years | 0 (0.0%) | 9 (1.4%) |
| 65 to 74 Years | 19 (8.6%) | 7 (2.4%) |
| 75 Years and over | 0 (0.0%) | 0 (0.0%) |
Disability Class: Ambulatory Difficulty
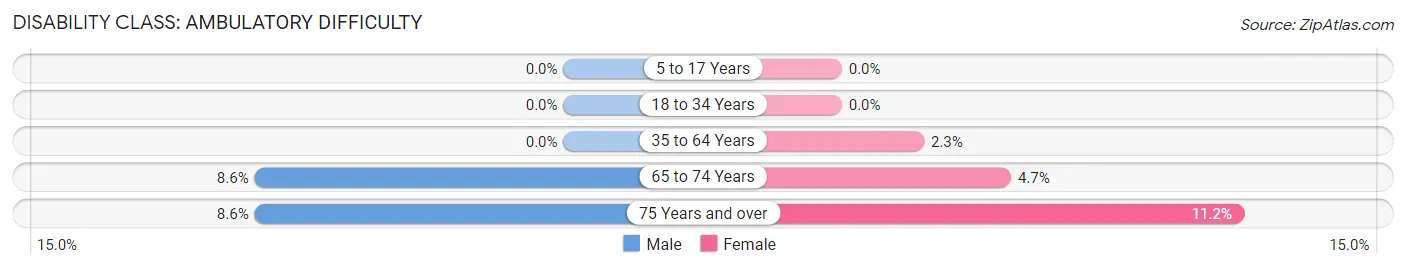
| Age Bracket | Male | Female |
| 5 to 17 Years | 0 (0.0%) | 0 (0.0%) |
| 18 to 34 Years | 0 (0.0%) | 0 (0.0%) |
| 35 to 64 Years | 0 (0.0%) | 15 (2.3%) |
| 65 to 74 Years | 19 (8.6%) | 14 (4.7%) |
| 75 Years and over | 16 (8.6%) | 30 (11.2%) |
Disability Class: Self-Care Difficulty
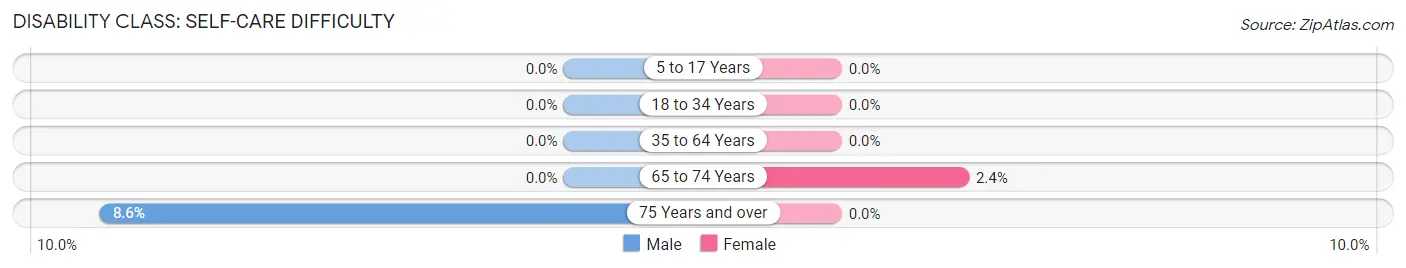
| Age Bracket | Male | Female |
| 5 to 17 Years | 0 (0.0%) | 0 (0.0%) |
| 18 to 34 Years | 0 (0.0%) | 0 (0.0%) |
| 35 to 64 Years | 0 (0.0%) | 0 (0.0%) |
| 65 to 74 Years | 0 (0.0%) | 7 (2.4%) |
| 75 Years and over | 16 (8.6%) | 0 (0.0%) |
Technology Access in Monmouth Beach borough
Computing Device Access in Monmouth Beach borough
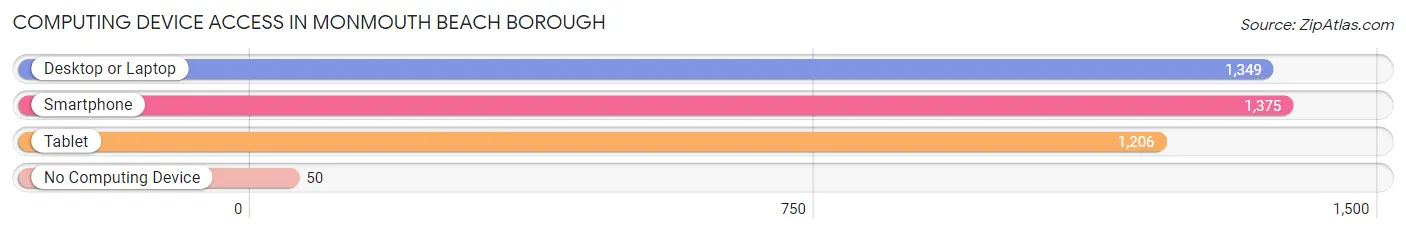
| Device Type | # Households | % Households |
| Desktop or Laptop | 1,349 | 88.7% |
| Smartphone | 1,375 | 90.5% |
| Tablet | 1,206 | 79.3% |
| No Computing Device | 50 | 3.3% |
| Total | 1,520 | 100.0% |
Internet Access in Monmouth Beach borough
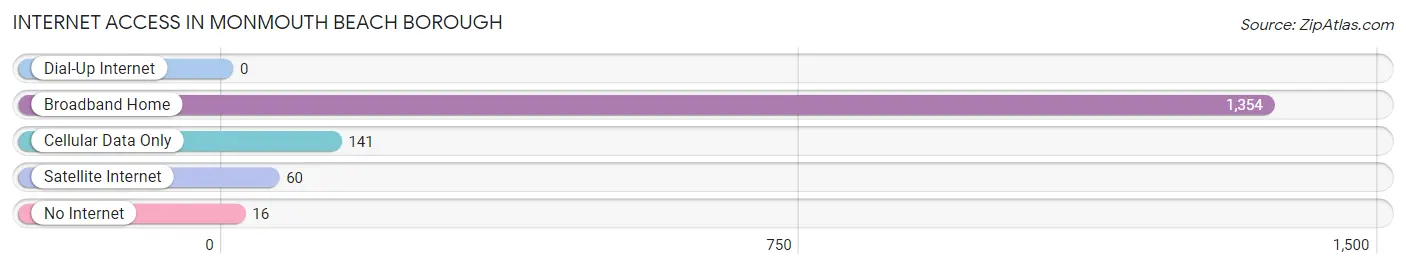
| Internet Type | # Households | % Households |
| Dial-Up Internet | 0 | 0.0% |
| Broadband Home | 1,354 | 89.1% |
| Cellular Data Only | 141 | 9.3% |
| Satellite Internet | 60 | 4.0% |
| No Internet | 16 | 1.1% |
| Total | 1,520 | 100.0% |
Monmouth Beach borough Summary
Monmouth Beach Borough is a small borough located in Monmouth County, New Jersey. It is situated on the Atlantic Ocean, just south of Long Branch and north of Sea Bright. The borough is home to a population of approximately 3,400 people, and is a popular destination for beachgoers and vacationers.
Geography
Monmouth Beach Borough is located at 40°20'N, 74°00'W. It is situated on the Atlantic Ocean, just south of Long Branch and north of Sea Bright. The borough is bordered by the Shrewsbury River to the west, the Navesink River to the north, and the Atlantic Ocean to the east and south. The borough covers an area of 1.2 square miles, and is home to a population of approximately 3,400 people.
The borough is divided into two distinct sections: the beachfront and the inland area. The beachfront area is home to a number of beach clubs, restaurants, and other attractions. The inland area is primarily residential, with a few small businesses and shops.
History
Monmouth Beach Borough was originally part of Ocean Township, which was established in 1849. In 1887, the area was incorporated as a separate borough. The borough was named after the Monmouth Beach Hotel, which was built in 1887 and was the first hotel in the area.
The borough was a popular destination for vacationers and beachgoers throughout the late 19th and early 20th centuries. In the 1920s, the borough was home to a number of popular nightclubs and restaurants, including the Monmouth Beach Club and the Monmouth Beach Casino.
Economy
Monmouth Beach Borough is primarily a residential community, with a few small businesses and shops. The borough is home to a number of beach clubs, restaurants, and other attractions. The borough also has a number of marinas, which provide services to boaters and fishermen.
Demographics
As of the 2010 census, Monmouth Beach Borough had a population of 3,400 people. The racial makeup of the borough was 94.3% White, 2.2% African American, 0.3% Native American, 1.2% Asian, 0.1% Pacific Islander, 0.7% from other races, and 1.4% from two or more races. Hispanic or Latino of any race were 3.2% of the population.
The median household income in Monmouth Beach Borough was $90,917, and the median family income was $106,250. The per capita income for the borough was $50,945. About 3.2% of families and 4.3% of the population were below the poverty line, including 4.3% of those under age 18 and 4.3% of those age 65 or over.
Monmouth Beach Borough is a small borough with a rich history and a vibrant economy. The borough is home to a number of beach clubs, restaurants, and other attractions, and is a popular destination for beachgoers and vacationers. The borough is also home to a diverse population, with a variety of racial and ethnic backgrounds.
Common Questions
What is Per Capita Income in Monmouth Beach borough?
Per Capita income in Monmouth Beach borough is $116,528.
What is the Median Family Income in Monmouth Beach borough?
Median Family Income in Monmouth Beach borough is $220,500.
What is the Median Household income in Monmouth Beach borough?
Median Household Income in Monmouth Beach borough is $144,792.
What is Income or Wage Gap in Monmouth Beach borough?
Income or Wage Gap in Monmouth Beach borough is 43.9%.
Women in Monmouth Beach borough earn 56.1 cents for every dollar earned by a man.
What is Inequality or Gini Index in Monmouth Beach borough?
Inequality or Gini Index in Monmouth Beach borough is 0.52.
What is the Total Population of Monmouth Beach borough?
Total Population of Monmouth Beach borough is 3,199.
What is the Total Male Population of Monmouth Beach borough?
Total Male Population of Monmouth Beach borough is 1,514.
What is the Total Female Population of Monmouth Beach borough?
Total Female Population of Monmouth Beach borough is 1,685.
What is the Ratio of Males per 100 Females in Monmouth Beach borough?
There are 89.85 Males per 100 Females in Monmouth Beach borough.
What is the Ratio of Females per 100 Males in Monmouth Beach borough?
There are 111.29 Females per 100 Males in Monmouth Beach borough.
What is the Median Population Age in Monmouth Beach borough?
Median Population Age in Monmouth Beach borough is 57.9 Years.
What is the Average Family Size in Monmouth Beach borough
Average Family Size in Monmouth Beach borough is 2.8 People.
What is the Average Household Size in Monmouth Beach borough
Average Household Size in Monmouth Beach borough is 2.1 People.
How Large is the Labor Force in Monmouth Beach borough?
There are 1,705 People in the Labor Forcein in Monmouth Beach borough.
What is the Percentage of People in the Labor Force in Monmouth Beach borough?
59.8% of People are in the Labor Force in Monmouth Beach borough.
What is the Unemployment Rate in Monmouth Beach borough?
Unemployment Rate in Monmouth Beach borough is 4.2%.