Navesink, NJ Map & Demographics
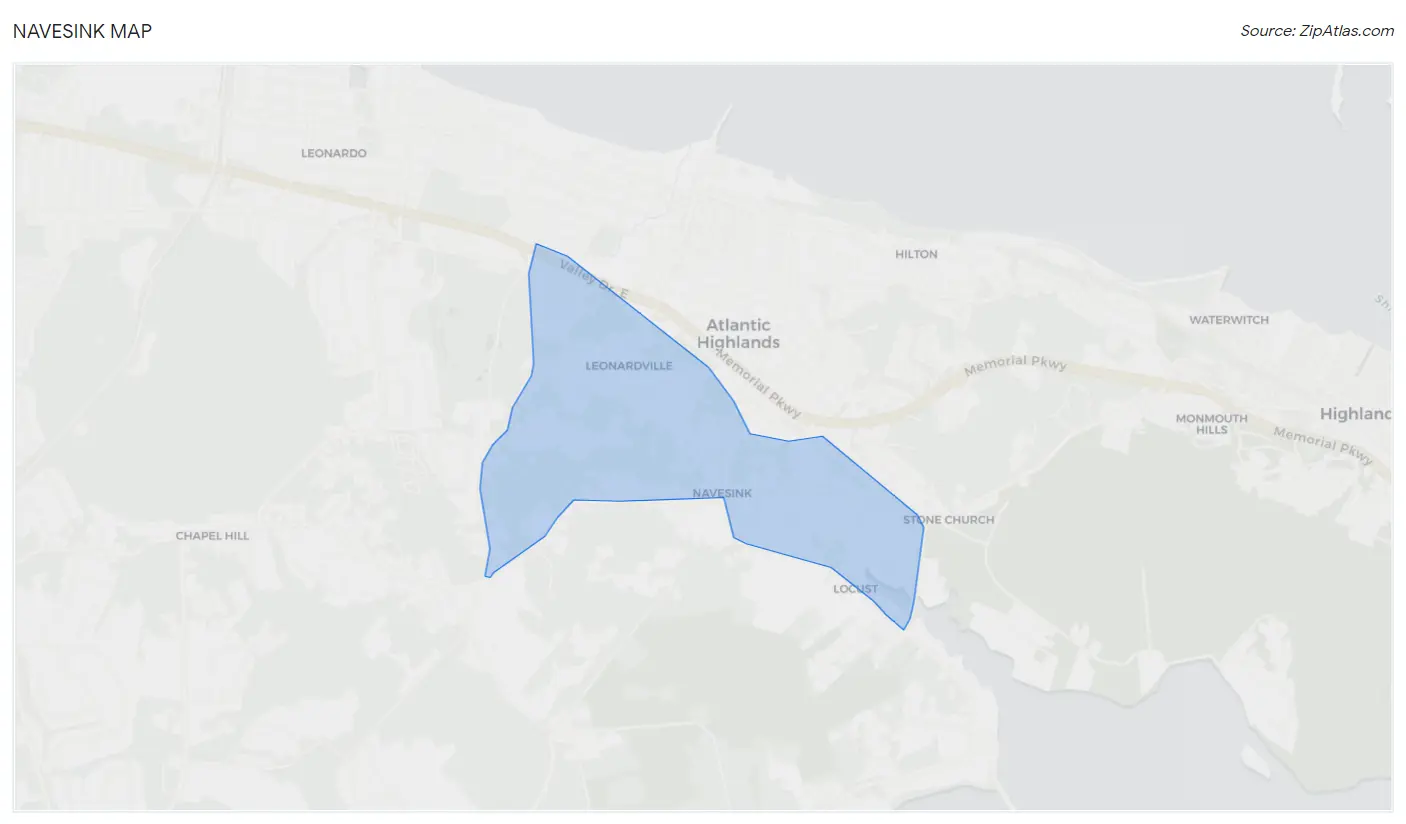
Navesink Map
Navesink Overview
$84,137
PER CAPITA INCOME
$182,969
AVG FAMILY INCOME
$163,699
AVG HOUSEHOLD INCOME
55.9%
WAGE / INCOME GAP [ % ]
44.1¢/ $1
WAGE / INCOME GAP [ $ ]
0.45
INEQUALITY / GINI INDEX
1,727
TOTAL POPULATION
826
MALE POPULATION
901
FEMALE POPULATION
91.68
MALES / 100 FEMALES
109.08
FEMALES / 100 MALES
49.6
MEDIAN AGE
2.9
AVG FAMILY SIZE
2.6
AVG HOUSEHOLD SIZE
1,063
LABOR FORCE [ PEOPLE ]
75.2%
PERCENT IN LABOR FORCE
11.2%
UNEMPLOYMENT RATE
Navesink Area Codes
Income in Navesink
Income Overview in Navesink
Per Capita Income in Navesink is $84,137, while median incomes of families and households are $182,969 and $163,699 respectively.
| Characteristic | Number | Measure |
| Per Capita Income | 1,727 | $84,137 |
| Median Family Income | 525 | $182,969 |
| Mean Family Income | 525 | $257,338 |
| Median Household Income | 673 | $163,699 |
| Mean Household Income | 673 | $211,565 |
| Income Deficit | 525 | $0 |
| Wage / Income Gap (%) | 1,727 | 55.91% |
| Wage / Income Gap ($) | 1,727 | 44.09¢ per $1 |
| Gini / Inequality Index | 1,727 | 0.45 |
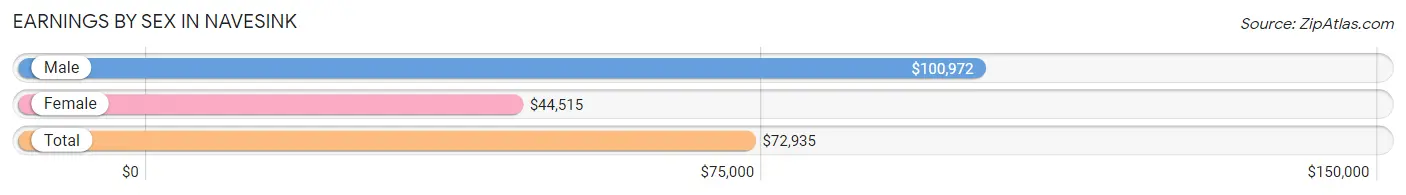
Earnings by Sex in Navesink
Average Earnings in Navesink are $72,935, $100,972 for men and $44,515 for women, a difference of 55.9%.
| Sex | Number | Average Earnings |
| Male | 595 (58.5%) | $100,972 |
| Female | 423 (41.5%) | $44,515 |
| Total | 1,018 (100.0%) | $72,935 |
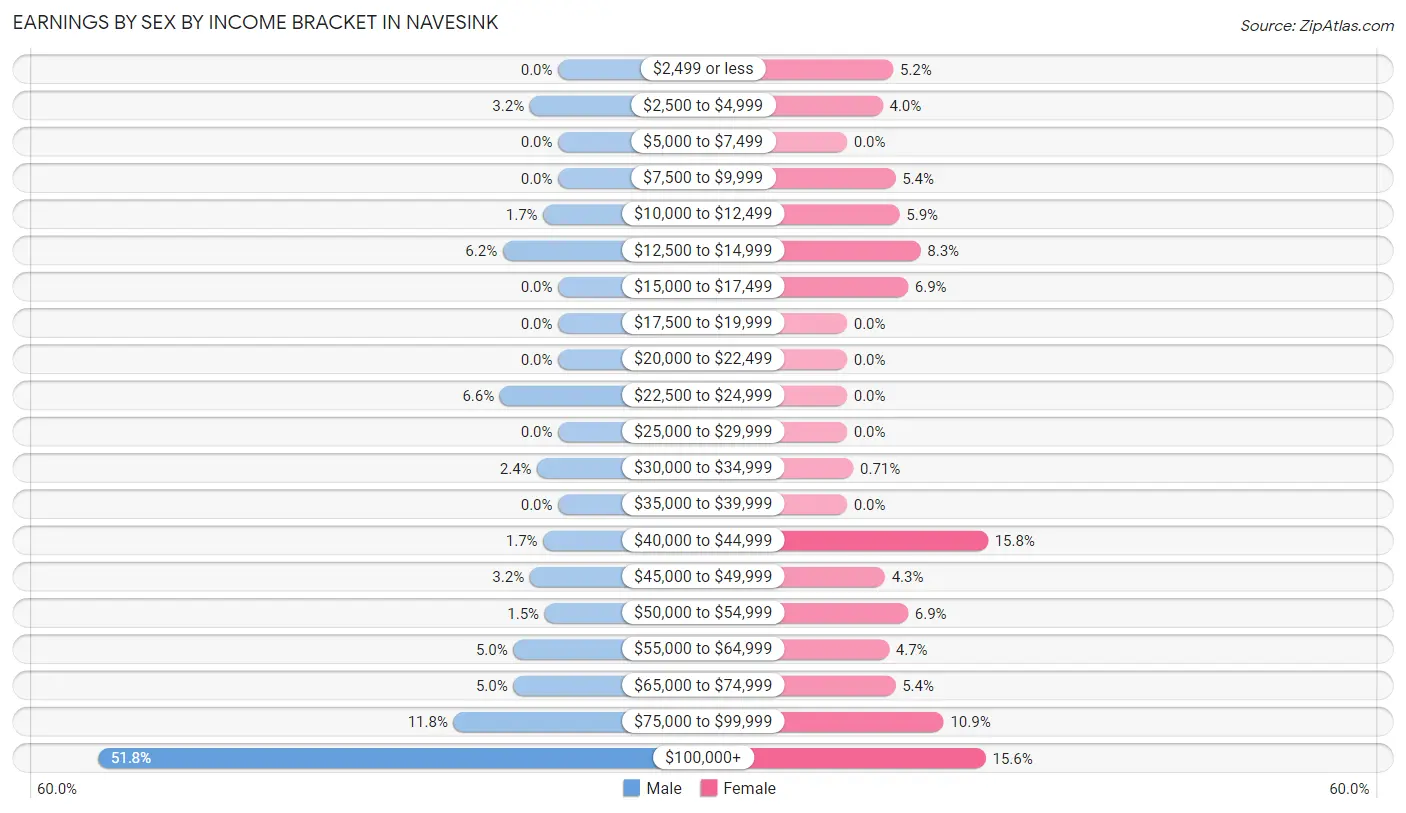
Earnings by Sex by Income Bracket in Navesink
The most common earnings brackets in Navesink are $100,000+ for men (308 | 51.8%) and $40,000 to $44,999 for women (67 | 15.8%).
| Income | Male | Female |
| $2,499 or less | 0 (0.0%) | 22 (5.2%) |
| $2,500 to $4,999 | 19 (3.2%) | 17 (4.0%) |
| $5,000 to $7,499 | 0 (0.0%) | 0 (0.0%) |
| $7,500 to $9,999 | 0 (0.0%) | 23 (5.4%) |
| $10,000 to $12,499 | 10 (1.7%) | 25 (5.9%) |
| $12,500 to $14,999 | 37 (6.2%) | 35 (8.3%) |
| $15,000 to $17,499 | 0 (0.0%) | 29 (6.9%) |
| $17,500 to $19,999 | 0 (0.0%) | 0 (0.0%) |
| $20,000 to $22,499 | 0 (0.0%) | 0 (0.0%) |
| $22,500 to $24,999 | 39 (6.6%) | 0 (0.0%) |
| $25,000 to $29,999 | 0 (0.0%) | 0 (0.0%) |
| $30,000 to $34,999 | 14 (2.4%) | 3 (0.7%) |
| $35,000 to $39,999 | 0 (0.0%) | 0 (0.0%) |
| $40,000 to $44,999 | 10 (1.7%) | 67 (15.8%) |
| $45,000 to $49,999 | 19 (3.2%) | 18 (4.3%) |
| $50,000 to $54,999 | 9 (1.5%) | 29 (6.9%) |
| $55,000 to $64,999 | 30 (5.0%) | 20 (4.7%) |
| $65,000 to $74,999 | 30 (5.0%) | 23 (5.4%) |
| $75,000 to $99,999 | 70 (11.8%) | 46 (10.9%) |
| $100,000+ | 308 (51.8%) | 66 (15.6%) |
| Total | 595 (100.0%) | 423 (100.0%) |
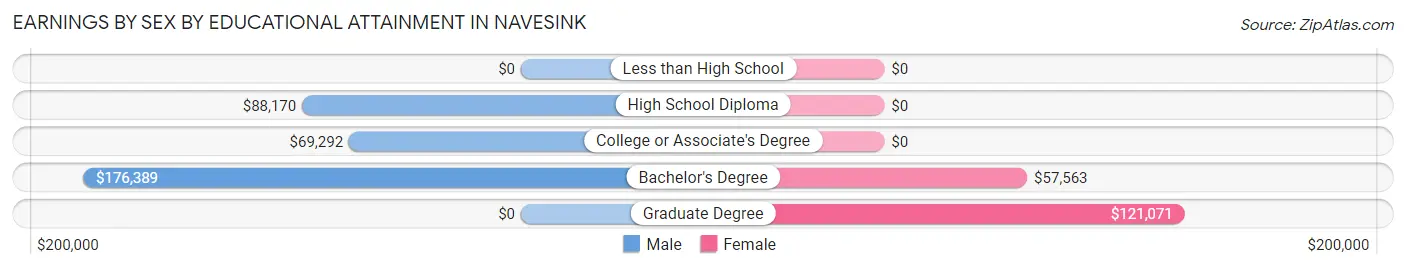
Earnings by Sex by Educational Attainment in Navesink
Average earnings in Navesink are $103,398 for men and $45,069 for women, a difference of 56.4%. Men with an educational attainment of bachelor's degree enjoy the highest average annual earnings of $176,389, while those with college or associate's degree education earn the least with $69,292. Women with an educational attainment of graduate degree earn the most with the average annual earnings of $121,071, while those with bachelor's degree education have the smallest earnings of $57,563.
| Educational Attainment | Male Income | Female Income |
| Less than High School | - | - |
| High School Diploma | $88,170 | $0 |
| College or Associate's Degree | $69,292 | $0 |
| Bachelor's Degree | $176,389 | $57,563 |
| Graduate Degree | - | - |
| Total | $103,398 | $45,069 |
Family Income in Navesink
Family Income Brackets in Navesink
According to the Navesink family income data, there are 256 families falling into the $200,000+ income range, which is the most common income bracket and makes up 48.8% of all families.
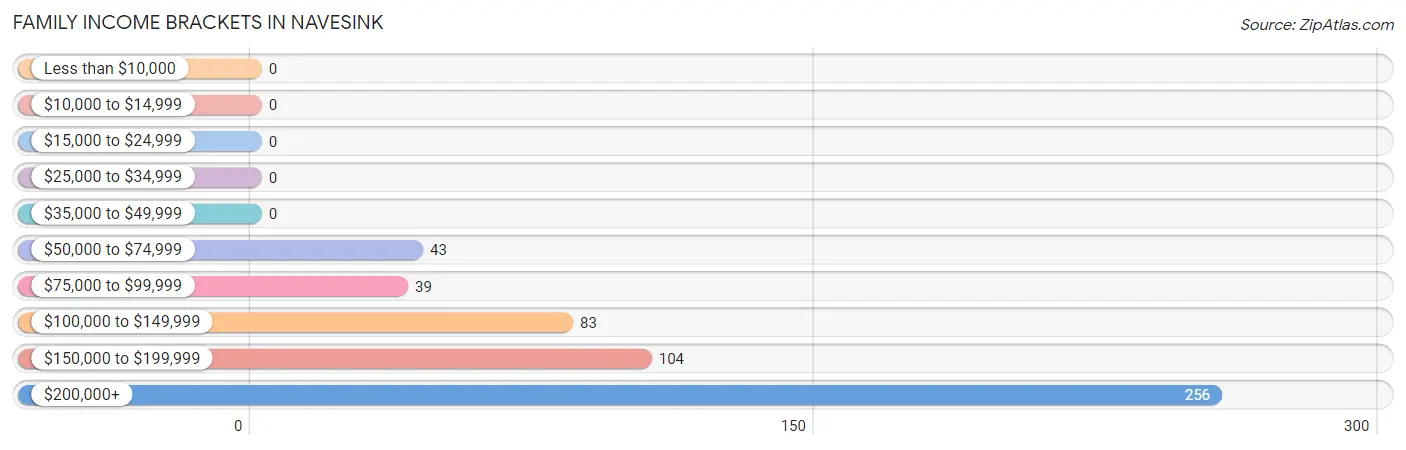
| Income Bracket | # Families | % Families |
| Less than $10,000 | 0 | 0.0% |
| $10,000 to $14,999 | 0 | 0.0% |
| $15,000 to $24,999 | 0 | 0.0% |
| $25,000 to $34,999 | 0 | 0.0% |
| $35,000 to $49,999 | 0 | 0.0% |
| $50,000 to $74,999 | 43 | 8.2% |
| $75,000 to $99,999 | 39 | 7.4% |
| $100,000 to $149,999 | 83 | 15.8% |
| $150,000 to $199,999 | 104 | 19.8% |
| $200,000+ | 256 | 48.8% |
Family Income by Famaliy Size in Navesink
4-person families (127 | 24.2%) account for the highest median family income in Navesink with $240,924 per family, while 2-person families (201 | 38.3%) have the highest median income of $90,954 per family member.
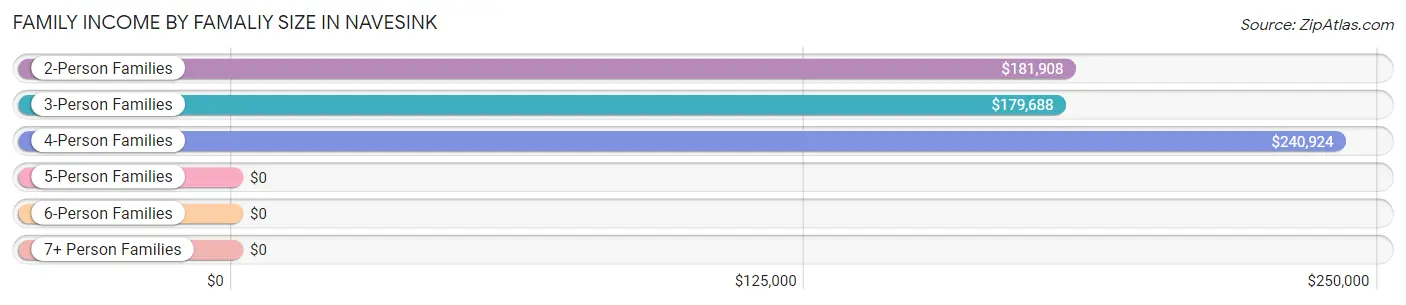
| Income Bracket | # Families | Median Income |
| 2-Person Families | 201 (38.3%) | $181,908 |
| 3-Person Families | 197 (37.5%) | $179,688 |
| 4-Person Families | 127 (24.2%) | $240,924 |
| 5-Person Families | 0 (0.0%) | $0 |
| 6-Person Families | 0 (0.0%) | $0 |
| 7+ Person Families | 0 (0.0%) | $0 |
| Total | 525 (100.0%) | $182,969 |
Family Income by Number of Earners in Navesink
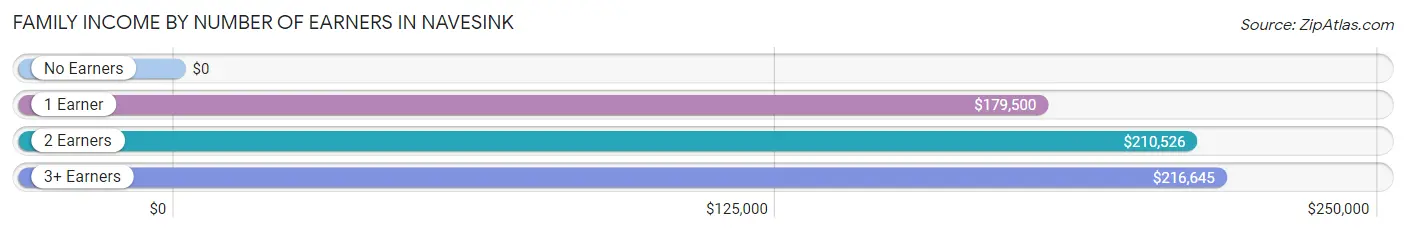
| Number of Earners | # Families | Median Income |
| No Earners | 0 (0.0%) | $0 |
| 1 Earner | 190 (36.2%) | $179,500 |
| 2 Earners | 282 (53.7%) | $210,526 |
| 3+ Earners | 53 (10.1%) | $216,645 |
| Total | 525 (100.0%) | $182,969 |
Household Income in Navesink
Household Income Brackets in Navesink
With 256 households falling in the category, the $200,000+ income range is the most frequent in Navesink, accounting for 38.0% of all households.
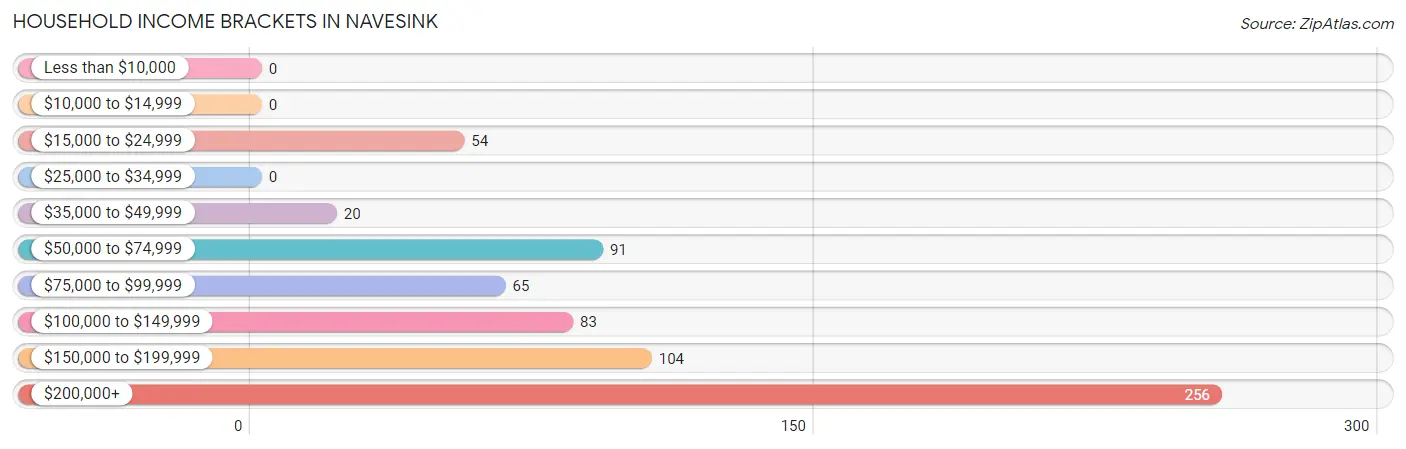
| Income Bracket | # Households | % Households |
| Less than $10,000 | 0 | 0.0% |
| $10,000 to $14,999 | 0 | 0.0% |
| $15,000 to $24,999 | 54 | 8.0% |
| $25,000 to $34,999 | 0 | 0.0% |
| $35,000 to $49,999 | 20 | 3.0% |
| $50,000 to $74,999 | 91 | 13.5% |
| $75,000 to $99,999 | 65 | 9.7% |
| $100,000 to $149,999 | 83 | 12.3% |
| $150,000 to $199,999 | 104 | 15.5% |
| $200,000+ | 256 | 38.0% |
Household Income by Householder Age in Navesink
The median household income in Navesink is $163,699, with the highest median household income of $216,776 found in the 45 to 64 years age bracket for the primary householder. A total of 385 households (57.2%) fall into this category.
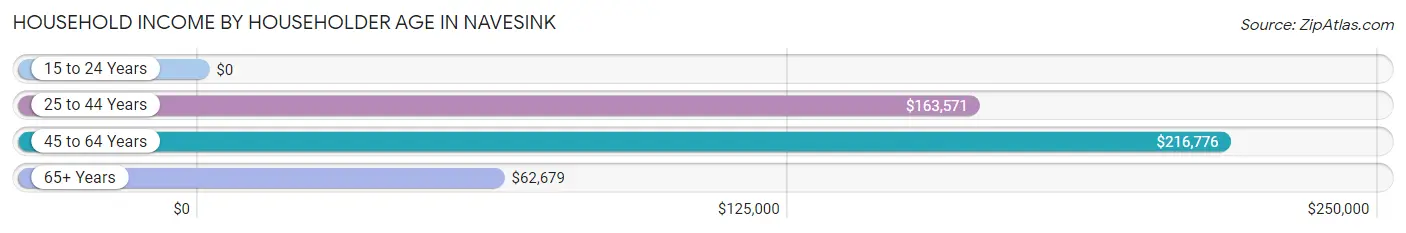
| Income Bracket | # Households | Median Income |
| 15 to 24 Years | 0 (0.0%) | $0 |
| 25 to 44 Years | 92 (13.7%) | $163,571 |
| 45 to 64 Years | 385 (57.2%) | $216,776 |
| 65+ Years | 196 (29.1%) | $62,679 |
| Total | 673 (100.0%) | $163,699 |
Poverty in Navesink
Income Below Poverty by Sex and Age in Navesink
With 3.2% poverty level for males and 2.8% for females among the residents of Navesink, 55 to 64 year old males and 25 to 34 year old females are the most vulnerable to poverty, with 26 males (22.6%) and 25 females (100.0%) in their respective age groups living below the poverty level.
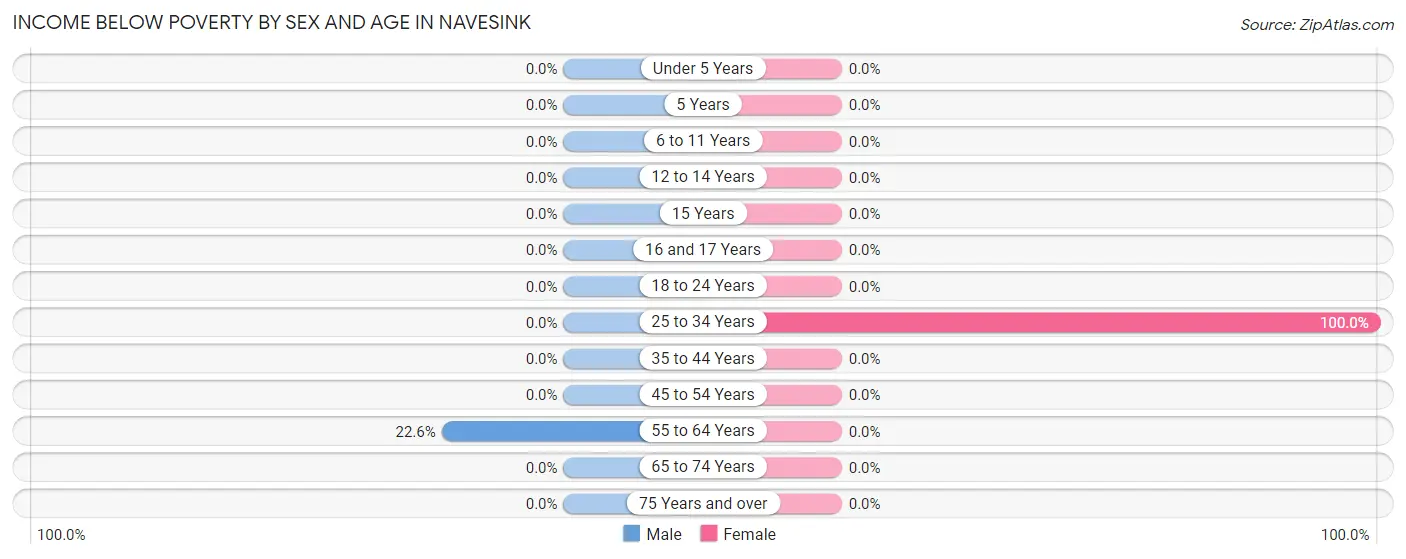
| Age Bracket | Male | Female |
| Under 5 Years | 0 (0.0%) | 0 (0.0%) |
| 5 Years | 0 (0.0%) | 0 (0.0%) |
| 6 to 11 Years | 0 (0.0%) | 0 (0.0%) |
| 12 to 14 Years | 0 (0.0%) | 0 (0.0%) |
| 15 Years | 0 (0.0%) | 0 (0.0%) |
| 16 and 17 Years | 0 (0.0%) | 0 (0.0%) |
| 18 to 24 Years | 0 (0.0%) | 0 (0.0%) |
| 25 to 34 Years | 0 (0.0%) | 25 (100.0%) |
| 35 to 44 Years | 0 (0.0%) | 0 (0.0%) |
| 45 to 54 Years | 0 (0.0%) | 0 (0.0%) |
| 55 to 64 Years | 26 (22.6%) | 0 (0.0%) |
| 65 to 74 Years | 0 (0.0%) | 0 (0.0%) |
| 75 Years and over | 0 (0.0%) | 0 (0.0%) |
| Total | 26 (3.2%) | 25 (2.8%) |
Income Above Poverty by Sex and Age in Navesink
According to the poverty statistics in Navesink, males aged 6 to 11 years and females aged under 5 years are the age groups that are most secure financially, with 100.0% of males and 100.0% of females in these age groups living above the poverty line.
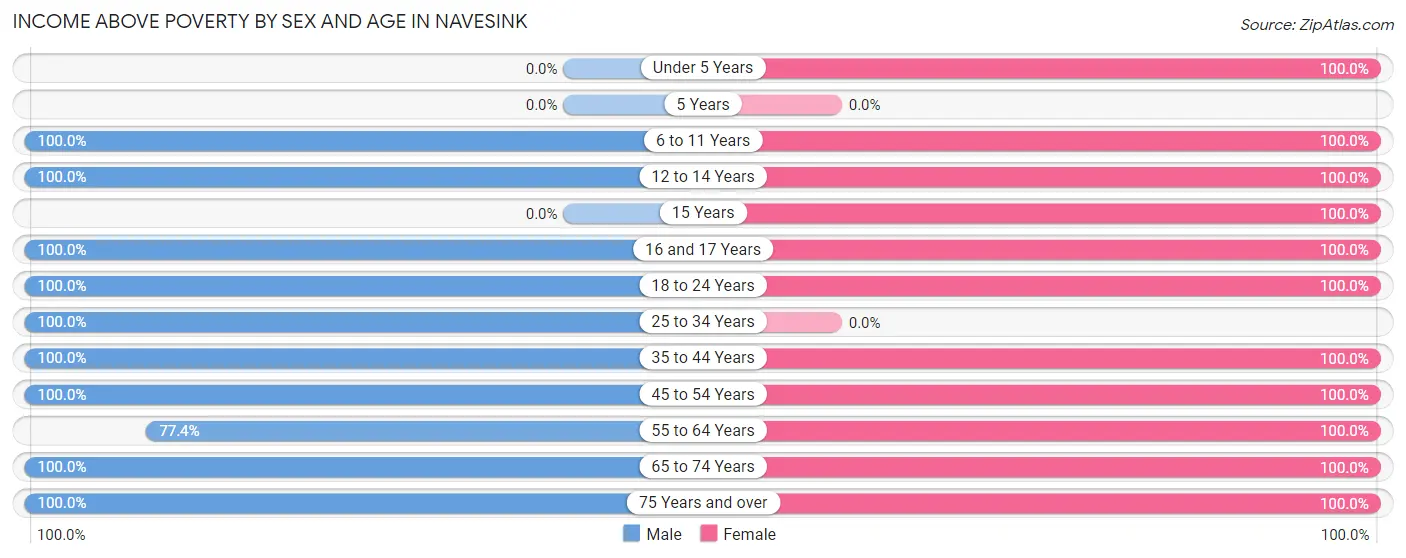
| Age Bracket | Male | Female |
| Under 5 Years | 0 (0.0%) | 8 (100.0%) |
| 5 Years | 0 (0.0%) | 0 (0.0%) |
| 6 to 11 Years | 26 (100.0%) | 24 (100.0%) |
| 12 to 14 Years | 71 (100.0%) | 119 (100.0%) |
| 15 Years | 0 (0.0%) | 65 (100.0%) |
| 16 and 17 Years | 6 (100.0%) | 28 (100.0%) |
| 18 to 24 Years | 56 (100.0%) | 60 (100.0%) |
| 25 to 34 Years | 118 (100.0%) | 0 (0.0%) |
| 35 to 44 Years | 42 (100.0%) | 77 (100.0%) |
| 45 to 54 Years | 226 (100.0%) | 235 (100.0%) |
| 55 to 64 Years | 89 (77.4%) | 122 (100.0%) |
| 65 to 74 Years | 159 (100.0%) | 116 (100.0%) |
| 75 Years and over | 7 (100.0%) | 22 (100.0%) |
| Total | 800 (96.9%) | 876 (97.2%) |
Income Below Poverty Among Married-Couple Families in Navesink
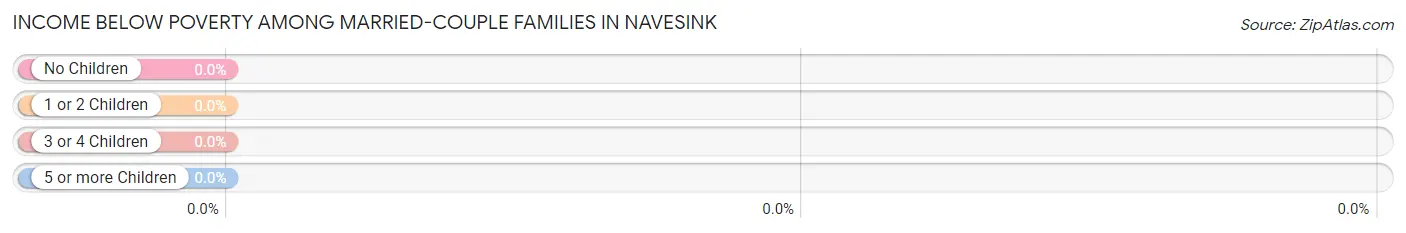
| Children | Above Poverty | Below Poverty |
| No Children | 291 (100.0%) | 0 (0.0%) |
| 1 or 2 Children | 131 (100.0%) | 0 (0.0%) |
| 3 or 4 Children | 0 (0.0%) | 0 (0.0%) |
| 5 or more Children | 0 (0.0%) | 0 (0.0%) |
| Total | 422 (100.0%) | 0 (0.0%) |
Income Below Poverty Among Single-Parent Households in Navesink
| Children | Single Father | Single Mother |
| No Children | 0 (0.0%) | 0 (0.0%) |
| 1 or 2 Children | 0 (0.0%) | 0 (0.0%) |
| 3 or 4 Children | 0 (0.0%) | 0 (0.0%) |
| 5 or more Children | 0 (0.0%) | 0 (0.0%) |
| Total | 0 (0.0%) | 0 (0.0%) |
Income Below Poverty Among Married-Couple vs Single-Parent Households in Navesink
| Children | Married-Couple Families | Single-Parent Households |
| No Children | 0 (0.0%) | 0 (0.0%) |
| 1 or 2 Children | 0 (0.0%) | 0 (0.0%) |
| 3 or 4 Children | 0 (0.0%) | 0 (0.0%) |
| 5 or more Children | 0 (0.0%) | 0 (0.0%) |
| Total | 0 (0.0%) | 0 (0.0%) |
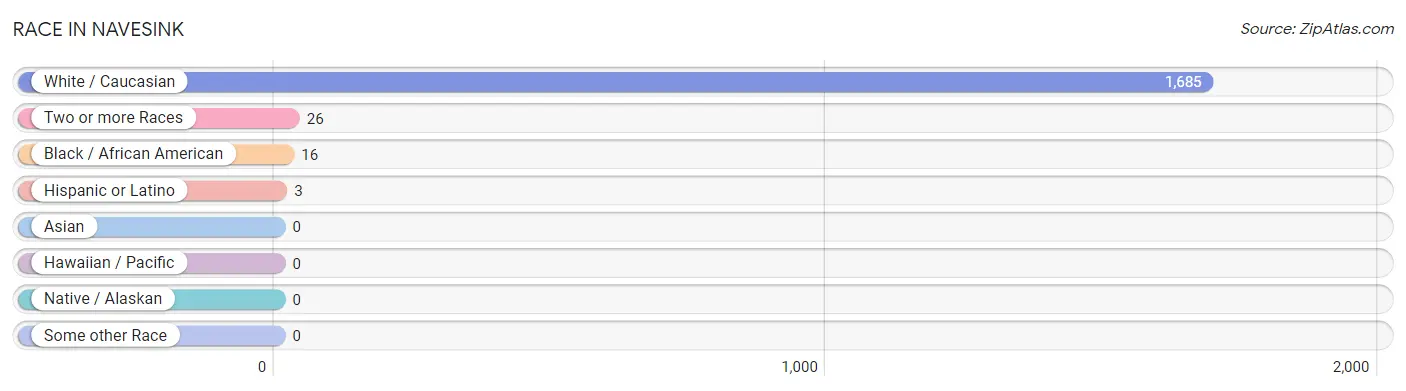
Race in Navesink
The most populous races in Navesink are White / Caucasian (1,685 | 97.6%), Two or more Races (26 | 1.5%), and Black / African American (16 | 0.9%).
| Race | # Population | % Population |
| Asian | 0 | 0.0% |
| Black / African American | 16 | 0.9% |
| Hawaiian / Pacific | 0 | 0.0% |
| Hispanic or Latino | 3 | 0.2% |
| Native / Alaskan | 0 | 0.0% |
| White / Caucasian | 1,685 | 97.6% |
| Two or more Races | 26 | 1.5% |
| Some other Race | 0 | 0.0% |
| Total | 1,727 | 100.0% |
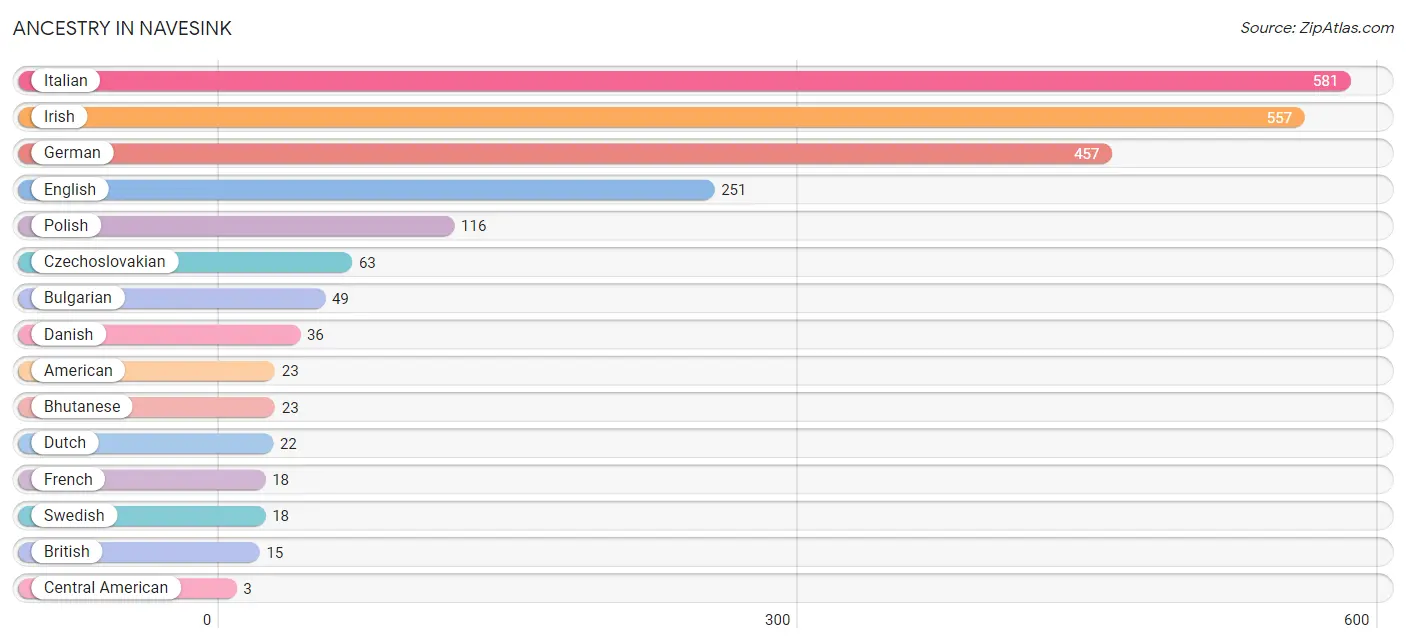
Ancestry in Navesink
The most populous ancestries reported in Navesink are Italian (581 | 33.6%), Irish (557 | 32.3%), German (457 | 26.5%), English (251 | 14.5%), and Polish (116 | 6.7%), together accounting for 113.6% of all Navesink residents.
| Ancestry | # Population | % Population |
| American | 23 | 1.3% |
| Bhutanese | 23 | 1.3% |
| British | 15 | 0.9% |
| Bulgarian | 49 | 2.8% |
| Central American | 3 | 0.2% |
| Czechoslovakian | 63 | 3.6% |
| Danish | 36 | 2.1% |
| Dutch | 22 | 1.3% |
| English | 251 | 14.5% |
| French | 18 | 1.0% |
| German | 457 | 26.5% |
| Irish | 557 | 32.3% |
| Italian | 581 | 33.6% |
| Polish | 116 | 6.7% |
| Salvadoran | 3 | 0.2% |
| Swedish | 18 | 1.0% | View All 16 Rows |
Immigrants in Navesink
The most numerous immigrant groups reported in Navesink came from Europe (114 | 6.6%), Eastern Europe (90 | 5.2%), Bulgaria (49 | 2.8%), Italy (24 | 1.4%), and Southern Europe (24 | 1.4%), together accounting for 17.4% of all Navesink residents.
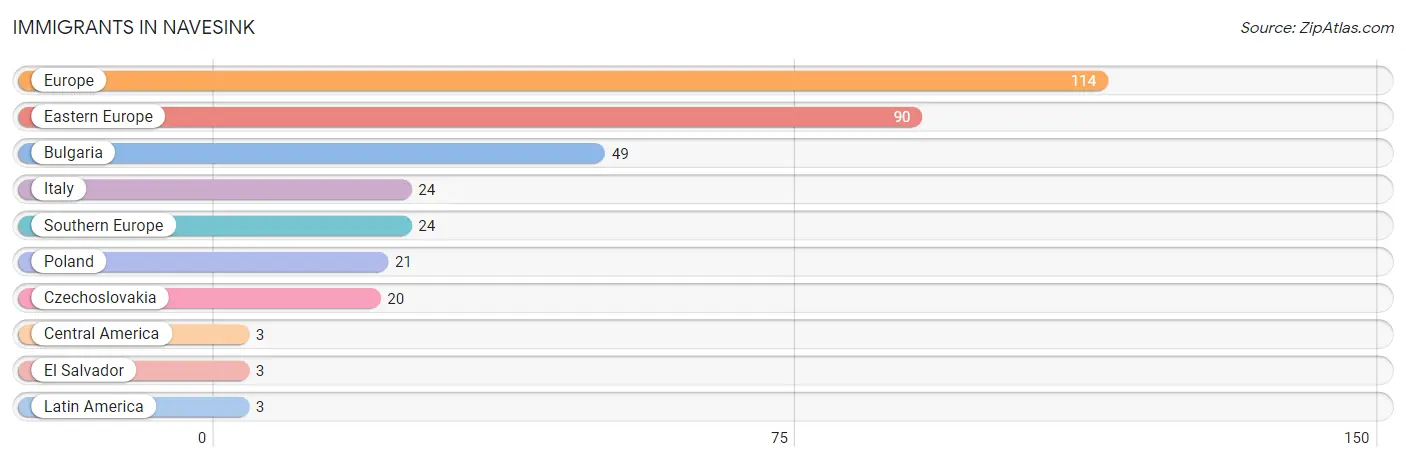
| Immigration Origin | # Population | % Population |
| Bulgaria | 49 | 2.8% |
| Central America | 3 | 0.2% |
| Czechoslovakia | 20 | 1.2% |
| Eastern Europe | 90 | 5.2% |
| El Salvador | 3 | 0.2% |
| Europe | 114 | 6.6% |
| Italy | 24 | 1.4% |
| Latin America | 3 | 0.2% |
| Poland | 21 | 1.2% |
| Southern Europe | 24 | 1.4% | View All 10 Rows |
Sex and Age in Navesink
Sex and Age in Navesink
The most populous age groups in Navesink are 50 to 54 Years (115 | 13.9%) for men and 50 to 54 Years (192 | 21.3%) for women.
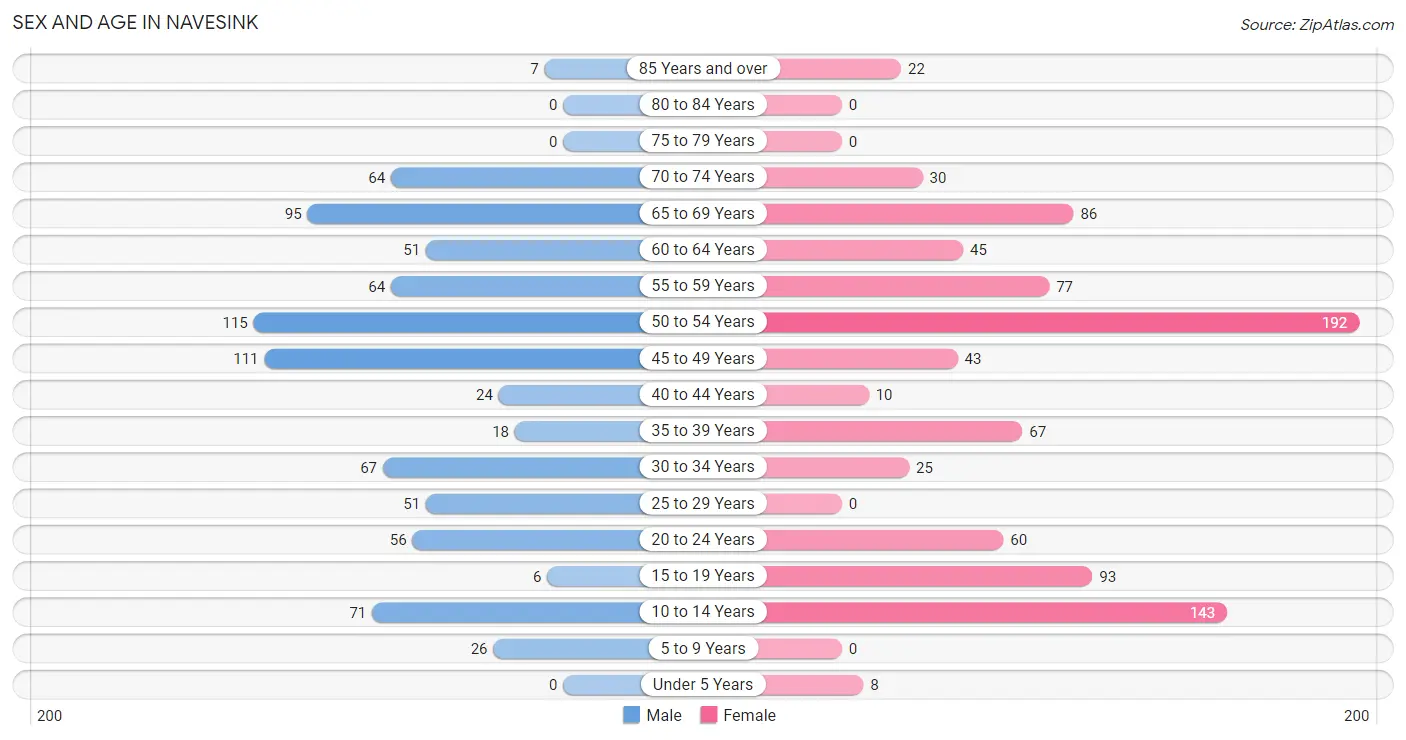
| Age Bracket | Male | Female |
| Under 5 Years | 0 (0.0%) | 8 (0.9%) |
| 5 to 9 Years | 26 (3.2%) | 0 (0.0%) |
| 10 to 14 Years | 71 (8.6%) | 143 (15.9%) |
| 15 to 19 Years | 6 (0.7%) | 93 (10.3%) |
| 20 to 24 Years | 56 (6.8%) | 60 (6.7%) |
| 25 to 29 Years | 51 (6.2%) | 0 (0.0%) |
| 30 to 34 Years | 67 (8.1%) | 25 (2.8%) |
| 35 to 39 Years | 18 (2.2%) | 67 (7.4%) |
| 40 to 44 Years | 24 (2.9%) | 10 (1.1%) |
| 45 to 49 Years | 111 (13.4%) | 43 (4.8%) |
| 50 to 54 Years | 115 (13.9%) | 192 (21.3%) |
| 55 to 59 Years | 64 (7.7%) | 77 (8.6%) |
| 60 to 64 Years | 51 (6.2%) | 45 (5.0%) |
| 65 to 69 Years | 95 (11.5%) | 86 (9.5%) |
| 70 to 74 Years | 64 (7.7%) | 30 (3.3%) |
| 75 to 79 Years | 0 (0.0%) | 0 (0.0%) |
| 80 to 84 Years | 0 (0.0%) | 0 (0.0%) |
| 85 Years and over | 7 (0.9%) | 22 (2.4%) |
| Total | 826 (100.0%) | 901 (100.0%) |
Families and Households in Navesink
Median Family Size in Navesink
The median family size in Navesink is 2.92 persons per family, with single female/mother families (63 | 12.0%) accounting for the largest median family size of 3.79 persons per family. On the other hand, single male/father families (40 | 7.6%) represent the smallest median family size with 2.68 persons per family.
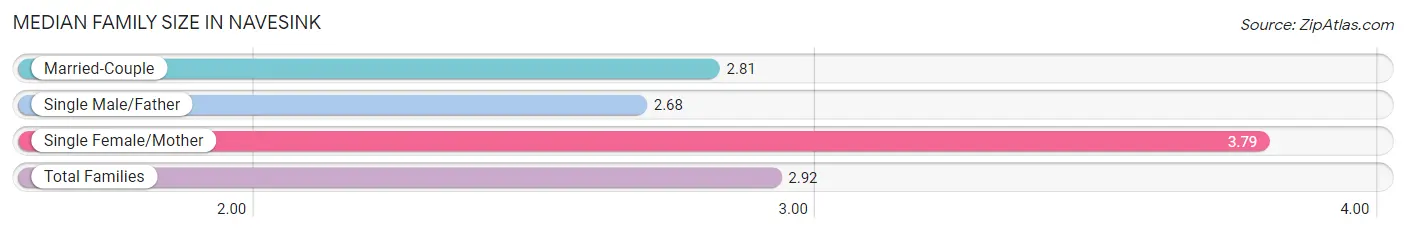
| Family Type | # Families | Family Size |
| Married-Couple | 422 (80.4%) | 2.81 |
| Single Male/Father | 40 (7.6%) | 2.68 |
| Single Female/Mother | 63 (12.0%) | 3.79 |
| Total Families | 525 (100.0%) | 2.92 |
Median Household Size in Navesink
The median household size in Navesink is 2.57 persons per household, with single female/mother households (63 | 9.4%) accounting for the largest median household size of 3.79 persons per household. non-family households (148 | 22.0%) represent the smallest median household size with 1.32 persons per household.
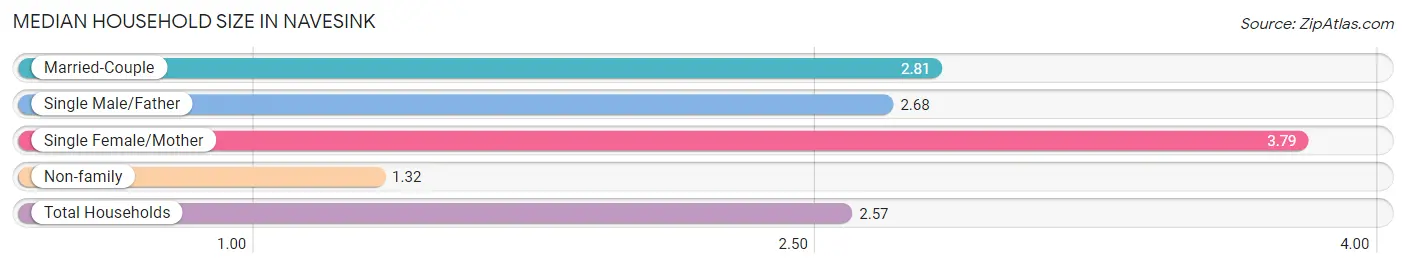
| Household Type | # Households | Household Size |
| Married-Couple | 422 (62.7%) | 2.81 |
| Single Male/Father | 40 (5.9%) | 2.68 |
| Single Female/Mother | 63 (9.4%) | 3.79 |
| Non-family | 148 (22.0%) | 1.32 |
| Total Households | 673 (100.0%) | 2.57 |
Household Size by Marriage Status in Navesink
Out of a total of 673 households in Navesink, 525 (78.0%) are family households, while 148 (22.0%) are nonfamily households. The most numerous type of family households are 2-person households, comprising 201, and the most common type of nonfamily households are 1-person households, comprising 97.
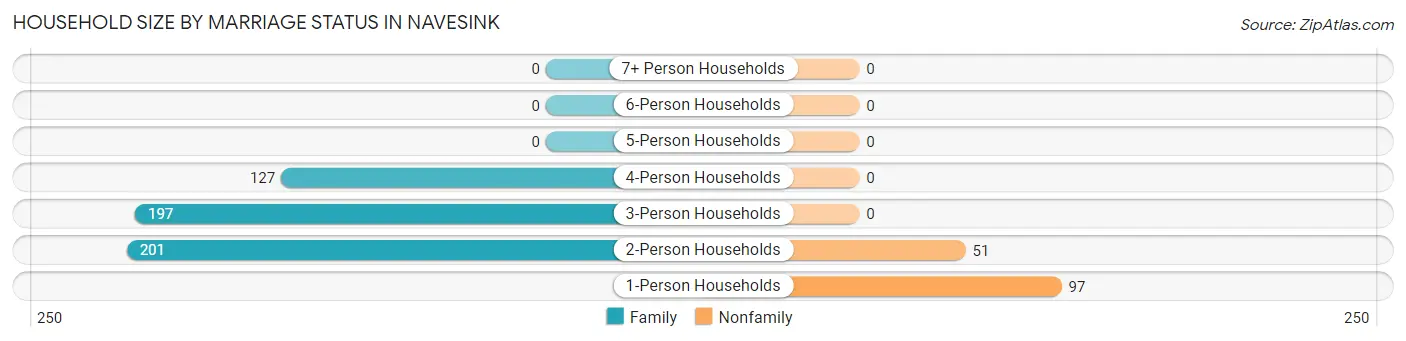
| Household Size | Family Households | Nonfamily Households |
| 1-Person Households | - | 97 (14.4%) |
| 2-Person Households | 201 (29.9%) | 51 (7.6%) |
| 3-Person Households | 197 (29.3%) | 0 (0.0%) |
| 4-Person Households | 127 (18.9%) | 0 (0.0%) |
| 5-Person Households | 0 (0.0%) | 0 (0.0%) |
| 6-Person Households | 0 (0.0%) | 0 (0.0%) |
| 7+ Person Households | 0 (0.0%) | 0 (0.0%) |
| Total | 525 (78.0%) | 148 (22.0%) |
Female Fertility in Navesink
Fertility by Age in Navesink
| Age Bracket | Women with Births | Births / 1,000 Women |
| 15 to 19 years | 0 (0.0%) | 0.0 |
| 20 to 34 years | 0 (0.0%) | 0.0 |
| 35 to 50 years | 0 (0.0%) | 0.0 |
| Total | 0 (0.0%) | 0.0 |
Fertility by Age by Marriage Status in Navesink
| Age Bracket | Married | Unmarried |
| 15 to 19 years | 0 (0.0%) | 0 (0.0%) |
| 20 to 34 years | 0 (0.0%) | 0 (0.0%) |
| 35 to 50 years | 0 (0.0%) | 0 (0.0%) |
| Total | 0 (0.0%) | 0 (0.0%) |
Fertility by Education in Navesink
| Educational Attainment | Women with Births | Births / 1,000 Women |
| Less than High School | 0 (0.0%) | 0.0 |
| High School Diploma | 0 (0.0%) | 0.0 |
| College or Associate's Degree | 0 (0.0%) | 0.0 |
| Bachelor's Degree | 0 (0.0%) | 0.0 |
| Graduate Degree | 0 (0.0%) | 0.0 |
| Total | 0 (0.0%) | 0.0 |
Fertility by Education by Marriage Status in Navesink
| Educational Attainment | Married | Unmarried |
| Less than High School | 0 (0.0%) | 0 (0.0%) |
| High School Diploma | 0 (0.0%) | 0 (0.0%) |
| College or Associate's Degree | 0 (0.0%) | 0 (0.0%) |
| Bachelor's Degree | 0 (0.0%) | 0 (0.0%) |
| Graduate Degree | 0 (0.0%) | 0 (0.0%) |
| Total | 0 (0.0%) | 0 (0.0%) |
Employment Characteristics in Navesink
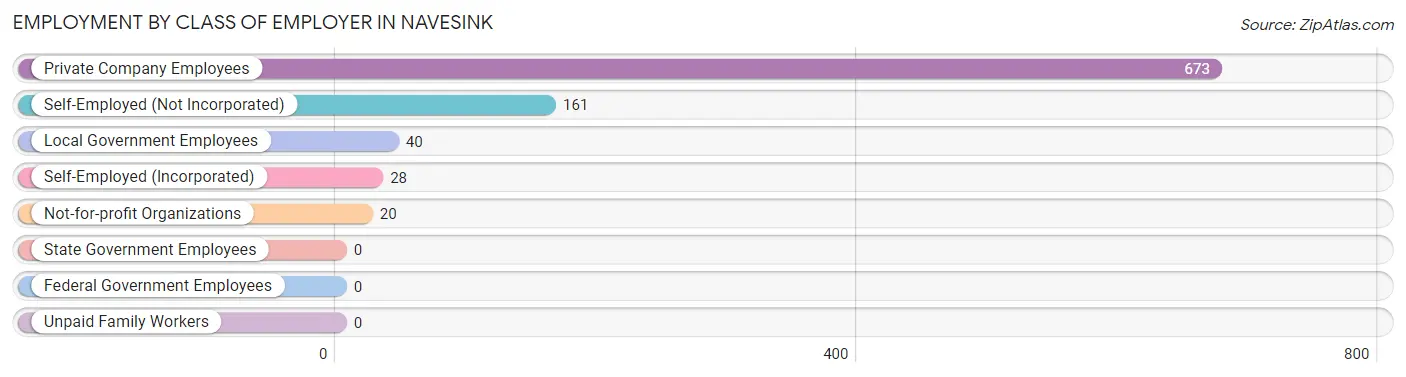
Employment by Class of Employer in Navesink
Among the 922 employed individuals in Navesink, private company employees (673 | 73.0%), self-employed (not incorporated) (161 | 17.5%), and local government employees (40 | 4.3%) make up the most common classes of employment.
| Employer Class | # Employees | % Employees |
| Private Company Employees | 673 | 73.0% |
| Self-Employed (Incorporated) | 28 | 3.0% |
| Self-Employed (Not Incorporated) | 161 | 17.5% |
| Not-for-profit Organizations | 20 | 2.2% |
| Local Government Employees | 40 | 4.3% |
| State Government Employees | 0 | 0.0% |
| Federal Government Employees | 0 | 0.0% |
| Unpaid Family Workers | 0 | 0.0% |
| Total | 922 | 100.0% |
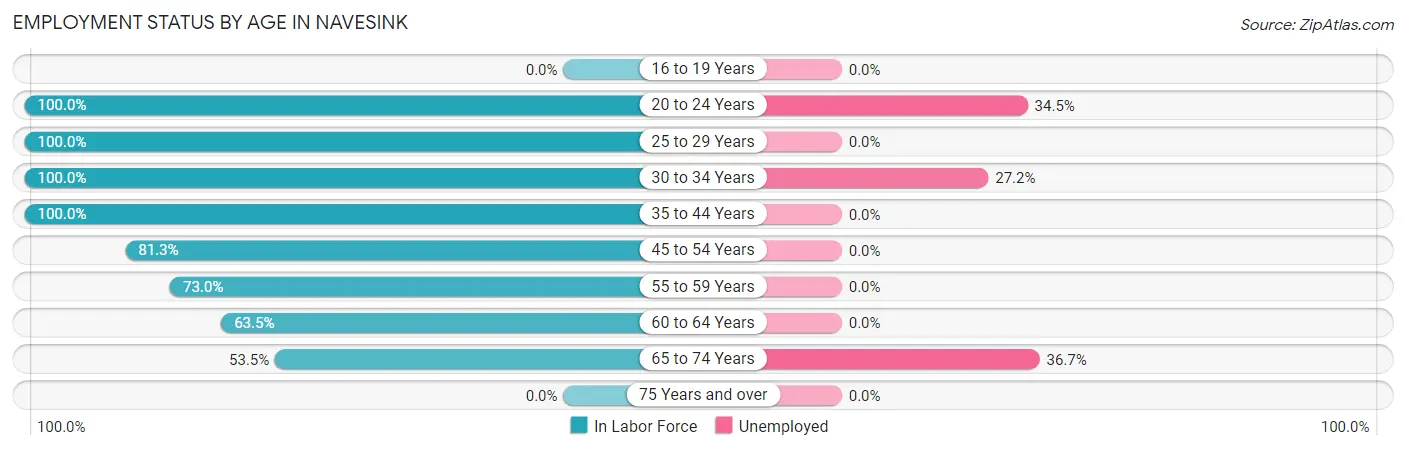
Employment Status by Age in Navesink
According to the labor force statistics for Navesink, out of the total population over 16 years of age (1,414), 75.2% or 1,063 individuals are in the labor force, with 11.2% or 119 of them unemployed. The age group with the highest labor force participation rate is 20 to 24 years, with 100.0% or 116 individuals in the labor force. Within the labor force, the 65 to 74 years age range has the highest percentage of unemployed individuals, with 36.7% or 54 of them being unemployed.
| Age Bracket | In Labor Force | Unemployed |
| 16 to 19 Years | 0 (0.0%) | 0 (0.0%) |
| 20 to 24 Years | 116 (100.0%) | 40 (34.5%) |
| 25 to 29 Years | 51 (100.0%) | 0 (0.0%) |
| 30 to 34 Years | 92 (100.0%) | 25 (27.2%) |
| 35 to 44 Years | 119 (100.0%) | 0 (0.0%) |
| 45 to 54 Years | 375 (81.3%) | 0 (0.0%) |
| 55 to 59 Years | 103 (73.0%) | 0 (0.0%) |
| 60 to 64 Years | 61 (63.5%) | 0 (0.0%) |
| 65 to 74 Years | 147 (53.5%) | 54 (36.7%) |
| 75 Years and over | 0 (0.0%) | 0 (0.0%) |
| Total | 1,063 (75.2%) | 119 (11.2%) |
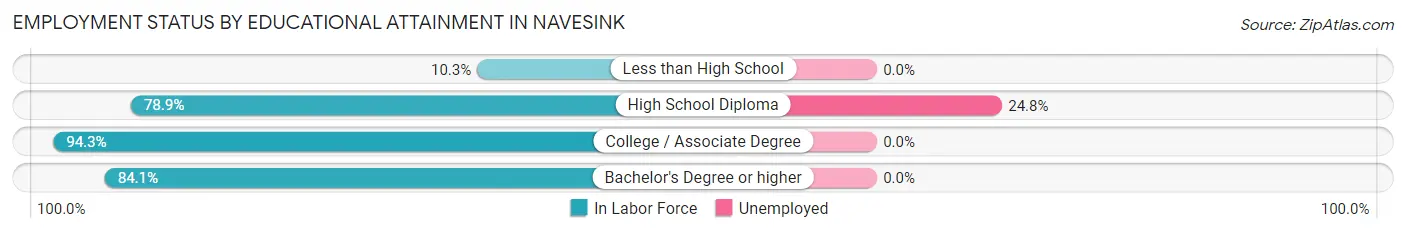
Employment Status by Educational Attainment in Navesink
According to labor force statistics for Navesink, 83.4% of individuals (801) out of the total population between 25 and 64 years of age (960) are in the labor force, with 3.1% or 25 of them being unemployed. The group with the highest labor force participation rate are those with the educational attainment of college / associate degree, with 94.3% or 198 individuals in the labor force. Within the labor force, individuals with high school diploma education have the highest percentage of unemployment, with 24.8% or 25 of them being unemployed.
| Educational Attainment | In Labor Force | Unemployed |
| Less than High School | 3 (10.3%) | 0 (0.0%) |
| High School Diploma | 101 (78.9%) | 32 (24.8%) |
| College / Associate Degree | 198 (94.3%) | 0 (0.0%) |
| Bachelor's Degree or higher | 499 (84.1%) | 0 (0.0%) |
| Total | 801 (83.4%) | 30 (3.1%) |
Employment Occupations by Sex in Navesink
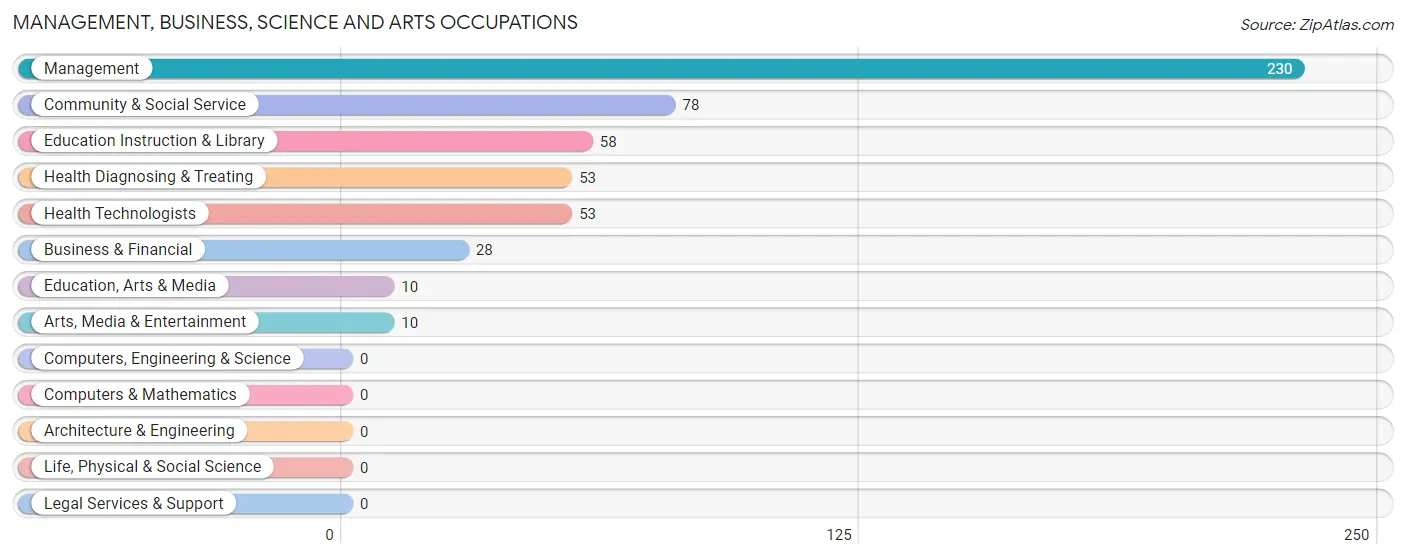
Management, Business, Science and Arts Occupations
The most common Management, Business, Science and Arts occupations in Navesink are Management (230 | 24.3%), Community & Social Service (78 | 8.3%), Education Instruction & Library (58 | 6.1%), Health Diagnosing & Treating (53 | 5.6%), and Health Technologists (53 | 5.6%).
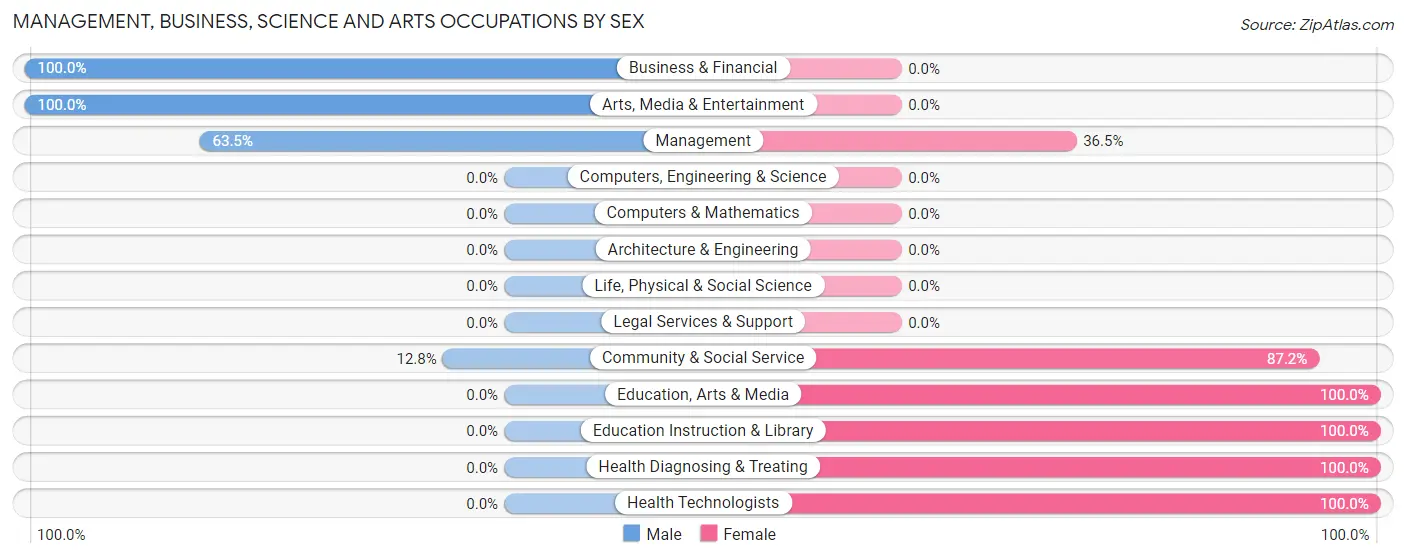
Management, Business, Science and Arts Occupations by Sex
Within the Management, Business, Science and Arts occupations in Navesink, the most male-oriented occupations are Business & Financial (100.0%), Arts, Media & Entertainment (100.0%), and Management (63.5%), while the most female-oriented occupations are Education, Arts & Media (100.0%), Education Instruction & Library (100.0%), and Health Diagnosing & Treating (100.0%).
| Occupation | Male | Female |
| Management | 146 (63.5%) | 84 (36.5%) |
| Business & Financial | 28 (100.0%) | 0 (0.0%) |
| Computers, Engineering & Science | 0 (0.0%) | 0 (0.0%) |
| Computers & Mathematics | 0 (0.0%) | 0 (0.0%) |
| Architecture & Engineering | 0 (0.0%) | 0 (0.0%) |
| Life, Physical & Social Science | 0 (0.0%) | 0 (0.0%) |
| Community & Social Service | 10 (12.8%) | 68 (87.2%) |
| Education, Arts & Media | 0 (0.0%) | 10 (100.0%) |
| Legal Services & Support | 0 (0.0%) | 0 (0.0%) |
| Education Instruction & Library | 0 (0.0%) | 58 (100.0%) |
| Arts, Media & Entertainment | 10 (100.0%) | 0 (0.0%) |
| Health Diagnosing & Treating | 0 (0.0%) | 53 (100.0%) |
| Health Technologists | 0 (0.0%) | 53 (100.0%) |
| Total (Category) | 184 (47.3%) | 205 (52.7%) |
| Total (Overall) | 545 (57.7%) | 400 (42.3%) |
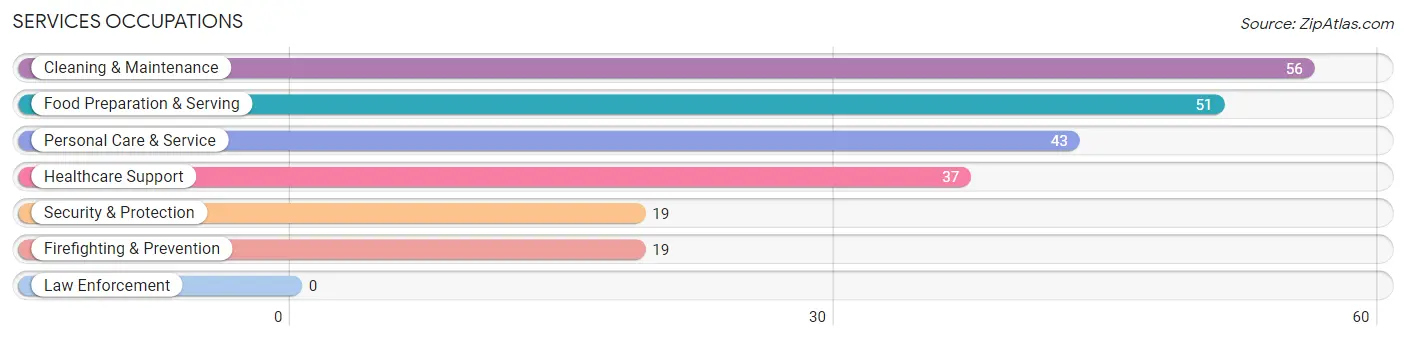
Services Occupations
The most common Services occupations in Navesink are Cleaning & Maintenance (56 | 5.9%), Food Preparation & Serving (51 | 5.4%), Personal Care & Service (43 | 4.5%), Healthcare Support (37 | 3.9%), and Security & Protection (19 | 2.0%).
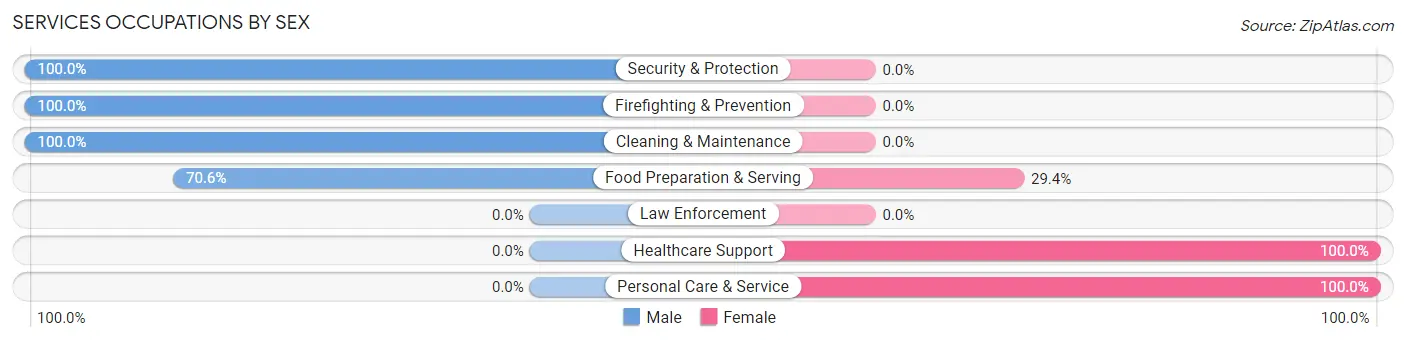
Services Occupations by Sex
Within the Services occupations in Navesink, the most male-oriented occupations are Security & Protection (100.0%), Firefighting & Prevention (100.0%), and Cleaning & Maintenance (100.0%), while the most female-oriented occupations are Healthcare Support (100.0%), Personal Care & Service (100.0%), and Food Preparation & Serving (29.4%).
| Occupation | Male | Female |
| Healthcare Support | 0 (0.0%) | 37 (100.0%) |
| Security & Protection | 19 (100.0%) | 0 (0.0%) |
| Firefighting & Prevention | 19 (100.0%) | 0 (0.0%) |
| Law Enforcement | 0 (0.0%) | 0 (0.0%) |
| Food Preparation & Serving | 36 (70.6%) | 15 (29.4%) |
| Cleaning & Maintenance | 56 (100.0%) | 0 (0.0%) |
| Personal Care & Service | 0 (0.0%) | 43 (100.0%) |
| Total (Category) | 111 (53.9%) | 95 (46.1%) |
| Total (Overall) | 545 (57.7%) | 400 (42.3%) |
Sales and Office Occupations
The most common Sales and Office occupations in Navesink are Sales & Related (146 | 15.4%), and Office & Administration (62 | 6.6%).
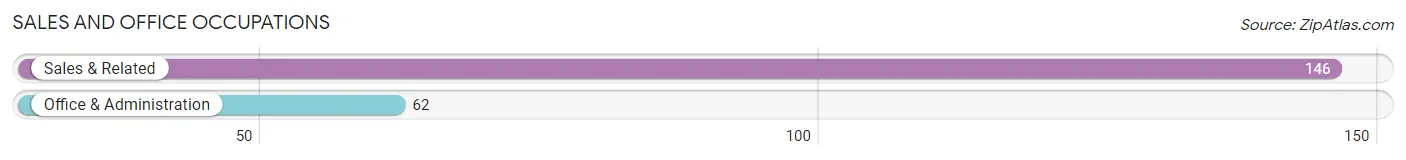
Sales and Office Occupations by Sex
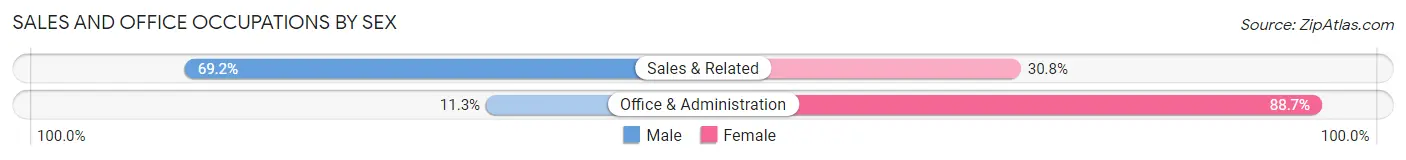
| Occupation | Male | Female |
| Sales & Related | 101 (69.2%) | 45 (30.8%) |
| Office & Administration | 7 (11.3%) | 55 (88.7%) |
| Total (Category) | 108 (51.9%) | 100 (48.1%) |
| Total (Overall) | 545 (57.7%) | 400 (42.3%) |
Natural Resources, Construction and Maintenance Occupations
The most common Natural Resources, Construction and Maintenance occupations in Navesink are Construction & Extraction (50 | 5.3%), and Installation, Maintenance & Repair (25 | 2.6%).
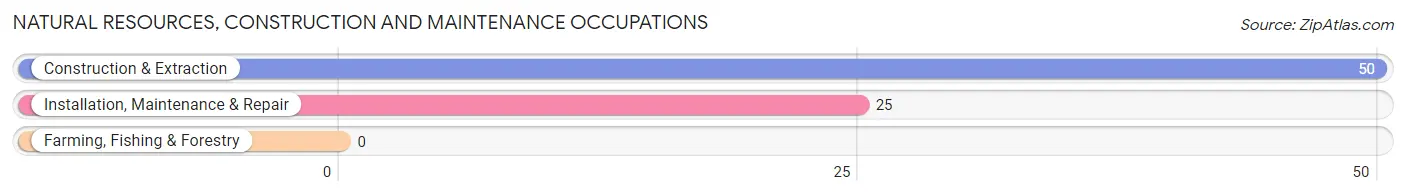
Natural Resources, Construction and Maintenance Occupations by Sex
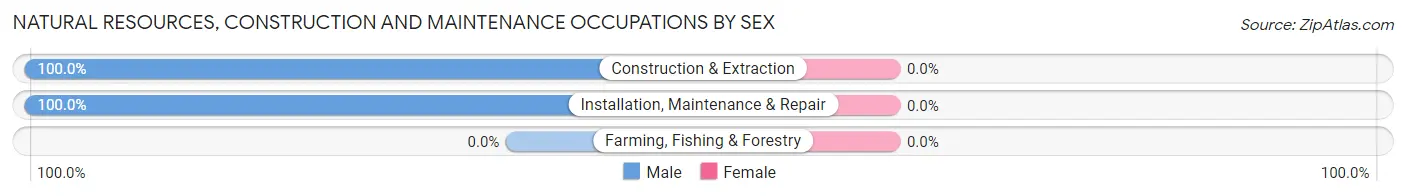
| Occupation | Male | Female |
| Farming, Fishing & Forestry | 0 (0.0%) | 0 (0.0%) |
| Construction & Extraction | 50 (100.0%) | 0 (0.0%) |
| Installation, Maintenance & Repair | 25 (100.0%) | 0 (0.0%) |
| Total (Category) | 75 (100.0%) | 0 (0.0%) |
| Total (Overall) | 545 (57.7%) | 400 (42.3%) |
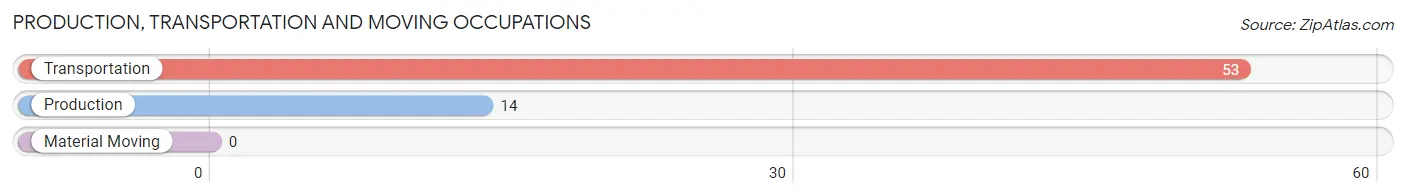
Production, Transportation and Moving Occupations
The most common Production, Transportation and Moving occupations in Navesink are Transportation (53 | 5.6%), and Production (14 | 1.5%).
Production, Transportation and Moving Occupations by Sex
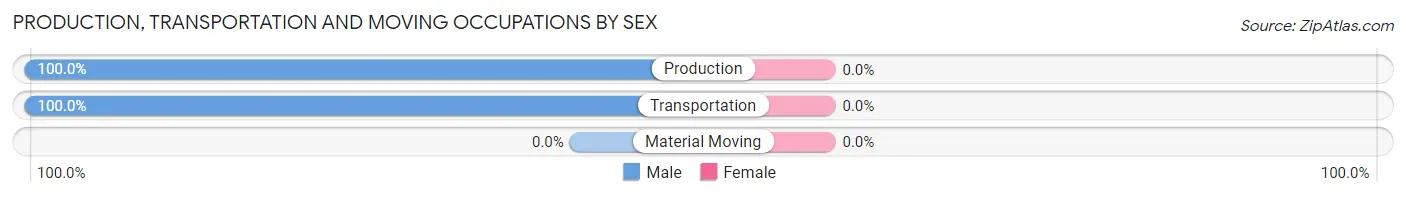
| Occupation | Male | Female |
| Production | 14 (100.0%) | 0 (0.0%) |
| Transportation | 53 (100.0%) | 0 (0.0%) |
| Material Moving | 0 (0.0%) | 0 (0.0%) |
| Total (Category) | 67 (100.0%) | 0 (0.0%) |
| Total (Overall) | 545 (57.7%) | 400 (42.3%) |
Employment Industries by Sex in Navesink
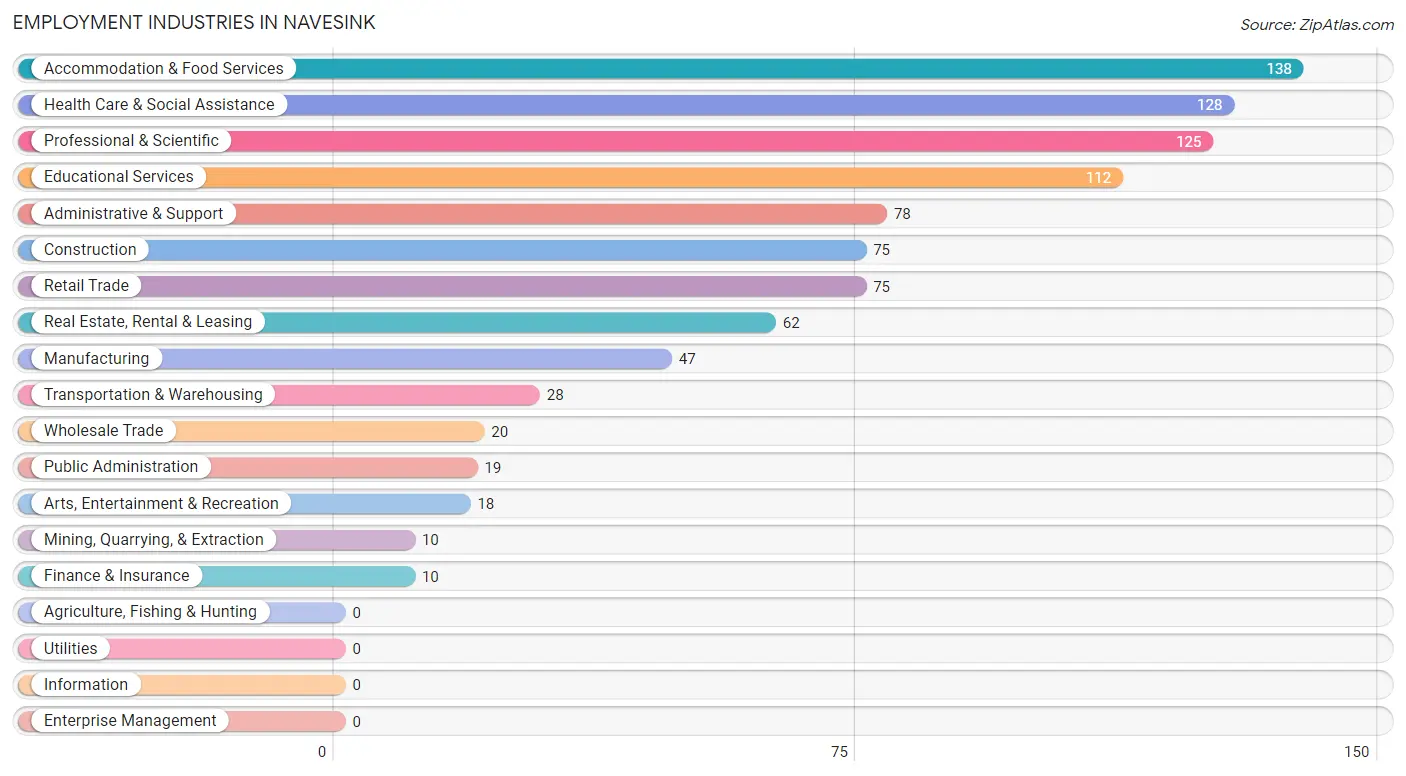
Employment Industries in Navesink
The major employment industries in Navesink include Accommodation & Food Services (138 | 14.6%), Health Care & Social Assistance (128 | 13.5%), Professional & Scientific (125 | 13.2%), Educational Services (112 | 11.8%), and Administrative & Support (78 | 8.3%).
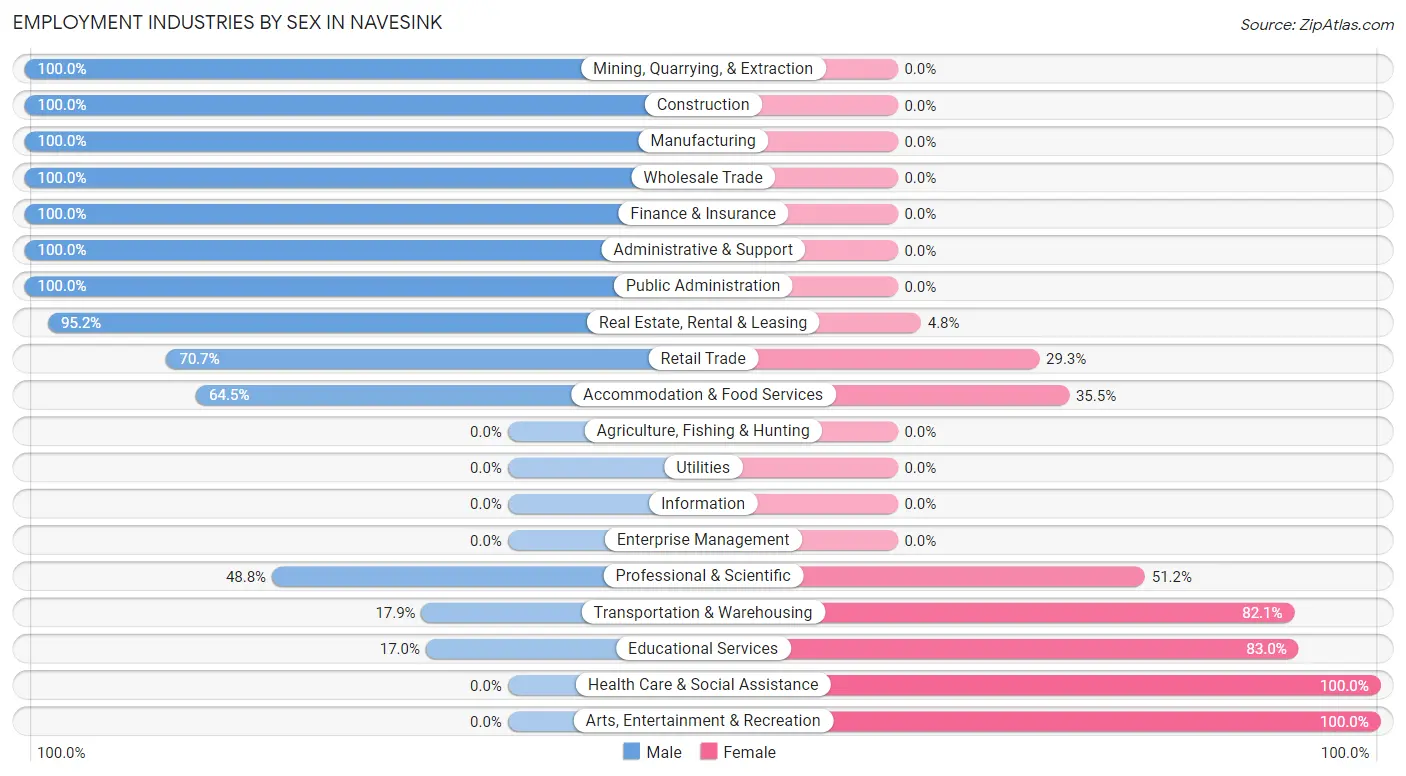
Employment Industries by Sex in Navesink
The Navesink industries that see more men than women are Mining, Quarrying, & Extraction (100.0%), Construction (100.0%), and Manufacturing (100.0%), whereas the industries that tend to have a higher number of women are Health Care & Social Assistance (100.0%), Arts, Entertainment & Recreation (100.0%), and Educational Services (83.0%).
| Industry | Male | Female |
| Agriculture, Fishing & Hunting | 0 (0.0%) | 0 (0.0%) |
| Mining, Quarrying, & Extraction | 10 (100.0%) | 0 (0.0%) |
| Construction | 75 (100.0%) | 0 (0.0%) |
| Manufacturing | 47 (100.0%) | 0 (0.0%) |
| Wholesale Trade | 20 (100.0%) | 0 (0.0%) |
| Retail Trade | 53 (70.7%) | 22 (29.3%) |
| Transportation & Warehousing | 5 (17.9%) | 23 (82.1%) |
| Utilities | 0 (0.0%) | 0 (0.0%) |
| Information | 0 (0.0%) | 0 (0.0%) |
| Finance & Insurance | 10 (100.0%) | 0 (0.0%) |
| Real Estate, Rental & Leasing | 59 (95.2%) | 3 (4.8%) |
| Professional & Scientific | 61 (48.8%) | 64 (51.2%) |
| Enterprise Management | 0 (0.0%) | 0 (0.0%) |
| Administrative & Support | 78 (100.0%) | 0 (0.0%) |
| Educational Services | 19 (17.0%) | 93 (83.0%) |
| Health Care & Social Assistance | 0 (0.0%) | 128 (100.0%) |
| Arts, Entertainment & Recreation | 0 (0.0%) | 18 (100.0%) |
| Accommodation & Food Services | 89 (64.5%) | 49 (35.5%) |
| Public Administration | 19 (100.0%) | 0 (0.0%) |
| Total | 545 (57.7%) | 400 (42.3%) |
Education in Navesink
School Enrollment in Navesink
The most common levels of schooling among the 467 students in Navesink are middle school (166 | 35.5%), high school (126 | 27.0%), and college / undergraduate (88 | 18.8%).
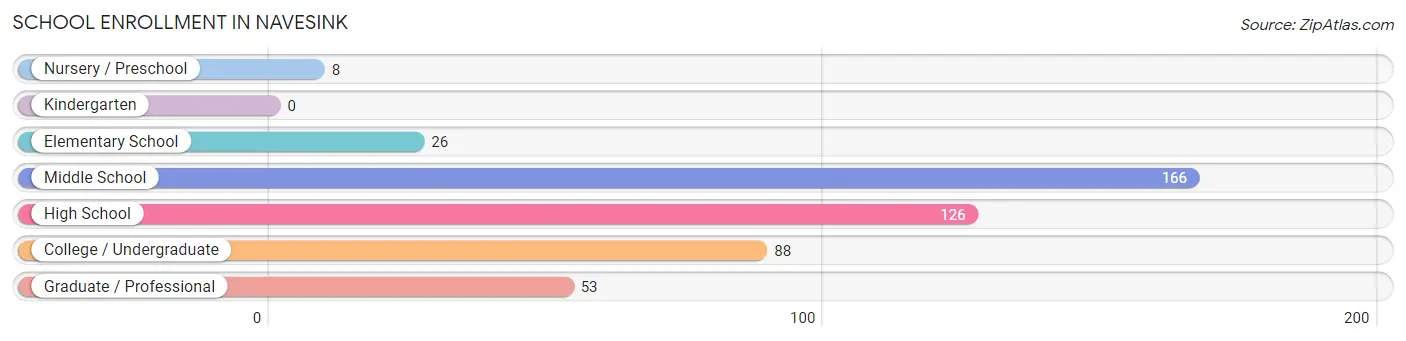
| School Level | # Students | % Students |
| Nursery / Preschool | 8 | 1.7% |
| Kindergarten | 0 | 0.0% |
| Elementary School | 26 | 5.6% |
| Middle School | 166 | 35.5% |
| High School | 126 | 27.0% |
| College / Undergraduate | 88 | 18.8% |
| Graduate / Professional | 53 | 11.4% |
| Total | 467 | 100.0% |
School Enrollment by Age by Funding Source in Navesink
Out of a total of 467 students who are enrolled in schools in Navesink, 129 (27.6%) attend a private institution, while the remaining 338 (72.4%) are enrolled in public schools. The age group of 3 to 4 year olds has the highest likelihood of being enrolled in private schools, with 8 (100.0% in the age bracket) enrolled. Conversely, the age group of 5 to 9 year old has the lowest likelihood of being enrolled in a private school, with 26 (100.0% in the age bracket) attending a public institution.
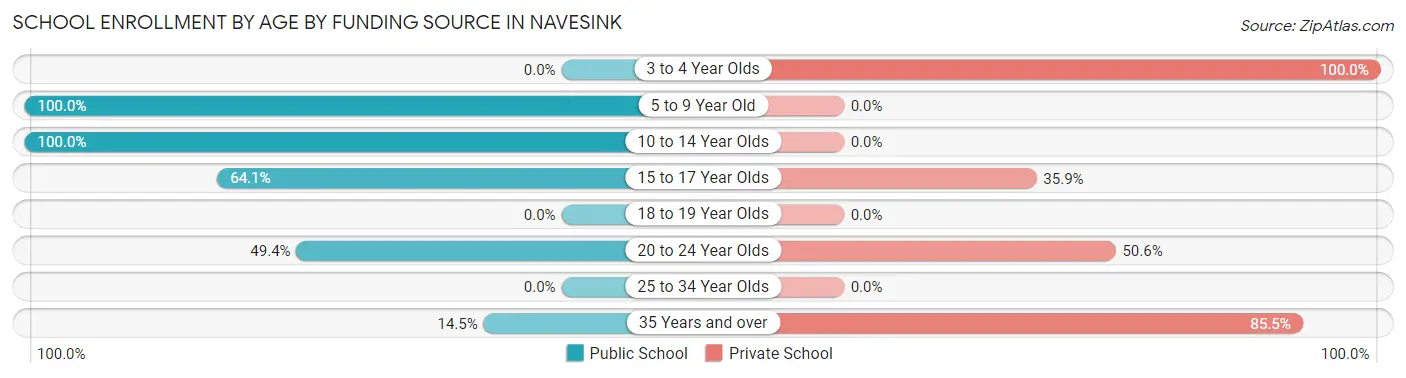
| Age Bracket | Public School | Private School |
| 3 to 4 Year Olds | 0 (0.0%) | 8 (100.0%) |
| 5 to 9 Year Old | 26 (100.0%) | 0 (0.0%) |
| 10 to 14 Year Olds | 214 (100.0%) | 0 (0.0%) |
| 15 to 17 Year Olds | 50 (64.1%) | 28 (35.9%) |
| 18 to 19 Year Olds | 0 (0.0%) | 0 (0.0%) |
| 20 to 24 Year Olds | 39 (49.4%) | 40 (50.6%) |
| 25 to 34 Year Olds | 0 (0.0%) | 0 (0.0%) |
| 35 Years and over | 9 (14.5%) | 53 (85.5%) |
| Total | 338 (72.4%) | 129 (27.6%) |
Educational Attainment by Field of Study in Navesink
Business (217 | 26.5%), science & technology (116 | 14.2%), arts & humanities (116 | 14.2%), education (114 | 13.9%), and social sciences (77 | 9.4%) are the most common fields of study among 819 individuals in Navesink who have obtained a bachelor's degree or higher.
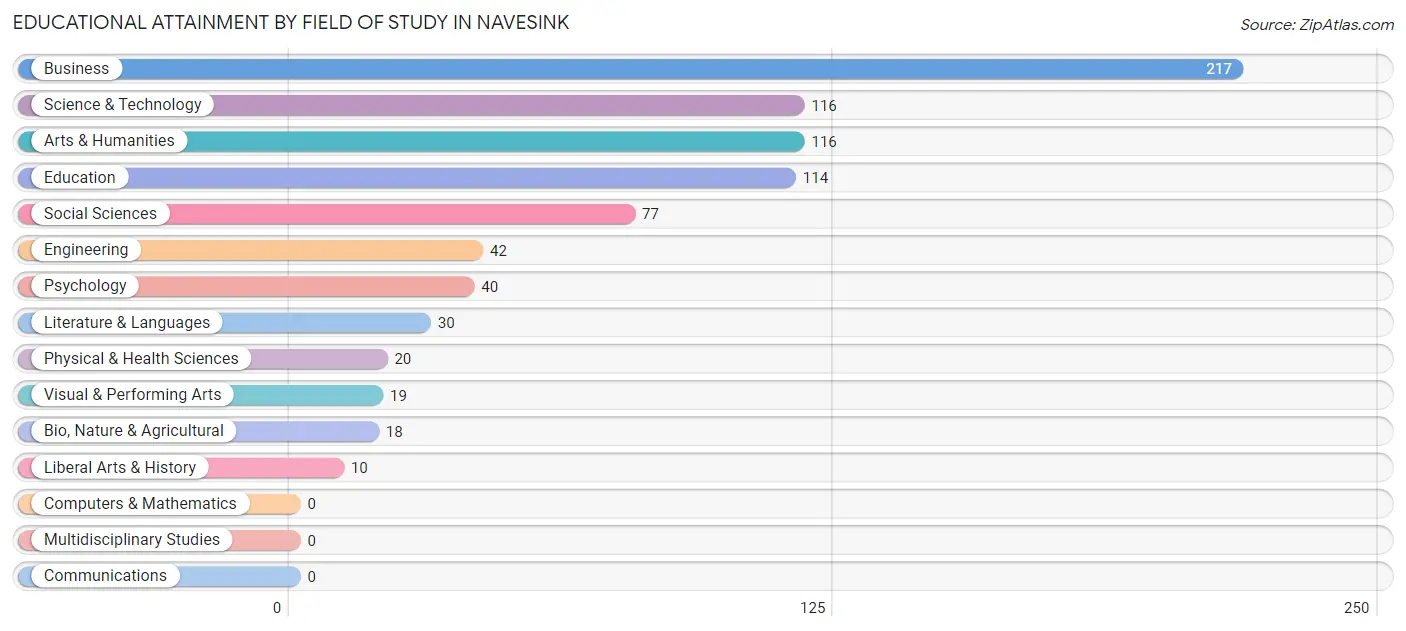
| Field of Study | # Graduates | % Graduates |
| Computers & Mathematics | 0 | 0.0% |
| Bio, Nature & Agricultural | 18 | 2.2% |
| Physical & Health Sciences | 20 | 2.4% |
| Psychology | 40 | 4.9% |
| Social Sciences | 77 | 9.4% |
| Engineering | 42 | 5.1% |
| Multidisciplinary Studies | 0 | 0.0% |
| Science & Technology | 116 | 14.2% |
| Business | 217 | 26.5% |
| Education | 114 | 13.9% |
| Literature & Languages | 30 | 3.7% |
| Liberal Arts & History | 10 | 1.2% |
| Visual & Performing Arts | 19 | 2.3% |
| Communications | 0 | 0.0% |
| Arts & Humanities | 116 | 14.2% |
| Total | 819 | 100.0% |
Transportation & Commute in Navesink
Vehicle Availability by Sex in Navesink
The most prevalent vehicle ownership categories in Navesink are males with 3 vehicles (266, accounting for 48.8%) and females with 3 vehicles (140, making up 70.6%).
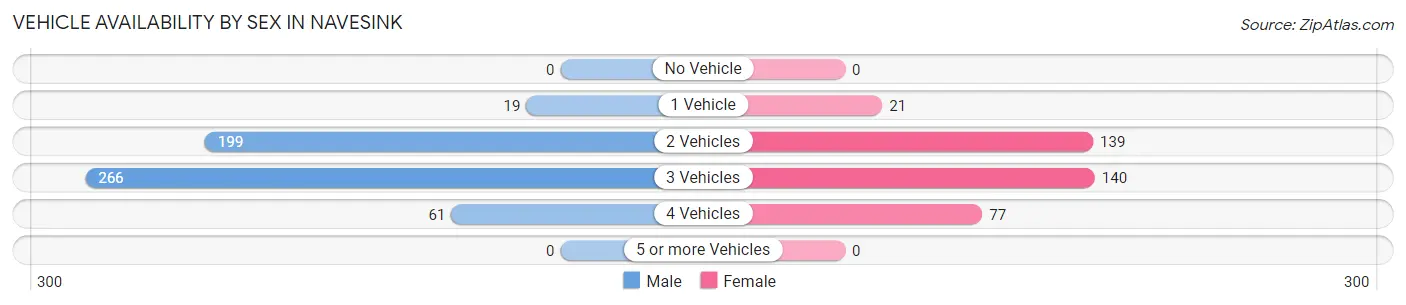
| Vehicles Available | Male | Female |
| No Vehicle | 0 (0.0%) | 0 (0.0%) |
| 1 Vehicle | 19 (3.5%) | 21 (5.6%) |
| 2 Vehicles | 199 (36.5%) | 139 (36.9%) |
| 3 Vehicles | 266 (48.8%) | 140 (37.1%) |
| 4 Vehicles | 61 (11.2%) | 77 (20.4%) |
| 5 or more Vehicles | 0 (0.0%) | 0 (0.0%) |
| Total | 545 (100.0%) | 377 (100.0%) |
Commute Time in Navesink
The most frequently occuring commute durations in Navesink are 60 to 89 minutes (139 commuters, 16.5%), 30 to 34 minutes (112 commuters, 13.3%), and 10 to 14 minutes (111 commuters, 13.2%).
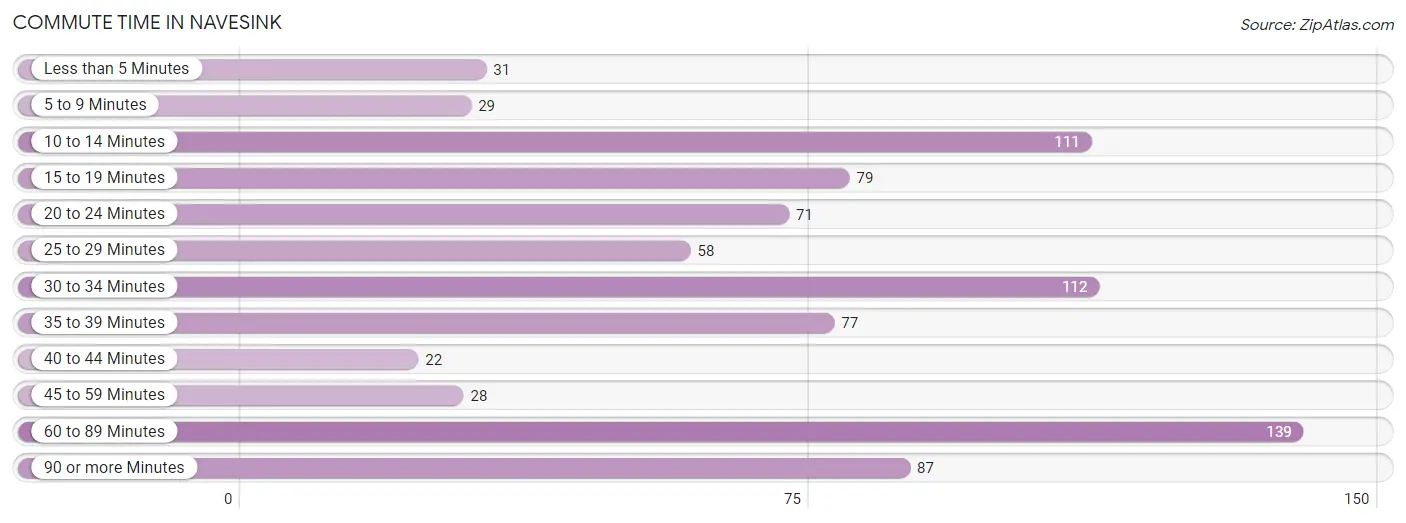
| Commute Time | # Commuters | % Commuters |
| Less than 5 Minutes | 31 | 3.7% |
| 5 to 9 Minutes | 29 | 3.4% |
| 10 to 14 Minutes | 111 | 13.2% |
| 15 to 19 Minutes | 79 | 9.4% |
| 20 to 24 Minutes | 71 | 8.4% |
| 25 to 29 Minutes | 58 | 6.9% |
| 30 to 34 Minutes | 112 | 13.3% |
| 35 to 39 Minutes | 77 | 9.1% |
| 40 to 44 Minutes | 22 | 2.6% |
| 45 to 59 Minutes | 28 | 3.3% |
| 60 to 89 Minutes | 139 | 16.5% |
| 90 or more Minutes | 87 | 10.3% |
Commute Time by Sex in Navesink
The most common commute times in Navesink are 60 to 89 minutes (139 commuters, 28.0%) for males and 10 to 14 minutes (111 commuters, 32.0%) for females.
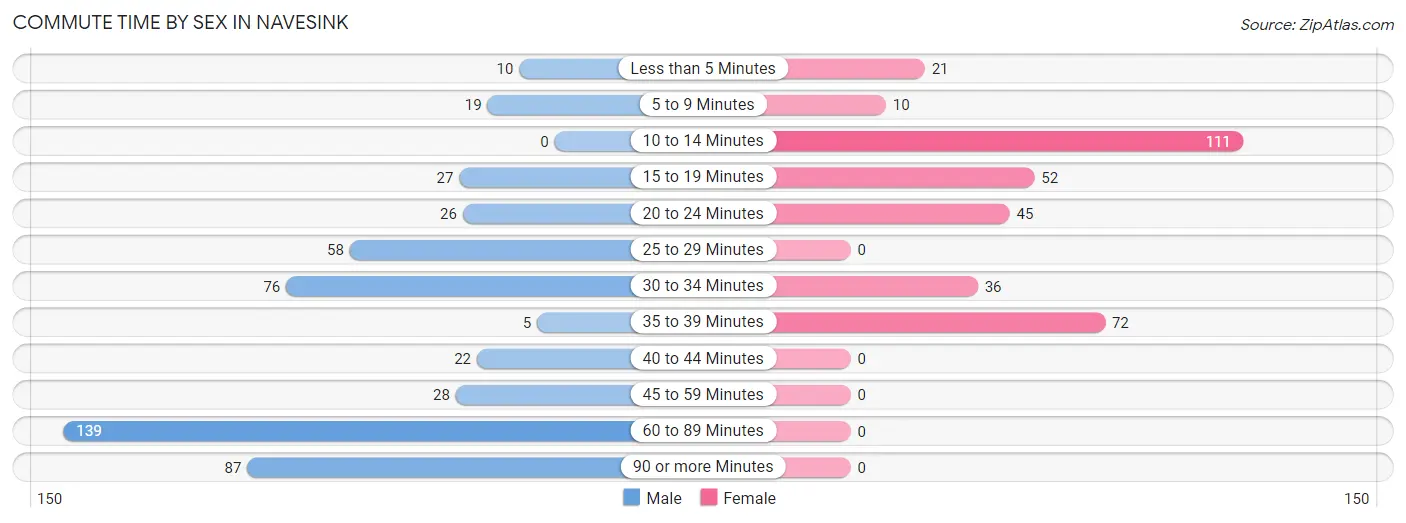
| Commute Time | Male | Female |
| Less than 5 Minutes | 10 (2.0%) | 21 (6.0%) |
| 5 to 9 Minutes | 19 (3.8%) | 10 (2.9%) |
| 10 to 14 Minutes | 0 (0.0%) | 111 (32.0%) |
| 15 to 19 Minutes | 27 (5.4%) | 52 (15.0%) |
| 20 to 24 Minutes | 26 (5.2%) | 45 (13.0%) |
| 25 to 29 Minutes | 58 (11.7%) | 0 (0.0%) |
| 30 to 34 Minutes | 76 (15.3%) | 36 (10.4%) |
| 35 to 39 Minutes | 5 (1.0%) | 72 (20.7%) |
| 40 to 44 Minutes | 22 (4.4%) | 0 (0.0%) |
| 45 to 59 Minutes | 28 (5.6%) | 0 (0.0%) |
| 60 to 89 Minutes | 139 (28.0%) | 0 (0.0%) |
| 90 or more Minutes | 87 (17.5%) | 0 (0.0%) |
Time of Departure to Work by Sex in Navesink
The most frequent times of departure to work in Navesink are 6:30 AM to 6:59 AM (163, 32.8%) for males and 7:30 AM to 7:59 AM (116, 33.4%) for females.
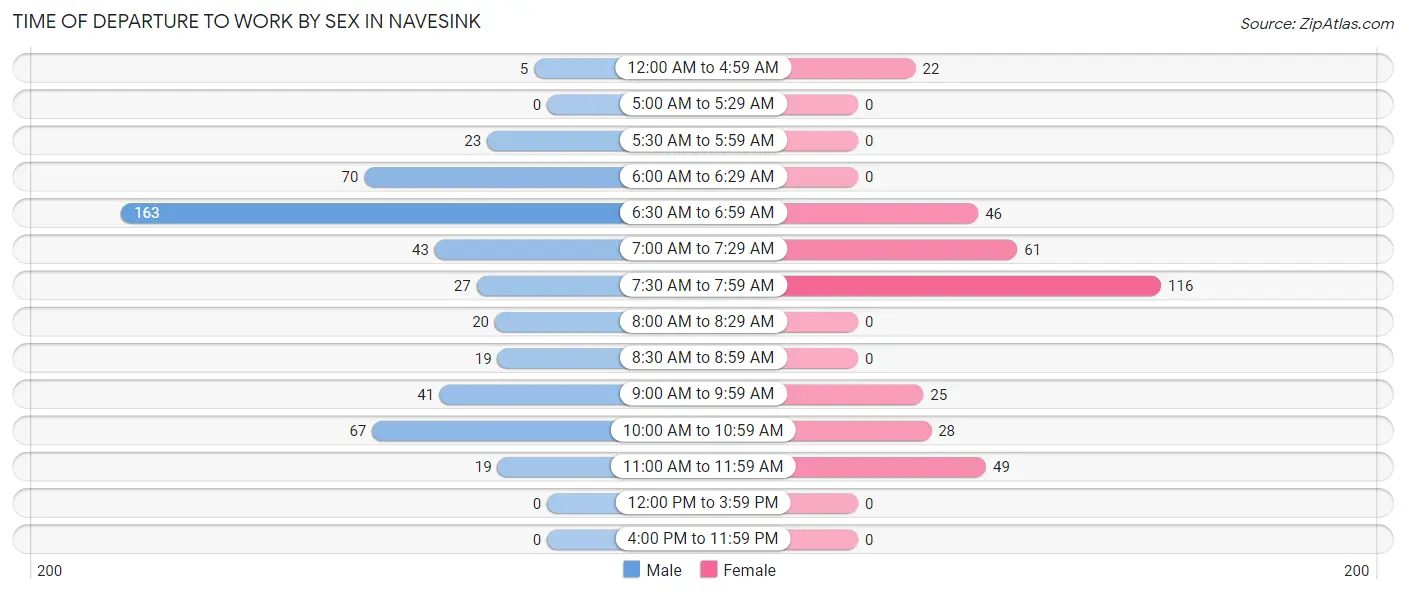
| Time of Departure | Male | Female |
| 12:00 AM to 4:59 AM | 5 (1.0%) | 22 (6.3%) |
| 5:00 AM to 5:29 AM | 0 (0.0%) | 0 (0.0%) |
| 5:30 AM to 5:59 AM | 23 (4.6%) | 0 (0.0%) |
| 6:00 AM to 6:29 AM | 70 (14.1%) | 0 (0.0%) |
| 6:30 AM to 6:59 AM | 163 (32.8%) | 46 (13.3%) |
| 7:00 AM to 7:29 AM | 43 (8.6%) | 61 (17.6%) |
| 7:30 AM to 7:59 AM | 27 (5.4%) | 116 (33.4%) |
| 8:00 AM to 8:29 AM | 20 (4.0%) | 0 (0.0%) |
| 8:30 AM to 8:59 AM | 19 (3.8%) | 0 (0.0%) |
| 9:00 AM to 9:59 AM | 41 (8.3%) | 25 (7.2%) |
| 10:00 AM to 10:59 AM | 67 (13.5%) | 28 (8.1%) |
| 11:00 AM to 11:59 AM | 19 (3.8%) | 49 (14.1%) |
| 12:00 PM to 3:59 PM | 0 (0.0%) | 0 (0.0%) |
| 4:00 PM to 11:59 PM | 0 (0.0%) | 0 (0.0%) |
| Total | 497 (100.0%) | 347 (100.0%) |
Housing Occupancy in Navesink
Occupancy by Ownership in Navesink
Of the total 673 dwellings in Navesink, owner-occupied units account for 648 (96.3%), while renter-occupied units make up 25 (3.7%).
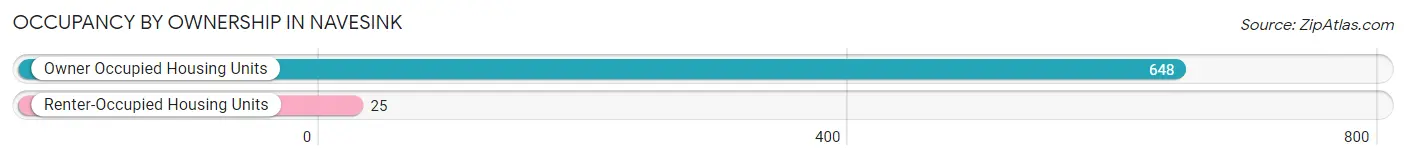
| Occupancy | # Housing Units | % Housing Units |
| Owner Occupied Housing Units | 648 | 96.3% |
| Renter-Occupied Housing Units | 25 | 3.7% |
| Total Occupied Housing Units | 673 | 100.0% |
Occupancy by Household Size in Navesink
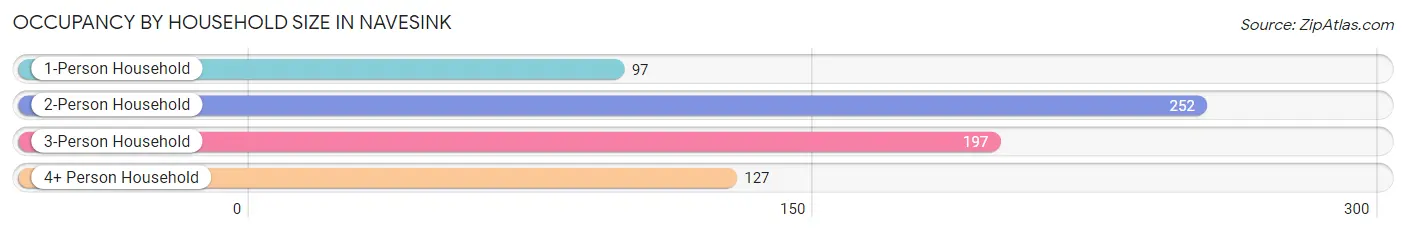
| Household Size | # Housing Units | % Housing Units |
| 1-Person Household | 97 | 14.4% |
| 2-Person Household | 252 | 37.4% |
| 3-Person Household | 197 | 29.3% |
| 4+ Person Household | 127 | 18.9% |
| Total Housing Units | 673 | 100.0% |
Occupancy by Ownership by Household Size in Navesink
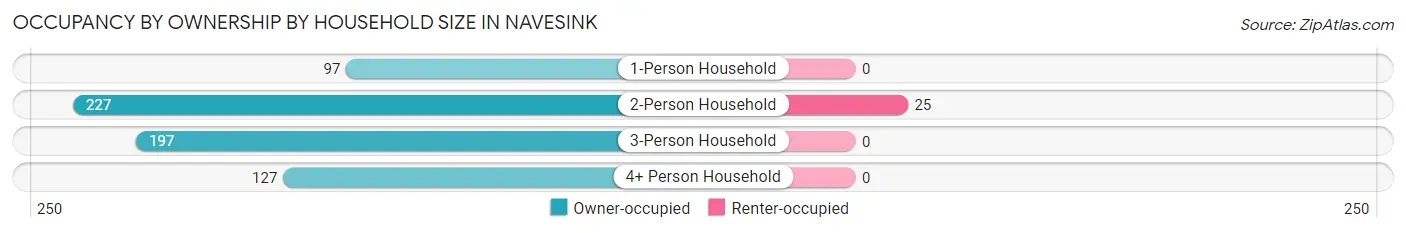
| Household Size | Owner-occupied | Renter-occupied |
| 1-Person Household | 97 (100.0%) | 0 (0.0%) |
| 2-Person Household | 227 (90.1%) | 25 (9.9%) |
| 3-Person Household | 197 (100.0%) | 0 (0.0%) |
| 4+ Person Household | 127 (100.0%) | 0 (0.0%) |
| Total Housing Units | 648 (96.3%) | 25 (3.7%) |
Occupancy by Educational Attainment in Navesink
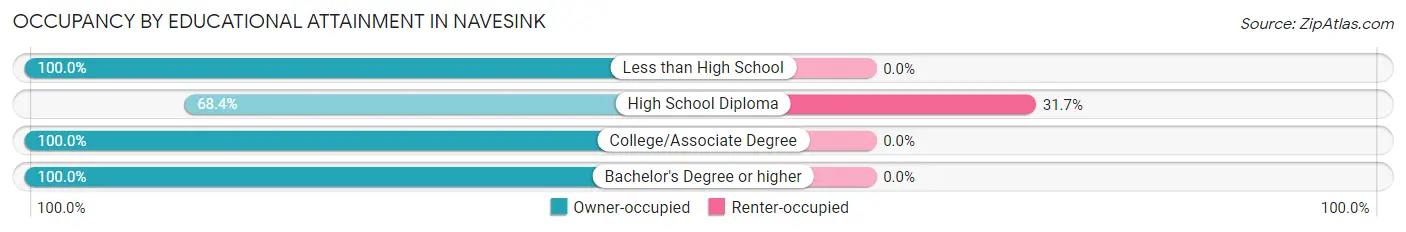
| Household Size | Owner-occupied | Renter-occupied |
| Less than High School | 94 (100.0%) | 0 (0.0%) |
| High School Diploma | 54 (68.3%) | 25 (31.7%) |
| College/Associate Degree | 116 (100.0%) | 0 (0.0%) |
| Bachelor's Degree or higher | 384 (100.0%) | 0 (0.0%) |
Occupancy by Age of Householder in Navesink
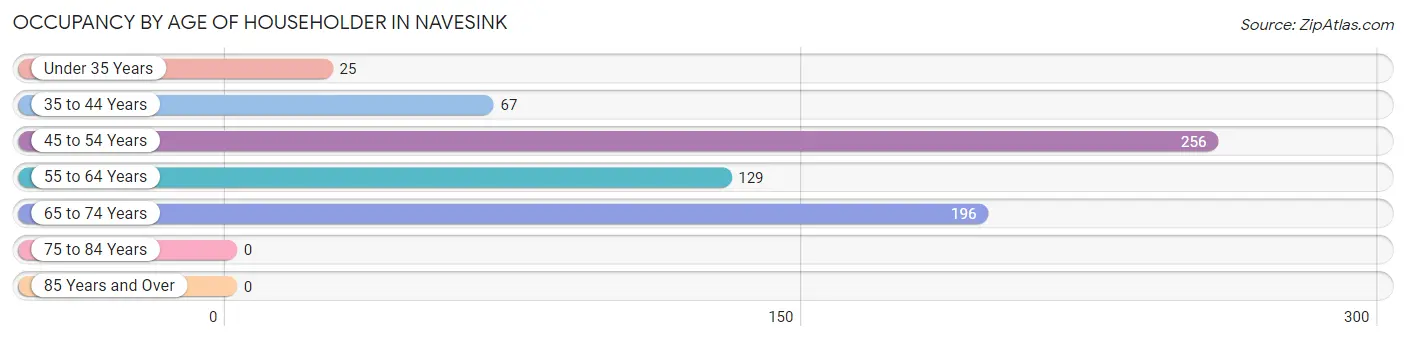
| Age Bracket | # Households | % Households |
| Under 35 Years | 25 | 3.7% |
| 35 to 44 Years | 67 | 10.0% |
| 45 to 54 Years | 256 | 38.0% |
| 55 to 64 Years | 129 | 19.2% |
| 65 to 74 Years | 196 | 29.1% |
| 75 to 84 Years | 0 | 0.0% |
| 85 Years and Over | 0 | 0.0% |
| Total | 673 | 100.0% |
Housing Finances in Navesink
Median Income by Occupancy in Navesink
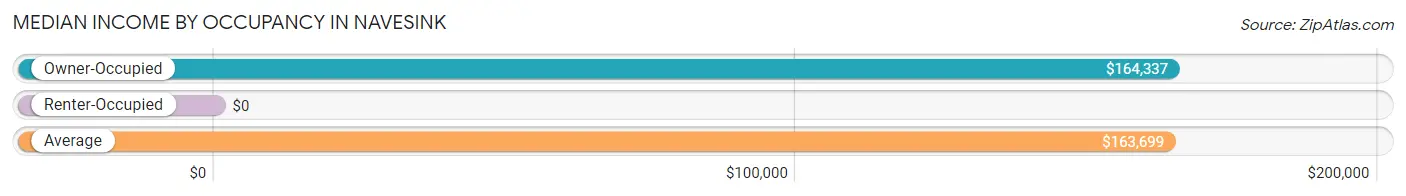
| Occupancy Type | # Households | Median Income |
| Owner-Occupied | 648 (96.3%) | $164,337 |
| Renter-Occupied | 25 (3.7%) | $0 |
| Average | 673 (100.0%) | $163,699 |
Occupancy by Householder Income Bracket in Navesink
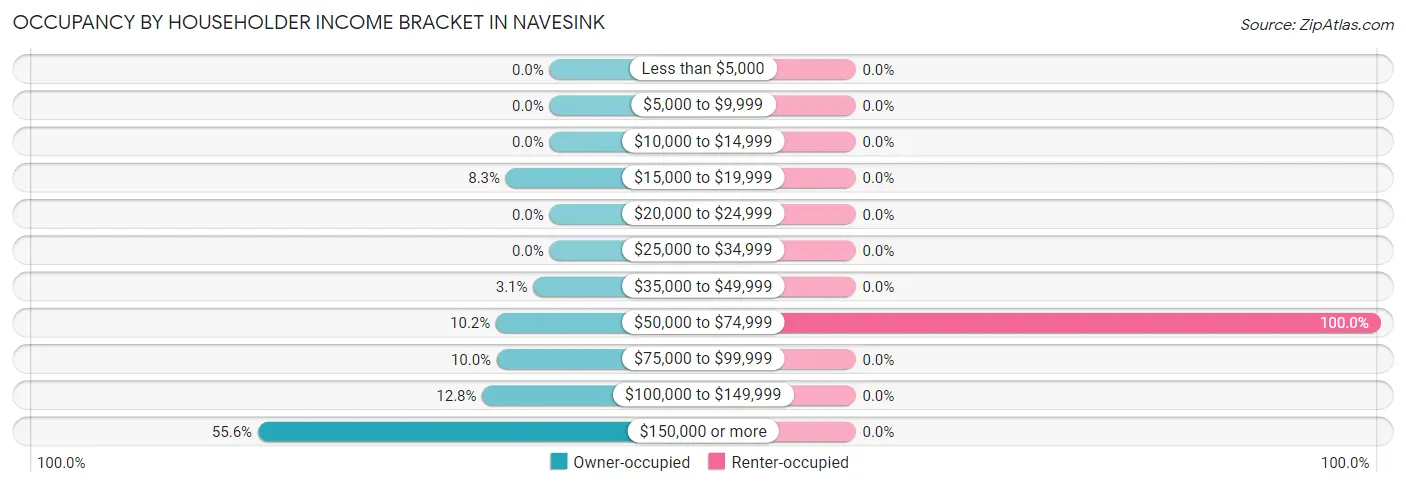
| Income Bracket | Owner-occupied | Renter-occupied |
| Less than $5,000 | 0 (0.0%) | 0 (0.0%) |
| $5,000 to $9,999 | 0 (0.0%) | 0 (0.0%) |
| $10,000 to $14,999 | 0 (0.0%) | 0 (0.0%) |
| $15,000 to $19,999 | 54 (8.3%) | 0 (0.0%) |
| $20,000 to $24,999 | 0 (0.0%) | 0 (0.0%) |
| $25,000 to $34,999 | 0 (0.0%) | 0 (0.0%) |
| $35,000 to $49,999 | 20 (3.1%) | 0 (0.0%) |
| $50,000 to $74,999 | 66 (10.2%) | 25 (100.0%) |
| $75,000 to $99,999 | 65 (10.0%) | 0 (0.0%) |
| $100,000 to $149,999 | 83 (12.8%) | 0 (0.0%) |
| $150,000 or more | 360 (55.6%) | 0 (0.0%) |
| Total | 648 (100.0%) | 25 (100.0%) |
Monthly Housing Cost Tiers in Navesink
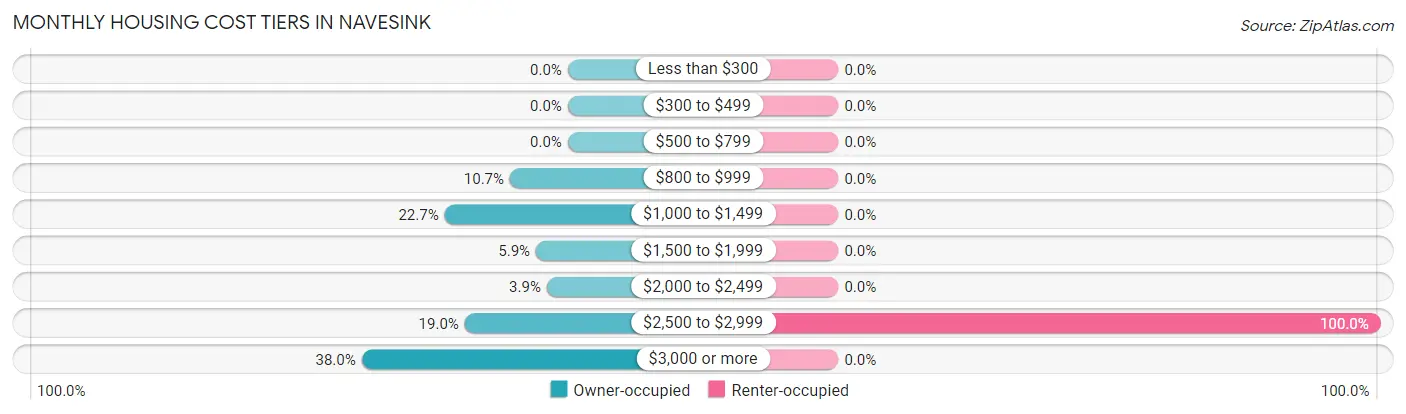
| Monthly Cost | Owner-occupied | Renter-occupied |
| Less than $300 | 0 (0.0%) | 0 (0.0%) |
| $300 to $499 | 0 (0.0%) | 0 (0.0%) |
| $500 to $799 | 0 (0.0%) | 0 (0.0%) |
| $800 to $999 | 69 (10.6%) | 0 (0.0%) |
| $1,000 to $1,499 | 147 (22.7%) | 0 (0.0%) |
| $1,500 to $1,999 | 38 (5.9%) | 0 (0.0%) |
| $2,000 to $2,499 | 25 (3.9%) | 0 (0.0%) |
| $2,500 to $2,999 | 123 (19.0%) | 25 (100.0%) |
| $3,000 or more | 246 (38.0%) | 0 (0.0%) |
| Total | 648 (100.0%) | 25 (100.0%) |
Physical Housing Characteristics in Navesink
Housing Structures in Navesink
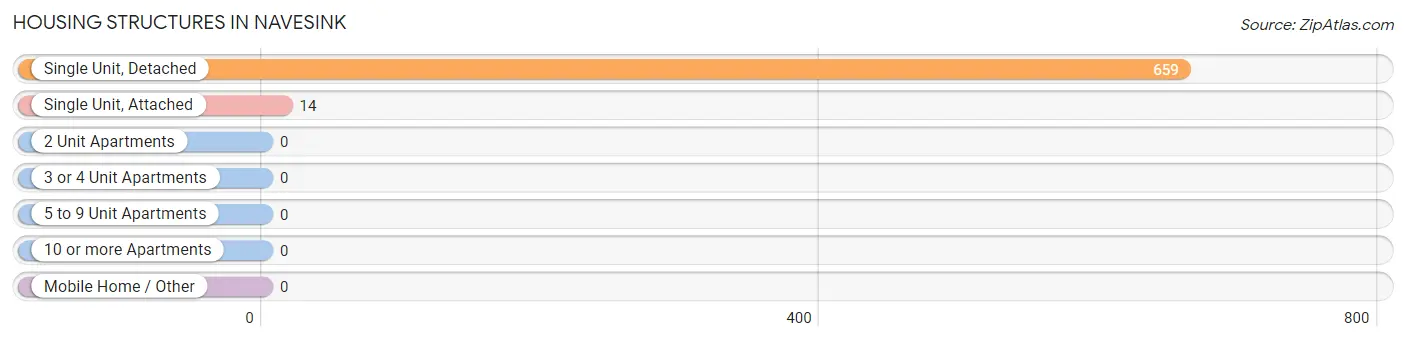
| Structure Type | # Housing Units | % Housing Units |
| Single Unit, Detached | 659 | 97.9% |
| Single Unit, Attached | 14 | 2.1% |
| 2 Unit Apartments | 0 | 0.0% |
| 3 or 4 Unit Apartments | 0 | 0.0% |
| 5 to 9 Unit Apartments | 0 | 0.0% |
| 10 or more Apartments | 0 | 0.0% |
| Mobile Home / Other | 0 | 0.0% |
| Total | 673 | 100.0% |
Housing Structures by Occupancy in Navesink
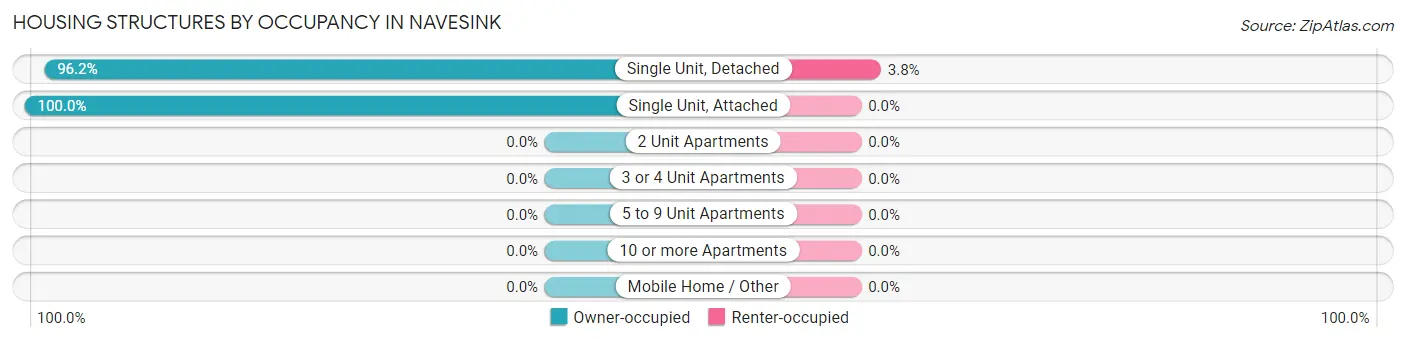
| Structure Type | Owner-occupied | Renter-occupied |
| Single Unit, Detached | 634 (96.2%) | 25 (3.8%) |
| Single Unit, Attached | 14 (100.0%) | 0 (0.0%) |
| 2 Unit Apartments | 0 (0.0%) | 0 (0.0%) |
| 3 or 4 Unit Apartments | 0 (0.0%) | 0 (0.0%) |
| 5 to 9 Unit Apartments | 0 (0.0%) | 0 (0.0%) |
| 10 or more Apartments | 0 (0.0%) | 0 (0.0%) |
| Mobile Home / Other | 0 (0.0%) | 0 (0.0%) |
| Total | 648 (96.3%) | 25 (3.7%) |
Housing Structures by Number of Rooms in Navesink
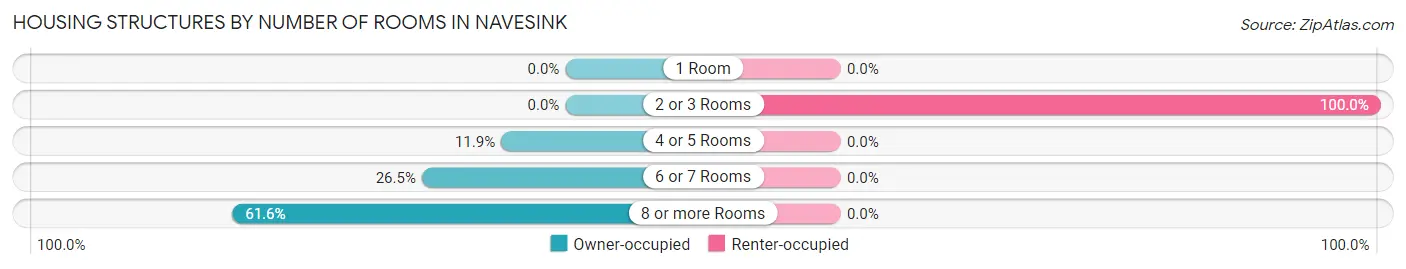
| Number of Rooms | Owner-occupied | Renter-occupied |
| 1 Room | 0 (0.0%) | 0 (0.0%) |
| 2 or 3 Rooms | 0 (0.0%) | 25 (100.0%) |
| 4 or 5 Rooms | 77 (11.9%) | 0 (0.0%) |
| 6 or 7 Rooms | 172 (26.5%) | 0 (0.0%) |
| 8 or more Rooms | 399 (61.6%) | 0 (0.0%) |
| Total | 648 (100.0%) | 25 (100.0%) |
Housing Structure by Heating Type in Navesink
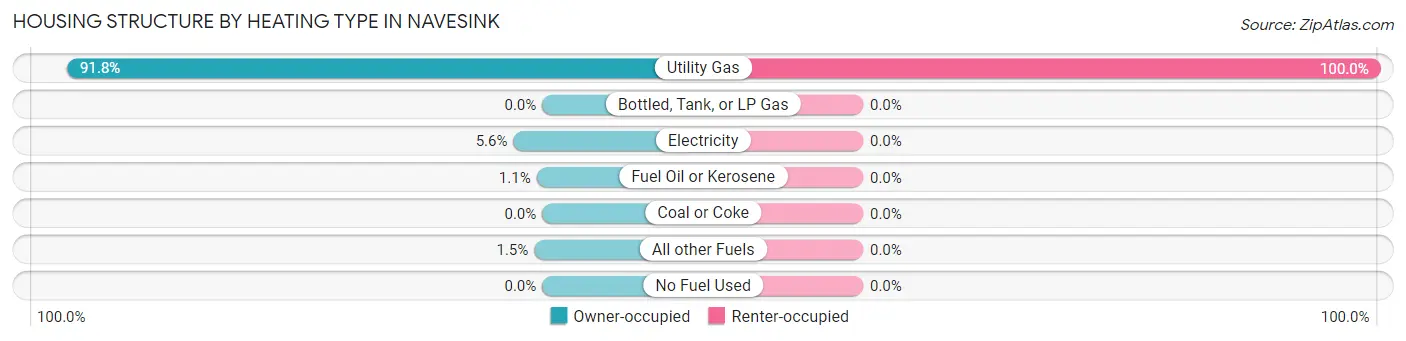
| Heating Type | Owner-occupied | Renter-occupied |
| Utility Gas | 595 (91.8%) | 25 (100.0%) |
| Bottled, Tank, or LP Gas | 0 (0.0%) | 0 (0.0%) |
| Electricity | 36 (5.6%) | 0 (0.0%) |
| Fuel Oil or Kerosene | 7 (1.1%) | 0 (0.0%) |
| Coal or Coke | 0 (0.0%) | 0 (0.0%) |
| All other Fuels | 10 (1.5%) | 0 (0.0%) |
| No Fuel Used | 0 (0.0%) | 0 (0.0%) |
| Total | 648 (100.0%) | 25 (100.0%) |
Household Vehicle Usage in Navesink
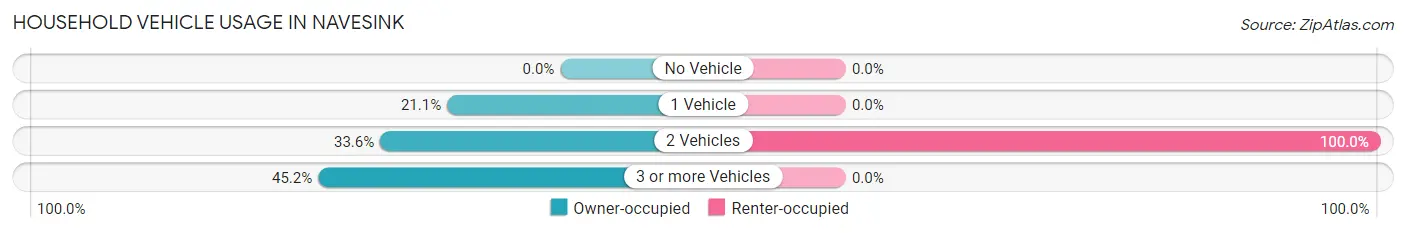
| Vehicles per Household | Owner-occupied | Renter-occupied |
| No Vehicle | 0 (0.0%) | 0 (0.0%) |
| 1 Vehicle | 137 (21.1%) | 0 (0.0%) |
| 2 Vehicles | 218 (33.6%) | 25 (100.0%) |
| 3 or more Vehicles | 293 (45.2%) | 0 (0.0%) |
| Total | 648 (100.0%) | 25 (100.0%) |
Real Estate & Mortgages in Navesink
Real Estate and Mortgage Overview in Navesink
| Characteristic | Without Mortgage | With Mortgage |
| Housing Units | 319 | 329 |
| Median Property Value | $681,700 | $630,700 |
| Median Household Income | - | - |
| Monthly Housing Costs | $1,501 | $197 |
| Real Estate Taxes | $10,001 | $0 |
Property Value by Mortgage Status in Navesink
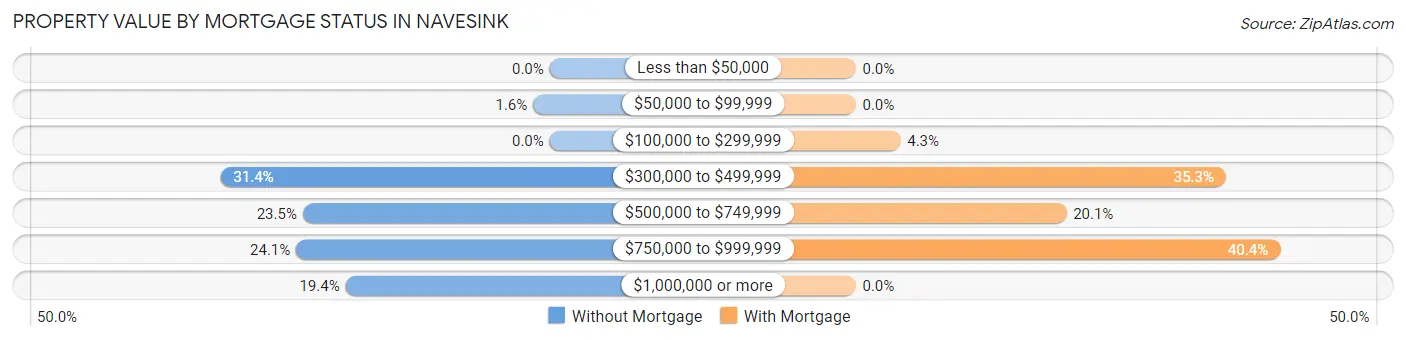
| Property Value | Without Mortgage | With Mortgage |
| Less than $50,000 | 0 (0.0%) | 0 (0.0%) |
| $50,000 to $99,999 | 5 (1.6%) | 0 (0.0%) |
| $100,000 to $299,999 | 0 (0.0%) | 14 (4.3%) |
| $300,000 to $499,999 | 100 (31.4%) | 116 (35.3%) |
| $500,000 to $749,999 | 75 (23.5%) | 66 (20.1%) |
| $750,000 to $999,999 | 77 (24.1%) | 133 (40.4%) |
| $1,000,000 or more | 62 (19.4%) | 0 (0.0%) |
| Total | 319 (100.0%) | 329 (100.0%) |
Household Income by Mortgage Status in Navesink
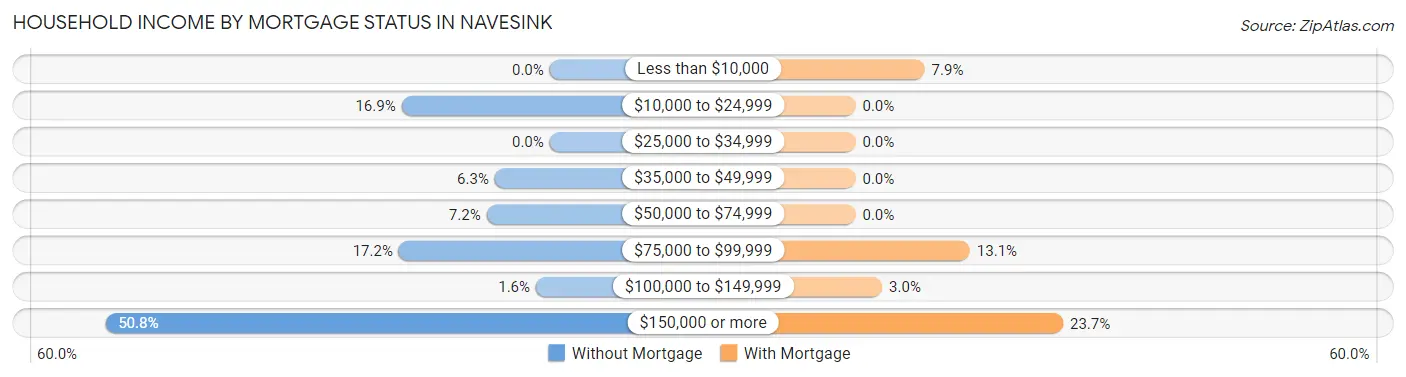
| Household Income | Without Mortgage | With Mortgage |
| Less than $10,000 | 0 (0.0%) | 26 (7.9%) |
| $10,000 to $24,999 | 54 (16.9%) | 0 (0.0%) |
| $25,000 to $34,999 | 0 (0.0%) | 0 (0.0%) |
| $35,000 to $49,999 | 20 (6.3%) | 0 (0.0%) |
| $50,000 to $74,999 | 23 (7.2%) | 0 (0.0%) |
| $75,000 to $99,999 | 55 (17.2%) | 43 (13.1%) |
| $100,000 to $149,999 | 5 (1.6%) | 10 (3.0%) |
| $150,000 or more | 162 (50.8%) | 78 (23.7%) |
| Total | 319 (100.0%) | 329 (100.0%) |
Property Value to Household Income Ratio in Navesink
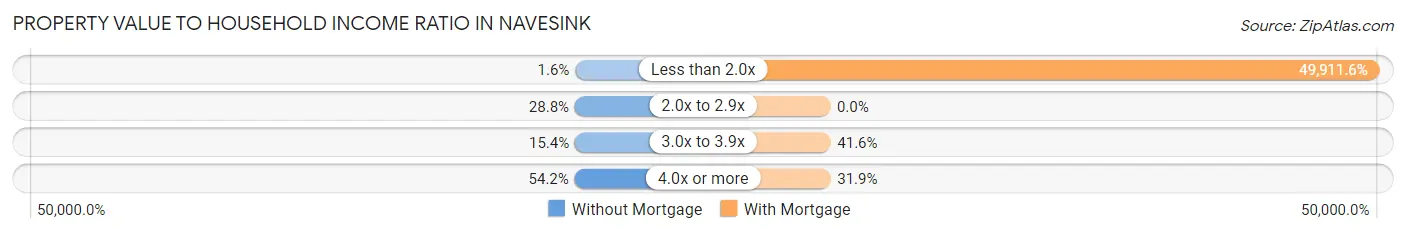
| Value-to-Income Ratio | Without Mortgage | With Mortgage |
| Less than 2.0x | 5 (1.6%) | 164,209 (49,911.5%) |
| 2.0x to 2.9x | 92 (28.8%) | 0 (0.0%) |
| 3.0x to 3.9x | 49 (15.4%) | 137 (41.6%) |
| 4.0x or more | 173 (54.2%) | 105 (31.9%) |
| Total | 319 (100.0%) | 329 (100.0%) |
Real Estate Taxes by Mortgage Status in Navesink
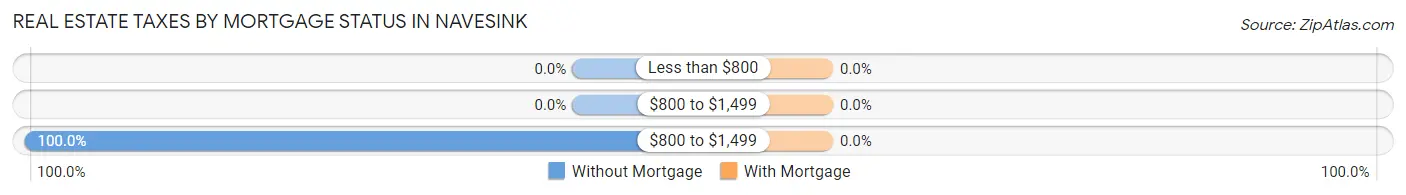
| Property Taxes | Without Mortgage | With Mortgage |
| Less than $800 | 0 (0.0%) | 0 (0.0%) |
| $800 to $1,499 | 0 (0.0%) | 0 (0.0%) |
| $800 to $1,499 | 319 (100.0%) | 0 (0.0%) |
| Total | 319 (100.0%) | 329 (100.0%) |
Health & Disability in Navesink
Health Insurance Coverage by Age in Navesink
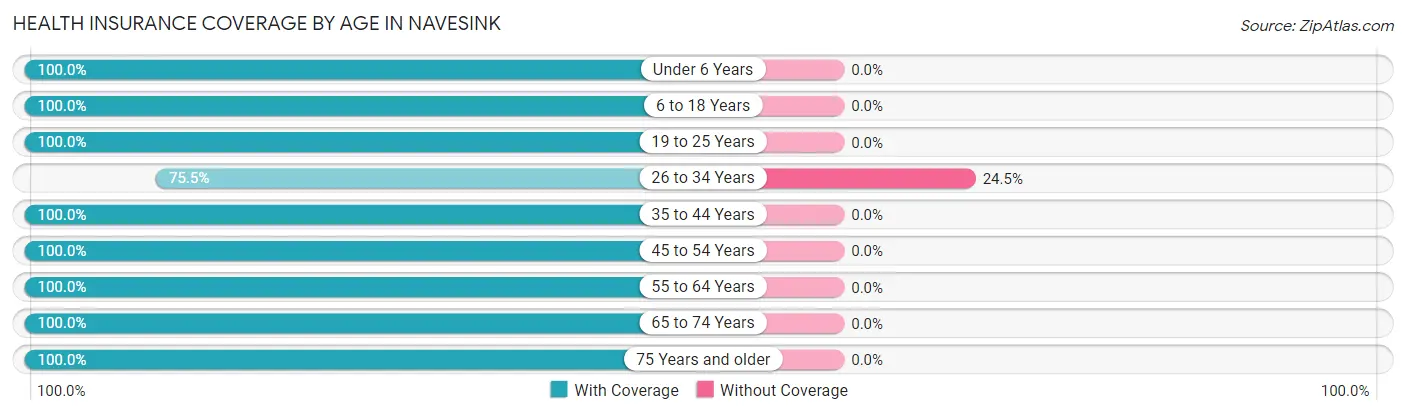
| Age Bracket | With Coverage | Without Coverage |
| Under 6 Years | 8 (100.0%) | 0 (0.0%) |
| 6 to 18 Years | 339 (100.0%) | 0 (0.0%) |
| 19 to 25 Years | 157 (100.0%) | 0 (0.0%) |
| 26 to 34 Years | 77 (75.5%) | 25 (24.5%) |
| 35 to 44 Years | 119 (100.0%) | 0 (0.0%) |
| 45 to 54 Years | 461 (100.0%) | 0 (0.0%) |
| 55 to 64 Years | 237 (100.0%) | 0 (0.0%) |
| 65 to 74 Years | 275 (100.0%) | 0 (0.0%) |
| 75 Years and older | 29 (100.0%) | 0 (0.0%) |
| Total | 1,702 (98.6%) | 25 (1.5%) |
Health Insurance Coverage by Citizenship Status in Navesink
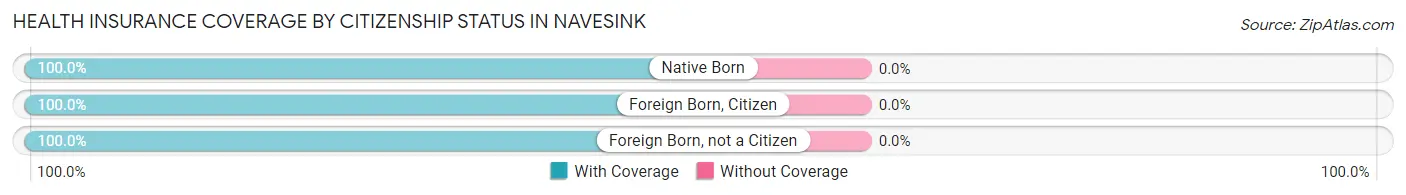
| Citizenship Status | With Coverage | Without Coverage |
| Native Born | 8 (100.0%) | 0 (0.0%) |
| Foreign Born, Citizen | 339 (100.0%) | 0 (0.0%) |
| Foreign Born, not a Citizen | 157 (100.0%) | 0 (0.0%) |
Health Insurance Coverage by Household Income in Navesink
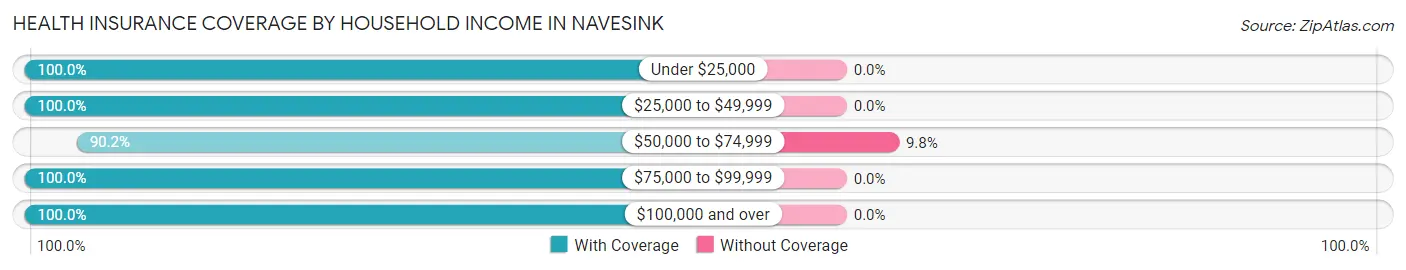
| Household Income | With Coverage | Without Coverage |
| Under $25,000 | 54 (100.0%) | 0 (0.0%) |
| $25,000 to $49,999 | 20 (100.0%) | 0 (0.0%) |
| $50,000 to $74,999 | 231 (90.2%) | 25 (9.8%) |
| $75,000 to $99,999 | 135 (100.0%) | 0 (0.0%) |
| $100,000 and over | 1,262 (100.0%) | 0 (0.0%) |
Public vs Private Health Insurance Coverage by Age in Navesink
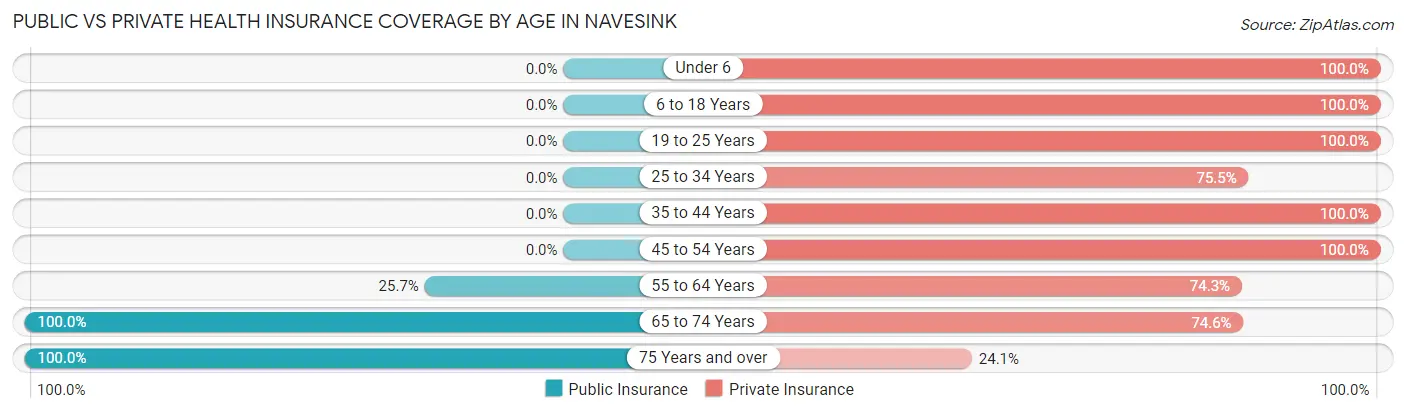
| Age Bracket | Public Insurance | Private Insurance |
| Under 6 | 0 (0.0%) | 8 (100.0%) |
| 6 to 18 Years | 0 (0.0%) | 339 (100.0%) |
| 19 to 25 Years | 0 (0.0%) | 157 (100.0%) |
| 25 to 34 Years | 0 (0.0%) | 77 (75.5%) |
| 35 to 44 Years | 0 (0.0%) | 119 (100.0%) |
| 45 to 54 Years | 0 (0.0%) | 461 (100.0%) |
| 55 to 64 Years | 61 (25.7%) | 176 (74.3%) |
| 65 to 74 Years | 275 (100.0%) | 205 (74.6%) |
| 75 Years and over | 29 (100.0%) | 7 (24.1%) |
| Total | 365 (21.1%) | 1,549 (89.7%) |
Disability Status by Sex by Age in Navesink
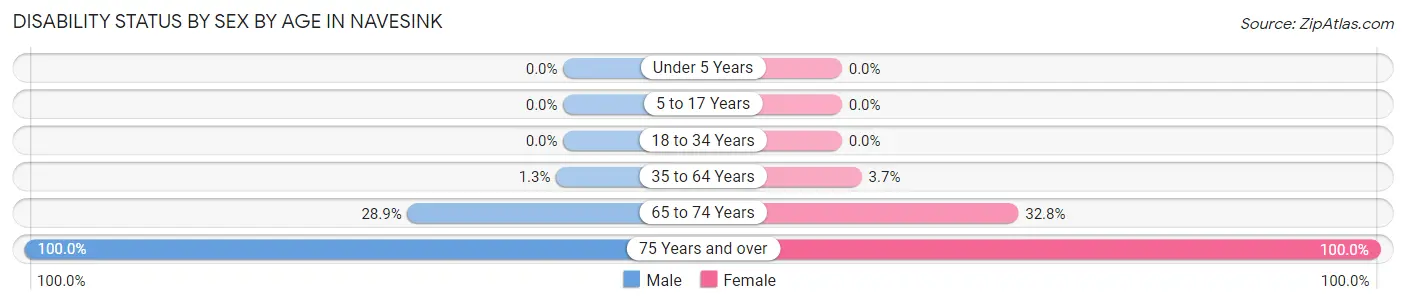
| Age Bracket | Male | Female |
| Under 5 Years | 0 (0.0%) | 0 (0.0%) |
| 5 to 17 Years | 0 (0.0%) | 0 (0.0%) |
| 18 to 34 Years | 0 (0.0%) | 0 (0.0%) |
| 35 to 64 Years | 5 (1.3%) | 16 (3.7%) |
| 65 to 74 Years | 46 (28.9%) | 38 (32.8%) |
| 75 Years and over | 7 (100.0%) | 22 (100.0%) |
Disability Class by Sex by Age in Navesink
Disability Class: Hearing Difficulty
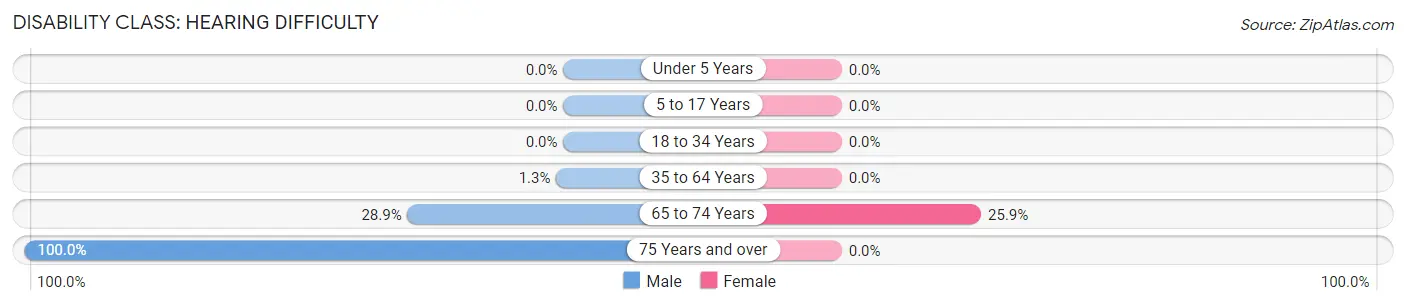
| Age Bracket | Male | Female |
| Under 5 Years | 0 (0.0%) | 0 (0.0%) |
| 5 to 17 Years | 0 (0.0%) | 0 (0.0%) |
| 18 to 34 Years | 0 (0.0%) | 0 (0.0%) |
| 35 to 64 Years | 5 (1.3%) | 0 (0.0%) |
| 65 to 74 Years | 46 (28.9%) | 30 (25.9%) |
| 75 Years and over | 7 (100.0%) | 0 (0.0%) |
Disability Class: Vision Difficulty
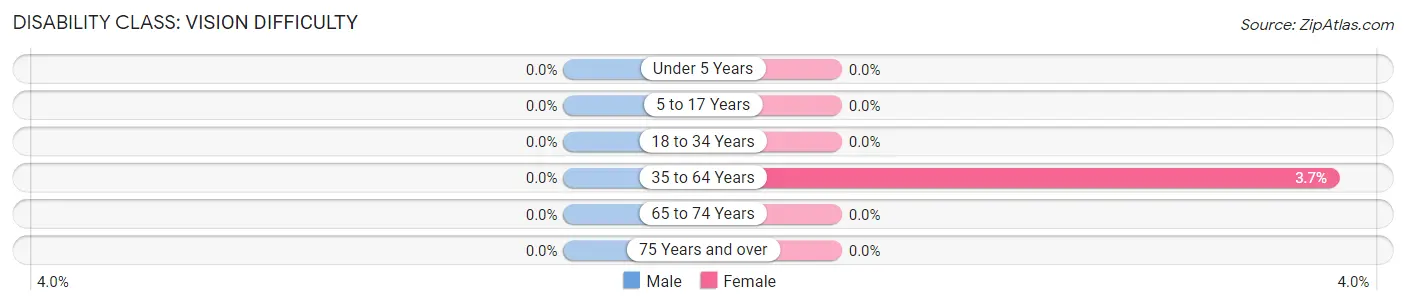
| Age Bracket | Male | Female |
| Under 5 Years | 0 (0.0%) | 0 (0.0%) |
| 5 to 17 Years | 0 (0.0%) | 0 (0.0%) |
| 18 to 34 Years | 0 (0.0%) | 0 (0.0%) |
| 35 to 64 Years | 0 (0.0%) | 16 (3.7%) |
| 65 to 74 Years | 0 (0.0%) | 0 (0.0%) |
| 75 Years and over | 0 (0.0%) | 0 (0.0%) |
Disability Class: Cognitive Difficulty
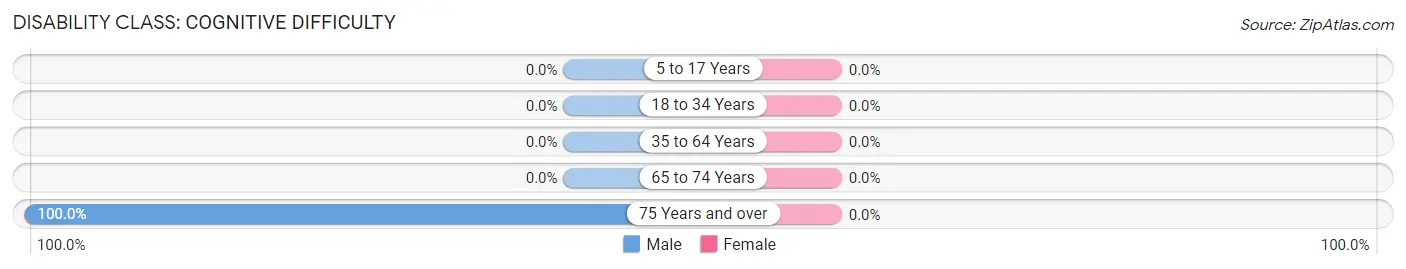
| Age Bracket | Male | Female |
| 5 to 17 Years | 0 (0.0%) | 0 (0.0%) |
| 18 to 34 Years | 0 (0.0%) | 0 (0.0%) |
| 35 to 64 Years | 0 (0.0%) | 0 (0.0%) |
| 65 to 74 Years | 0 (0.0%) | 0 (0.0%) |
| 75 Years and over | 7 (100.0%) | 0 (0.0%) |
Disability Class: Ambulatory Difficulty
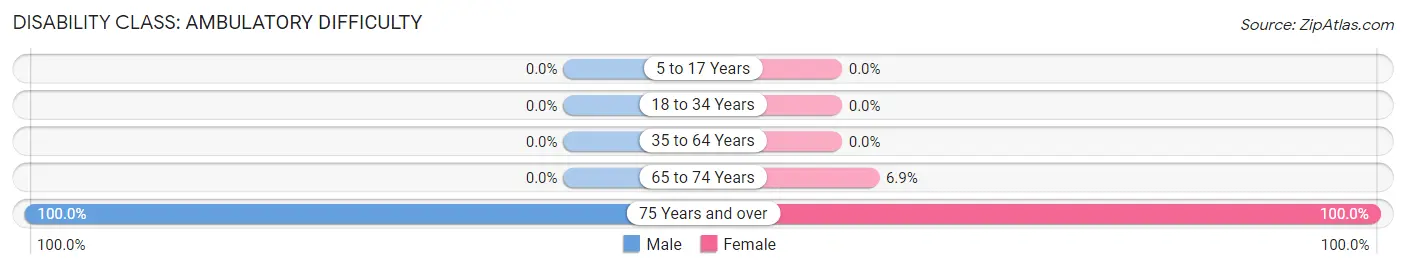
| Age Bracket | Male | Female |
| 5 to 17 Years | 0 (0.0%) | 0 (0.0%) |
| 18 to 34 Years | 0 (0.0%) | 0 (0.0%) |
| 35 to 64 Years | 0 (0.0%) | 0 (0.0%) |
| 65 to 74 Years | 0 (0.0%) | 8 (6.9%) |
| 75 Years and over | 7 (100.0%) | 22 (100.0%) |
Disability Class: Self-Care Difficulty
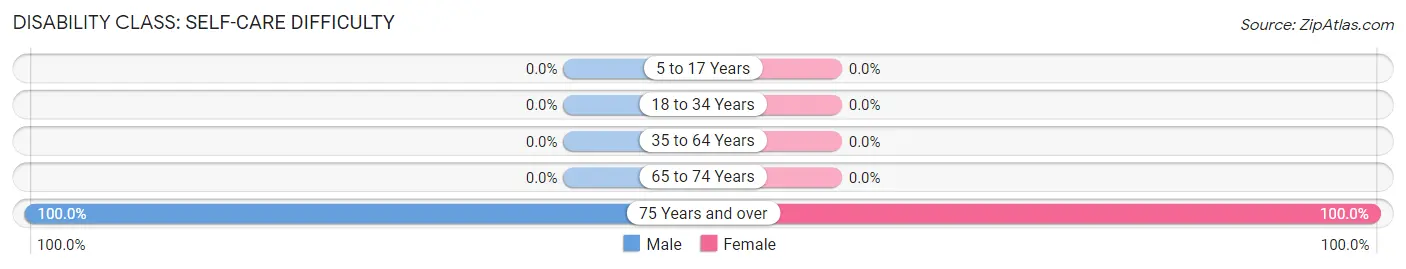
| Age Bracket | Male | Female |
| 5 to 17 Years | 0 (0.0%) | 0 (0.0%) |
| 18 to 34 Years | 0 (0.0%) | 0 (0.0%) |
| 35 to 64 Years | 0 (0.0%) | 0 (0.0%) |
| 65 to 74 Years | 0 (0.0%) | 0 (0.0%) |
| 75 Years and over | 7 (100.0%) | 22 (100.0%) |
Technology Access in Navesink
Computing Device Access in Navesink
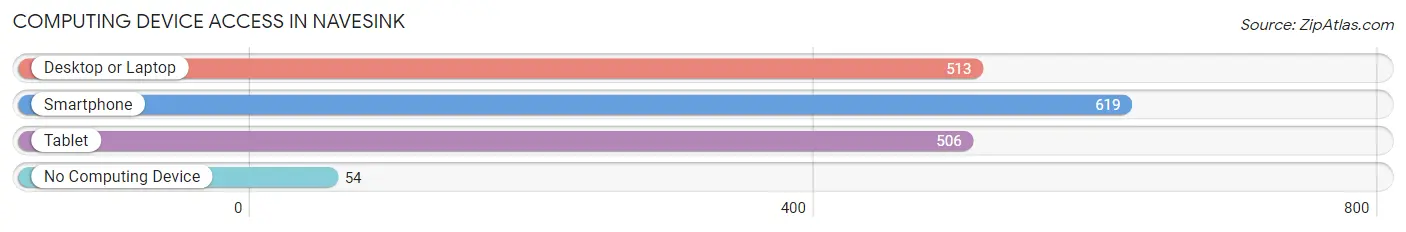
| Device Type | # Households | % Households |
| Desktop or Laptop | 513 | 76.2% |
| Smartphone | 619 | 92.0% |
| Tablet | 506 | 75.2% |
| No Computing Device | 54 | 8.0% |
| Total | 673 | 100.0% |
Internet Access in Navesink
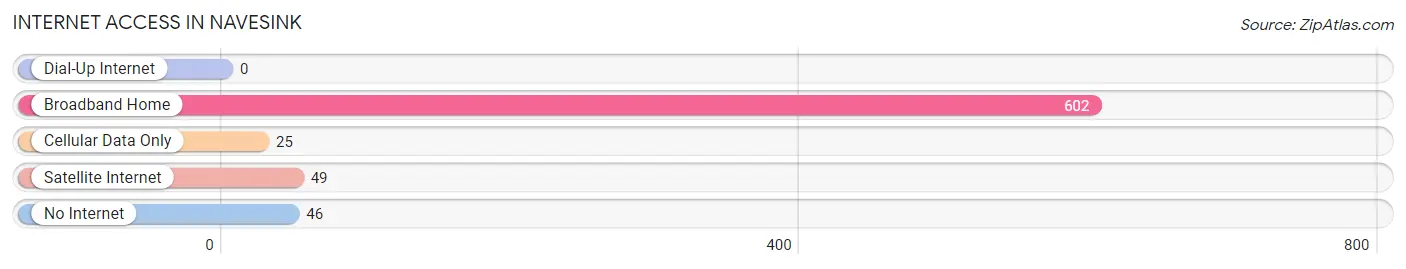
| Internet Type | # Households | % Households |
| Dial-Up Internet | 0 | 0.0% |
| Broadband Home | 602 | 89.4% |
| Cellular Data Only | 25 | 3.7% |
| Satellite Internet | 49 | 7.3% |
| No Internet | 46 | 6.8% |
| Total | 673 | 100.0% |
Navesink Summary
Navesink is a small unincorporated community located in Monmouth County, New Jersey. It is situated on the banks of the Navesink River, which flows into the Atlantic Ocean. The area is known for its picturesque views of the river and its surrounding countryside.
History
The area now known as Navesink was originally inhabited by the Lenape Native Americans. The first European settlers arrived in the area in the late 1600s, and the area was officially established as a township in 1715. The name “Navesink” is derived from the Lenape word “Nawasink,” which means “place of the deer.”
In the late 1700s, the area became a popular destination for wealthy New Yorkers who built large estates along the river. The area was also home to a number of shipbuilding yards, which produced vessels for the U.S. Navy during the War of 1812.
In the mid-1800s, the area became a popular summer resort destination for wealthy New Yorkers. The area was home to a number of grand hotels, including the Navesink House, which was built in 1845. The area also became a popular destination for artists, who were drawn to the area’s picturesque views.
Geography
Navesink is located in Monmouth County, New Jersey, on the banks of the Navesink River. The area is bordered by the towns of Middletown, Red Bank, and Rumson. The area is known for its picturesque views of the river and its surrounding countryside.
The area is mostly flat, with some rolling hills. The highest point in the area is the Navesink Twin Lights, which stands at an elevation of 128 feet. The area is home to a number of parks, including the Navesink River County Park and the Hartshorne Woods Park.
Economy
The economy of Navesink is largely based on tourism and real estate. The area is home to a number of luxury hotels, restaurants, and shops. The area is also home to a number of marinas, which provide services to boaters.
The area is also home to a number of technology companies, including the software company Oracle. The area is also home to a number of financial services companies, including the investment firm Morgan Stanley.
Demographics
As of the 2010 census, the population of Navesink was 4,845. The racial makeup of the area was 87.3% White, 5.2% African American, 0.3% Native American, 3.2% Asian, and 3.9% from other races. The median household income in the area was $90,945, and the median home value was $717,000.
Conclusion
Navesink is a small unincorporated community located in Monmouth County, New Jersey. It is situated on the banks of the Navesink River, which flows into the Atlantic Ocean. The area is known for its picturesque views of the river and its surrounding countryside. The area was originally inhabited by the Lenape Native Americans, and was later settled by European settlers in the late 1600s. The area is now home to a number of luxury hotels, restaurants, and shops, as well as a number of technology and financial services companies. The population of Navesink was 4,845 as of the 2010 census, and the median household income was $90,945.
Common Questions
What is Per Capita Income in Navesink?
Per Capita income in Navesink is $84,137.
What is the Median Family Income in Navesink?
Median Family Income in Navesink is $182,969.
What is the Median Household income in Navesink?
Median Household Income in Navesink is $163,699.
What is Income or Wage Gap in Navesink?
Income or Wage Gap in Navesink is 55.9%.
Women in Navesink earn 44.1 cents for every dollar earned by a man.
What is Inequality or Gini Index in Navesink?
Inequality or Gini Index in Navesink is 0.45.
What is the Total Population of Navesink?
Total Population of Navesink is 1,727.
What is the Total Male Population of Navesink?
Total Male Population of Navesink is 826.
What is the Total Female Population of Navesink?
Total Female Population of Navesink is 901.
What is the Ratio of Males per 100 Females in Navesink?
There are 91.68 Males per 100 Females in Navesink.
What is the Ratio of Females per 100 Males in Navesink?
There are 109.08 Females per 100 Males in Navesink.
What is the Median Population Age in Navesink?
Median Population Age in Navesink is 49.6 Years.
What is the Average Family Size in Navesink
Average Family Size in Navesink is 2.9 People.
What is the Average Household Size in Navesink
Average Household Size in Navesink is 2.6 People.
How Large is the Labor Force in Navesink?
There are 1,063 People in the Labor Forcein in Navesink.
What is the Percentage of People in the Labor Force in Navesink?
75.2% of People are in the Labor Force in Navesink.
What is the Unemployment Rate in Navesink?
Unemployment Rate in Navesink is 11.2%.