Fairview, NJ Map & Demographics
Fairview Map
Fairview Overview
$73,088
PER CAPITA INCOME
$204,327
AVG FAMILY INCOME
$187,132
AVG HOUSEHOLD INCOME
36.4%
WAGE / INCOME GAP [ % ]
63.6¢/ $1
WAGE / INCOME GAP [ $ ]
0.37
INEQUALITY / GINI INDEX
4,234
TOTAL POPULATION
2,206
MALE POPULATION
2,028
FEMALE POPULATION
108.78
MALES / 100 FEMALES
91.93
FEMALES / 100 MALES
40.5
MEDIAN AGE
3.1
AVG FAMILY SIZE
2.9
AVG HOUSEHOLD SIZE
2,317
LABOR FORCE [ PEOPLE ]
67.9%
PERCENT IN LABOR FORCE
6.7%
UNEMPLOYMENT RATE
Fairview Zip Codes
Income in Fairview
Income Overview in Fairview
Per Capita Income in Fairview is $73,088, while median incomes of families and households are $204,327 and $187,132 respectively.
| Characteristic | Number | Measure |
| Per Capita Income | 4,234 | $73,088 |
| Median Family Income | 1,273 | $204,327 |
| Mean Family Income | 1,273 | $225,182 |
| Median Household Income | 1,439 | $187,132 |
| Mean Household Income | 1,439 | $217,208 |
| Income Deficit | 1,273 | $0 |
| Wage / Income Gap (%) | 4,234 | 36.37% |
| Wage / Income Gap ($) | 4,234 | 63.63¢ per $1 |
| Gini / Inequality Index | 4,234 | 0.37 |
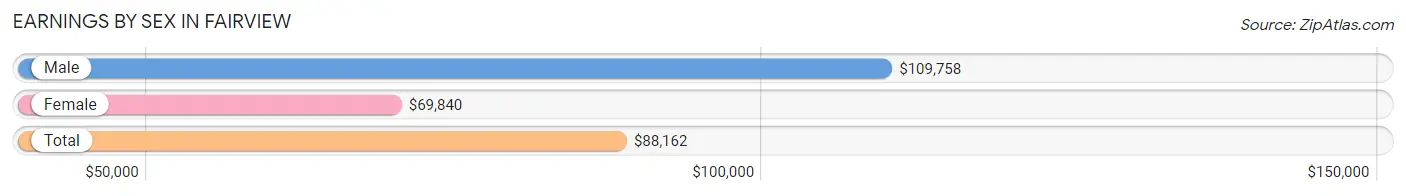
Earnings by Sex in Fairview
Average Earnings in Fairview are $88,162, $109,758 for men and $69,840 for women, a difference of 36.4%.
| Sex | Number | Average Earnings |
| Male | 1,166 (51.0%) | $109,758 |
| Female | 1,122 (49.0%) | $69,840 |
| Total | 2,288 (100.0%) | $88,162 |
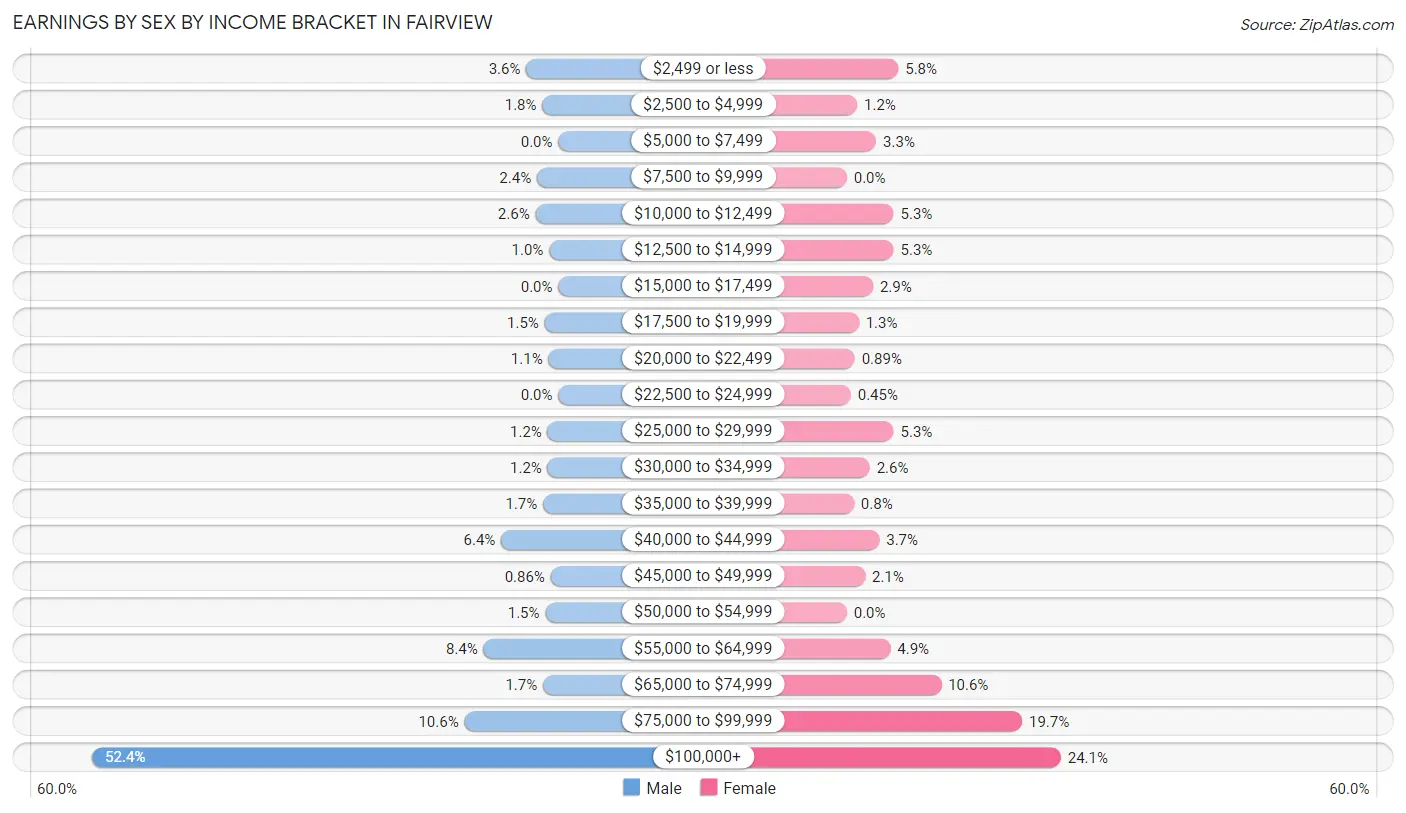
Earnings by Sex by Income Bracket in Fairview
The most common earnings brackets in Fairview are $100,000+ for men (611 | 52.4%) and $100,000+ for women (270 | 24.1%).
| Income | Male | Female |
| $2,499 or less | 42 (3.6%) | 65 (5.8%) |
| $2,500 to $4,999 | 21 (1.8%) | 13 (1.2%) |
| $5,000 to $7,499 | 0 (0.0%) | 37 (3.3%) |
| $7,500 to $9,999 | 28 (2.4%) | 0 (0.0%) |
| $10,000 to $12,499 | 30 (2.6%) | 59 (5.3%) |
| $12,500 to $14,999 | 12 (1.0%) | 59 (5.3%) |
| $15,000 to $17,499 | 0 (0.0%) | 33 (2.9%) |
| $17,500 to $19,999 | 18 (1.5%) | 15 (1.3%) |
| $20,000 to $22,499 | 13 (1.1%) | 10 (0.9%) |
| $22,500 to $24,999 | 0 (0.0%) | 5 (0.4%) |
| $25,000 to $29,999 | 14 (1.2%) | 59 (5.3%) |
| $30,000 to $34,999 | 14 (1.2%) | 29 (2.6%) |
| $35,000 to $39,999 | 20 (1.7%) | 9 (0.8%) |
| $40,000 to $44,999 | 75 (6.4%) | 41 (3.6%) |
| $45,000 to $49,999 | 10 (0.9%) | 23 (2.1%) |
| $50,000 to $54,999 | 17 (1.5%) | 0 (0.0%) |
| $55,000 to $64,999 | 98 (8.4%) | 55 (4.9%) |
| $65,000 to $74,999 | 20 (1.7%) | 119 (10.6%) |
| $75,000 to $99,999 | 123 (10.5%) | 221 (19.7%) |
| $100,000+ | 611 (52.4%) | 270 (24.1%) |
| Total | 1,166 (100.0%) | 1,122 (100.0%) |
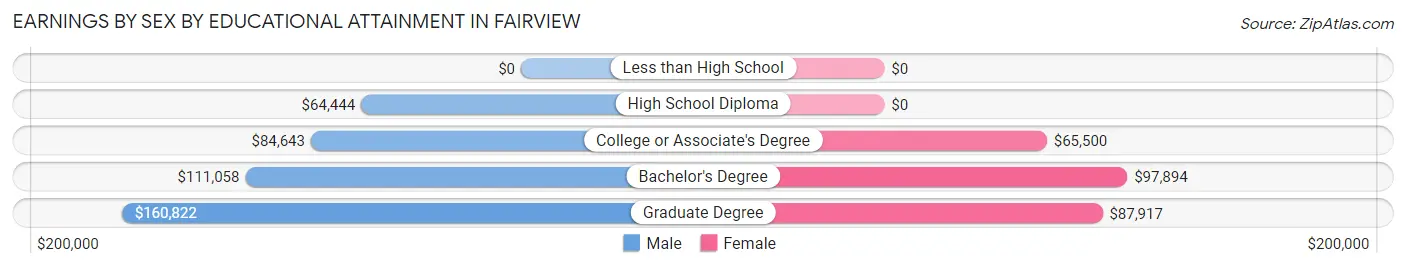
Earnings by Sex by Educational Attainment in Fairview
Average earnings in Fairview are $116,736 for men and $87,600 for women, a difference of 25.0%. Men with an educational attainment of graduate degree enjoy the highest average annual earnings of $160,822, while those with high school diploma education earn the least with $64,444. Women with an educational attainment of bachelor's degree earn the most with the average annual earnings of $97,894, while those with college or associate's degree education have the smallest earnings of $65,500.
| Educational Attainment | Male Income | Female Income |
| Less than High School | - | - |
| High School Diploma | $64,444 | $0 |
| College or Associate's Degree | $84,643 | $65,500 |
| Bachelor's Degree | $111,058 | $97,894 |
| Graduate Degree | $160,822 | $87,917 |
| Total | $116,736 | $87,600 |
Family Income in Fairview
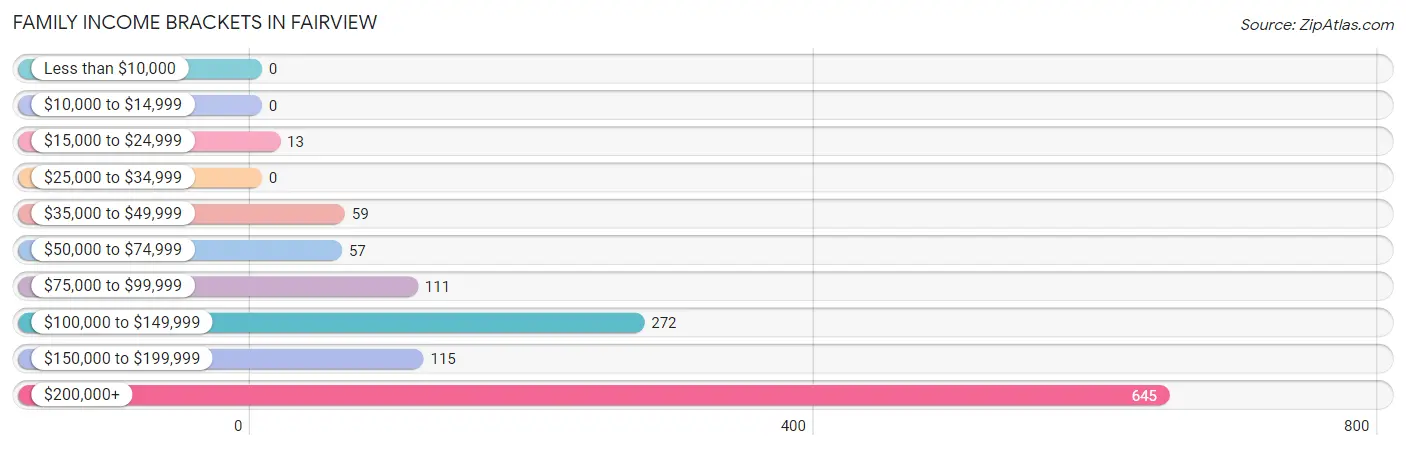
Family Income Brackets in Fairview
According to the Fairview family income data, there are 645 families falling into the $200,000+ income range, which is the most common income bracket and makes up 50.7% of all families.
| Income Bracket | # Families | % Families |
| Less than $10,000 | 0 | 0.0% |
| $10,000 to $14,999 | 0 | 0.0% |
| $15,000 to $24,999 | 13 | 1.0% |
| $25,000 to $34,999 | 0 | 0.0% |
| $35,000 to $49,999 | 59 | 4.6% |
| $50,000 to $74,999 | 57 | 4.5% |
| $75,000 to $99,999 | 111 | 8.7% |
| $100,000 to $149,999 | 272 | 21.4% |
| $150,000 to $199,999 | 115 | 9.0% |
| $200,000+ | 645 | 50.7% |
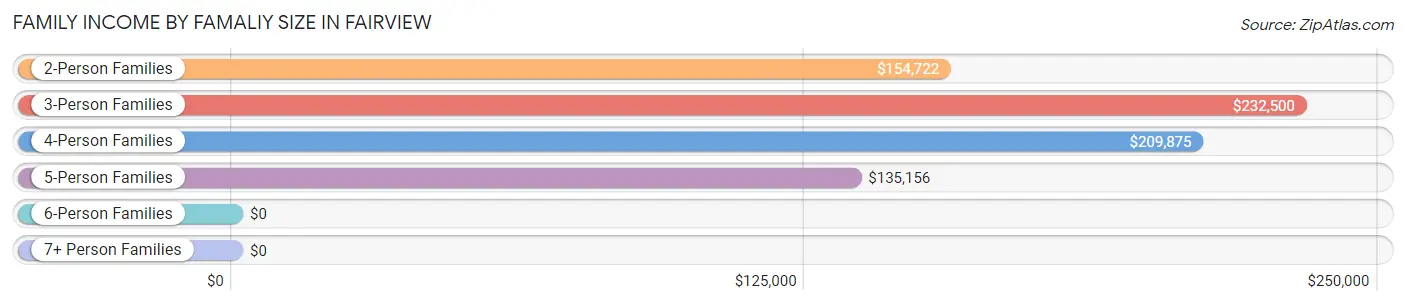
Family Income by Famaliy Size in Fairview
3-person families (222 | 17.4%) account for the highest median family income in Fairview with $232,500 per family, while 3-person families (222 | 17.4%) have the highest median income of $77,500 per family member.
| Income Bracket | # Families | Median Income |
| 2-Person Families | 612 (48.1%) | $154,722 |
| 3-Person Families | 222 (17.4%) | $232,500 |
| 4-Person Families | 263 (20.7%) | $209,875 |
| 5-Person Families | 133 (10.4%) | $135,156 |
| 6-Person Families | 33 (2.6%) | $0 |
| 7+ Person Families | 10 (0.8%) | $0 |
| Total | 1,273 (100.0%) | $204,327 |
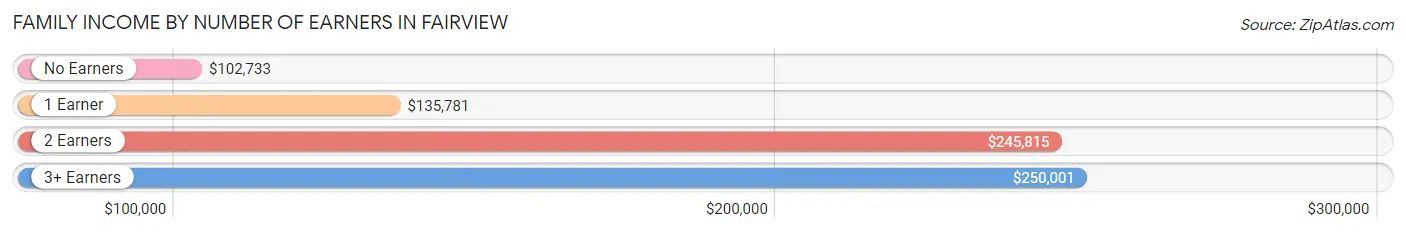
Family Income by Number of Earners in Fairview
The median family income in Fairview is $204,327, with families comprising 3+ earners (168) having the highest median family income of $250,001, while families with no earners (183) have the lowest median family income of $102,733, accounting for 13.2% and 14.4% of families, respectively.
| Number of Earners | # Families | Median Income |
| No Earners | 183 (14.4%) | $102,733 |
| 1 Earner | 313 (24.6%) | $135,781 |
| 2 Earners | 609 (47.8%) | $245,815 |
| 3+ Earners | 168 (13.2%) | $250,001 |
| Total | 1,273 (100.0%) | $204,327 |
Household Income in Fairview
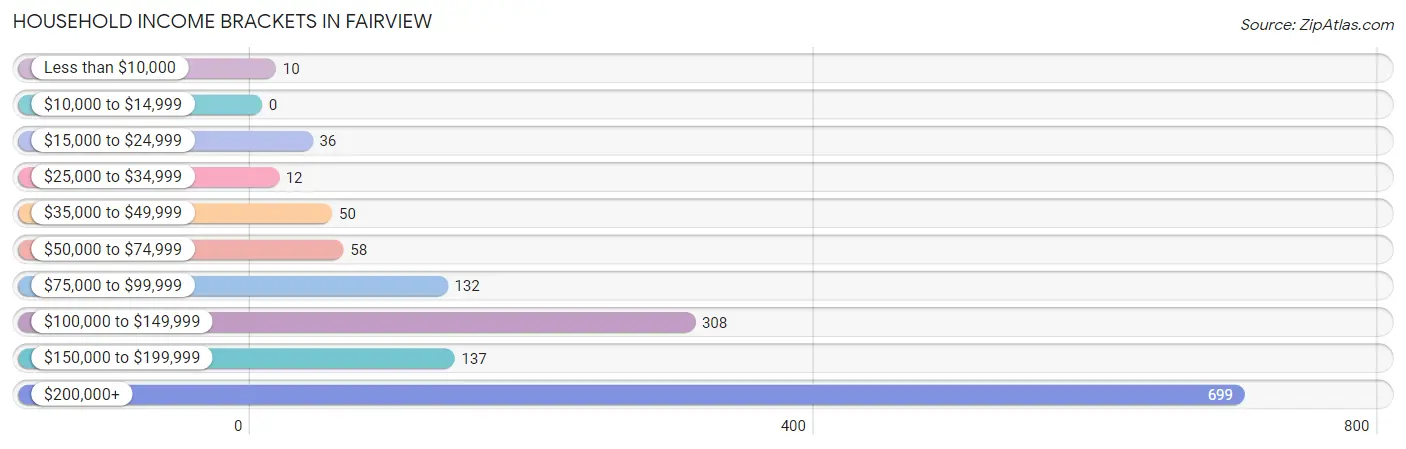
Household Income Brackets in Fairview
With 699 households falling in the category, the $200,000+ income range is the most frequent in Fairview, accounting for 48.6% of all households.
| Income Bracket | # Households | % Households |
| Less than $10,000 | 10 | 0.7% |
| $10,000 to $14,999 | 0 | 0.0% |
| $15,000 to $24,999 | 36 | 2.5% |
| $25,000 to $34,999 | 12 | 0.8% |
| $35,000 to $49,999 | 50 | 3.5% |
| $50,000 to $74,999 | 58 | 4.0% |
| $75,000 to $99,999 | 132 | 9.2% |
| $100,000 to $149,999 | 308 | 21.4% |
| $150,000 to $199,999 | 137 | 9.5% |
| $200,000+ | 699 | 48.6% |
Household Income by Householder Age in Fairview
The median household income in Fairview is $187,132, with the highest median household income of $245,761 found in the 45 to 64 years age bracket for the primary householder. A total of 626 households (43.5%) fall into this category.
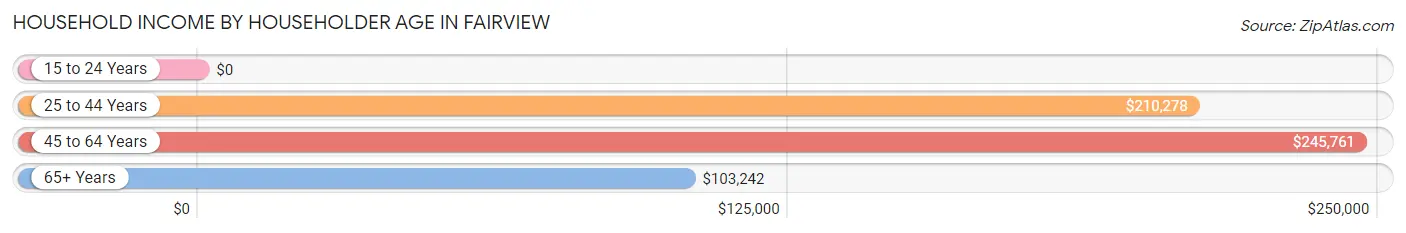
| Income Bracket | # Households | Median Income |
| 15 to 24 Years | 0 (0.0%) | $0 |
| 25 to 44 Years | 478 (33.2%) | $210,278 |
| 45 to 64 Years | 626 (43.5%) | $245,761 |
| 65+ Years | 335 (23.3%) | $103,242 |
| Total | 1,439 (100.0%) | $187,132 |
Poverty in Fairview
Income Below Poverty by Sex and Age in Fairview
With 0.4% poverty level for males and 2.2% for females among the residents of Fairview, 65 to 74 year old males and 75 year old and over females are the most vulnerable to poverty, with 10 males (5.1%) and 10 females (17.0%) in their respective age groups living below the poverty level.
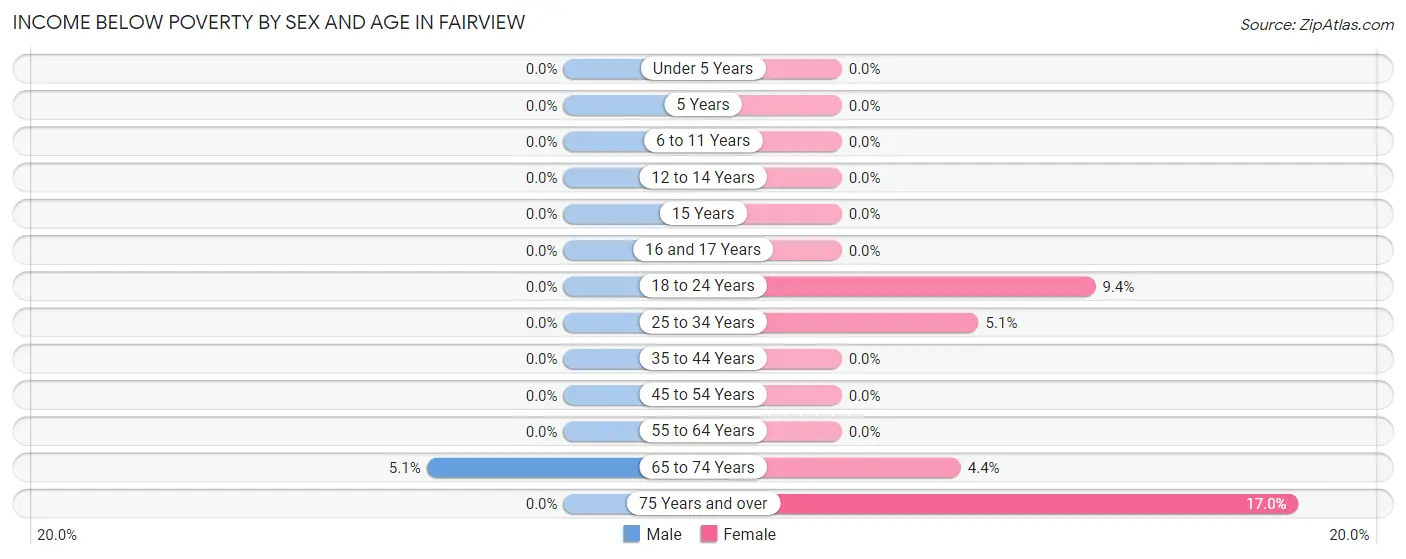
| Age Bracket | Male | Female |
| Under 5 Years | 0 (0.0%) | 0 (0.0%) |
| 5 Years | 0 (0.0%) | 0 (0.0%) |
| 6 to 11 Years | 0 (0.0%) | 0 (0.0%) |
| 12 to 14 Years | 0 (0.0%) | 0 (0.0%) |
| 15 Years | 0 (0.0%) | 0 (0.0%) |
| 16 and 17 Years | 0 (0.0%) | 0 (0.0%) |
| 18 to 24 Years | 0 (0.0%) | 13 (9.4%) |
| 25 to 34 Years | 0 (0.0%) | 12 (5.1%) |
| 35 to 44 Years | 0 (0.0%) | 0 (0.0%) |
| 45 to 54 Years | 0 (0.0%) | 0 (0.0%) |
| 55 to 64 Years | 0 (0.0%) | 0 (0.0%) |
| 65 to 74 Years | 10 (5.1%) | 10 (4.4%) |
| 75 Years and over | 0 (0.0%) | 10 (17.0%) |
| Total | 10 (0.4%) | 45 (2.2%) |
Income Above Poverty by Sex and Age in Fairview
According to the poverty statistics in Fairview, males aged under 5 years and females aged under 5 years are the age groups that are most secure financially, with 100.0% of males and 100.0% of females in these age groups living above the poverty line.
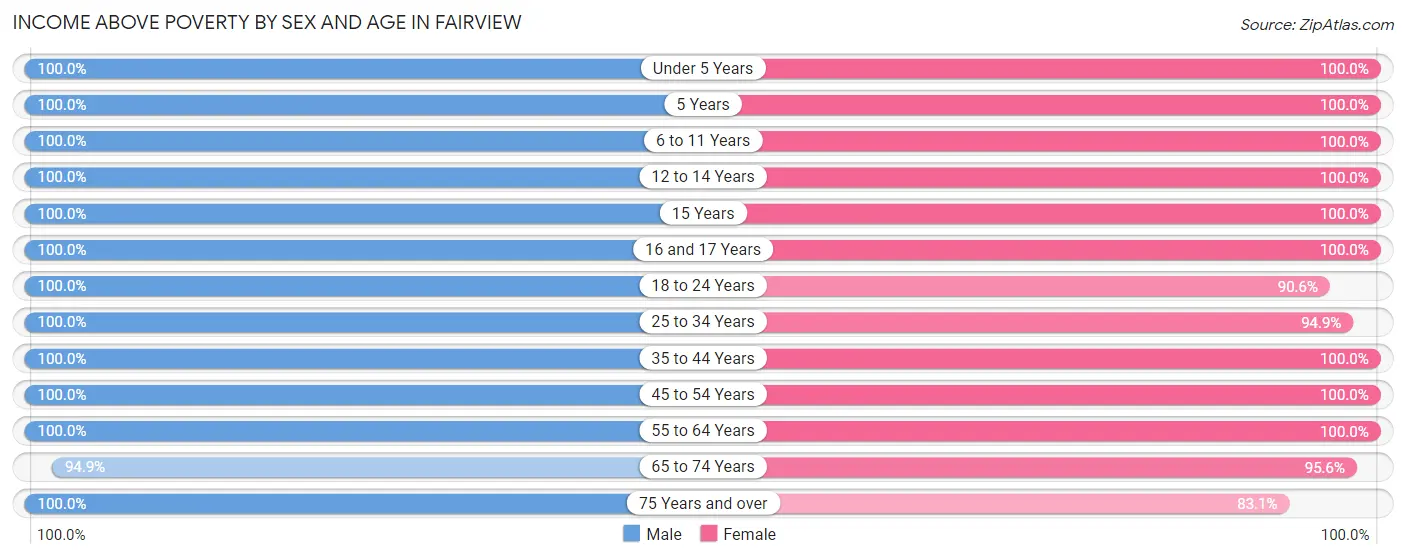
| Age Bracket | Male | Female |
| Under 5 Years | 129 (100.0%) | 78 (100.0%) |
| 5 Years | 9 (100.0%) | 59 (100.0%) |
| 6 to 11 Years | 235 (100.0%) | 149 (100.0%) |
| 12 to 14 Years | 58 (100.0%) | 72 (100.0%) |
| 15 Years | 23 (100.0%) | 9 (100.0%) |
| 16 and 17 Years | 81 (100.0%) | 53 (100.0%) |
| 18 to 24 Years | 109 (100.0%) | 125 (90.6%) |
| 25 to 34 Years | 253 (100.0%) | 224 (94.9%) |
| 35 to 44 Years | 386 (100.0%) | 392 (100.0%) |
| 45 to 54 Years | 373 (100.0%) | 306 (100.0%) |
| 55 to 64 Years | 245 (100.0%) | 251 (100.0%) |
| 65 to 74 Years | 187 (94.9%) | 216 (95.6%) |
| 75 Years and over | 108 (100.0%) | 49 (83.1%) |
| Total | 2,196 (99.6%) | 1,983 (97.8%) |
Income Below Poverty Among Married-Couple Families in Fairview
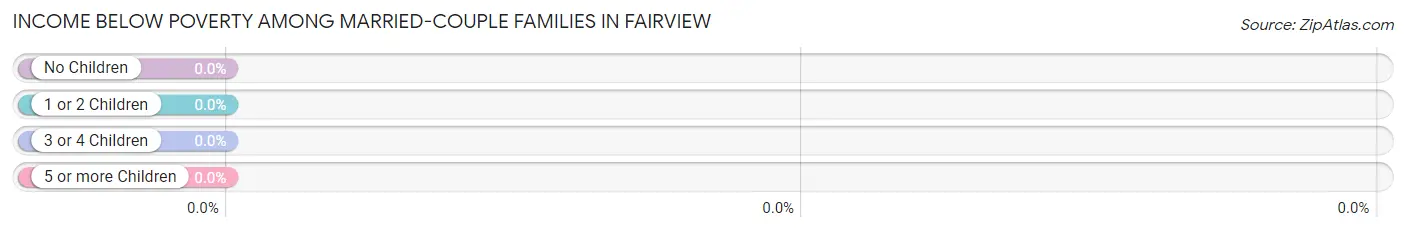
| Children | Above Poverty | Below Poverty |
| No Children | 636 (100.0%) | 0 (0.0%) |
| 1 or 2 Children | 374 (100.0%) | 0 (0.0%) |
| 3 or 4 Children | 48 (100.0%) | 0 (0.0%) |
| 5 or more Children | 0 (0.0%) | 0 (0.0%) |
| Total | 1,058 (100.0%) | 0 (0.0%) |
Income Below Poverty Among Single-Parent Households in Fairview
| Children | Single Father | Single Mother |
| No Children | 0 (0.0%) | 0 (0.0%) |
| 1 or 2 Children | 0 (0.0%) | 0 (0.0%) |
| 3 or 4 Children | 0 (0.0%) | 0 (0.0%) |
| 5 or more Children | 0 (0.0%) | 0 (0.0%) |
| Total | 0 (0.0%) | 0 (0.0%) |
Income Below Poverty Among Married-Couple vs Single-Parent Households in Fairview
| Children | Married-Couple Families | Single-Parent Households |
| No Children | 0 (0.0%) | 0 (0.0%) |
| 1 or 2 Children | 0 (0.0%) | 0 (0.0%) |
| 3 or 4 Children | 0 (0.0%) | 0 (0.0%) |
| 5 or more Children | 0 (0.0%) | 0 (0.0%) |
| Total | 0 (0.0%) | 0 (0.0%) |
Race in Fairview
The most populous races in Fairview are White / Caucasian (4,074 | 96.2%), Hispanic or Latino (251 | 5.9%), and Two or more Races (96 | 2.3%).
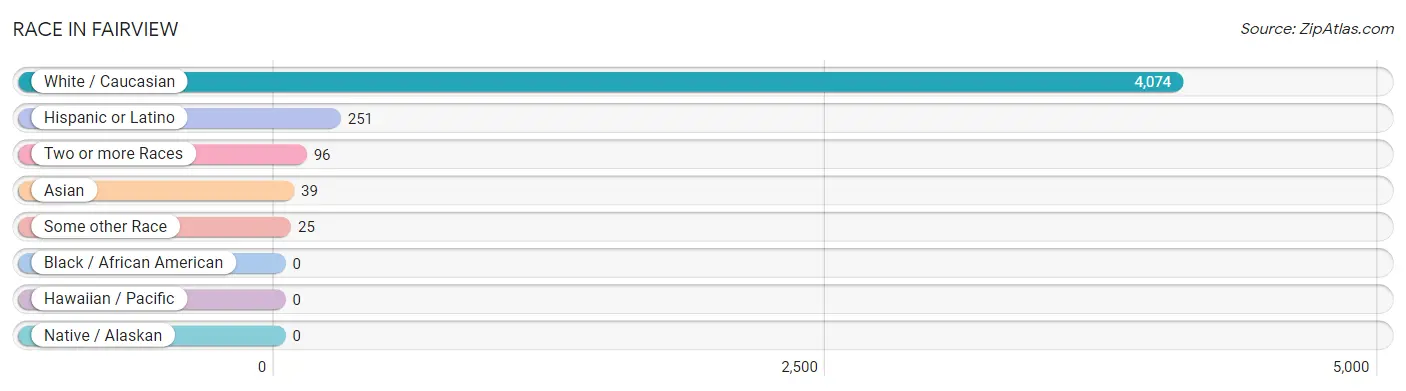
| Race | # Population | % Population |
| Asian | 39 | 0.9% |
| Black / African American | 0 | 0.0% |
| Hawaiian / Pacific | 0 | 0.0% |
| Hispanic or Latino | 251 | 5.9% |
| Native / Alaskan | 0 | 0.0% |
| White / Caucasian | 4,074 | 96.2% |
| Two or more Races | 96 | 2.3% |
| Some other Race | 25 | 0.6% |
| Total | 4,234 | 100.0% |
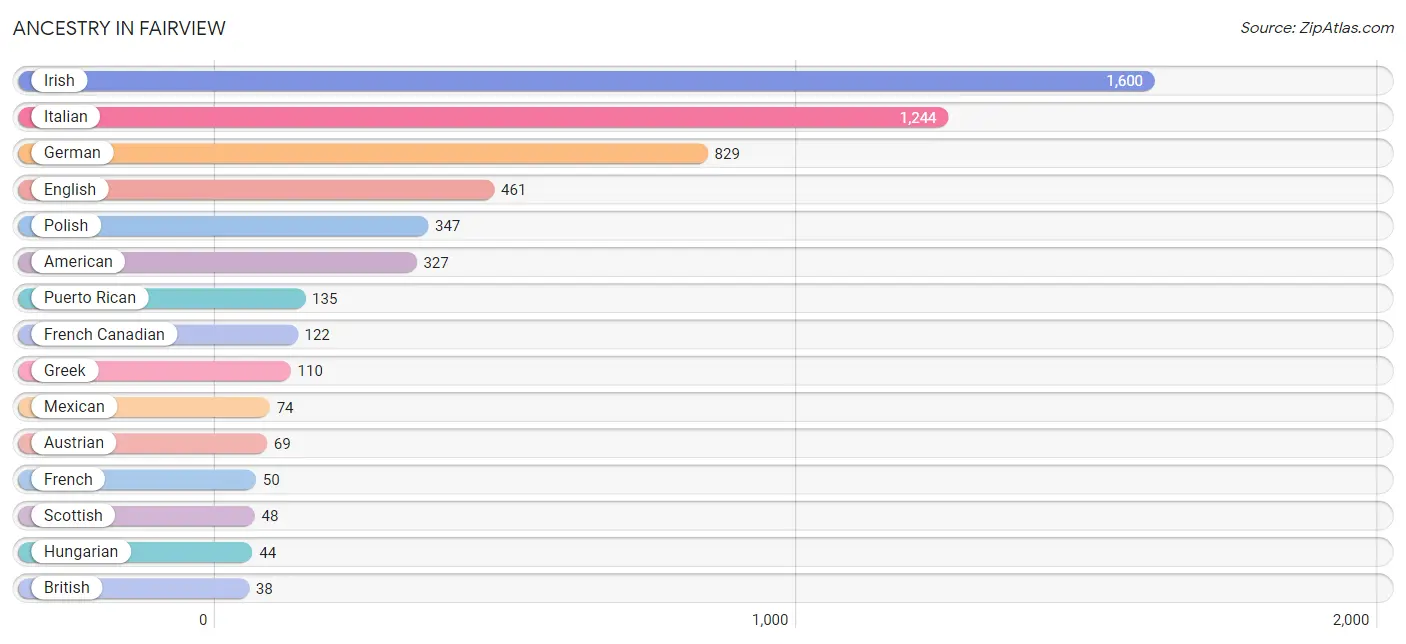
Ancestry in Fairview
The most populous ancestries reported in Fairview are Irish (1,600 | 37.8%), Italian (1,244 | 29.4%), German (829 | 19.6%), English (461 | 10.9%), and Polish (347 | 8.2%), together accounting for 105.8% of all Fairview residents.
| Ancestry | # Population | % Population |
| American | 327 | 7.7% |
| Arab | 9 | 0.2% |
| Austrian | 69 | 1.6% |
| Belgian | 13 | 0.3% |
| British | 38 | 0.9% |
| Chilean | 14 | 0.3% |
| Colombian | 13 | 0.3% |
| Croatian | 15 | 0.4% |
| Dutch | 13 | 0.3% |
| Eastern European | 10 | 0.2% |
| English | 461 | 10.9% |
| European | 24 | 0.6% |
| French | 50 | 1.2% |
| French Canadian | 122 | 2.9% |
| German | 829 | 19.6% |
| Greek | 110 | 2.6% |
| Hungarian | 44 | 1.0% |
| Irish | 1,600 | 37.8% |
| Italian | 1,244 | 29.4% |
| Korean | 10 | 0.2% |
| Lithuanian | 38 | 0.9% |
| Mexican | 74 | 1.8% |
| Norwegian | 5 | 0.1% |
| Polish | 347 | 8.2% |
| Puerto Rican | 135 | 3.2% |
| Russian | 31 | 0.7% |
| Scotch-Irish | 11 | 0.3% |
| Scottish | 48 | 1.1% |
| Slavic | 10 | 0.2% |
| Slovak | 12 | 0.3% |
| South American | 27 | 0.6% |
| Spaniard | 15 | 0.4% |
| Swedish | 31 | 0.7% |
| Syrian | 9 | 0.2% |
| Thai | 29 | 0.7% |
| Welsh | 11 | 0.3% | View All 36 Rows |
Immigrants in Fairview
The most numerous immigrant groups reported in Fairview came from Europe (58 | 1.4%), Asia (39 | 0.9%), Italy (30 | 0.7%), Southern Europe (30 | 0.7%), and India (29 | 0.7%), together accounting for 4.4% of all Fairview residents.
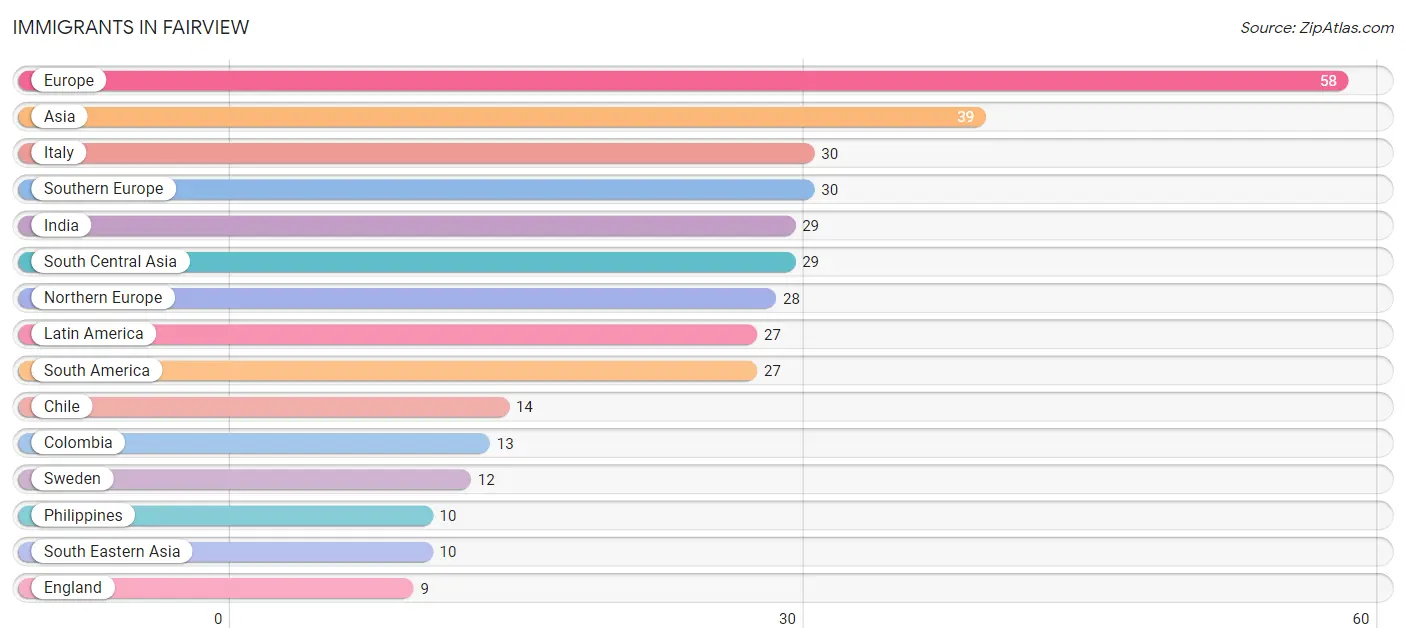
| Immigration Origin | # Population | % Population |
| Asia | 39 | 0.9% |
| Chile | 14 | 0.3% |
| Colombia | 13 | 0.3% |
| England | 9 | 0.2% |
| Europe | 58 | 1.4% |
| India | 29 | 0.7% |
| Ireland | 7 | 0.2% |
| Italy | 30 | 0.7% |
| Latin America | 27 | 0.6% |
| Northern Europe | 28 | 0.7% |
| Philippines | 10 | 0.2% |
| South America | 27 | 0.6% |
| South Central Asia | 29 | 0.7% |
| South Eastern Asia | 10 | 0.2% |
| Southern Europe | 30 | 0.7% |
| Sweden | 12 | 0.3% | View All 16 Rows |
Sex and Age in Fairview
Sex and Age in Fairview
The most populous age groups in Fairview are 40 to 44 Years (254 | 11.5%) for men and 40 to 44 Years (262 | 12.9%) for women.
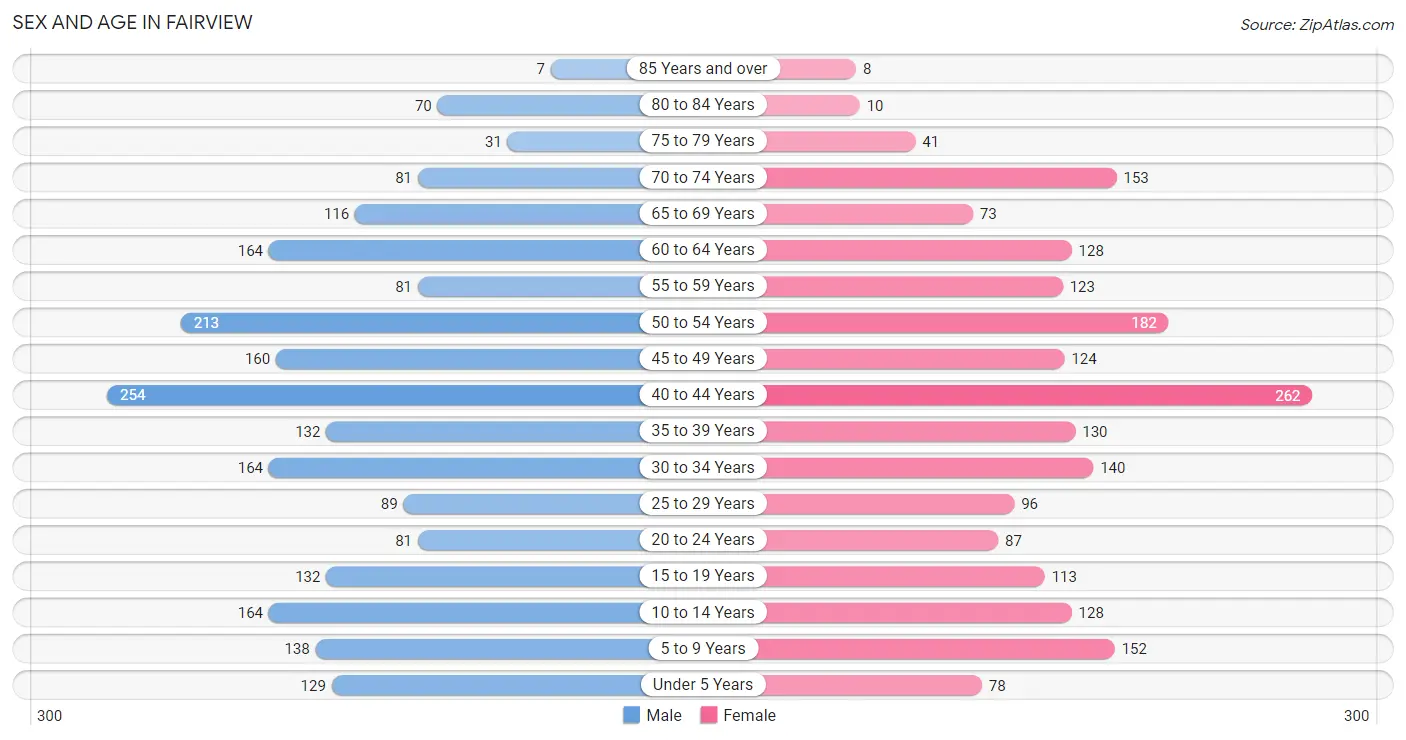
| Age Bracket | Male | Female |
| Under 5 Years | 129 (5.9%) | 78 (3.8%) |
| 5 to 9 Years | 138 (6.3%) | 152 (7.5%) |
| 10 to 14 Years | 164 (7.4%) | 128 (6.3%) |
| 15 to 19 Years | 132 (6.0%) | 113 (5.6%) |
| 20 to 24 Years | 81 (3.7%) | 87 (4.3%) |
| 25 to 29 Years | 89 (4.0%) | 96 (4.7%) |
| 30 to 34 Years | 164 (7.4%) | 140 (6.9%) |
| 35 to 39 Years | 132 (6.0%) | 130 (6.4%) |
| 40 to 44 Years | 254 (11.5%) | 262 (12.9%) |
| 45 to 49 Years | 160 (7.2%) | 124 (6.1%) |
| 50 to 54 Years | 213 (9.7%) | 182 (9.0%) |
| 55 to 59 Years | 81 (3.7%) | 123 (6.1%) |
| 60 to 64 Years | 164 (7.4%) | 128 (6.3%) |
| 65 to 69 Years | 116 (5.3%) | 73 (3.6%) |
| 70 to 74 Years | 81 (3.7%) | 153 (7.5%) |
| 75 to 79 Years | 31 (1.4%) | 41 (2.0%) |
| 80 to 84 Years | 70 (3.2%) | 10 (0.5%) |
| 85 Years and over | 7 (0.3%) | 8 (0.4%) |
| Total | 2,206 (100.0%) | 2,028 (100.0%) |
Families and Households in Fairview
Median Family Size in Fairview
The median family size in Fairview is 3.08 persons per family, with single female/mother families (113 | 8.9%) accounting for the largest median family size of 3.48 persons per family. On the other hand, single male/father families (102 | 8.0%) represent the smallest median family size with 2.48 persons per family.
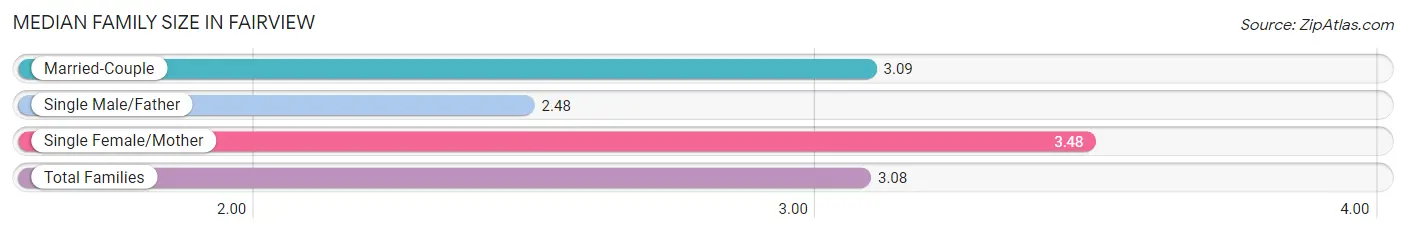
| Family Type | # Families | Family Size |
| Married-Couple | 1,058 (83.1%) | 3.09 |
| Single Male/Father | 102 (8.0%) | 2.48 |
| Single Female/Mother | 113 (8.9%) | 3.48 |
| Total Families | 1,273 (100.0%) | 3.08 |
Median Household Size in Fairview
The median household size in Fairview is 2.94 persons per household, with single female/mother households (113 | 7.9%) accounting for the largest median household size of 3.91 persons per household. non-family households (166 | 11.5%) represent the smallest median household size with 1.43 persons per household.
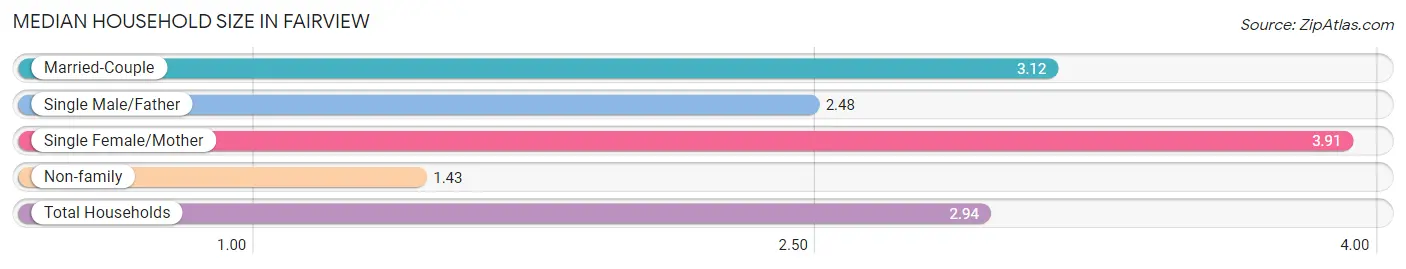
| Household Type | # Households | Household Size |
| Married-Couple | 1,058 (73.5%) | 3.12 |
| Single Male/Father | 102 (7.1%) | 2.48 |
| Single Female/Mother | 113 (7.9%) | 3.91 |
| Non-family | 166 (11.5%) | 1.43 |
| Total Households | 1,439 (100.0%) | 2.94 |
Household Size by Marriage Status in Fairview
Out of a total of 1,439 households in Fairview, 1,273 (88.5%) are family households, while 166 (11.5%) are nonfamily households. The most numerous type of family households are 2-person households, comprising 590, and the most common type of nonfamily households are 1-person households, comprising 98.
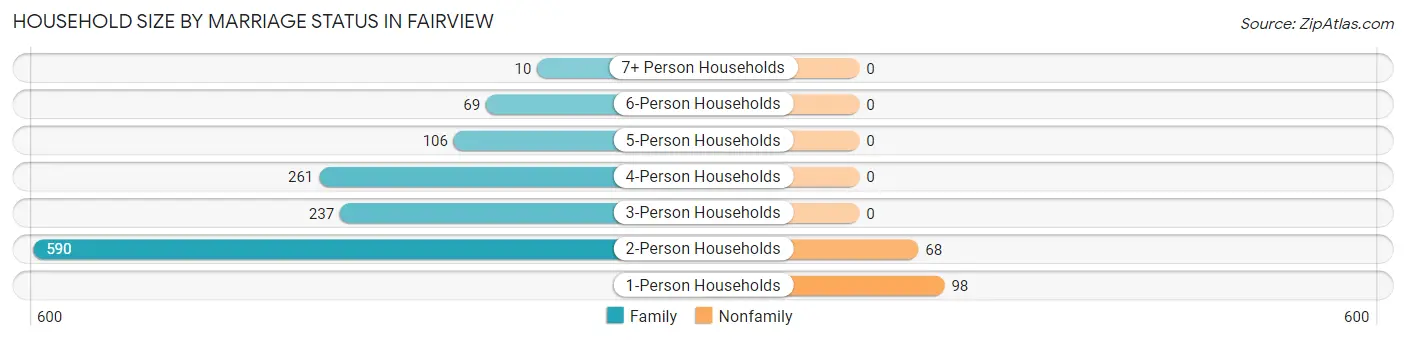
| Household Size | Family Households | Nonfamily Households |
| 1-Person Households | - | 98 (6.8%) |
| 2-Person Households | 590 (41.0%) | 68 (4.7%) |
| 3-Person Households | 237 (16.5%) | 0 (0.0%) |
| 4-Person Households | 261 (18.1%) | 0 (0.0%) |
| 5-Person Households | 106 (7.4%) | 0 (0.0%) |
| 6-Person Households | 69 (4.8%) | 0 (0.0%) |
| 7+ Person Households | 10 (0.7%) | 0 (0.0%) |
| Total | 1,273 (88.5%) | 166 (11.5%) |
Female Fertility in Fairview
Fertility by Age in Fairview
Average fertility rate in Fairview is 30.0 births per 1,000 women. Women in the age bracket of 20 to 34 years have the highest fertility rate with 43.0 births per 1,000 women. Women in the age bracket of 35 to 50 years acount for 53.3% of all women with births.
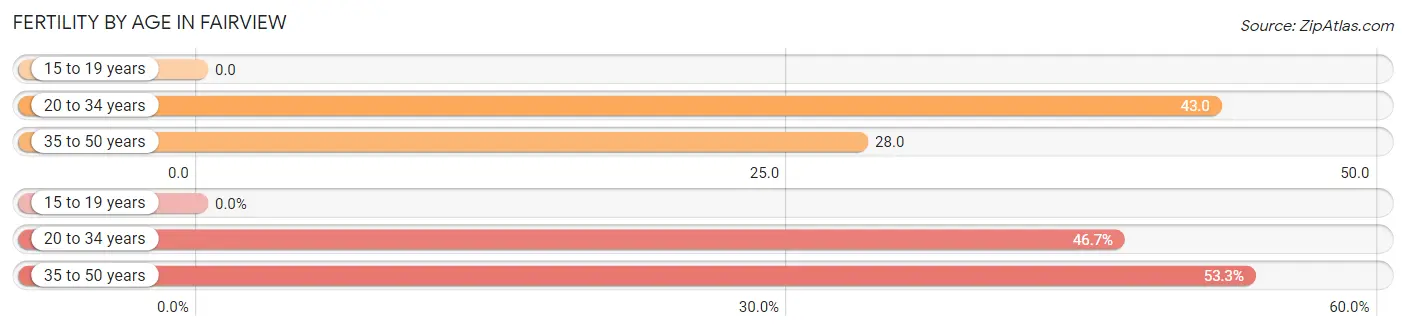
| Age Bracket | Women with Births | Births / 1,000 Women |
| 15 to 19 years | 0 (0.0%) | 0.0 |
| 20 to 34 years | 14 (46.7%) | 43.0 |
| 35 to 50 years | 16 (53.3%) | 28.0 |
| Total | 30 (100.0%) | 30.0 |
Fertility by Age by Marriage Status in Fairview
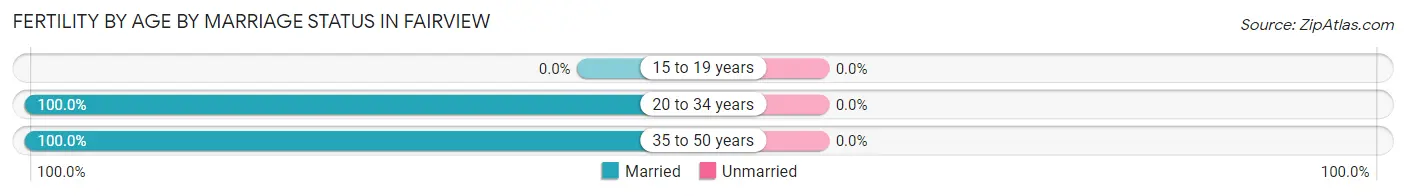
| Age Bracket | Married | Unmarried |
| 15 to 19 years | 0 (0.0%) | 0 (0.0%) |
| 20 to 34 years | 14 (100.0%) | 0 (0.0%) |
| 35 to 50 years | 16 (100.0%) | 0 (0.0%) |
| Total | 30 (100.0%) | 0 (0.0%) |
Fertility by Education in Fairview
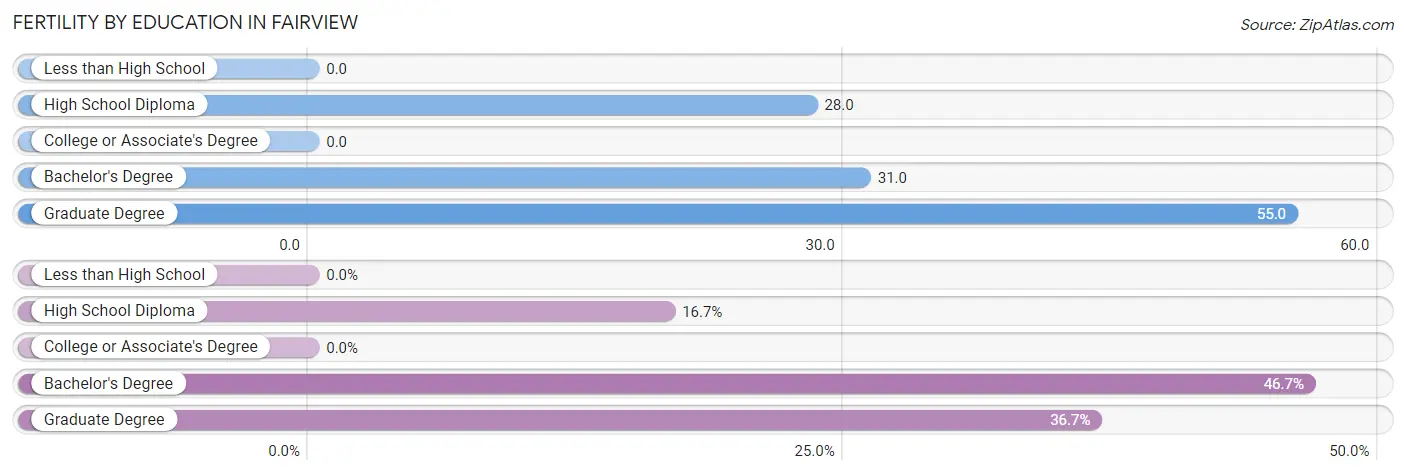
| Educational Attainment | Women with Births | Births / 1,000 Women |
| Less than High School | 0 (0.0%) | 0.0 |
| High School Diploma | 5 (16.7%) | 28.0 |
| College or Associate's Degree | 0 (0.0%) | 0.0 |
| Bachelor's Degree | 14 (46.7%) | 31.0 |
| Graduate Degree | 11 (36.7%) | 55.0 |
| Total | 30 (100.0%) | 30.0 |
Fertility by Education by Marriage Status in Fairview
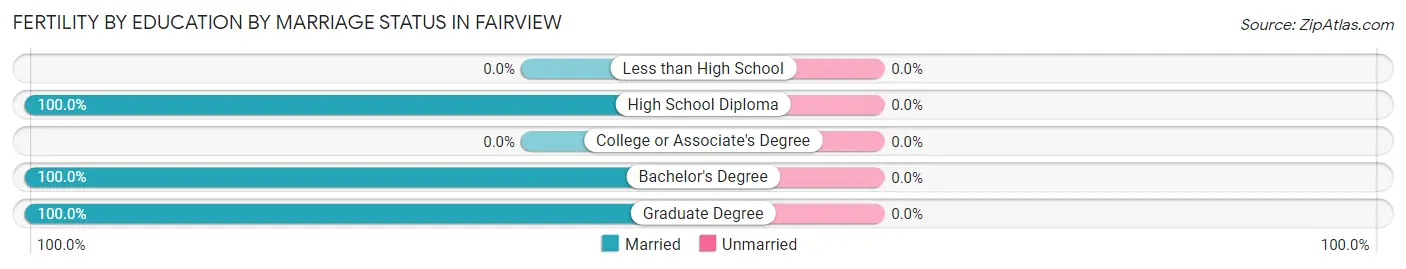
| Educational Attainment | Married | Unmarried |
| Less than High School | 0 (0.0%) | 0 (0.0%) |
| High School Diploma | 5 (100.0%) | 0 (0.0%) |
| College or Associate's Degree | 0 (0.0%) | 0 (0.0%) |
| Bachelor's Degree | 14 (100.0%) | 0 (0.0%) |
| Graduate Degree | 11 (100.0%) | 0 (0.0%) |
| Total | 30 (100.0%) | 0 (0.0%) |
Employment Characteristics in Fairview
Employment by Class of Employer in Fairview
Among the 2,112 employed individuals in Fairview, private company employees (1,712 | 81.1%), not-for-profit organizations (115 | 5.4%), and local government employees (110 | 5.2%) make up the most common classes of employment.
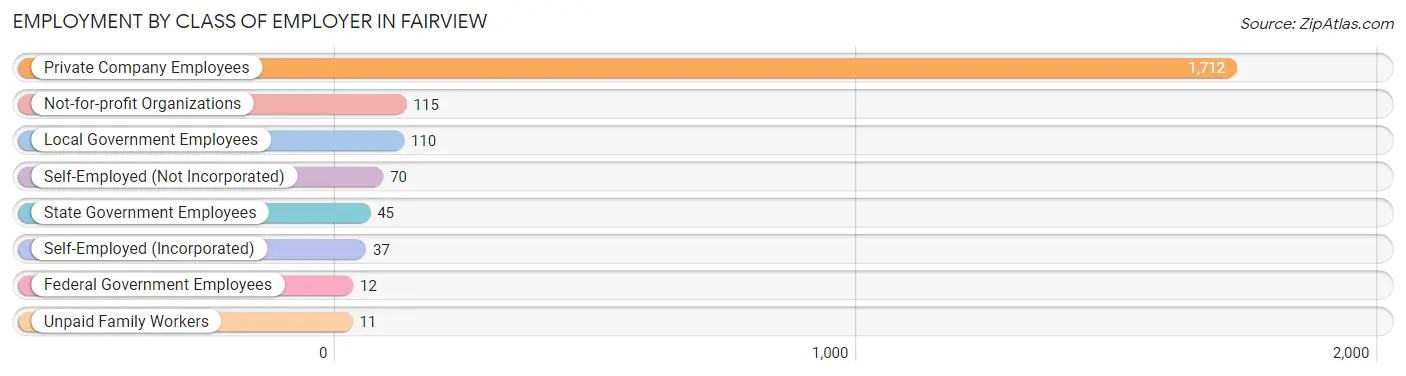
| Employer Class | # Employees | % Employees |
| Private Company Employees | 1,712 | 81.1% |
| Self-Employed (Incorporated) | 37 | 1.8% |
| Self-Employed (Not Incorporated) | 70 | 3.3% |
| Not-for-profit Organizations | 115 | 5.4% |
| Local Government Employees | 110 | 5.2% |
| State Government Employees | 45 | 2.1% |
| Federal Government Employees | 12 | 0.6% |
| Unpaid Family Workers | 11 | 0.5% |
| Total | 2,112 | 100.0% |
Employment Status by Age in Fairview
According to the labor force statistics for Fairview, out of the total population over 16 years of age (3,413), 67.9% or 2,317 individuals are in the labor force, with 6.7% or 155 of them unemployed. The age group with the highest labor force participation rate is 25 to 29 years, with 100.0% or 185 individuals in the labor force. Within the labor force, the 20 to 24 years age range has the highest percentage of unemployed individuals, with 27.5% or 42 of them being unemployed.
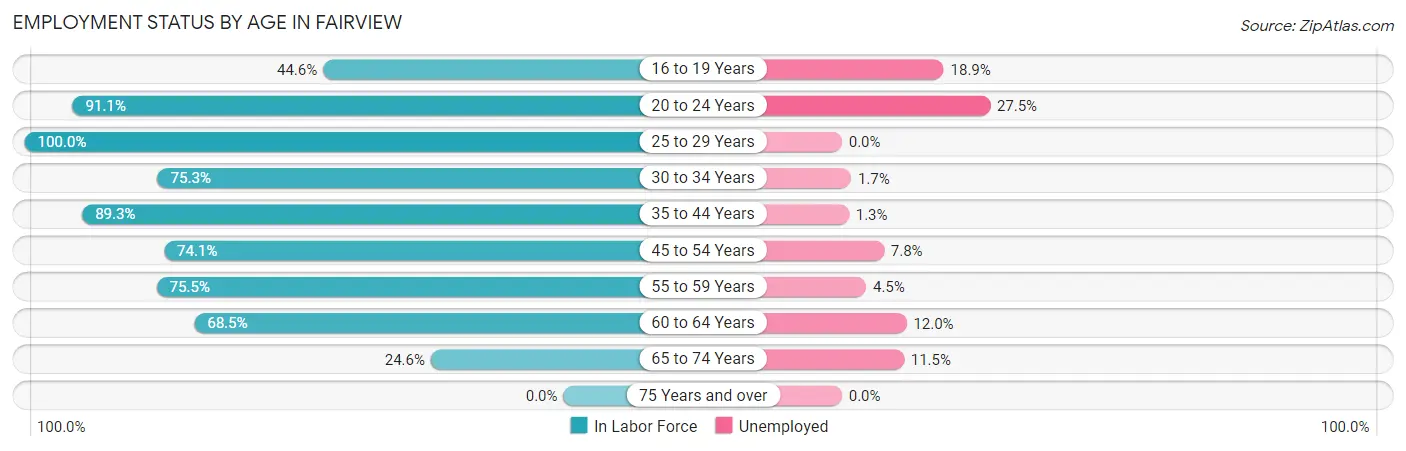
| Age Bracket | In Labor Force | Unemployed |
| 16 to 19 Years | 95 (44.6%) | 18 (18.9%) |
| 20 to 24 Years | 153 (91.1%) | 42 (27.5%) |
| 25 to 29 Years | 185 (100.0%) | 0 (0.0%) |
| 30 to 34 Years | 229 (75.3%) | 4 (1.7%) |
| 35 to 44 Years | 695 (89.3%) | 9 (1.3%) |
| 45 to 54 Years | 503 (74.1%) | 39 (7.8%) |
| 55 to 59 Years | 154 (75.5%) | 7 (4.5%) |
| 60 to 64 Years | 200 (68.5%) | 24 (12.0%) |
| 65 to 74 Years | 104 (24.6%) | 12 (11.5%) |
| 75 Years and over | 0 (0.0%) | 0 (0.0%) |
| Total | 2,317 (67.9%) | 155 (6.7%) |
Employment Status by Educational Attainment in Fairview
According to labor force statistics for Fairview, 80.5% of individuals (1,966) out of the total population between 25 and 64 years of age (2,442) are in the labor force, with 4.2% or 83 of them being unemployed. The group with the highest labor force participation rate are those with the educational attainment of less than high school, with 100.0% or 7 individuals in the labor force. Within the labor force, individuals with less than high school education have the highest percentage of unemployment, with 100.0% or 7 of them being unemployed.
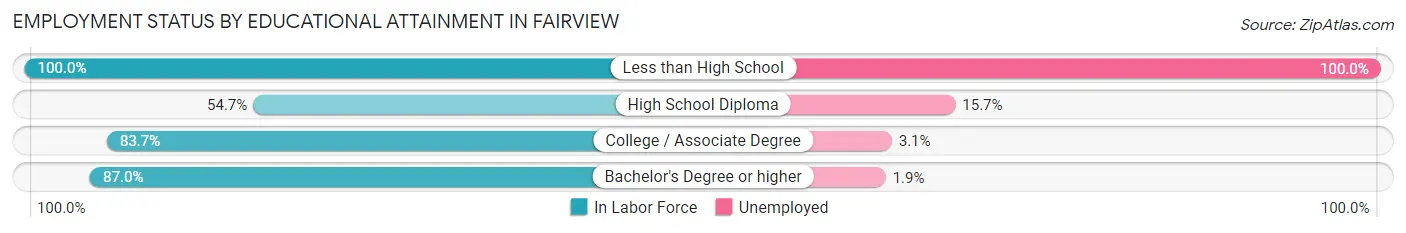
| Educational Attainment | In Labor Force | Unemployed |
| Less than High School | 7 (100.0%) | 7 (100.0%) |
| High School Diploma | 248 (54.7%) | 71 (15.7%) |
| College / Associate Degree | 360 (83.7%) | 13 (3.1%) |
| Bachelor's Degree or higher | 1,350 (87.0%) | 29 (1.9%) |
| Total | 1,966 (80.5%) | 103 (4.2%) |
Employment Occupations by Sex in Fairview
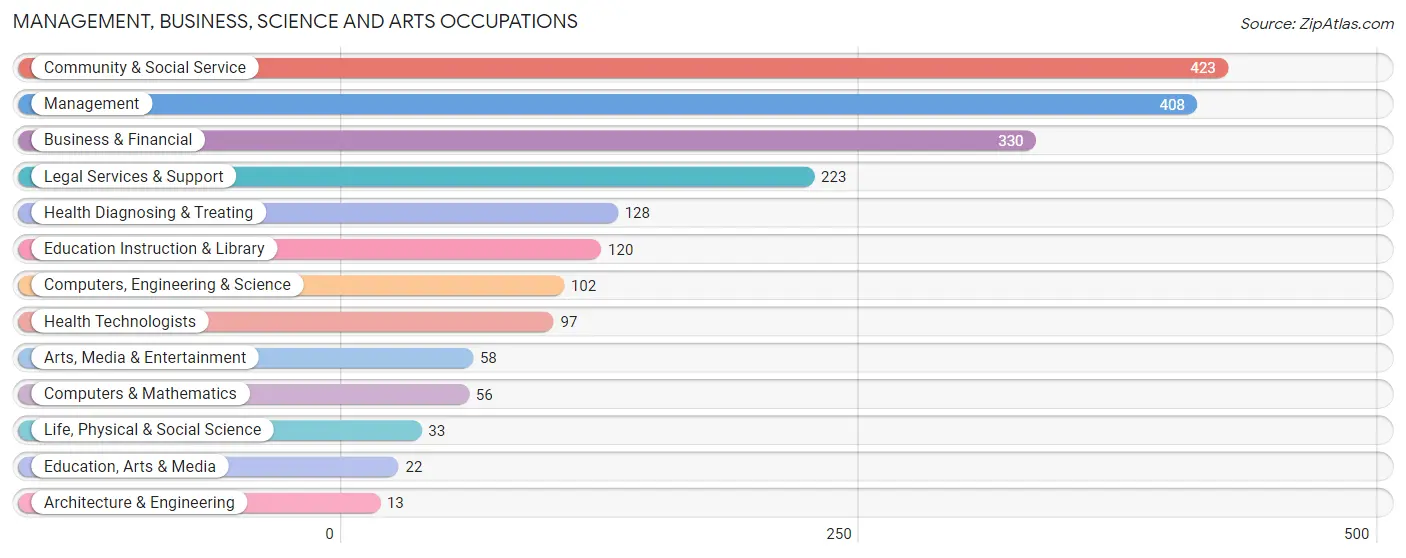
Management, Business, Science and Arts Occupations
The most common Management, Business, Science and Arts occupations in Fairview are Community & Social Service (423 | 19.6%), Management (408 | 18.9%), Business & Financial (330 | 15.3%), Legal Services & Support (223 | 10.3%), and Health Diagnosing & Treating (128 | 5.9%).
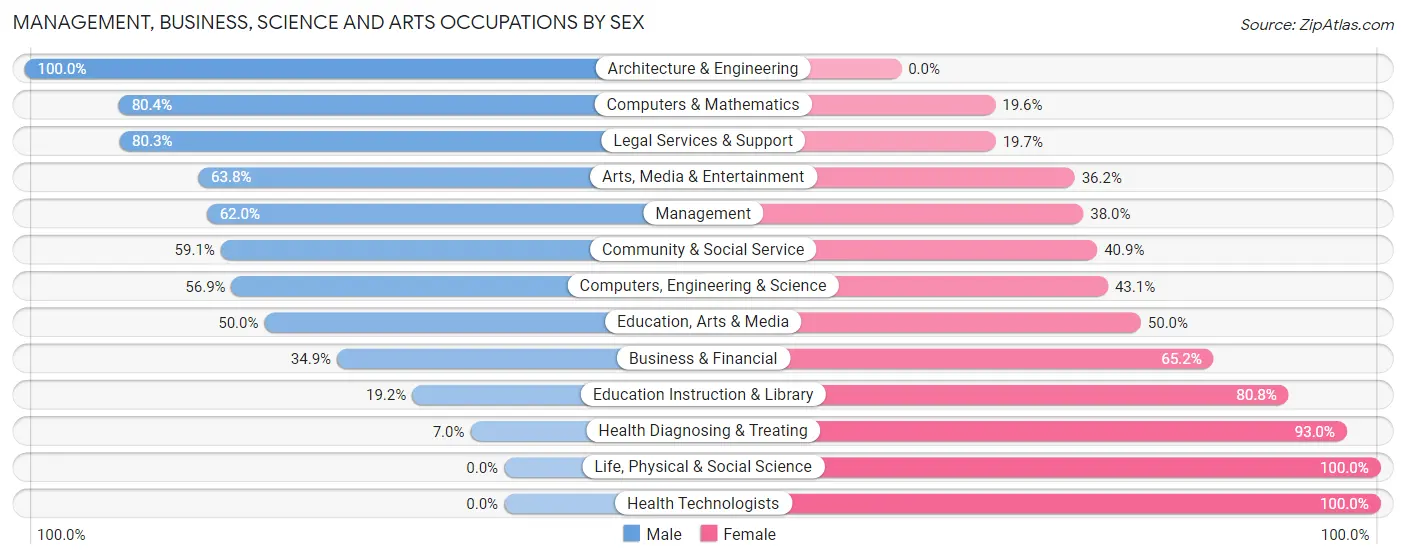
Management, Business, Science and Arts Occupations by Sex
Within the Management, Business, Science and Arts occupations in Fairview, the most male-oriented occupations are Architecture & Engineering (100.0%), Computers & Mathematics (80.4%), and Legal Services & Support (80.3%), while the most female-oriented occupations are Life, Physical & Social Science (100.0%), Health Technologists (100.0%), and Health Diagnosing & Treating (93.0%).
| Occupation | Male | Female |
| Management | 253 (62.0%) | 155 (38.0%) |
| Business & Financial | 115 (34.8%) | 215 (65.1%) |
| Computers, Engineering & Science | 58 (56.9%) | 44 (43.1%) |
| Computers & Mathematics | 45 (80.4%) | 11 (19.6%) |
| Architecture & Engineering | 13 (100.0%) | 0 (0.0%) |
| Life, Physical & Social Science | 0 (0.0%) | 33 (100.0%) |
| Community & Social Service | 250 (59.1%) | 173 (40.9%) |
| Education, Arts & Media | 11 (50.0%) | 11 (50.0%) |
| Legal Services & Support | 179 (80.3%) | 44 (19.7%) |
| Education Instruction & Library | 23 (19.2%) | 97 (80.8%) |
| Arts, Media & Entertainment | 37 (63.8%) | 21 (36.2%) |
| Health Diagnosing & Treating | 9 (7.0%) | 119 (93.0%) |
| Health Technologists | 0 (0.0%) | 97 (100.0%) |
| Total (Category) | 685 (49.2%) | 706 (50.7%) |
| Total (Overall) | 1,079 (49.9%) | 1,084 (50.1%) |
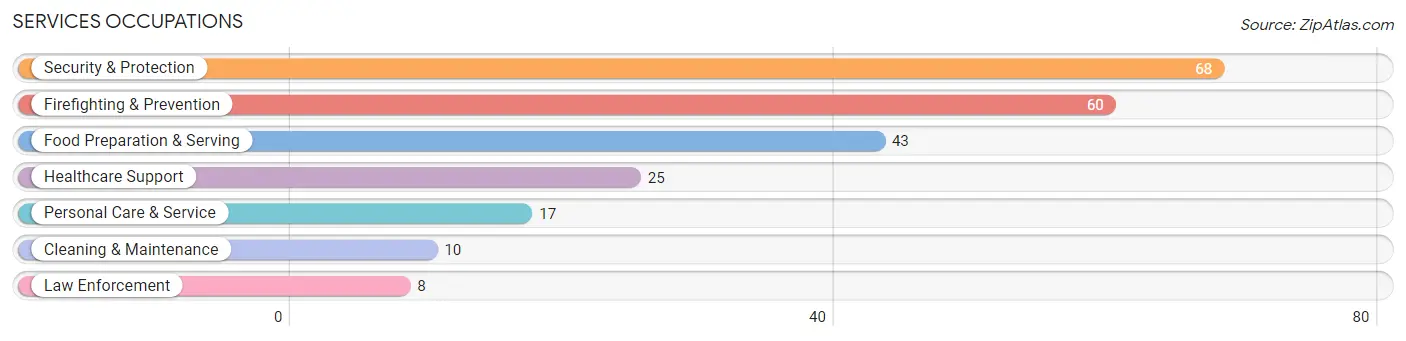
Services Occupations
The most common Services occupations in Fairview are Security & Protection (68 | 3.1%), Firefighting & Prevention (60 | 2.8%), Food Preparation & Serving (43 | 2.0%), Healthcare Support (25 | 1.2%), and Personal Care & Service (17 | 0.8%).
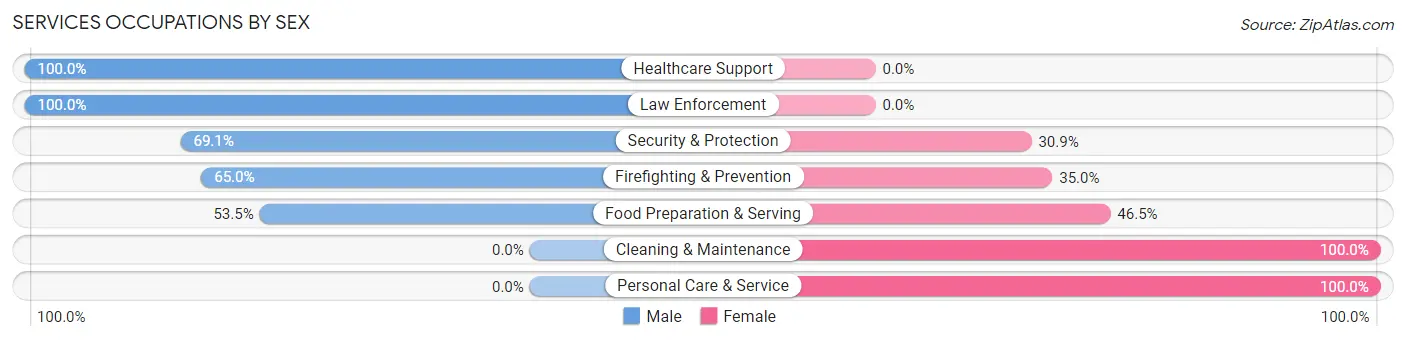
Services Occupations by Sex
Within the Services occupations in Fairview, the most male-oriented occupations are Healthcare Support (100.0%), Law Enforcement (100.0%), and Security & Protection (69.1%), while the most female-oriented occupations are Cleaning & Maintenance (100.0%), Personal Care & Service (100.0%), and Food Preparation & Serving (46.5%).
| Occupation | Male | Female |
| Healthcare Support | 25 (100.0%) | 0 (0.0%) |
| Security & Protection | 47 (69.1%) | 21 (30.9%) |
| Firefighting & Prevention | 39 (65.0%) | 21 (35.0%) |
| Law Enforcement | 8 (100.0%) | 0 (0.0%) |
| Food Preparation & Serving | 23 (53.5%) | 20 (46.5%) |
| Cleaning & Maintenance | 0 (0.0%) | 10 (100.0%) |
| Personal Care & Service | 0 (0.0%) | 17 (100.0%) |
| Total (Category) | 95 (58.3%) | 68 (41.7%) |
| Total (Overall) | 1,079 (49.9%) | 1,084 (50.1%) |
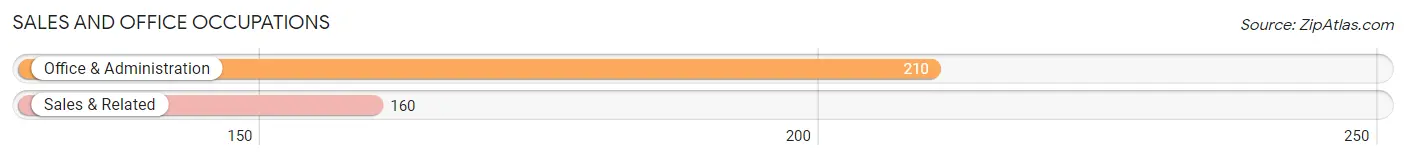
Sales and Office Occupations
The most common Sales and Office occupations in Fairview are Office & Administration (210 | 9.7%), and Sales & Related (160 | 7.4%).
Sales and Office Occupations by Sex
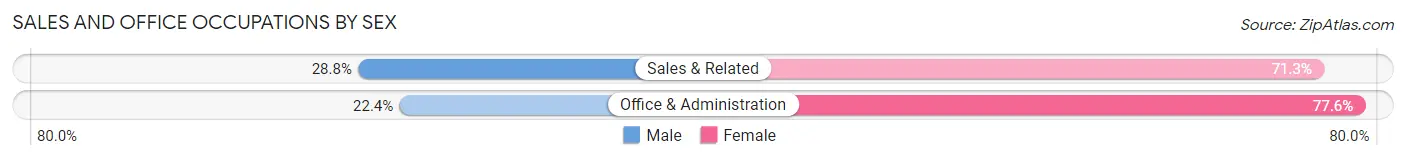
| Occupation | Male | Female |
| Sales & Related | 46 (28.7%) | 114 (71.3%) |
| Office & Administration | 47 (22.4%) | 163 (77.6%) |
| Total (Category) | 93 (25.1%) | 277 (74.9%) |
| Total (Overall) | 1,079 (49.9%) | 1,084 (50.1%) |
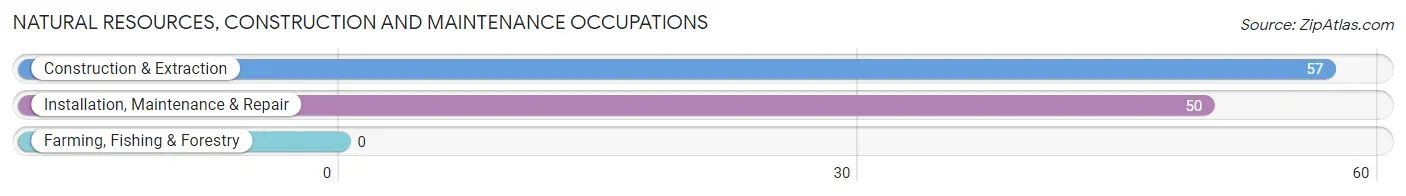
Natural Resources, Construction and Maintenance Occupations
The most common Natural Resources, Construction and Maintenance occupations in Fairview are Construction & Extraction (57 | 2.6%), and Installation, Maintenance & Repair (50 | 2.3%).
Natural Resources, Construction and Maintenance Occupations by Sex
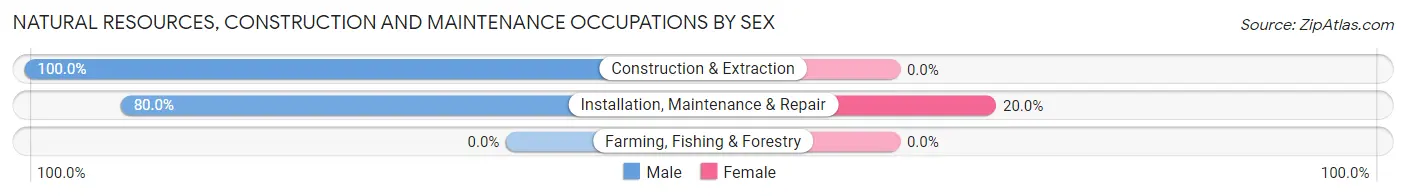
| Occupation | Male | Female |
| Farming, Fishing & Forestry | 0 (0.0%) | 0 (0.0%) |
| Construction & Extraction | 57 (100.0%) | 0 (0.0%) |
| Installation, Maintenance & Repair | 40 (80.0%) | 10 (20.0%) |
| Total (Category) | 97 (90.6%) | 10 (9.3%) |
| Total (Overall) | 1,079 (49.9%) | 1,084 (50.1%) |
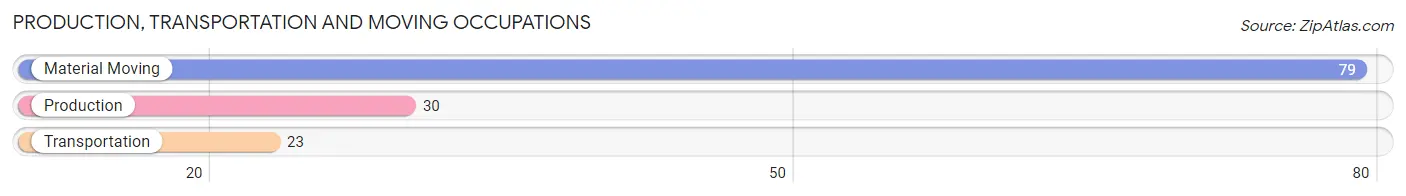
Production, Transportation and Moving Occupations
The most common Production, Transportation and Moving occupations in Fairview are Material Moving (79 | 3.6%), Production (30 | 1.4%), and Transportation (23 | 1.1%).
Production, Transportation and Moving Occupations by Sex
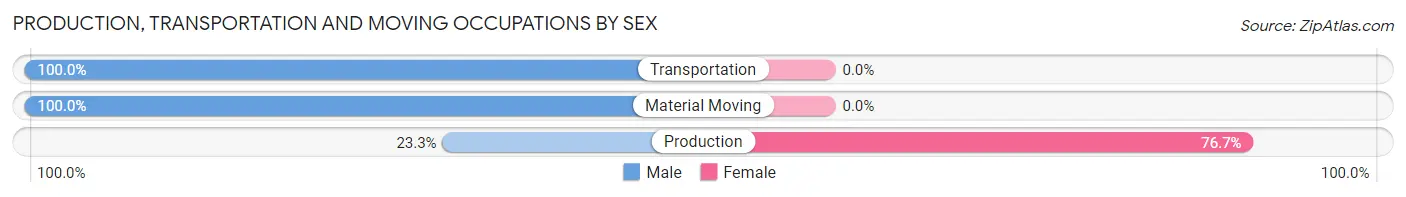
| Occupation | Male | Female |
| Production | 7 (23.3%) | 23 (76.7%) |
| Transportation | 23 (100.0%) | 0 (0.0%) |
| Material Moving | 79 (100.0%) | 0 (0.0%) |
| Total (Category) | 109 (82.6%) | 23 (17.4%) |
| Total (Overall) | 1,079 (49.9%) | 1,084 (50.1%) |
Employment Industries by Sex in Fairview
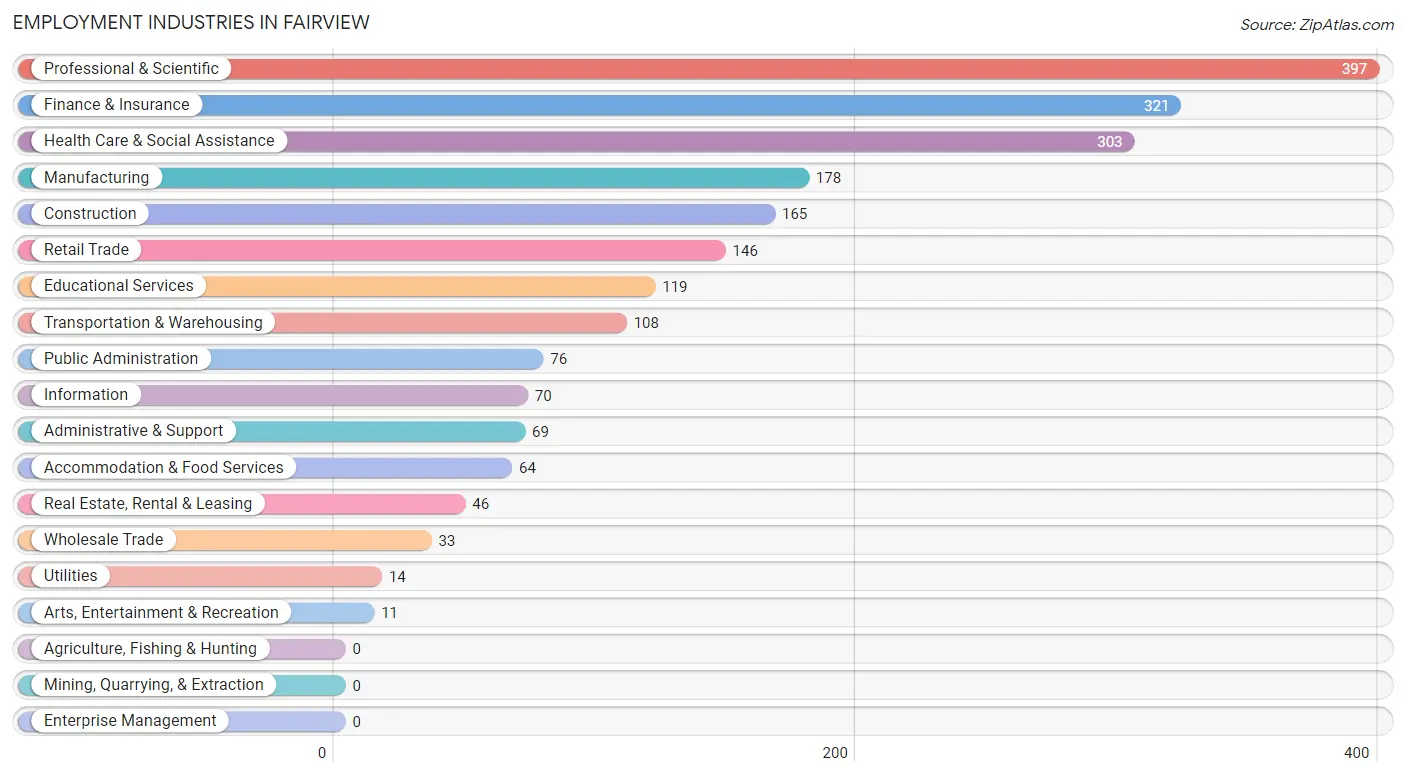
Employment Industries in Fairview
The major employment industries in Fairview include Professional & Scientific (397 | 18.3%), Finance & Insurance (321 | 14.8%), Health Care & Social Assistance (303 | 14.0%), Manufacturing (178 | 8.2%), and Construction (165 | 7.6%).
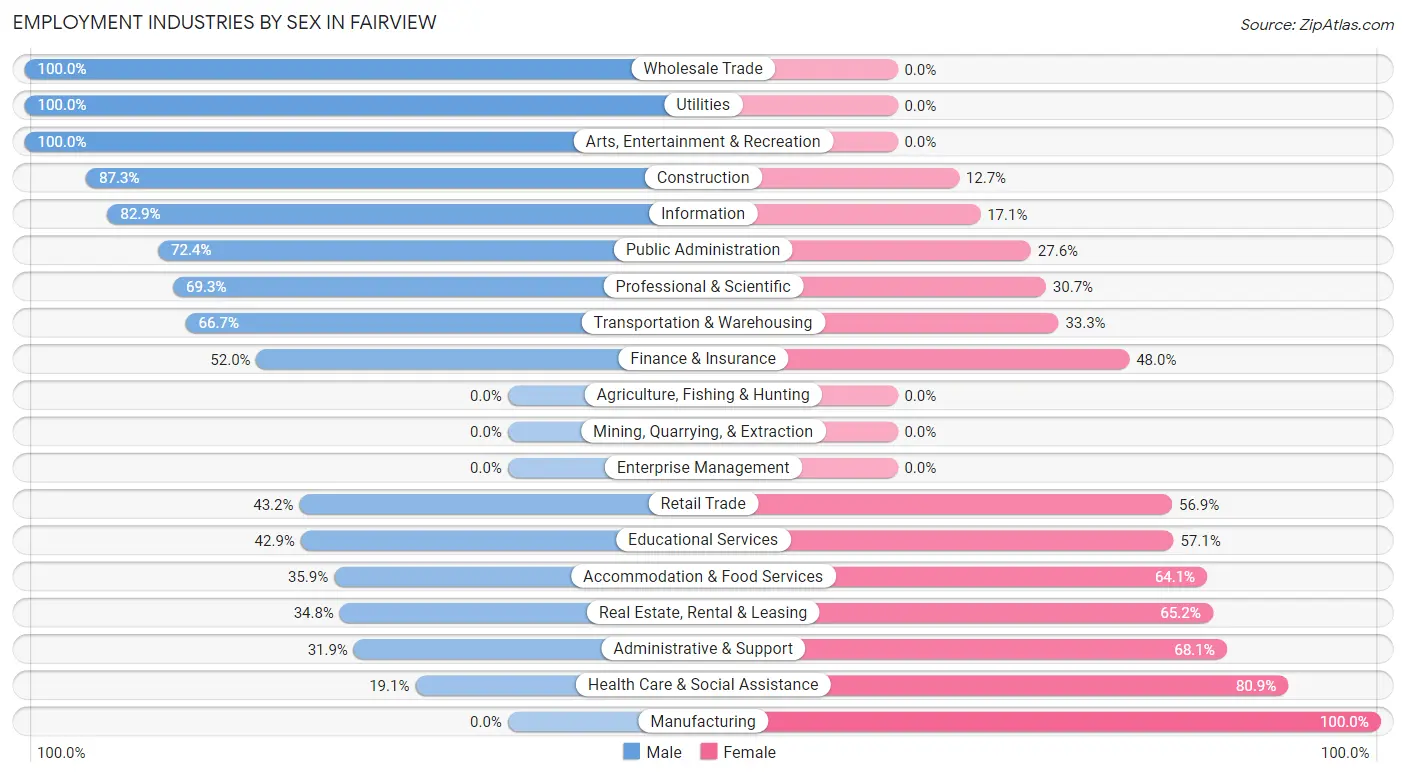
Employment Industries by Sex in Fairview
The Fairview industries that see more men than women are Wholesale Trade (100.0%), Utilities (100.0%), and Arts, Entertainment & Recreation (100.0%), whereas the industries that tend to have a higher number of women are Manufacturing (100.0%), Health Care & Social Assistance (80.9%), and Administrative & Support (68.1%).
| Industry | Male | Female |
| Agriculture, Fishing & Hunting | 0 (0.0%) | 0 (0.0%) |
| Mining, Quarrying, & Extraction | 0 (0.0%) | 0 (0.0%) |
| Construction | 144 (87.3%) | 21 (12.7%) |
| Manufacturing | 0 (0.0%) | 178 (100.0%) |
| Wholesale Trade | 33 (100.0%) | 0 (0.0%) |
| Retail Trade | 63 (43.1%) | 83 (56.9%) |
| Transportation & Warehousing | 72 (66.7%) | 36 (33.3%) |
| Utilities | 14 (100.0%) | 0 (0.0%) |
| Information | 58 (82.9%) | 12 (17.1%) |
| Finance & Insurance | 167 (52.0%) | 154 (48.0%) |
| Real Estate, Rental & Leasing | 16 (34.8%) | 30 (65.2%) |
| Professional & Scientific | 275 (69.3%) | 122 (30.7%) |
| Enterprise Management | 0 (0.0%) | 0 (0.0%) |
| Administrative & Support | 22 (31.9%) | 47 (68.1%) |
| Educational Services | 51 (42.9%) | 68 (57.1%) |
| Health Care & Social Assistance | 58 (19.1%) | 245 (80.9%) |
| Arts, Entertainment & Recreation | 11 (100.0%) | 0 (0.0%) |
| Accommodation & Food Services | 23 (35.9%) | 41 (64.1%) |
| Public Administration | 55 (72.4%) | 21 (27.6%) |
| Total | 1,079 (49.9%) | 1,084 (50.1%) |
Education in Fairview
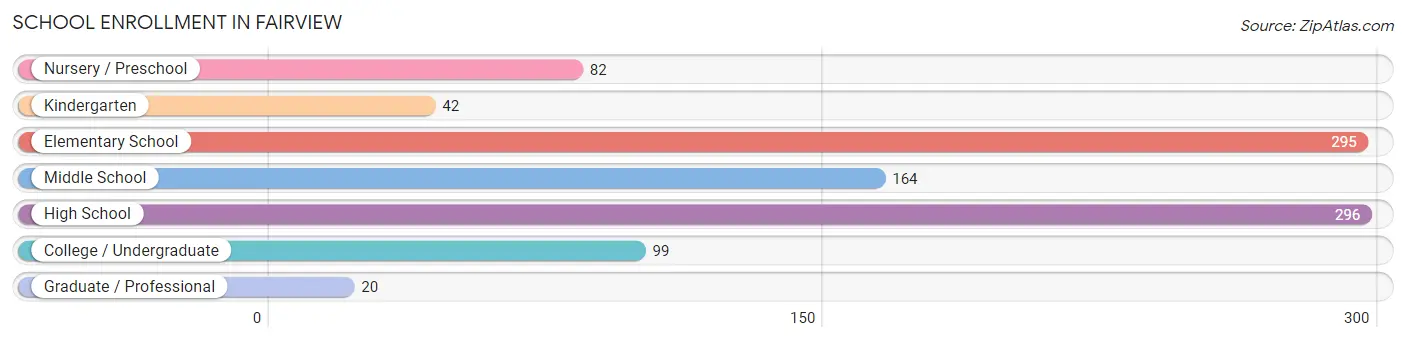
School Enrollment in Fairview
The most common levels of schooling among the 998 students in Fairview are high school (296 | 29.7%), elementary school (295 | 29.6%), and middle school (164 | 16.4%).
| School Level | # Students | % Students |
| Nursery / Preschool | 82 | 8.2% |
| Kindergarten | 42 | 4.2% |
| Elementary School | 295 | 29.6% |
| Middle School | 164 | 16.4% |
| High School | 296 | 29.7% |
| College / Undergraduate | 99 | 9.9% |
| Graduate / Professional | 20 | 2.0% |
| Total | 998 | 100.0% |
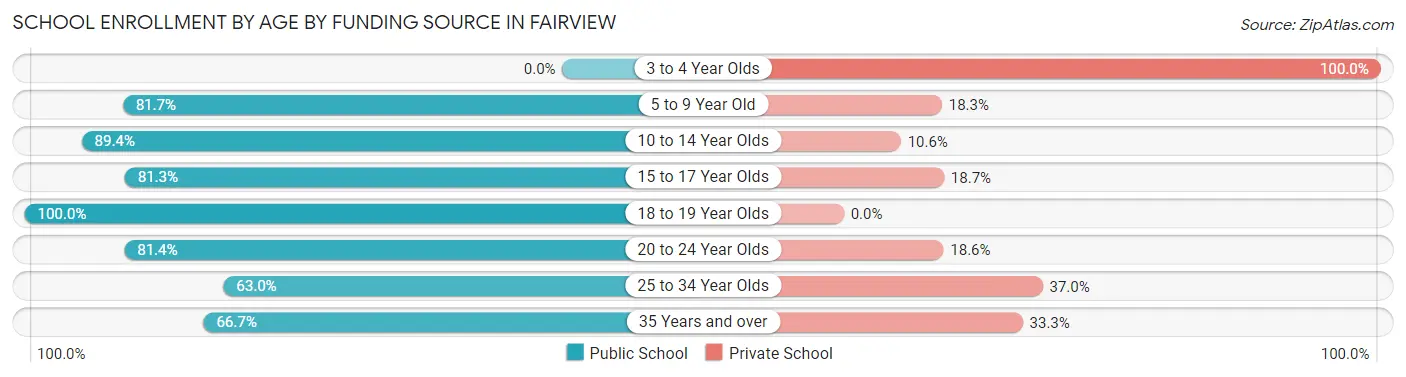
School Enrollment by Age by Funding Source in Fairview
Out of a total of 998 students who are enrolled in schools in Fairview, 194 (19.4%) attend a private institution, while the remaining 804 (80.6%) are enrolled in public schools. The age group of 3 to 4 year olds has the highest likelihood of being enrolled in private schools, with 47 (100.0% in the age bracket) enrolled. Conversely, the age group of 18 to 19 year olds has the lowest likelihood of being enrolled in a private school, with 79 (100.0% in the age bracket) attending a public institution.
| Age Bracket | Public School | Private School |
| 3 to 4 Year Olds | 0 (0.0%) | 47 (100.0%) |
| 5 to 9 Year Old | 237 (81.7%) | 53 (18.3%) |
| 10 to 14 Year Olds | 261 (89.4%) | 31 (10.6%) |
| 15 to 17 Year Olds | 135 (81.3%) | 31 (18.7%) |
| 18 to 19 Year Olds | 79 (100.0%) | 0 (0.0%) |
| 20 to 24 Year Olds | 57 (81.4%) | 13 (18.6%) |
| 25 to 34 Year Olds | 17 (63.0%) | 10 (37.0%) |
| 35 Years and over | 18 (66.7%) | 9 (33.3%) |
| Total | 804 (80.6%) | 194 (19.4%) |
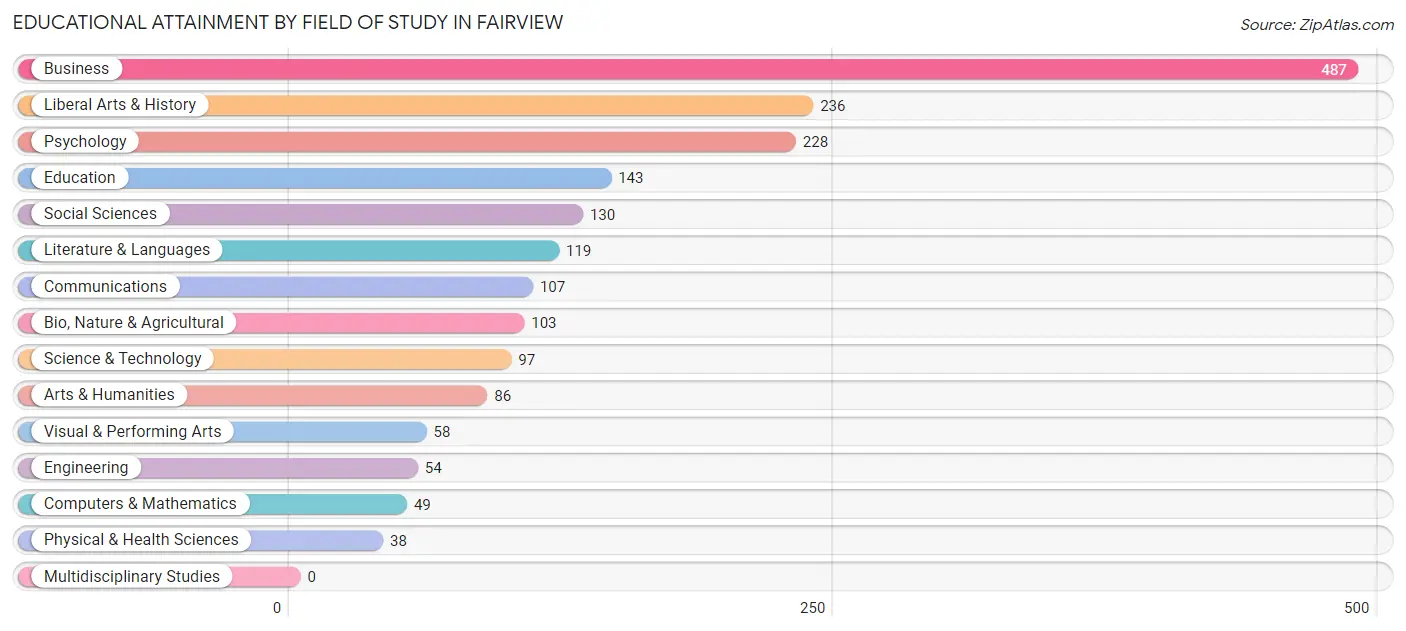
Educational Attainment by Field of Study in Fairview
Business (487 | 25.2%), liberal arts & history (236 | 12.2%), psychology (228 | 11.8%), education (143 | 7.4%), and social sciences (130 | 6.7%) are the most common fields of study among 1,935 individuals in Fairview who have obtained a bachelor's degree or higher.
| Field of Study | # Graduates | % Graduates |
| Computers & Mathematics | 49 | 2.5% |
| Bio, Nature & Agricultural | 103 | 5.3% |
| Physical & Health Sciences | 38 | 2.0% |
| Psychology | 228 | 11.8% |
| Social Sciences | 130 | 6.7% |
| Engineering | 54 | 2.8% |
| Multidisciplinary Studies | 0 | 0.0% |
| Science & Technology | 97 | 5.0% |
| Business | 487 | 25.2% |
| Education | 143 | 7.4% |
| Literature & Languages | 119 | 6.1% |
| Liberal Arts & History | 236 | 12.2% |
| Visual & Performing Arts | 58 | 3.0% |
| Communications | 107 | 5.5% |
| Arts & Humanities | 86 | 4.4% |
| Total | 1,935 | 100.0% |
Transportation & Commute in Fairview
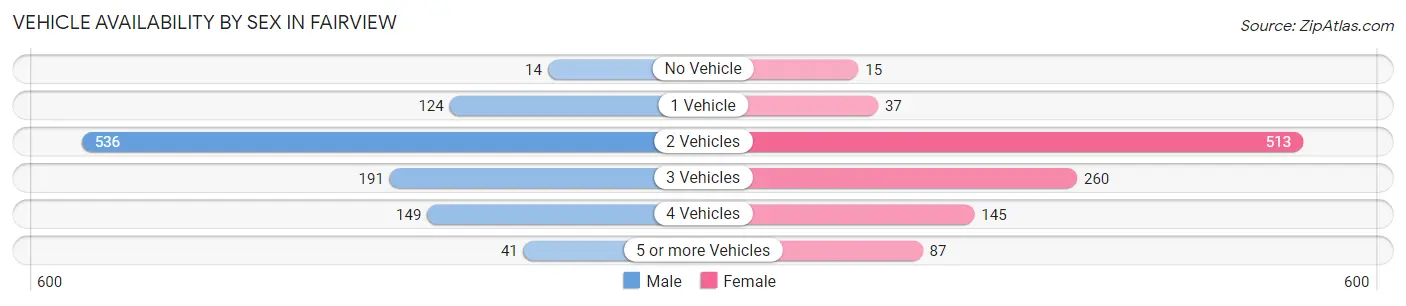
Vehicle Availability by Sex in Fairview
The most prevalent vehicle ownership categories in Fairview are males with 2 vehicles (536, accounting for 50.8%) and females with 2 vehicles (513, making up 50.7%).
| Vehicles Available | Male | Female |
| No Vehicle | 14 (1.3%) | 15 (1.4%) |
| 1 Vehicle | 124 (11.7%) | 37 (3.5%) |
| 2 Vehicles | 536 (50.8%) | 513 (48.5%) |
| 3 Vehicles | 191 (18.1%) | 260 (24.6%) |
| 4 Vehicles | 149 (14.1%) | 145 (13.7%) |
| 5 or more Vehicles | 41 (3.9%) | 87 (8.2%) |
| Total | 1,055 (100.0%) | 1,057 (100.0%) |
Commute Time in Fairview
The most frequently occuring commute durations in Fairview are 60 to 89 minutes (341 commuters, 18.1%), 10 to 14 minutes (242 commuters, 12.8%), and 35 to 39 minutes (217 commuters, 11.5%).
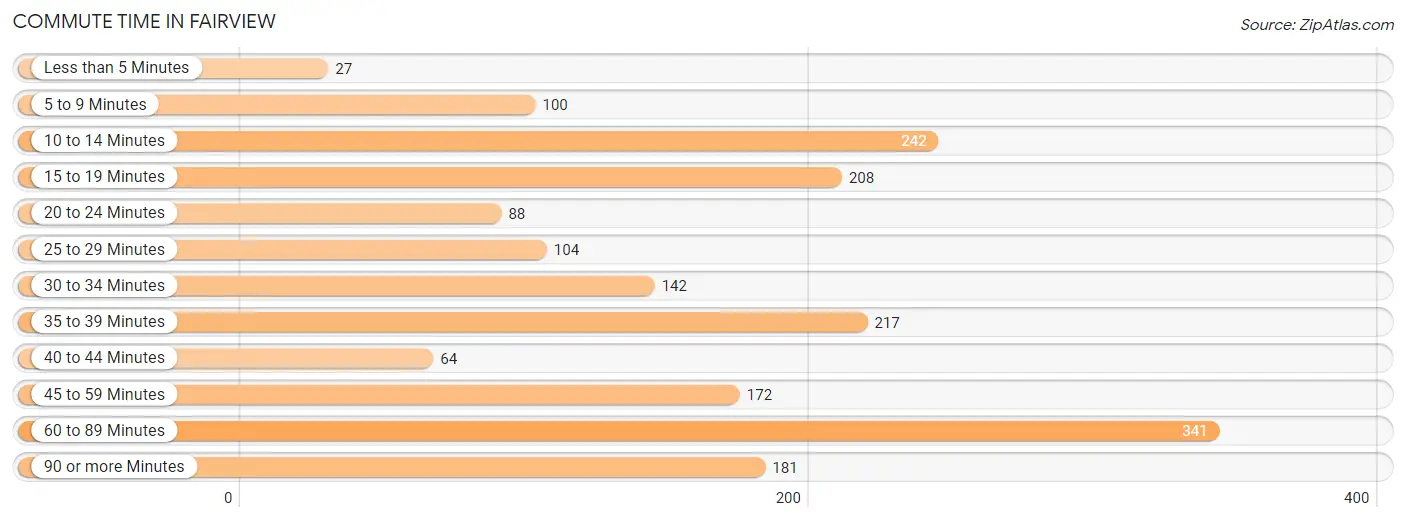
| Commute Time | # Commuters | % Commuters |
| Less than 5 Minutes | 27 | 1.4% |
| 5 to 9 Minutes | 100 | 5.3% |
| 10 to 14 Minutes | 242 | 12.8% |
| 15 to 19 Minutes | 208 | 11.0% |
| 20 to 24 Minutes | 88 | 4.7% |
| 25 to 29 Minutes | 104 | 5.5% |
| 30 to 34 Minutes | 142 | 7.5% |
| 35 to 39 Minutes | 217 | 11.5% |
| 40 to 44 Minutes | 64 | 3.4% |
| 45 to 59 Minutes | 172 | 9.1% |
| 60 to 89 Minutes | 341 | 18.1% |
| 90 or more Minutes | 181 | 9.6% |
Commute Time by Sex in Fairview
The most common commute times in Fairview are 60 to 89 minutes (302 commuters, 31.5%) for males and 15 to 19 minutes (150 commuters, 16.2%) for females.
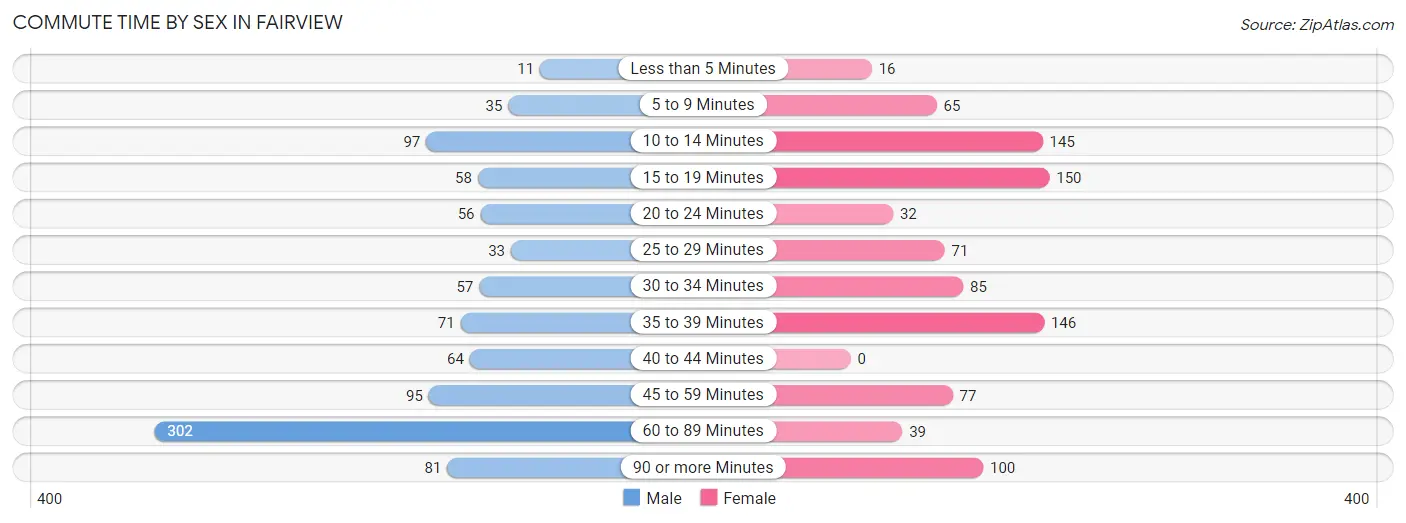
| Commute Time | Male | Female |
| Less than 5 Minutes | 11 (1.1%) | 16 (1.7%) |
| 5 to 9 Minutes | 35 (3.6%) | 65 (7.0%) |
| 10 to 14 Minutes | 97 (10.1%) | 145 (15.7%) |
| 15 to 19 Minutes | 58 (6.0%) | 150 (16.2%) |
| 20 to 24 Minutes | 56 (5.8%) | 32 (3.5%) |
| 25 to 29 Minutes | 33 (3.4%) | 71 (7.7%) |
| 30 to 34 Minutes | 57 (5.9%) | 85 (9.2%) |
| 35 to 39 Minutes | 71 (7.4%) | 146 (15.8%) |
| 40 to 44 Minutes | 64 (6.7%) | 0 (0.0%) |
| 45 to 59 Minutes | 95 (9.9%) | 77 (8.3%) |
| 60 to 89 Minutes | 302 (31.5%) | 39 (4.2%) |
| 90 or more Minutes | 81 (8.4%) | 100 (10.8%) |
Time of Departure to Work by Sex in Fairview
The most frequent times of departure to work in Fairview are 8:00 AM to 8:29 AM (316, 32.9%) for males and 7:30 AM to 7:59 AM (191, 20.6%) for females.
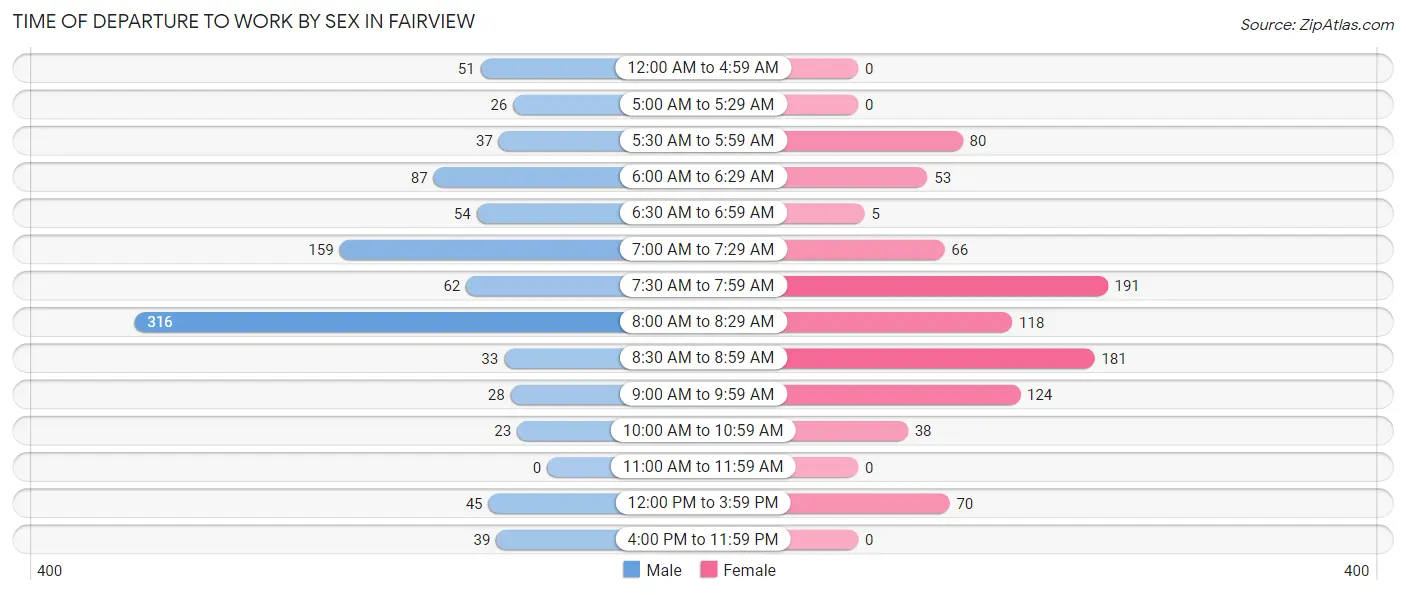
| Time of Departure | Male | Female |
| 12:00 AM to 4:59 AM | 51 (5.3%) | 0 (0.0%) |
| 5:00 AM to 5:29 AM | 26 (2.7%) | 0 (0.0%) |
| 5:30 AM to 5:59 AM | 37 (3.8%) | 80 (8.6%) |
| 6:00 AM to 6:29 AM | 87 (9.1%) | 53 (5.7%) |
| 6:30 AM to 6:59 AM | 54 (5.6%) | 5 (0.5%) |
| 7:00 AM to 7:29 AM | 159 (16.6%) | 66 (7.1%) |
| 7:30 AM to 7:59 AM | 62 (6.5%) | 191 (20.6%) |
| 8:00 AM to 8:29 AM | 316 (32.9%) | 118 (12.7%) |
| 8:30 AM to 8:59 AM | 33 (3.4%) | 181 (19.6%) |
| 9:00 AM to 9:59 AM | 28 (2.9%) | 124 (13.4%) |
| 10:00 AM to 10:59 AM | 23 (2.4%) | 38 (4.1%) |
| 11:00 AM to 11:59 AM | 0 (0.0%) | 0 (0.0%) |
| 12:00 PM to 3:59 PM | 45 (4.7%) | 70 (7.6%) |
| 4:00 PM to 11:59 PM | 39 (4.1%) | 0 (0.0%) |
| Total | 960 (100.0%) | 926 (100.0%) |
Housing Occupancy in Fairview
Occupancy by Ownership in Fairview
Of the total 1,439 dwellings in Fairview, owner-occupied units account for 1,322 (91.9%), while renter-occupied units make up 117 (8.1%).
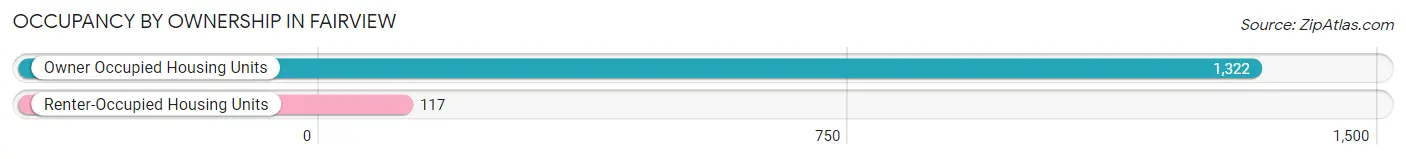
| Occupancy | # Housing Units | % Housing Units |
| Owner Occupied Housing Units | 1,322 | 91.9% |
| Renter-Occupied Housing Units | 117 | 8.1% |
| Total Occupied Housing Units | 1,439 | 100.0% |
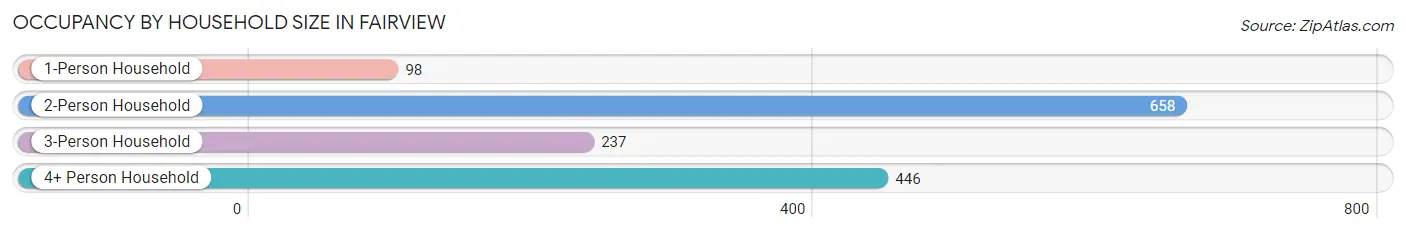
Occupancy by Household Size in Fairview
| Household Size | # Housing Units | % Housing Units |
| 1-Person Household | 98 | 6.8% |
| 2-Person Household | 658 | 45.7% |
| 3-Person Household | 237 | 16.5% |
| 4+ Person Household | 446 | 31.0% |
| Total Housing Units | 1,439 | 100.0% |
Occupancy by Ownership by Household Size in Fairview
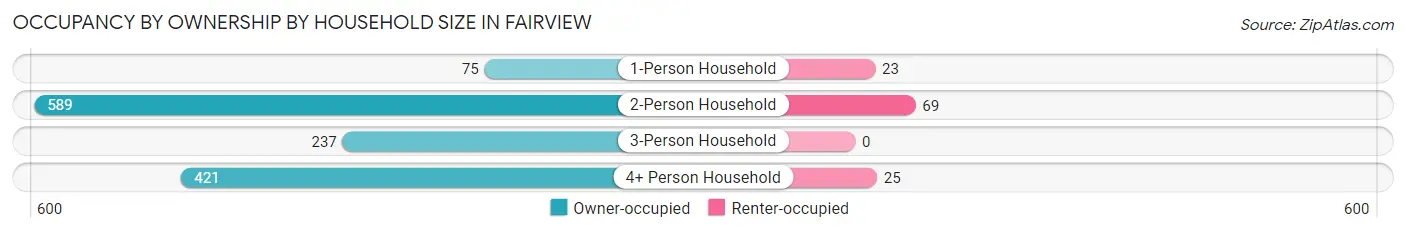
| Household Size | Owner-occupied | Renter-occupied |
| 1-Person Household | 75 (76.5%) | 23 (23.5%) |
| 2-Person Household | 589 (89.5%) | 69 (10.5%) |
| 3-Person Household | 237 (100.0%) | 0 (0.0%) |
| 4+ Person Household | 421 (94.4%) | 25 (5.6%) |
| Total Housing Units | 1,322 (91.9%) | 117 (8.1%) |
Occupancy by Educational Attainment in Fairview
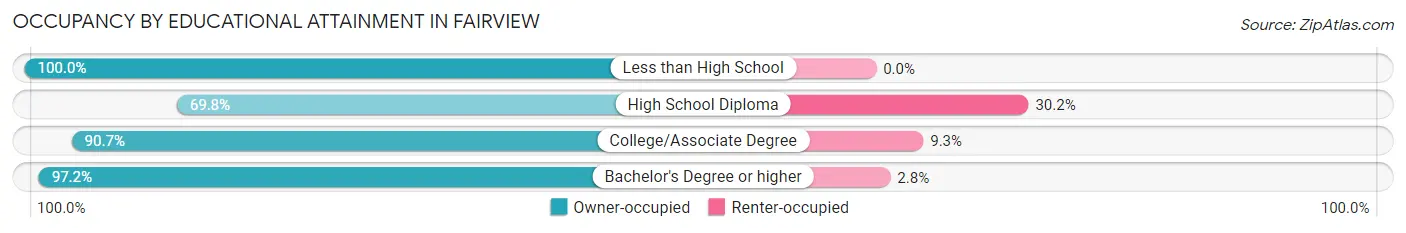
| Household Size | Owner-occupied | Renter-occupied |
| Less than High School | 18 (100.0%) | 0 (0.0%) |
| High School Diploma | 141 (69.8%) | 61 (30.2%) |
| College/Associate Degree | 301 (90.7%) | 31 (9.3%) |
| Bachelor's Degree or higher | 862 (97.2%) | 25 (2.8%) |
Occupancy by Age of Householder in Fairview
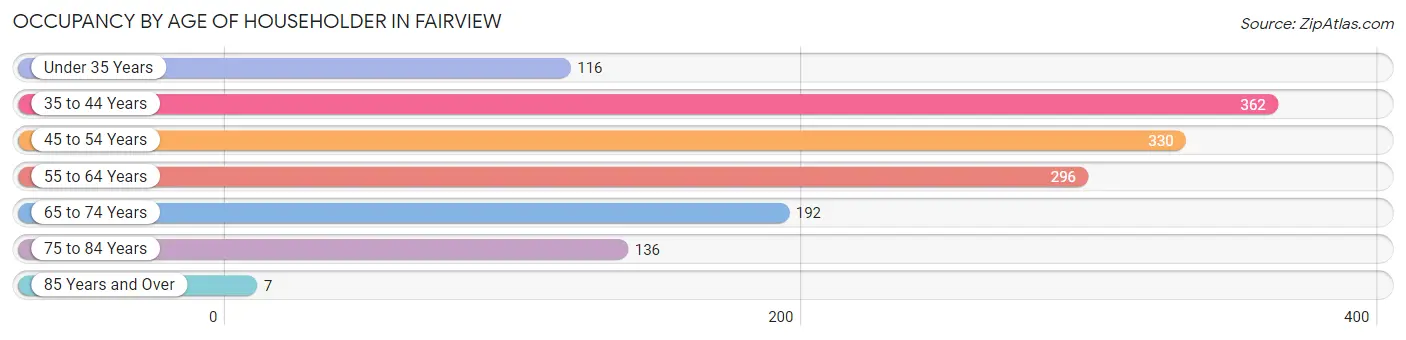
| Age Bracket | # Households | % Households |
| Under 35 Years | 116 | 8.1% |
| 35 to 44 Years | 362 | 25.2% |
| 45 to 54 Years | 330 | 22.9% |
| 55 to 64 Years | 296 | 20.6% |
| 65 to 74 Years | 192 | 13.3% |
| 75 to 84 Years | 136 | 9.5% |
| 85 Years and Over | 7 | 0.5% |
| Total | 1,439 | 100.0% |
Housing Finances in Fairview
Median Income by Occupancy in Fairview
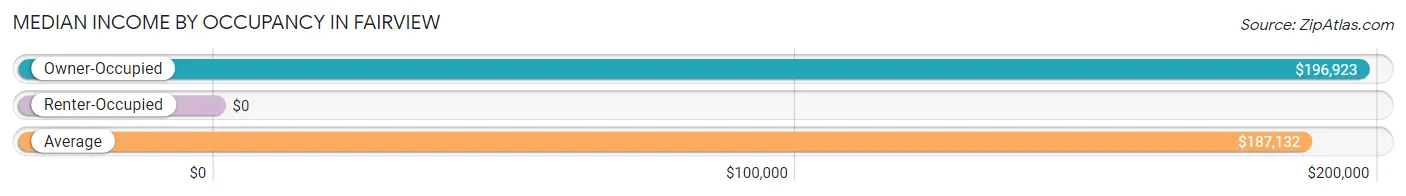
| Occupancy Type | # Households | Median Income |
| Owner-Occupied | 1,322 (91.9%) | $196,923 |
| Renter-Occupied | 117 (8.1%) | $0 |
| Average | 1,439 (100.0%) | $187,132 |
Occupancy by Householder Income Bracket in Fairview
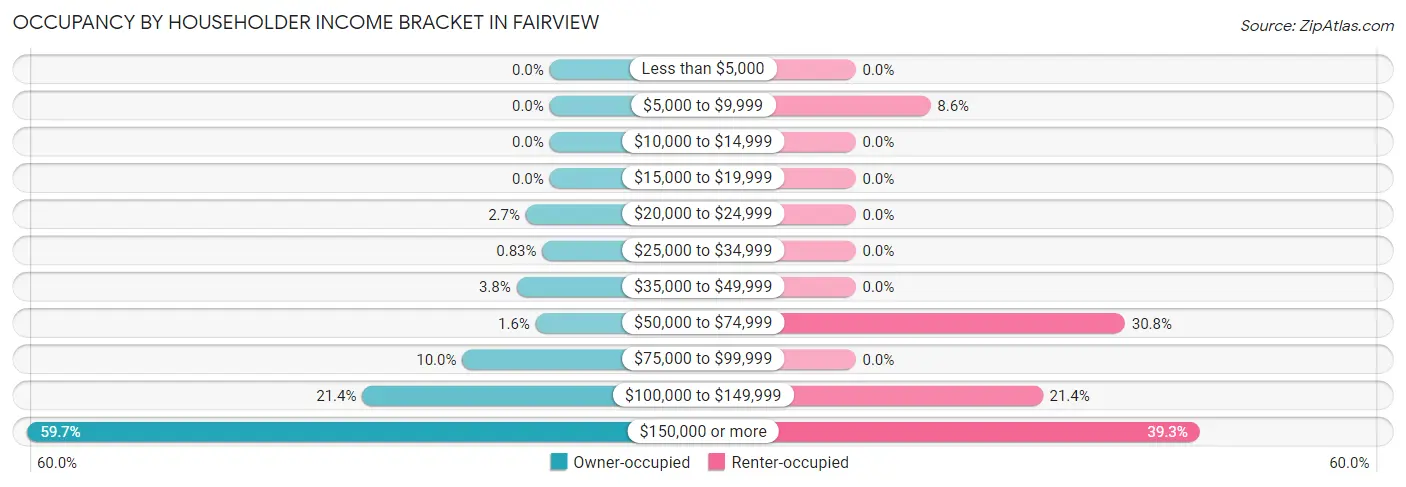
| Income Bracket | Owner-occupied | Renter-occupied |
| Less than $5,000 | 0 (0.0%) | 0 (0.0%) |
| $5,000 to $9,999 | 0 (0.0%) | 10 (8.6%) |
| $10,000 to $14,999 | 0 (0.0%) | 0 (0.0%) |
| $15,000 to $19,999 | 0 (0.0%) | 0 (0.0%) |
| $20,000 to $24,999 | 36 (2.7%) | 0 (0.0%) |
| $25,000 to $34,999 | 11 (0.8%) | 0 (0.0%) |
| $35,000 to $49,999 | 50 (3.8%) | 0 (0.0%) |
| $50,000 to $74,999 | 21 (1.6%) | 36 (30.8%) |
| $75,000 to $99,999 | 132 (10.0%) | 0 (0.0%) |
| $100,000 to $149,999 | 283 (21.4%) | 25 (21.4%) |
| $150,000 or more | 789 (59.7%) | 46 (39.3%) |
| Total | 1,322 (100.0%) | 117 (100.0%) |
Monthly Housing Cost Tiers in Fairview
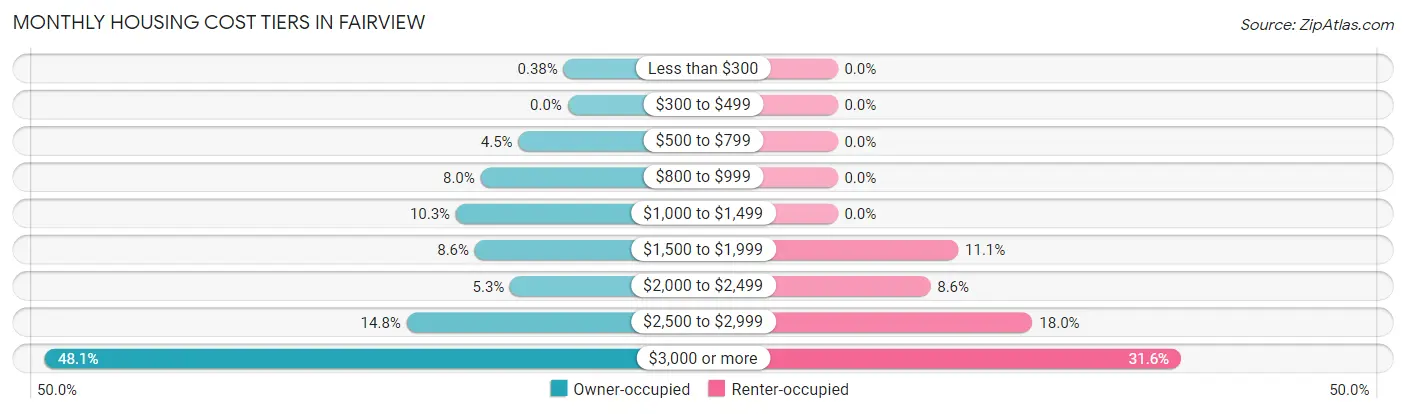
| Monthly Cost | Owner-occupied | Renter-occupied |
| Less than $300 | 5 (0.4%) | 0 (0.0%) |
| $300 to $499 | 0 (0.0%) | 0 (0.0%) |
| $500 to $799 | 60 (4.5%) | 0 (0.0%) |
| $800 to $999 | 106 (8.0%) | 0 (0.0%) |
| $1,000 to $1,499 | 136 (10.3%) | 0 (0.0%) |
| $1,500 to $1,999 | 113 (8.6%) | 13 (11.1%) |
| $2,000 to $2,499 | 70 (5.3%) | 10 (8.6%) |
| $2,500 to $2,999 | 196 (14.8%) | 21 (17.9%) |
| $3,000 or more | 636 (48.1%) | 37 (31.6%) |
| Total | 1,322 (100.0%) | 117 (100.0%) |
Physical Housing Characteristics in Fairview
Housing Structures in Fairview
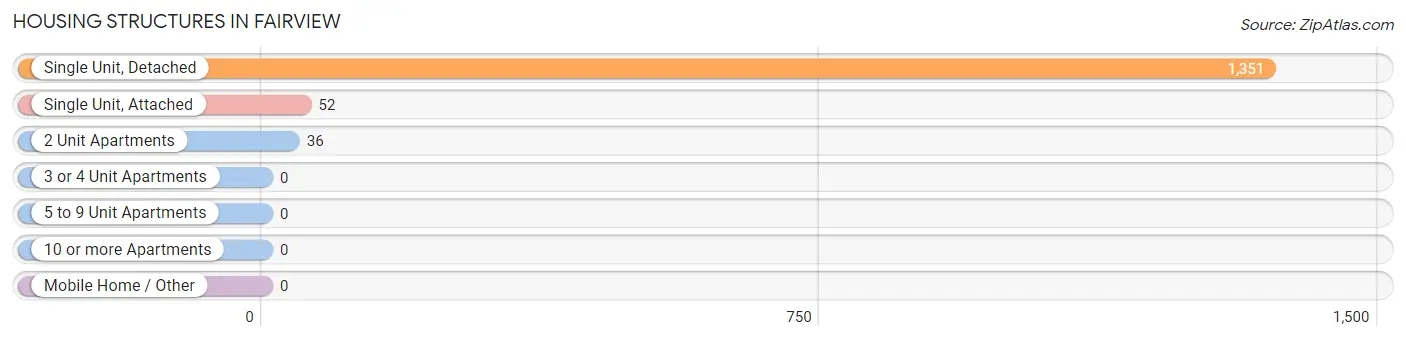
| Structure Type | # Housing Units | % Housing Units |
| Single Unit, Detached | 1,351 | 93.9% |
| Single Unit, Attached | 52 | 3.6% |
| 2 Unit Apartments | 36 | 2.5% |
| 3 or 4 Unit Apartments | 0 | 0.0% |
| 5 to 9 Unit Apartments | 0 | 0.0% |
| 10 or more Apartments | 0 | 0.0% |
| Mobile Home / Other | 0 | 0.0% |
| Total | 1,439 | 100.0% |
Housing Structures by Occupancy in Fairview
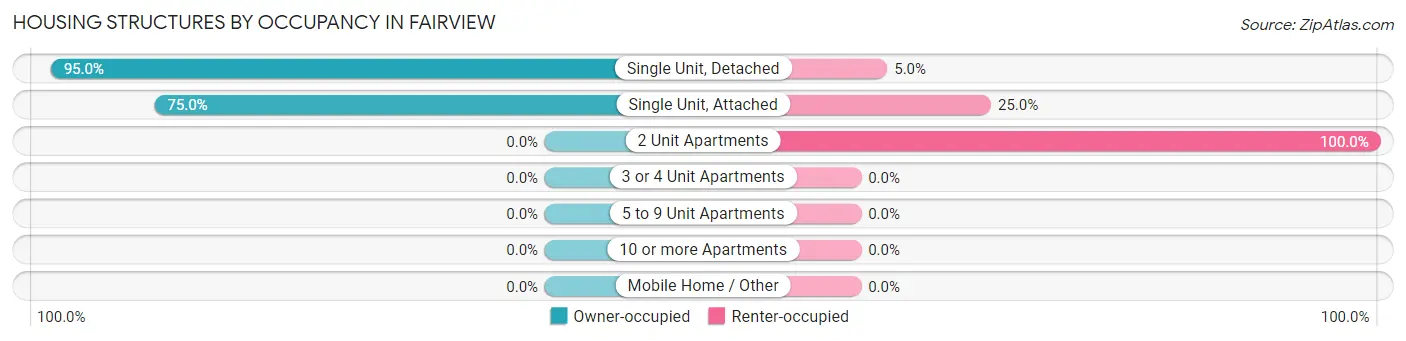
| Structure Type | Owner-occupied | Renter-occupied |
| Single Unit, Detached | 1,283 (95.0%) | 68 (5.0%) |
| Single Unit, Attached | 39 (75.0%) | 13 (25.0%) |
| 2 Unit Apartments | 0 (0.0%) | 36 (100.0%) |
| 3 or 4 Unit Apartments | 0 (0.0%) | 0 (0.0%) |
| 5 to 9 Unit Apartments | 0 (0.0%) | 0 (0.0%) |
| 10 or more Apartments | 0 (0.0%) | 0 (0.0%) |
| Mobile Home / Other | 0 (0.0%) | 0 (0.0%) |
| Total | 1,322 (91.9%) | 117 (8.1%) |
Housing Structures by Number of Rooms in Fairview
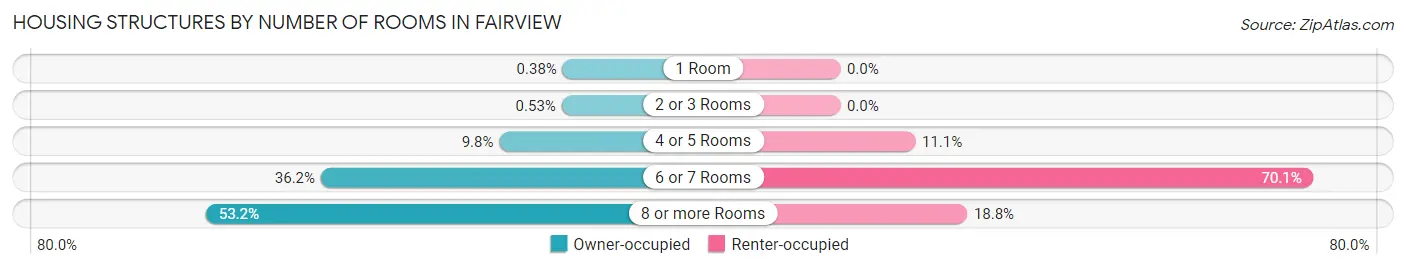
| Number of Rooms | Owner-occupied | Renter-occupied |
| 1 Room | 5 (0.4%) | 0 (0.0%) |
| 2 or 3 Rooms | 7 (0.5%) | 0 (0.0%) |
| 4 or 5 Rooms | 129 (9.8%) | 13 (11.1%) |
| 6 or 7 Rooms | 478 (36.2%) | 82 (70.1%) |
| 8 or more Rooms | 703 (53.2%) | 22 (18.8%) |
| Total | 1,322 (100.0%) | 117 (100.0%) |
Housing Structure by Heating Type in Fairview
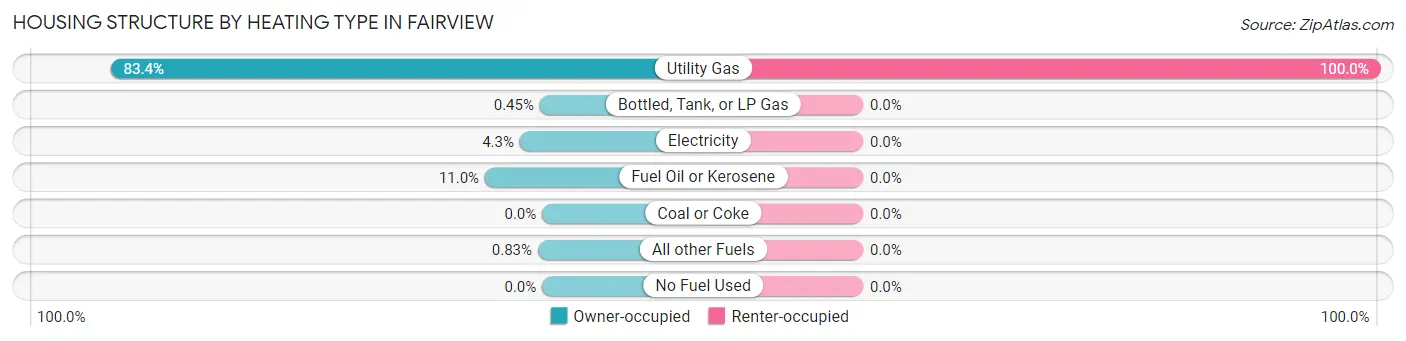
| Heating Type | Owner-occupied | Renter-occupied |
| Utility Gas | 1,102 (83.4%) | 117 (100.0%) |
| Bottled, Tank, or LP Gas | 6 (0.4%) | 0 (0.0%) |
| Electricity | 57 (4.3%) | 0 (0.0%) |
| Fuel Oil or Kerosene | 146 (11.0%) | 0 (0.0%) |
| Coal or Coke | 0 (0.0%) | 0 (0.0%) |
| All other Fuels | 11 (0.8%) | 0 (0.0%) |
| No Fuel Used | 0 (0.0%) | 0 (0.0%) |
| Total | 1,322 (100.0%) | 117 (100.0%) |
Household Vehicle Usage in Fairview
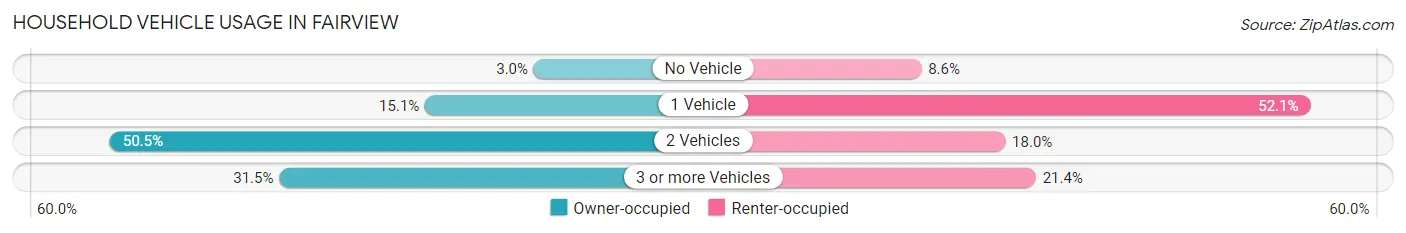
| Vehicles per Household | Owner-occupied | Renter-occupied |
| No Vehicle | 39 (2.9%) | 10 (8.6%) |
| 1 Vehicle | 200 (15.1%) | 61 (52.1%) |
| 2 Vehicles | 667 (50.4%) | 21 (17.9%) |
| 3 or more Vehicles | 416 (31.5%) | 25 (21.4%) |
| Total | 1,322 (100.0%) | 117 (100.0%) |
Real Estate & Mortgages in Fairview
Real Estate and Mortgage Overview in Fairview
| Characteristic | Without Mortgage | With Mortgage |
| Housing Units | 321 | 1,001 |
| Median Property Value | $481,200 | $563,400 |
| Median Household Income | $113,750 | $682 |
| Monthly Housing Costs | $1,182 | $636 |
| Real Estate Taxes | $8,669 | $0 |
Property Value by Mortgage Status in Fairview
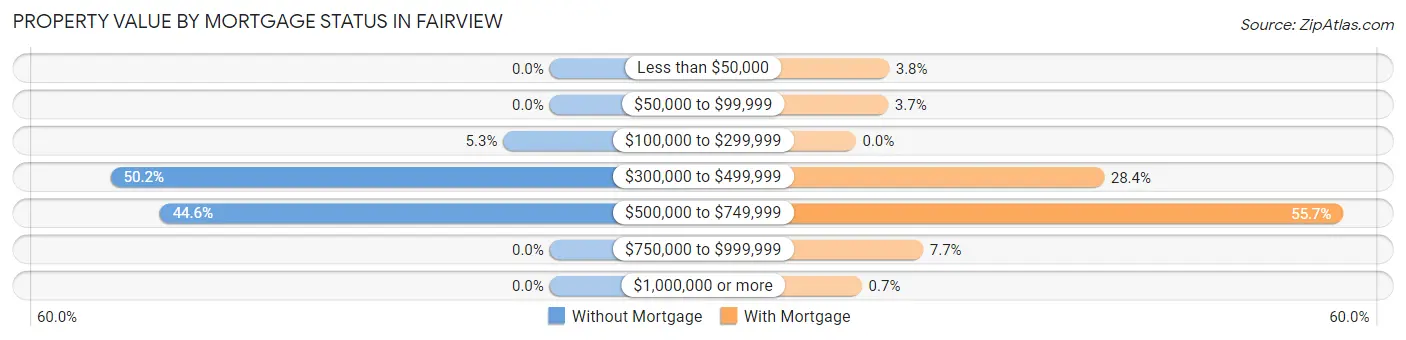
| Property Value | Without Mortgage | With Mortgage |
| Less than $50,000 | 0 (0.0%) | 38 (3.8%) |
| $50,000 to $99,999 | 0 (0.0%) | 37 (3.7%) |
| $100,000 to $299,999 | 17 (5.3%) | 0 (0.0%) |
| $300,000 to $499,999 | 161 (50.2%) | 284 (28.4%) |
| $500,000 to $749,999 | 143 (44.6%) | 558 (55.7%) |
| $750,000 to $999,999 | 0 (0.0%) | 77 (7.7%) |
| $1,000,000 or more | 0 (0.0%) | 7 (0.7%) |
| Total | 321 (100.0%) | 1,001 (100.0%) |
Household Income by Mortgage Status in Fairview
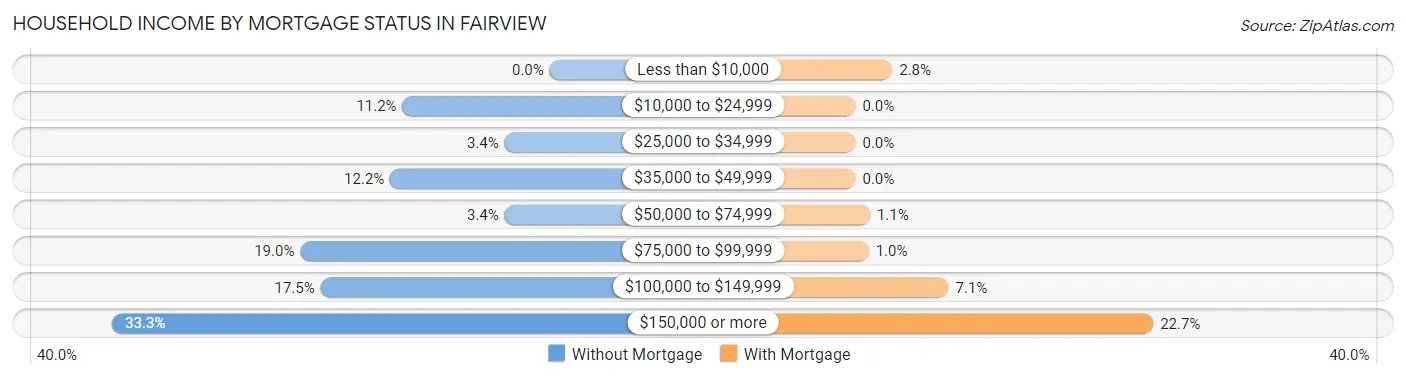
| Household Income | Without Mortgage | With Mortgage |
| Less than $10,000 | 0 (0.0%) | 28 (2.8%) |
| $10,000 to $24,999 | 36 (11.2%) | 0 (0.0%) |
| $25,000 to $34,999 | 11 (3.4%) | 0 (0.0%) |
| $35,000 to $49,999 | 39 (12.1%) | 0 (0.0%) |
| $50,000 to $74,999 | 11 (3.4%) | 11 (1.1%) |
| $75,000 to $99,999 | 61 (19.0%) | 10 (1.0%) |
| $100,000 to $149,999 | 56 (17.4%) | 71 (7.1%) |
| $150,000 or more | 107 (33.3%) | 227 (22.7%) |
| Total | 321 (100.0%) | 1,001 (100.0%) |
Property Value to Household Income Ratio in Fairview
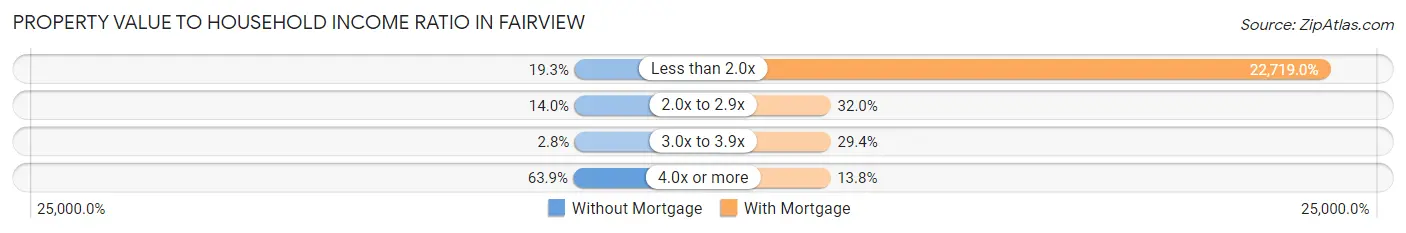
| Value-to-Income Ratio | Without Mortgage | With Mortgage |
| Less than 2.0x | 62 (19.3%) | 227,417 (22,719.0%) |
| 2.0x to 2.9x | 45 (14.0%) | 320 (32.0%) |
| 3.0x to 3.9x | 9 (2.8%) | 294 (29.4%) |
| 4.0x or more | 205 (63.9%) | 138 (13.8%) |
| Total | 321 (100.0%) | 1,001 (100.0%) |
Real Estate Taxes by Mortgage Status in Fairview
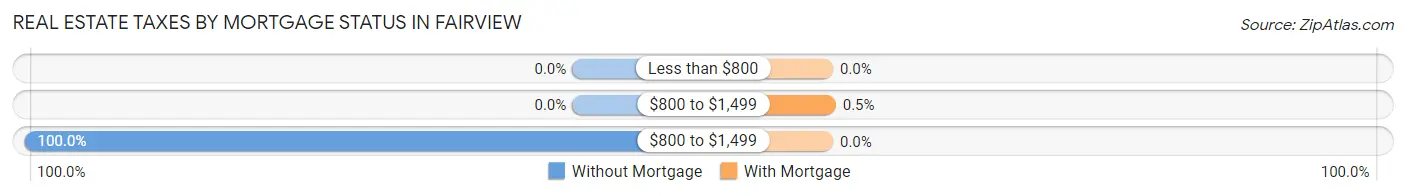
| Property Taxes | Without Mortgage | With Mortgage |
| Less than $800 | 0 (0.0%) | 0 (0.0%) |
| $800 to $1,499 | 0 (0.0%) | 5 (0.5%) |
| $800 to $1,499 | 321 (100.0%) | 0 (0.0%) |
| Total | 321 (100.0%) | 1,001 (100.0%) |
Health & Disability in Fairview
Health Insurance Coverage by Age in Fairview
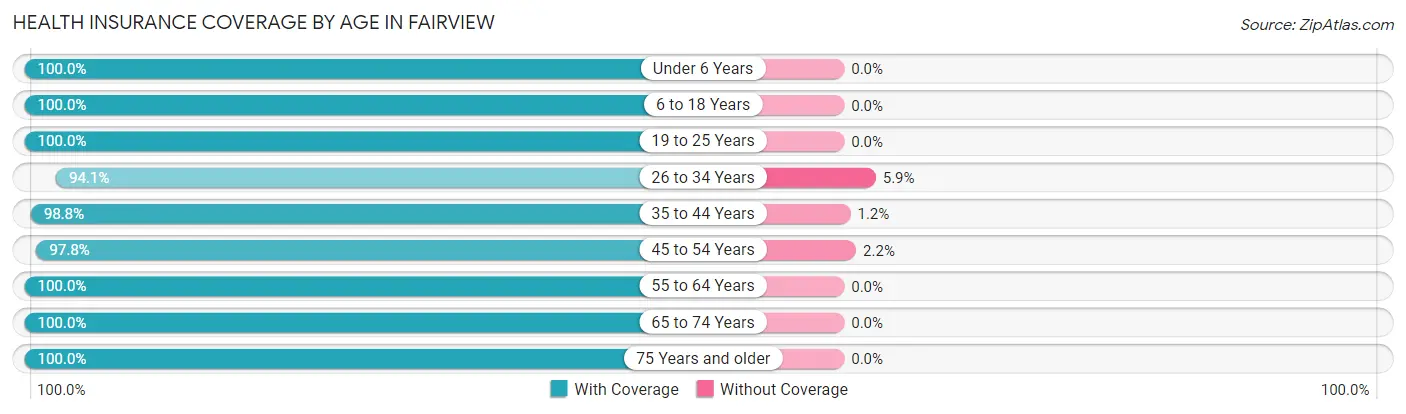
| Age Bracket | With Coverage | Without Coverage |
| Under 6 Years | 275 (100.0%) | 0 (0.0%) |
| 6 to 18 Years | 724 (100.0%) | 0 (0.0%) |
| 19 to 25 Years | 215 (100.0%) | 0 (0.0%) |
| 26 to 34 Years | 449 (94.1%) | 28 (5.9%) |
| 35 to 44 Years | 769 (98.8%) | 9 (1.2%) |
| 45 to 54 Years | 664 (97.8%) | 15 (2.2%) |
| 55 to 64 Years | 496 (100.0%) | 0 (0.0%) |
| 65 to 74 Years | 423 (100.0%) | 0 (0.0%) |
| 75 Years and older | 167 (100.0%) | 0 (0.0%) |
| Total | 4,182 (98.8%) | 52 (1.2%) |
Health Insurance Coverage by Citizenship Status in Fairview
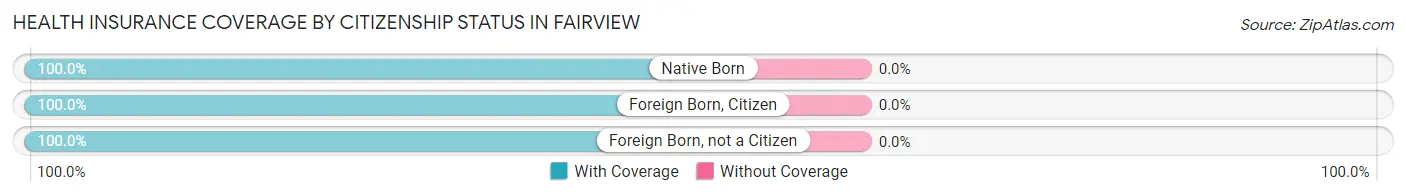
| Citizenship Status | With Coverage | Without Coverage |
| Native Born | 275 (100.0%) | 0 (0.0%) |
| Foreign Born, Citizen | 724 (100.0%) | 0 (0.0%) |
| Foreign Born, not a Citizen | 215 (100.0%) | 0 (0.0%) |
Health Insurance Coverage by Household Income in Fairview
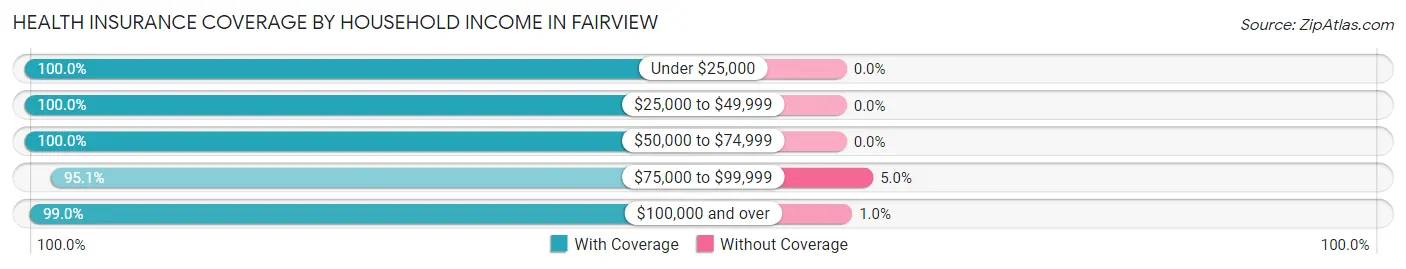
| Household Income | With Coverage | Without Coverage |
| Under $25,000 | 68 (100.0%) | 0 (0.0%) |
| $25,000 to $49,999 | 94 (100.0%) | 0 (0.0%) |
| $50,000 to $74,999 | 111 (100.0%) | 0 (0.0%) |
| $75,000 to $99,999 | 288 (95.1%) | 15 (5.0%) |
| $100,000 and over | 3,621 (99.0%) | 37 (1.0%) |
Public vs Private Health Insurance Coverage by Age in Fairview
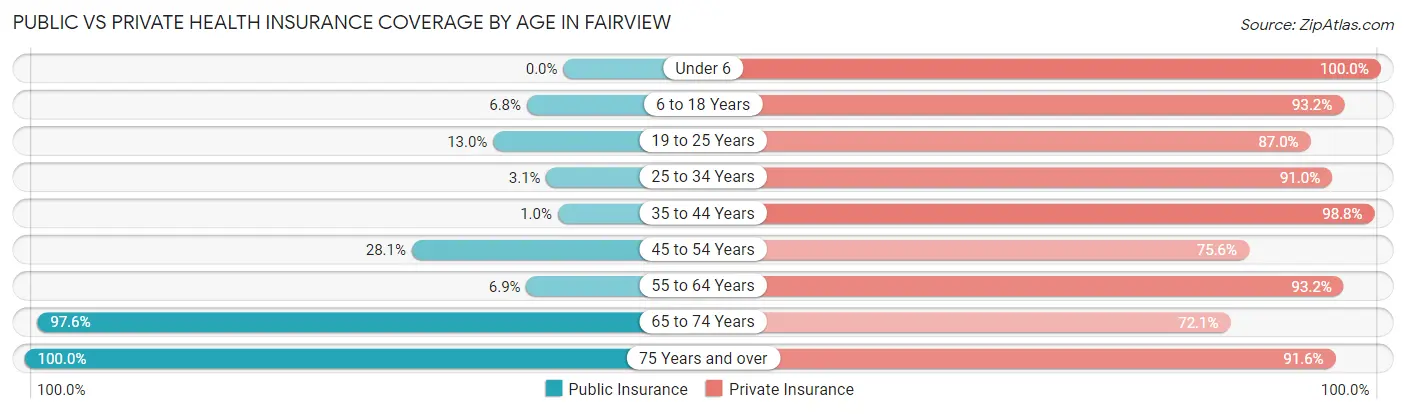
| Age Bracket | Public Insurance | Private Insurance |
| Under 6 | 0 (0.0%) | 275 (100.0%) |
| 6 to 18 Years | 49 (6.8%) | 675 (93.2%) |
| 19 to 25 Years | 28 (13.0%) | 187 (87.0%) |
| 25 to 34 Years | 15 (3.1%) | 434 (91.0%) |
| 35 to 44 Years | 8 (1.0%) | 769 (98.8%) |
| 45 to 54 Years | 191 (28.1%) | 513 (75.5%) |
| 55 to 64 Years | 34 (6.9%) | 462 (93.1%) |
| 65 to 74 Years | 413 (97.6%) | 305 (72.1%) |
| 75 Years and over | 167 (100.0%) | 153 (91.6%) |
| Total | 905 (21.4%) | 3,773 (89.1%) |
Disability Status by Sex by Age in Fairview
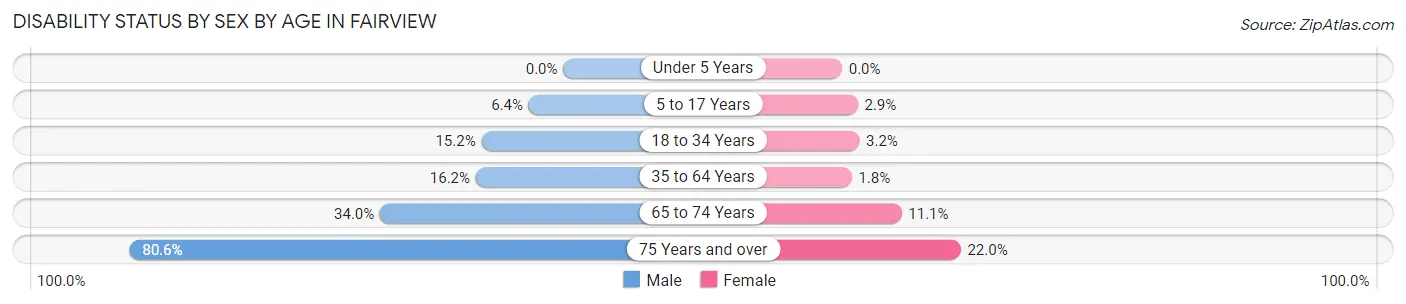
| Age Bracket | Male | Female |
| Under 5 Years | 0 (0.0%) | 0 (0.0%) |
| 5 to 17 Years | 26 (6.4%) | 10 (2.9%) |
| 18 to 34 Years | 55 (15.2%) | 12 (3.2%) |
| 35 to 64 Years | 163 (16.2%) | 17 (1.8%) |
| 65 to 74 Years | 67 (34.0%) | 25 (11.1%) |
| 75 Years and over | 87 (80.6%) | 13 (22.0%) |
Disability Class by Sex by Age in Fairview
Disability Class: Hearing Difficulty
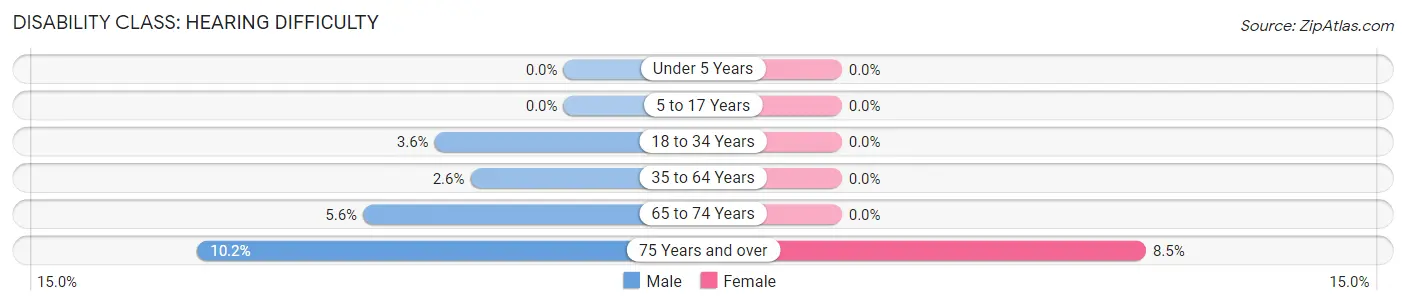
| Age Bracket | Male | Female |
| Under 5 Years | 0 (0.0%) | 0 (0.0%) |
| 5 to 17 Years | 0 (0.0%) | 0 (0.0%) |
| 18 to 34 Years | 13 (3.6%) | 0 (0.0%) |
| 35 to 64 Years | 26 (2.6%) | 0 (0.0%) |
| 65 to 74 Years | 11 (5.6%) | 0 (0.0%) |
| 75 Years and over | 11 (10.2%) | 5 (8.5%) |
Disability Class: Vision Difficulty
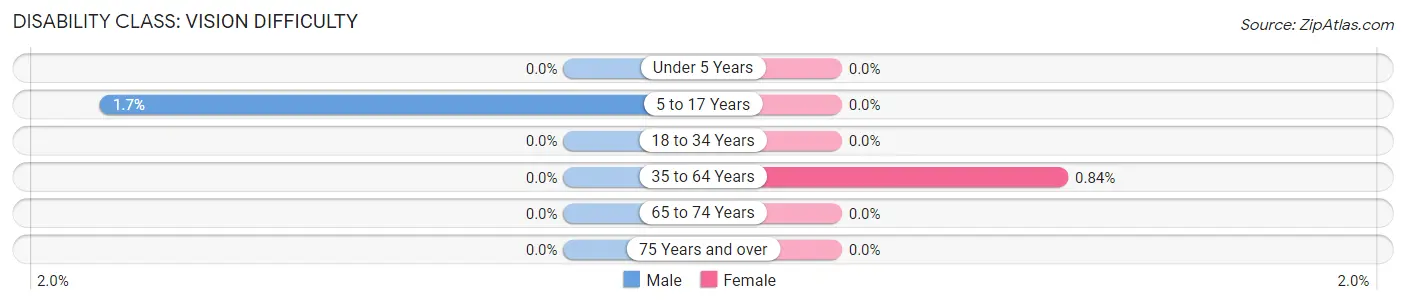
| Age Bracket | Male | Female |
| Under 5 Years | 0 (0.0%) | 0 (0.0%) |
| 5 to 17 Years | 7 (1.7%) | 0 (0.0%) |
| 18 to 34 Years | 0 (0.0%) | 0 (0.0%) |
| 35 to 64 Years | 0 (0.0%) | 8 (0.8%) |
| 65 to 74 Years | 0 (0.0%) | 0 (0.0%) |
| 75 Years and over | 0 (0.0%) | 0 (0.0%) |
Disability Class: Cognitive Difficulty
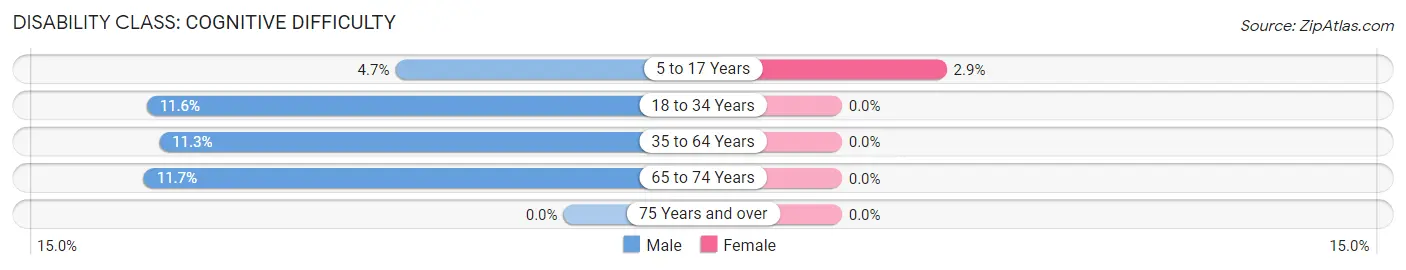
| Age Bracket | Male | Female |
| 5 to 17 Years | 19 (4.7%) | 10 (2.9%) |
| 18 to 34 Years | 42 (11.6%) | 0 (0.0%) |
| 35 to 64 Years | 113 (11.3%) | 0 (0.0%) |
| 65 to 74 Years | 23 (11.7%) | 0 (0.0%) |
| 75 Years and over | 0 (0.0%) | 0 (0.0%) |
Disability Class: Ambulatory Difficulty
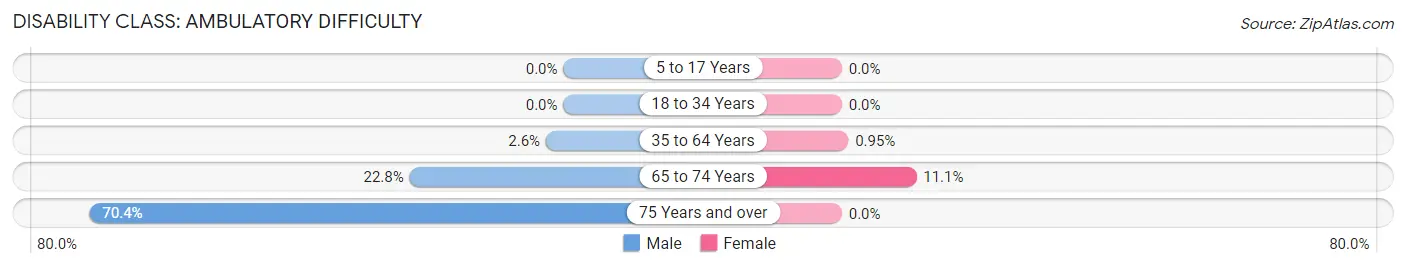
| Age Bracket | Male | Female |
| 5 to 17 Years | 0 (0.0%) | 0 (0.0%) |
| 18 to 34 Years | 0 (0.0%) | 0 (0.0%) |
| 35 to 64 Years | 26 (2.6%) | 9 (0.9%) |
| 65 to 74 Years | 45 (22.8%) | 25 (11.1%) |
| 75 Years and over | 76 (70.4%) | 0 (0.0%) |
Disability Class: Self-Care Difficulty
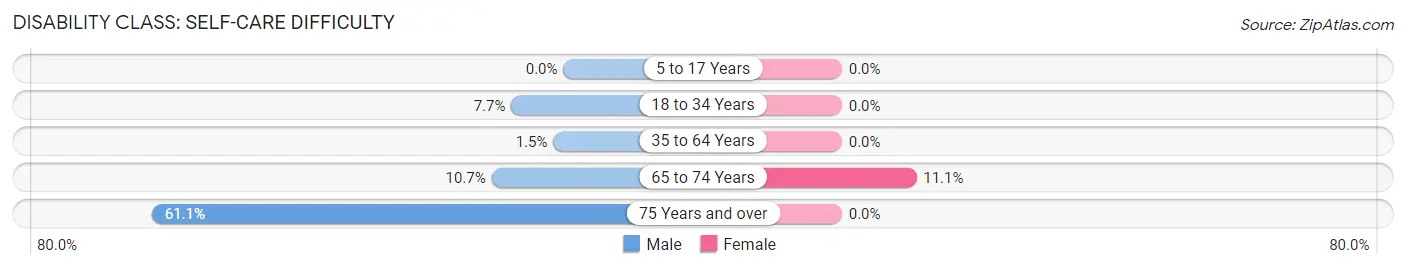
| Age Bracket | Male | Female |
| 5 to 17 Years | 0 (0.0%) | 0 (0.0%) |
| 18 to 34 Years | 28 (7.7%) | 0 (0.0%) |
| 35 to 64 Years | 15 (1.5%) | 0 (0.0%) |
| 65 to 74 Years | 21 (10.7%) | 25 (11.1%) |
| 75 Years and over | 66 (61.1%) | 0 (0.0%) |
Technology Access in Fairview
Computing Device Access in Fairview
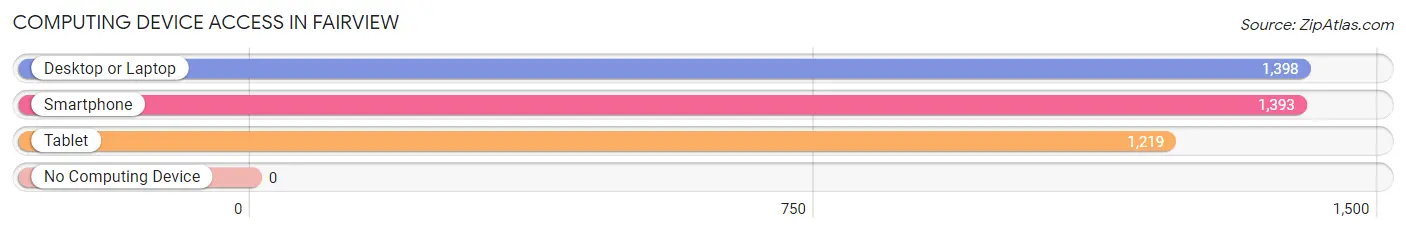
| Device Type | # Households | % Households |
| Desktop or Laptop | 1,398 | 97.2% |
| Smartphone | 1,393 | 96.8% |
| Tablet | 1,219 | 84.7% |
| No Computing Device | 0 | 0.0% |
| Total | 1,439 | 100.0% |
Internet Access in Fairview
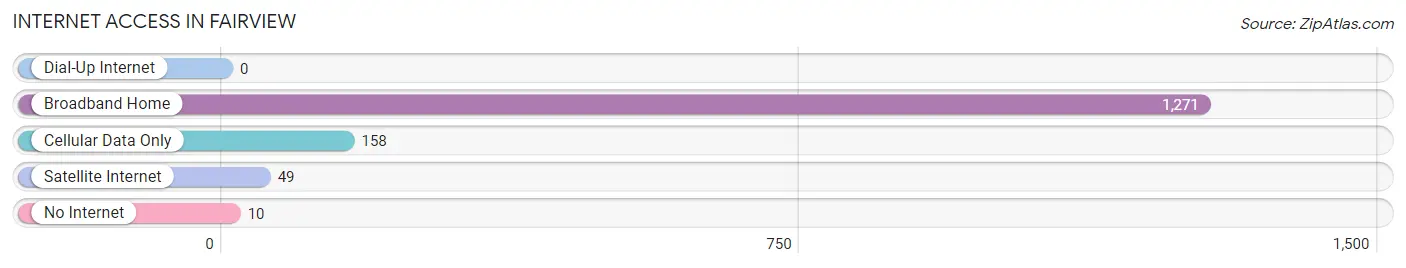
| Internet Type | # Households | % Households |
| Dial-Up Internet | 0 | 0.0% |
| Broadband Home | 1,271 | 88.3% |
| Cellular Data Only | 158 | 11.0% |
| Satellite Internet | 49 | 3.4% |
| No Internet | 10 | 0.7% |
| Total | 1,439 | 100.0% |
Fairview Summary
History
The history of Fairview, New Jersey dates back to the early 1700s when the area was first settled by Dutch and English settlers. The area was originally known as Bergen Neck, and was part of the larger Bergen Township. In 1871, the area was incorporated as the Borough of Fairview.
The borough was named after the view of the Hudson River from the area. The area was known for its farms and orchards, and was a popular destination for summer vacationers. The borough was also home to several factories, including a paper mill, a silk mill, and a glass factory.
In the early 1900s, the borough began to experience rapid growth due to the influx of immigrants from Europe. The population of Fairview increased from 1,000 in 1900 to over 10,000 by the 1950s.
Geography
Fairview is located in Bergen County, New Jersey. It is bordered by the Hudson River to the east, the Hackensack River to the west, and the boroughs of Ridgefield Park and Palisades Park to the north. The borough is approximately 4.5 square miles in size and has a population of approximately 13,000.
The borough is located in the Hackensack River Valley, which is part of the larger New York-New Jersey metropolitan area. The borough is home to several parks, including the Fairview Park, which is located on the banks of the Hudson River.
Economy
The economy of Fairview is largely based on the service industry. The borough is home to several retail stores, restaurants, and other businesses. The borough is also home to several corporate offices, including those of the pharmaceutical company Merck & Co. and the financial services company Prudential Financial.
The borough is also home to several industrial parks, which are home to a variety of manufacturing and distribution companies. The borough is also home to several educational institutions, including Fairview High School and Fairview College.
Demographics
As of the 2010 census, the population of Fairview was 13,068. The racial makeup of the borough was 79.3% White, 8.2% African American, 0.3% Native American, 5.2% Asian, and 6.9% from other races. Hispanic or Latino of any race were 15.2% of the population.
The median household income in Fairview was $68,945, and the median family income was $77,945. The per capita income was $31,945. About 5.2% of families and 7.2% of the population were below the poverty line, including 8.2% of those under age 18 and 6.2% of those age 65 or over.
Common Questions
What is Per Capita Income in Fairview?
Per Capita income in Fairview is $73,088.
What is the Median Family Income in Fairview?
Median Family Income in Fairview is $204,327.
What is the Median Household income in Fairview?
Median Household Income in Fairview is $187,132.
What is Income or Wage Gap in Fairview?
Income or Wage Gap in Fairview is 36.4%.
Women in Fairview earn 63.6 cents for every dollar earned by a man.
What is Inequality or Gini Index in Fairview?
Inequality or Gini Index in Fairview is 0.37.
What is the Total Population of Fairview?
Total Population of Fairview is 4,234.
What is the Total Male Population of Fairview?
Total Male Population of Fairview is 2,206.
What is the Total Female Population of Fairview?
Total Female Population of Fairview is 2,028.
What is the Ratio of Males per 100 Females in Fairview?
There are 108.78 Males per 100 Females in Fairview.
What is the Ratio of Females per 100 Males in Fairview?
There are 91.93 Females per 100 Males in Fairview.
What is the Median Population Age in Fairview?
Median Population Age in Fairview is 40.5 Years.
What is the Average Family Size in Fairview
Average Family Size in Fairview is 3.1 People.
What is the Average Household Size in Fairview
Average Household Size in Fairview is 2.9 People.
How Large is the Labor Force in Fairview?
There are 2,317 People in the Labor Forcein in Fairview.
What is the Percentage of People in the Labor Force in Fairview?
67.9% of People are in the Labor Force in Fairview.
What is the Unemployment Rate in Fairview?
Unemployment Rate in Fairview is 6.7%.