Glen Ridge borough, NJ Map & Demographics
Glen Ridge borough Overview
$101,252
PER CAPITA INCOME
$250,001
AVG FAMILY INCOME
$246,429
AVG HOUSEHOLD INCOME
70.0%
WAGE / INCOME GAP [ % ]
30.0¢/ $1
WAGE / INCOME GAP [ $ ]
0.40
INEQUALITY / GINI INDEX
7,797
TOTAL POPULATION
3,560
MALE POPULATION
4,237
FEMALE POPULATION
84.02
MALES / 100 FEMALES
119.02
FEMALES / 100 MALES
41.1
MEDIAN AGE
3.4
AVG FAMILY SIZE
3.1
AVG HOUSEHOLD SIZE
4,015
LABOR FORCE [ PEOPLE ]
69.9%
PERCENT IN LABOR FORCE
6.2%
UNEMPLOYMENT RATE
Income in Glen Ridge borough
Income Overview in Glen Ridge borough
Per Capita Income in Glen Ridge borough is $101,252, while median incomes of families and households are $250,001 and $246,429 respectively.
| Characteristic | Number | Measure |
| Per Capita Income | 7,797 | $101,252 |
| Median Family Income | 2,161 | $250,001 |
| Mean Family Income | 2,161 | $349,337 |
| Median Household Income | 2,462 | $246,429 |
| Mean Household Income | 2,462 | $317,792 |
| Income Deficit | 2,161 | $0 |
| Wage / Income Gap (%) | 7,797 | 70.01% |
| Wage / Income Gap ($) | 7,797 | 29.99¢ per $1 |
| Gini / Inequality Index | 7,797 | 0.40 |
Earnings by Sex in Glen Ridge borough
Average Earnings in Glen Ridge borough are $94,607, $192,542 for men and $57,750 for women, a difference of 70.0%.
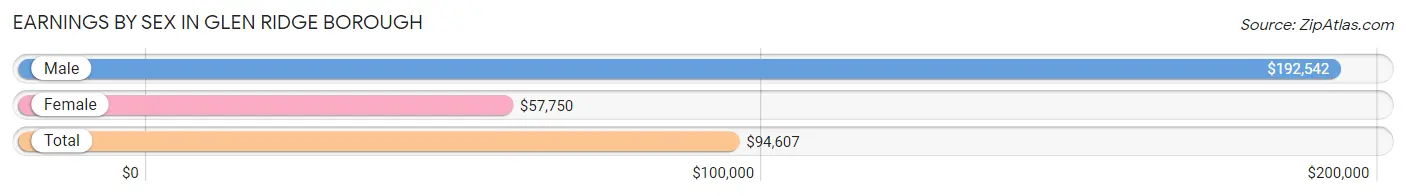
| Sex | Number | Average Earnings |
| Male | 2,106 (50.2%) | $192,542 |
| Female | 2,089 (49.8%) | $57,750 |
| Total | 4,195 (100.0%) | $94,607 |
Earnings by Sex by Income Bracket in Glen Ridge borough
The most common earnings brackets in Glen Ridge borough are $100,000+ for men (1,513 | 71.8%) and $100,000+ for women (488 | 23.4%).
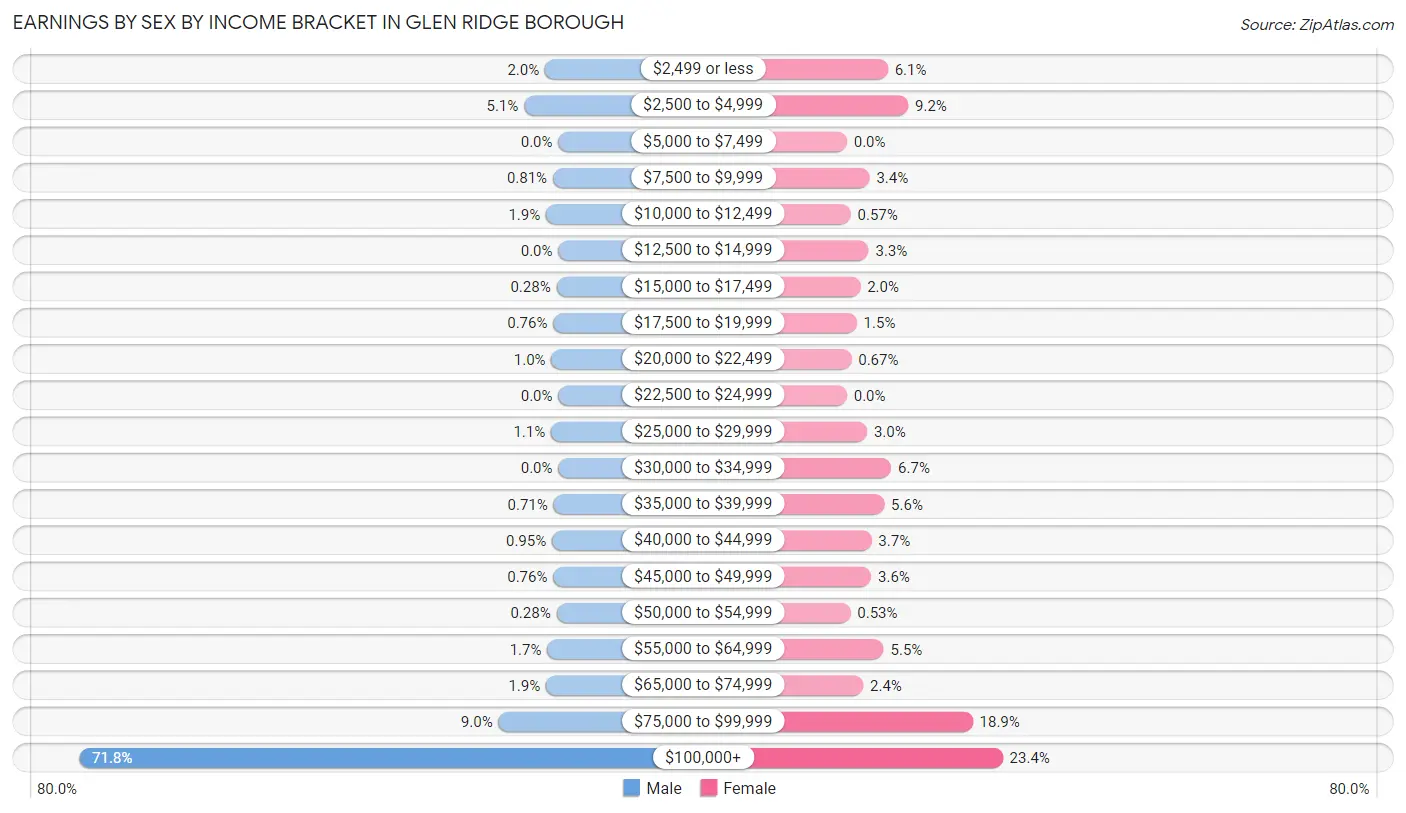
| Income | Male | Female |
| $2,499 or less | 42 (2.0%) | 128 (6.1%) |
| $2,500 to $4,999 | 108 (5.1%) | 192 (9.2%) |
| $5,000 to $7,499 | 0 (0.0%) | 0 (0.0%) |
| $7,500 to $9,999 | 17 (0.8%) | 71 (3.4%) |
| $10,000 to $12,499 | 39 (1.8%) | 12 (0.6%) |
| $12,500 to $14,999 | 0 (0.0%) | 68 (3.3%) |
| $15,000 to $17,499 | 6 (0.3%) | 42 (2.0%) |
| $17,500 to $19,999 | 16 (0.8%) | 31 (1.5%) |
| $20,000 to $22,499 | 22 (1.0%) | 14 (0.7%) |
| $22,500 to $24,999 | 0 (0.0%) | 0 (0.0%) |
| $25,000 to $29,999 | 23 (1.1%) | 63 (3.0%) |
| $30,000 to $34,999 | 0 (0.0%) | 139 (6.7%) |
| $35,000 to $39,999 | 15 (0.7%) | 117 (5.6%) |
| $40,000 to $44,999 | 20 (0.9%) | 77 (3.7%) |
| $45,000 to $49,999 | 16 (0.8%) | 76 (3.6%) |
| $50,000 to $54,999 | 6 (0.3%) | 11 (0.5%) |
| $55,000 to $64,999 | 35 (1.7%) | 115 (5.5%) |
| $65,000 to $74,999 | 39 (1.8%) | 51 (2.4%) |
| $75,000 to $99,999 | 189 (9.0%) | 394 (18.9%) |
| $100,000+ | 1,513 (71.8%) | 488 (23.4%) |
| Total | 2,106 (100.0%) | 2,089 (100.0%) |
Earnings by Sex by Educational Attainment in Glen Ridge borough
Average earnings in Glen Ridge borough are $199,000 for men and $70,903 for women, a difference of 64.4%. Men with an educational attainment of graduate degree enjoy the highest average annual earnings of $250,001, while those with high school diploma education earn the least with $82,083. Women with an educational attainment of graduate degree earn the most with the average annual earnings of $72,292, while those with college or associate's degree education have the smallest earnings of $68,088.
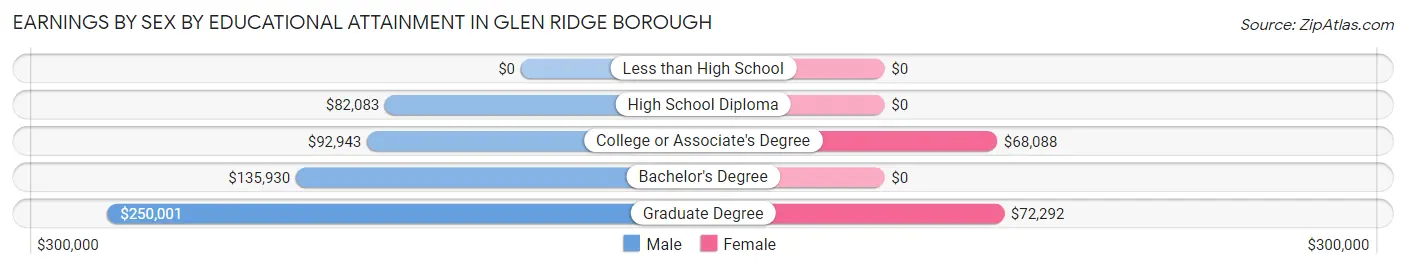
| Educational Attainment | Male Income | Female Income |
| Less than High School | - | - |
| High School Diploma | $82,083 | $0 |
| College or Associate's Degree | $92,943 | $68,088 |
| Bachelor's Degree | $135,930 | $0 |
| Graduate Degree | $250,001 | $72,292 |
| Total | $199,000 | $70,903 |
Family Income in Glen Ridge borough
Family Income Brackets in Glen Ridge borough
According to the Glen Ridge borough family income data, there are 1,450 families falling into the $200,000+ income range, which is the most common income bracket and makes up 67.1% of all families.
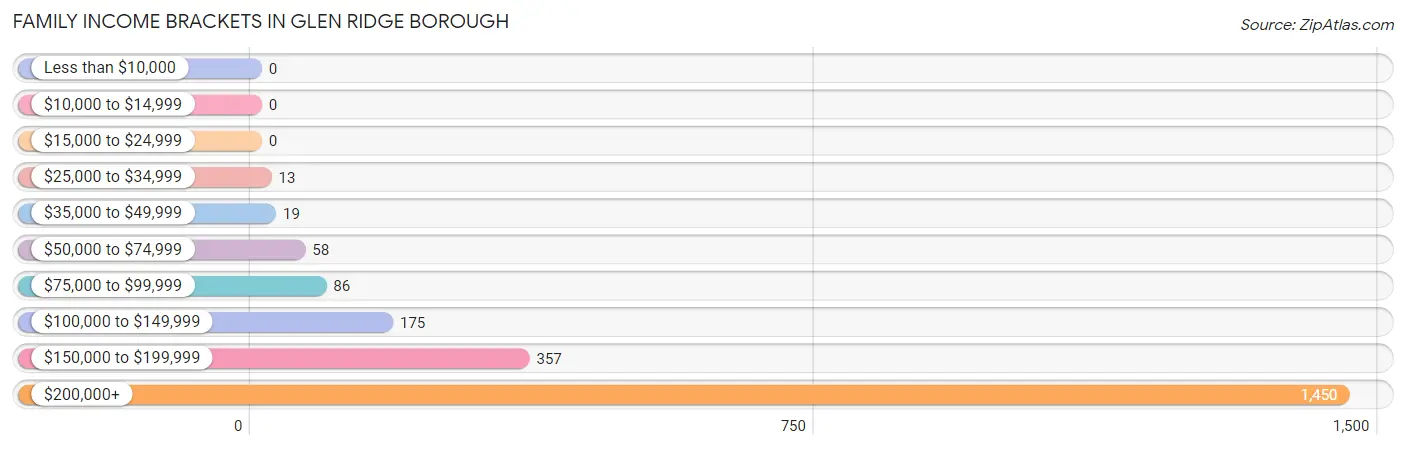
| Income Bracket | # Families | % Families |
| Less than $10,000 | 0 | 0.0% |
| $10,000 to $14,999 | 0 | 0.0% |
| $15,000 to $24,999 | 0 | 0.0% |
| $25,000 to $34,999 | 13 | 0.6% |
| $35,000 to $49,999 | 19 | 0.9% |
| $50,000 to $74,999 | 58 | 2.7% |
| $75,000 to $99,999 | 86 | 4.0% |
| $100,000 to $149,999 | 175 | 8.1% |
| $150,000 to $199,999 | 357 | 16.5% |
| $200,000+ | 1,450 | 67.1% |
Family Income by Famaliy Size in Glen Ridge borough
3-person families (594 | 27.5%) account for the highest median family income in Glen Ridge borough with $250,001 per family, while 2-person families (631 | 29.2%) have the highest median income of $108,794 per family member.
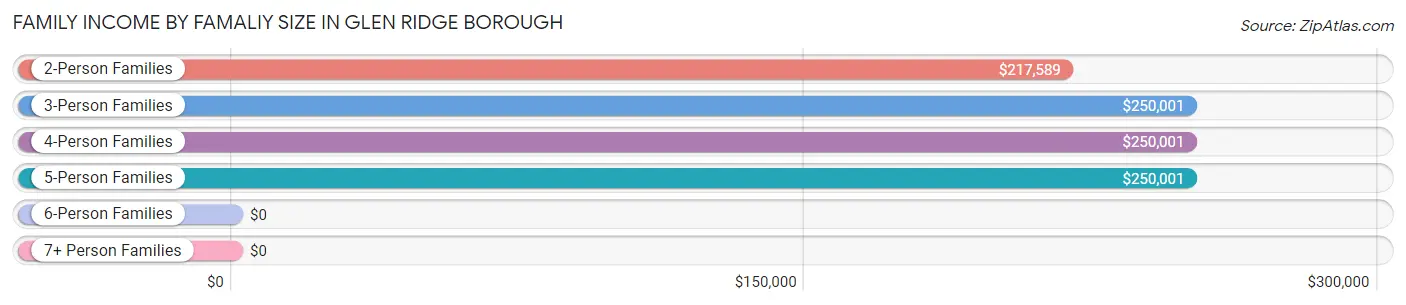
| Income Bracket | # Families | Median Income |
| 2-Person Families | 631 (29.2%) | $217,589 |
| 3-Person Families | 594 (27.5%) | $250,001 |
| 4-Person Families | 624 (28.9%) | $250,001 |
| 5-Person Families | 277 (12.8%) | $250,001 |
| 6-Person Families | 35 (1.6%) | $0 |
| 7+ Person Families | 0 (0.0%) | $0 |
| Total | 2,161 (100.0%) | $250,001 |
Family Income by Number of Earners in Glen Ridge borough
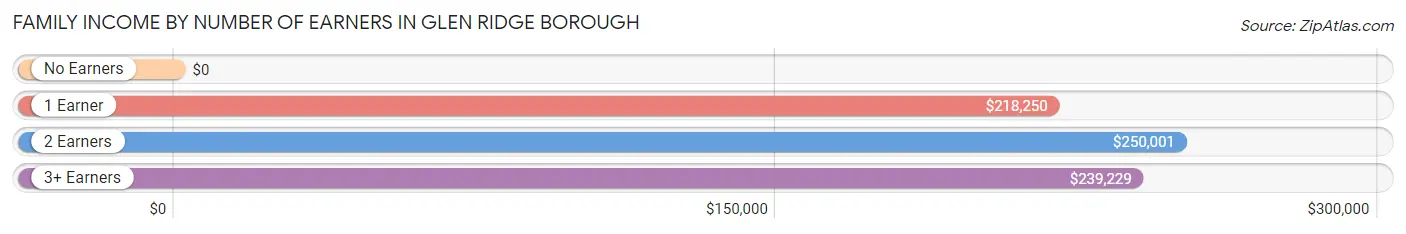
| Number of Earners | # Families | Median Income |
| No Earners | 66 (3.0%) | $0 |
| 1 Earner | 640 (29.6%) | $218,250 |
| 2 Earners | 1,264 (58.5%) | $250,001 |
| 3+ Earners | 191 (8.8%) | $239,229 |
| Total | 2,161 (100.0%) | $250,001 |
Household Income in Glen Ridge borough
Household Income Brackets in Glen Ridge borough
With 1,499 households falling in the category, the $200,000+ income range is the most frequent in Glen Ridge borough, accounting for 60.9% of all households.
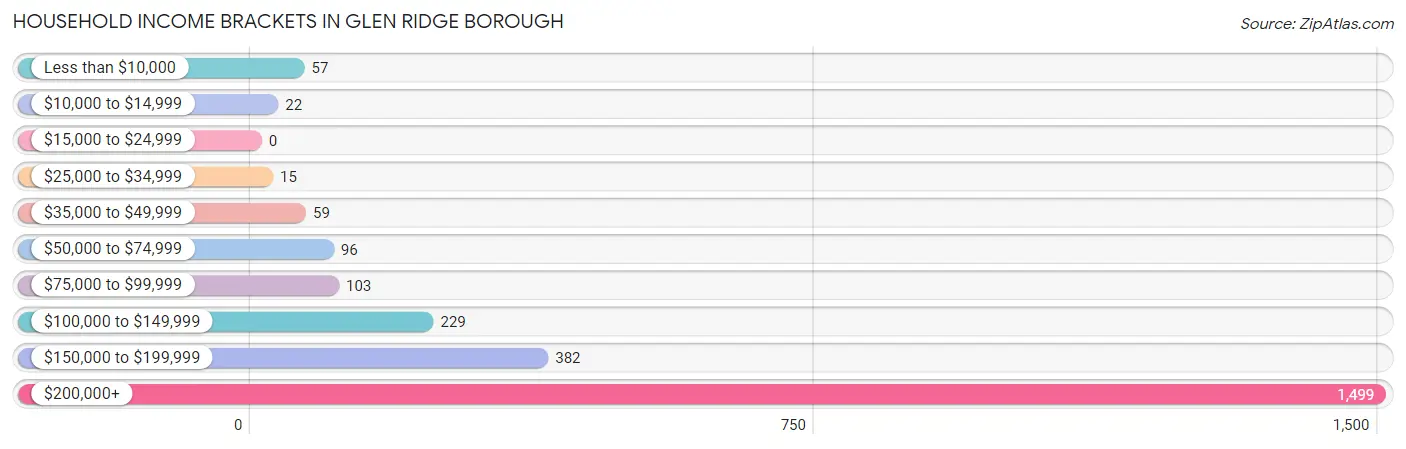
| Income Bracket | # Households | % Households |
| Less than $10,000 | 57 | 2.3% |
| $10,000 to $14,999 | 22 | 0.9% |
| $15,000 to $24,999 | 0 | 0.0% |
| $25,000 to $34,999 | 15 | 0.6% |
| $35,000 to $49,999 | 59 | 2.4% |
| $50,000 to $74,999 | 96 | 3.9% |
| $75,000 to $99,999 | 103 | 4.2% |
| $100,000 to $149,999 | 229 | 9.3% |
| $150,000 to $199,999 | 382 | 15.5% |
| $200,000+ | 1,499 | 60.9% |
Household Income by Householder Age in Glen Ridge borough
The median household income in Glen Ridge borough is $246,429, with the highest median household income of $250,001 found in the 25 to 44 years age bracket for the primary householder. A total of 717 households (29.1%) fall into this category.
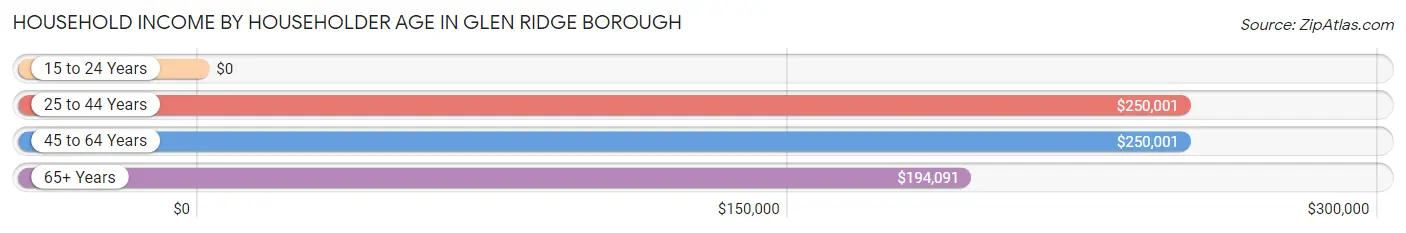
| Income Bracket | # Households | Median Income |
| 15 to 24 Years | 0 (0.0%) | $0 |
| 25 to 44 Years | 717 (29.1%) | $250,001 |
| 45 to 64 Years | 1,215 (49.3%) | $250,001 |
| 65+ Years | 530 (21.5%) | $194,091 |
| Total | 2,462 (100.0%) | $246,429 |
Poverty in Glen Ridge borough
Income Below Poverty by Sex and Age in Glen Ridge borough
With 1.6% poverty level for males and 0.9% for females among the residents of Glen Ridge borough, 25 to 34 year old males and 65 to 74 year old females are the most vulnerable to poverty, with 42 males (19.1%) and 13 females (3.2%) in their respective age groups living below the poverty level.
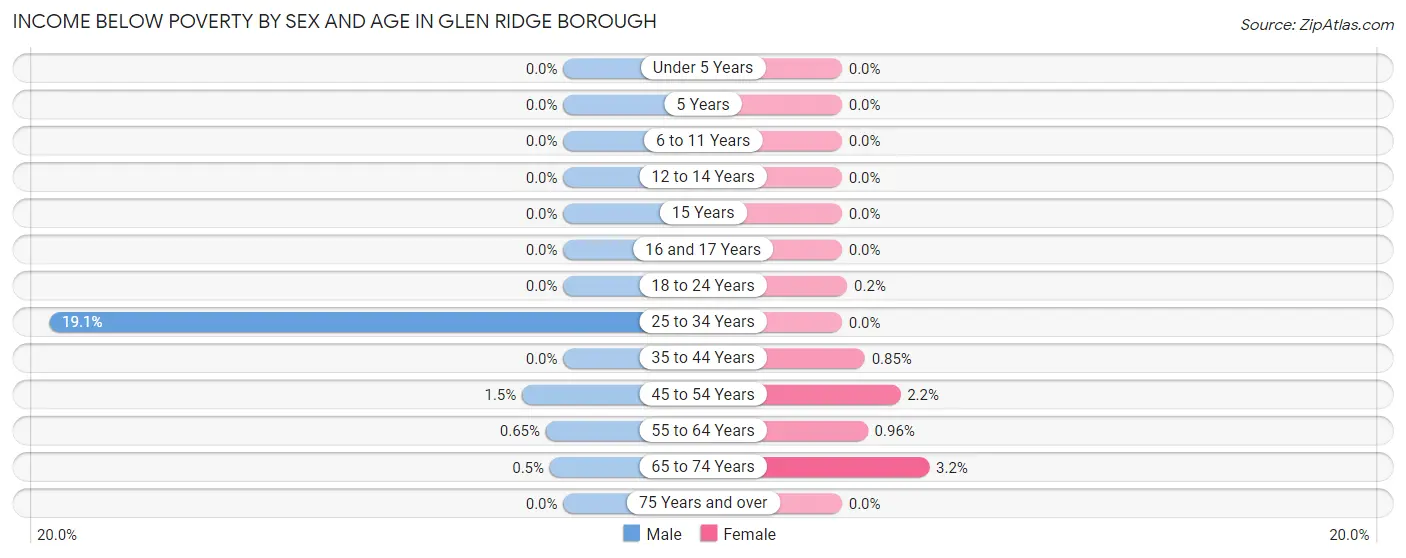
| Age Bracket | Male | Female |
| Under 5 Years | 0 (0.0%) | 0 (0.0%) |
| 5 Years | 0 (0.0%) | 0 (0.0%) |
| 6 to 11 Years | 0 (0.0%) | 0 (0.0%) |
| 12 to 14 Years | 0 (0.0%) | 0 (0.0%) |
| 15 Years | 0 (0.0%) | 0 (0.0%) |
| 16 and 17 Years | 0 (0.0%) | 0 (0.0%) |
| 18 to 24 Years | 0 (0.0%) | 1 (0.2%) |
| 25 to 34 Years | 42 (19.1%) | 0 (0.0%) |
| 35 to 44 Years | 0 (0.0%) | 5 (0.9%) |
| 45 to 54 Years | 10 (1.5%) | 15 (2.2%) |
| 55 to 64 Years | 3 (0.6%) | 5 (1.0%) |
| 65 to 74 Years | 2 (0.5%) | 13 (3.2%) |
| 75 Years and over | 0 (0.0%) | 0 (0.0%) |
| Total | 57 (1.6%) | 39 (0.9%) |
Income Above Poverty by Sex and Age in Glen Ridge borough
According to the poverty statistics in Glen Ridge borough, males aged under 5 years and females aged under 5 years are the age groups that are most secure financially, with 100.0% of males and 100.0% of females in these age groups living above the poverty line.
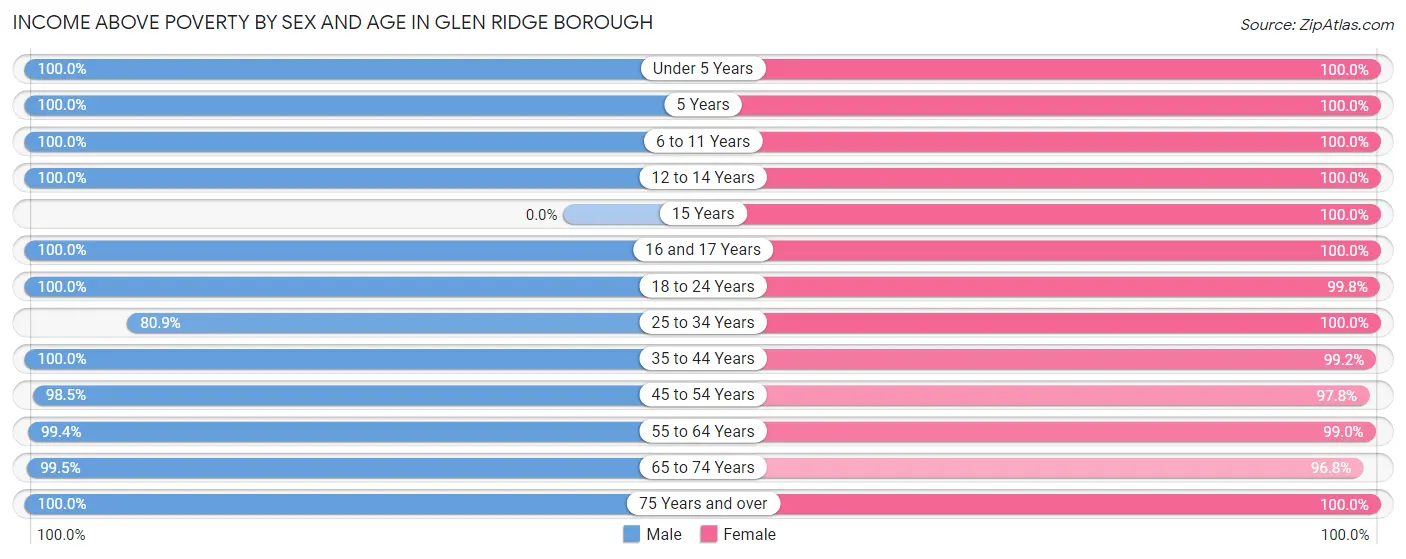
| Age Bracket | Male | Female |
| Under 5 Years | 141 (100.0%) | 331 (100.0%) |
| 5 Years | 89 (100.0%) | 19 (100.0%) |
| 6 to 11 Years | 426 (100.0%) | 404 (100.0%) |
| 12 to 14 Years | 233 (100.0%) | 388 (100.0%) |
| 15 Years | 0 (0.0%) | 22 (100.0%) |
| 16 and 17 Years | 126 (100.0%) | 147 (100.0%) |
| 18 to 24 Years | 186 (100.0%) | 490 (99.8%) |
| 25 to 34 Years | 178 (80.9%) | 204 (100.0%) |
| 35 to 44 Years | 502 (100.0%) | 585 (99.2%) |
| 45 to 54 Years | 645 (98.5%) | 676 (97.8%) |
| 55 to 64 Years | 461 (99.4%) | 515 (99.0%) |
| 65 to 74 Years | 397 (99.5%) | 388 (96.8%) |
| 75 Years and over | 119 (100.0%) | 29 (100.0%) |
| Total | 3,503 (98.4%) | 4,198 (99.1%) |
Income Below Poverty Among Married-Couple Families in Glen Ridge borough
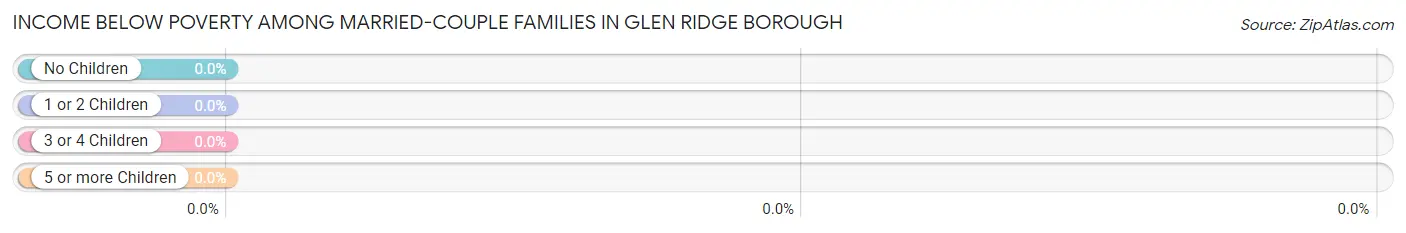
| Children | Above Poverty | Below Poverty |
| No Children | 957 (100.0%) | 0 (0.0%) |
| 1 or 2 Children | 794 (100.0%) | 0 (0.0%) |
| 3 or 4 Children | 218 (100.0%) | 0 (0.0%) |
| 5 or more Children | 0 (0.0%) | 0 (0.0%) |
| Total | 1,969 (100.0%) | 0 (0.0%) |
Income Below Poverty Among Single-Parent Households in Glen Ridge borough
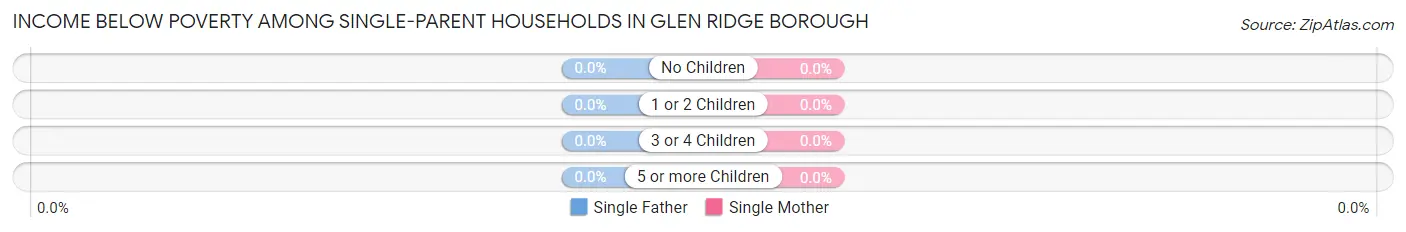
| Children | Single Father | Single Mother |
| No Children | 0 (0.0%) | 0 (0.0%) |
| 1 or 2 Children | 0 (0.0%) | 0 (0.0%) |
| 3 or 4 Children | 0 (0.0%) | 0 (0.0%) |
| 5 or more Children | 0 (0.0%) | 0 (0.0%) |
| Total | 0 (0.0%) | 0 (0.0%) |
Income Below Poverty Among Married-Couple vs Single-Parent Households in Glen Ridge borough
| Children | Married-Couple Families | Single-Parent Households |
| No Children | 0 (0.0%) | 0 (0.0%) |
| 1 or 2 Children | 0 (0.0%) | 0 (0.0%) |
| 3 or 4 Children | 0 (0.0%) | 0 (0.0%) |
| 5 or more Children | 0 (0.0%) | 0 (0.0%) |
| Total | 0 (0.0%) | 0 (0.0%) |
Race in Glen Ridge borough
The most populous races in Glen Ridge borough are White / Caucasian (6,112 | 78.4%), Hispanic or Latino (1,004 | 12.9%), and Two or more Races (953 | 12.2%).
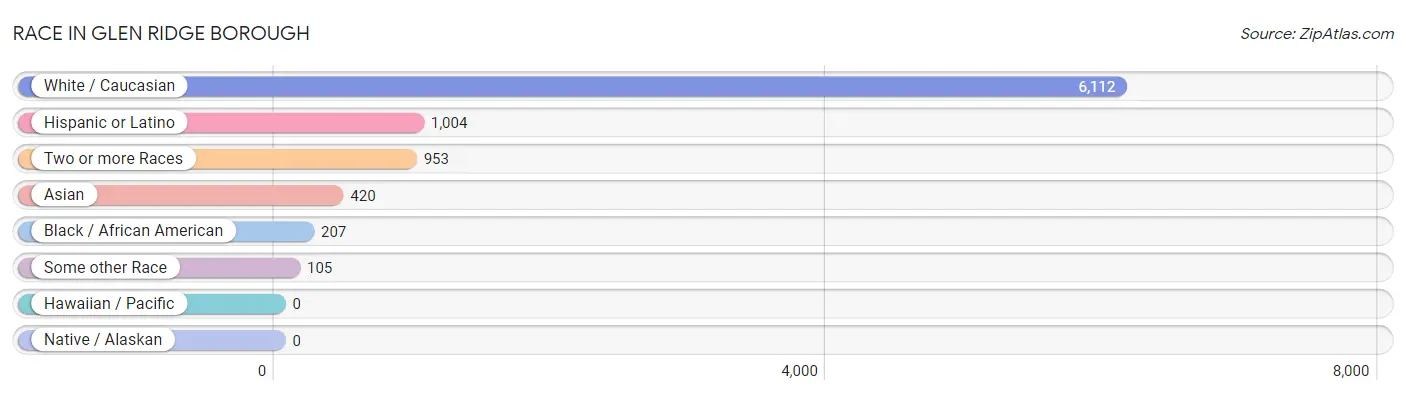
| Race | # Population | % Population |
| Asian | 420 | 5.4% |
| Black / African American | 207 | 2.6% |
| Hawaiian / Pacific | 0 | 0.0% |
| Hispanic or Latino | 1,004 | 12.9% |
| Native / Alaskan | 0 | 0.0% |
| White / Caucasian | 6,112 | 78.4% |
| Two or more Races | 953 | 12.2% |
| Some other Race | 105 | 1.3% |
| Total | 7,797 | 100.0% |
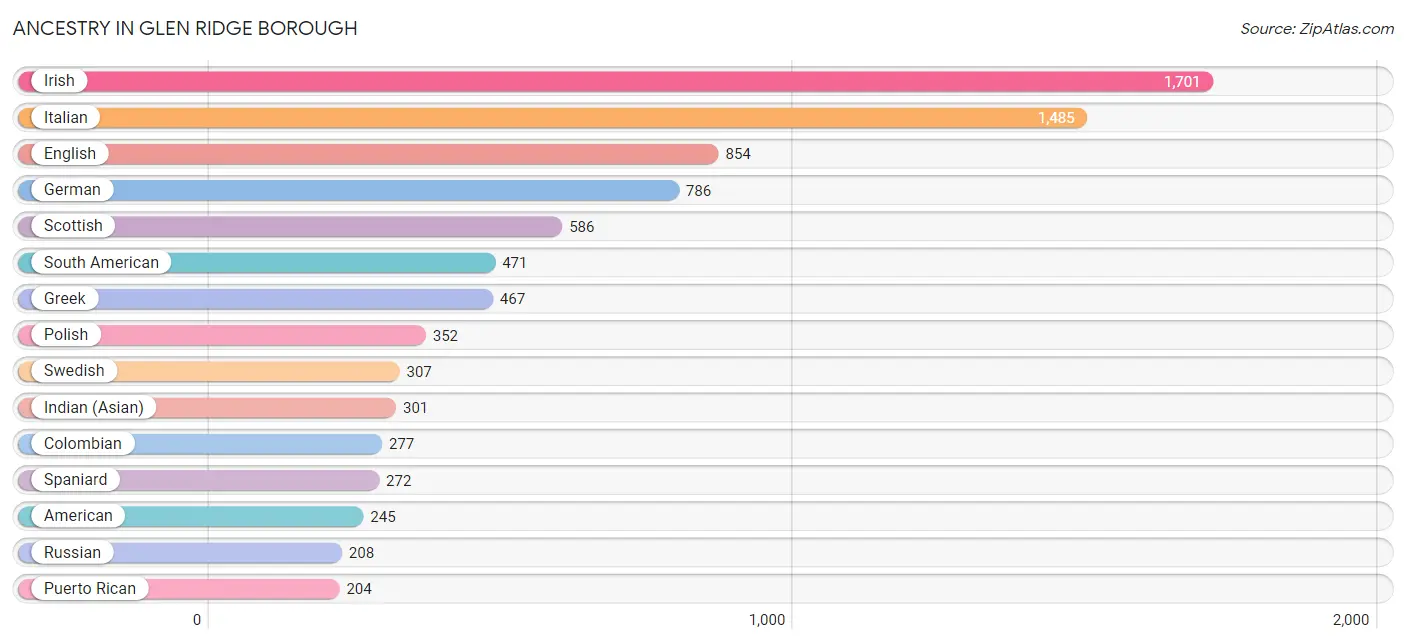
Ancestry in Glen Ridge borough
The most populous ancestries reported in Glen Ridge borough are Irish (1,701 | 21.8%), Italian (1,485 | 19.1%), English (854 | 11.0%), German (786 | 10.1%), and Scottish (586 | 7.5%), together accounting for 69.4% of all Glen Ridge borough residents.
| Ancestry | # Population | % Population |
| African | 13 | 0.2% |
| American | 245 | 3.1% |
| Arab | 167 | 2.1% |
| Armenian | 8 | 0.1% |
| Australian | 49 | 0.6% |
| Austrian | 69 | 0.9% |
| Bhutanese | 62 | 0.8% |
| British | 12 | 0.2% |
| Burmese | 62 | 0.8% |
| Colombian | 277 | 3.5% |
| Dominican | 57 | 0.7% |
| Dutch | 29 | 0.4% |
| Eastern European | 81 | 1.0% |
| Ecuadorian | 84 | 1.1% |
| Egyptian | 102 | 1.3% |
| English | 854 | 11.0% |
| European | 30 | 0.4% |
| Finnish | 21 | 0.3% |
| French | 167 | 2.1% |
| French Canadian | 186 | 2.4% |
| German | 786 | 10.1% |
| Greek | 467 | 6.0% |
| Hungarian | 103 | 1.3% |
| Indian (Asian) | 301 | 3.9% |
| Irish | 1,701 | 21.8% |
| Israeli | 30 | 0.4% |
| Italian | 1,485 | 19.1% |
| Jamaican | 23 | 0.3% |
| Korean | 62 | 0.8% |
| Lithuanian | 44 | 0.6% |
| Northern European | 17 | 0.2% |
| Norwegian | 38 | 0.5% |
| Pakistani | 38 | 0.5% |
| Peruvian | 110 | 1.4% |
| Polish | 352 | 4.5% |
| Portuguese | 20 | 0.3% |
| Puerto Rican | 204 | 2.6% |
| Romanian | 134 | 1.7% |
| Russian | 208 | 2.7% |
| Scotch-Irish | 70 | 0.9% |
| Scottish | 586 | 7.5% |
| Serbian | 39 | 0.5% |
| Slavic | 16 | 0.2% |
| South American | 471 | 6.0% |
| Spaniard | 272 | 3.5% |
| Sri Lankan | 62 | 0.8% |
| Subsaharan African | 13 | 0.2% |
| Swedish | 307 | 3.9% |
| Swiss | 46 | 0.6% |
| Syrian | 36 | 0.5% |
| Thai | 144 | 1.8% |
| Trinidadian and Tobagonian | 35 | 0.4% |
| Welsh | 21 | 0.3% |
| West Indian | 22 | 0.3% | View All 54 Rows |
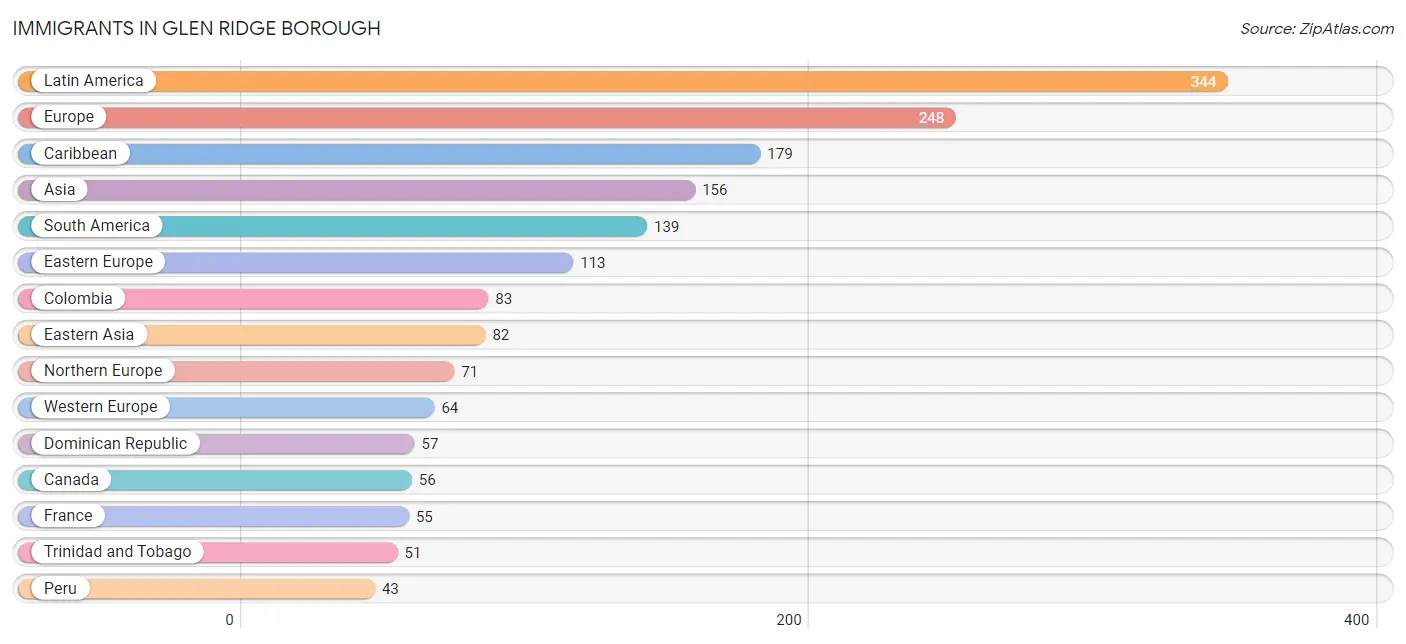
Immigrants in Glen Ridge borough
The most numerous immigrant groups reported in Glen Ridge borough came from Latin America (344 | 4.4%), Europe (248 | 3.2%), Caribbean (179 | 2.3%), Asia (156 | 2.0%), and South America (139 | 1.8%), together accounting for 13.7% of all Glen Ridge borough residents.
| Immigration Origin | # Population | % Population |
| Asia | 156 | 2.0% |
| Bosnia and Herzegovina | 39 | 0.5% |
| Canada | 56 | 0.7% |
| Caribbean | 179 | 2.3% |
| Central America | 26 | 0.3% |
| China | 33 | 0.4% |
| Colombia | 83 | 1.1% |
| Dominican Republic | 57 | 0.7% |
| Eastern Asia | 82 | 1.1% |
| Eastern Europe | 113 | 1.5% |
| El Salvador | 26 | 0.3% |
| Europe | 248 | 3.2% |
| France | 55 | 0.7% |
| Germany | 9 | 0.1% |
| Guyana | 13 | 0.2% |
| Hungary | 32 | 0.4% |
| India | 28 | 0.4% |
| Iran | 8 | 0.1% |
| Jamaica | 23 | 0.3% |
| Japan | 18 | 0.2% |
| Korea | 31 | 0.4% |
| Latin America | 344 | 4.4% |
| Northern Europe | 71 | 0.9% |
| Peru | 43 | 0.5% |
| Philippines | 38 | 0.5% |
| Poland | 18 | 0.2% |
| Russia | 24 | 0.3% |
| South America | 139 | 1.8% |
| South Central Asia | 36 | 0.5% |
| South Eastern Asia | 38 | 0.5% |
| Taiwan | 15 | 0.2% |
| Trinidad and Tobago | 51 | 0.6% |
| Western Europe | 64 | 0.8% | View All 33 Rows |
Sex and Age in Glen Ridge borough
Sex and Age in Glen Ridge borough
The most populous age groups in Glen Ridge borough are 40 to 44 Years (419 | 11.8%) for men and 10 to 14 Years (608 | 14.3%) for women.
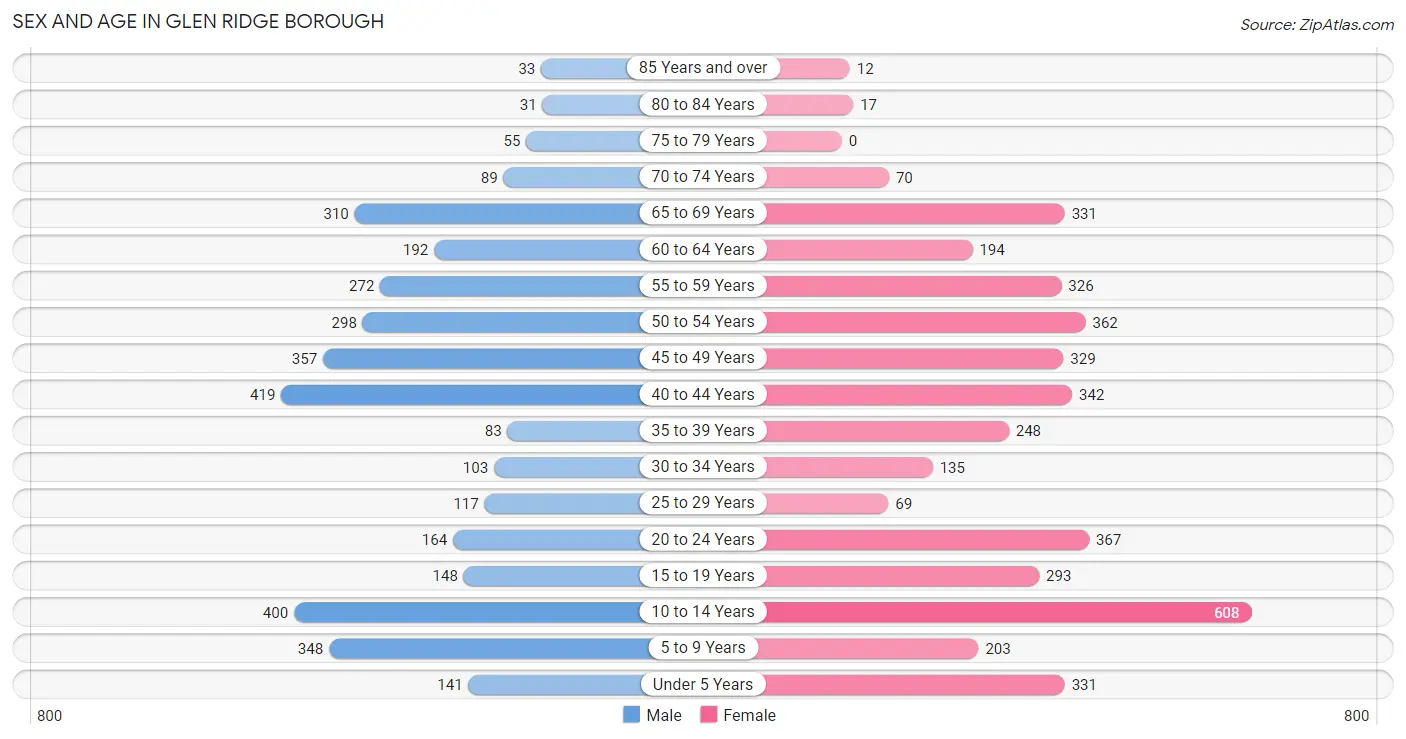
| Age Bracket | Male | Female |
| Under 5 Years | 141 (4.0%) | 331 (7.8%) |
| 5 to 9 Years | 348 (9.8%) | 203 (4.8%) |
| 10 to 14 Years | 400 (11.2%) | 608 (14.3%) |
| 15 to 19 Years | 148 (4.2%) | 293 (6.9%) |
| 20 to 24 Years | 164 (4.6%) | 367 (8.7%) |
| 25 to 29 Years | 117 (3.3%) | 69 (1.6%) |
| 30 to 34 Years | 103 (2.9%) | 135 (3.2%) |
| 35 to 39 Years | 83 (2.3%) | 248 (5.9%) |
| 40 to 44 Years | 419 (11.8%) | 342 (8.1%) |
| 45 to 49 Years | 357 (10.0%) | 329 (7.8%) |
| 50 to 54 Years | 298 (8.4%) | 362 (8.5%) |
| 55 to 59 Years | 272 (7.6%) | 326 (7.7%) |
| 60 to 64 Years | 192 (5.4%) | 194 (4.6%) |
| 65 to 69 Years | 310 (8.7%) | 331 (7.8%) |
| 70 to 74 Years | 89 (2.5%) | 70 (1.7%) |
| 75 to 79 Years | 55 (1.5%) | 0 (0.0%) |
| 80 to 84 Years | 31 (0.9%) | 17 (0.4%) |
| 85 Years and over | 33 (0.9%) | 12 (0.3%) |
| Total | 3,560 (100.0%) | 4,237 (100.0%) |
Families and Households in Glen Ridge borough
Median Family Size in Glen Ridge borough
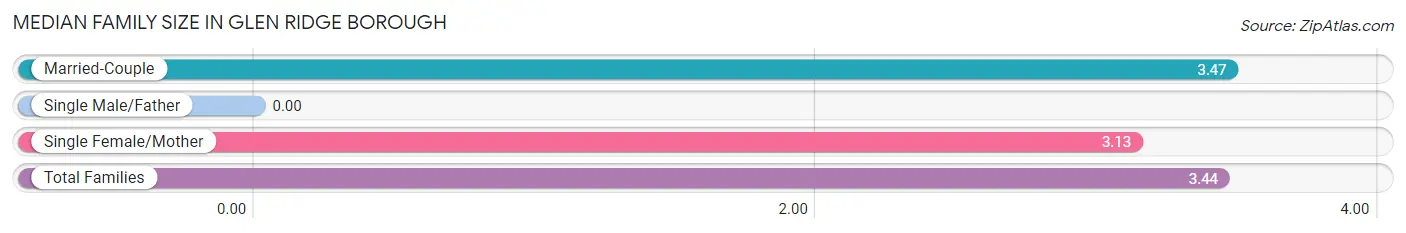
| Family Type | # Families | Family Size |
| Married-Couple | 1,969 (91.1%) | 3.47 |
| Single Male/Father | 0 (0.0%) | - |
| Single Female/Mother | 192 (8.9%) | 3.13 |
| Total Families | 2,161 (100.0%) | 3.44 |
Median Household Size in Glen Ridge borough
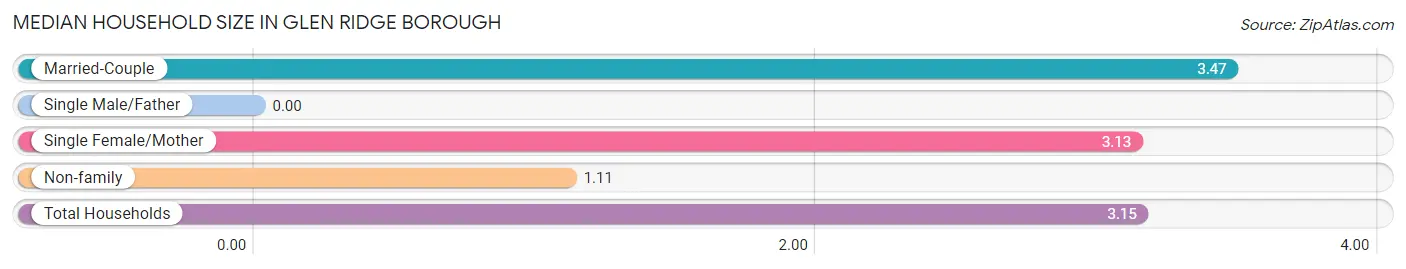
| Household Type | # Households | Household Size |
| Married-Couple | 1,969 (80.0%) | 3.47 |
| Single Male/Father | 0 (0.0%) | - |
| Single Female/Mother | 192 (7.8%) | 3.13 |
| Non-family | 301 (12.2%) | 1.11 |
| Total Households | 2,462 (100.0%) | 3.15 |
Household Size by Marriage Status in Glen Ridge borough
Out of a total of 2,462 households in Glen Ridge borough, 2,161 (87.8%) are family households, while 301 (12.2%) are nonfamily households. The most numerous type of family households are 2-person households, comprising 631, and the most common type of nonfamily households are 1-person households, comprising 267.
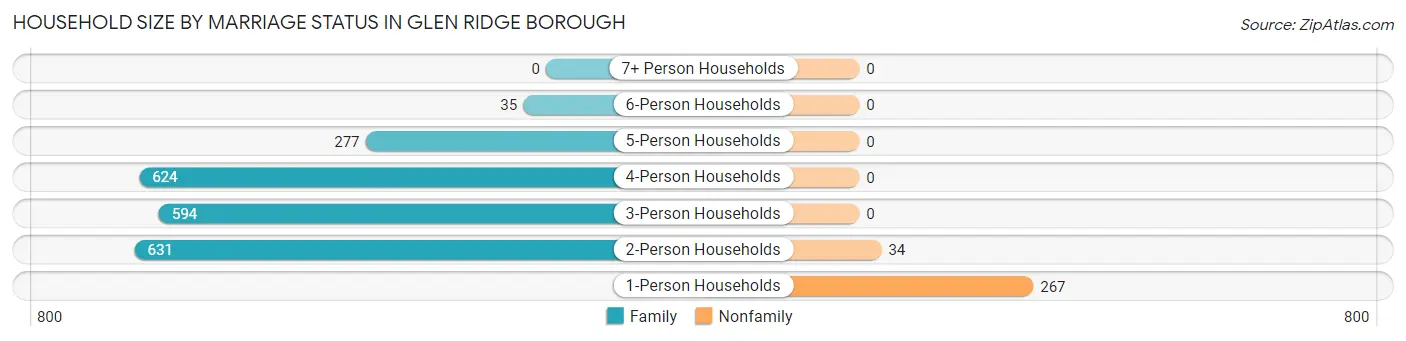
| Household Size | Family Households | Nonfamily Households |
| 1-Person Households | - | 267 (10.8%) |
| 2-Person Households | 631 (25.6%) | 34 (1.4%) |
| 3-Person Households | 594 (24.1%) | 0 (0.0%) |
| 4-Person Households | 624 (25.4%) | 0 (0.0%) |
| 5-Person Households | 277 (11.3%) | 0 (0.0%) |
| 6-Person Households | 35 (1.4%) | 0 (0.0%) |
| 7+ Person Households | 0 (0.0%) | 0 (0.0%) |
| Total | 2,161 (87.8%) | 301 (12.2%) |
Female Fertility in Glen Ridge borough
Fertility by Age in Glen Ridge borough
Average fertility rate in Glen Ridge borough is 24.0 births per 1,000 women. Women in the age bracket of 35 to 50 years have the highest fertility rate with 44.0 births per 1,000 women. Women in the age bracket of 35 to 50 years acount for 97.8% of all women with births.
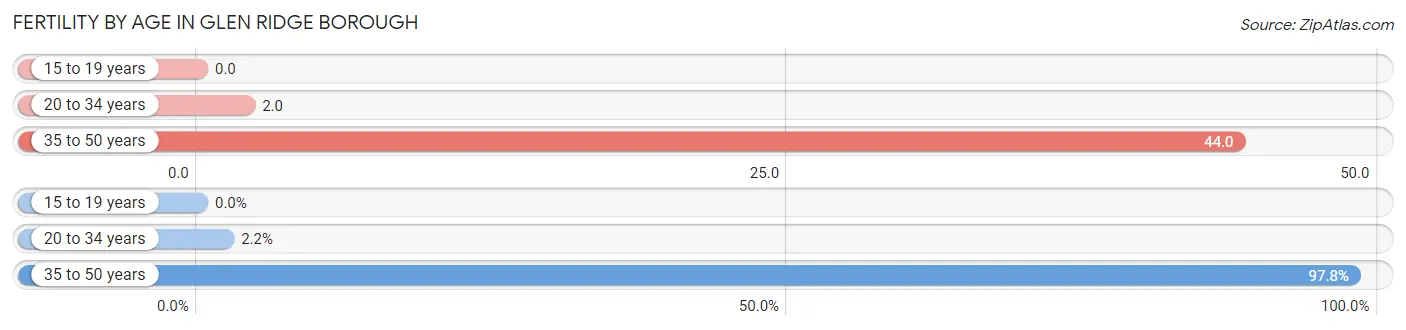
| Age Bracket | Women with Births | Births / 1,000 Women |
| 15 to 19 years | 0 (0.0%) | 0.0 |
| 20 to 34 years | 1 (2.2%) | 2.0 |
| 35 to 50 years | 44 (97.8%) | 44.0 |
| Total | 45 (100.0%) | 24.0 |
Fertility by Age by Marriage Status in Glen Ridge borough
97.8% of women with births (45) in Glen Ridge borough are married. The highest percentage of unmarried women with births falls into 20 to 34 years age bracket with 100.0% of them unmarried at the time of birth, while the lowest percentage of unmarried women with births belong to 35 to 50 years age bracket with 0.0% of them unmarried.
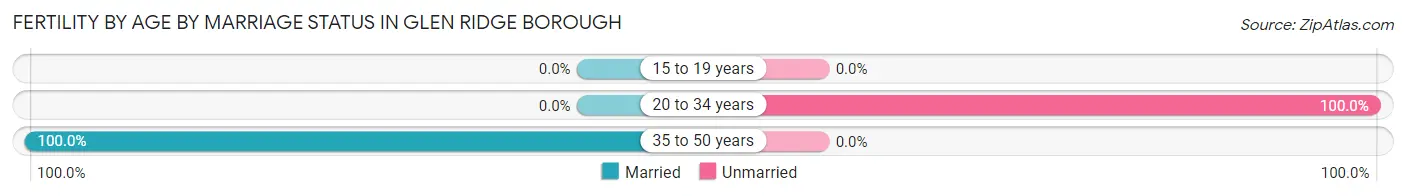
| Age Bracket | Married | Unmarried |
| 15 to 19 years | 0 (0.0%) | 0 (0.0%) |
| 20 to 34 years | 0 (0.0%) | 1 (100.0%) |
| 35 to 50 years | 44 (100.0%) | 0 (0.0%) |
| Total | 44 (97.8%) | 1 (2.2%) |
Fertility by Education in Glen Ridge borough
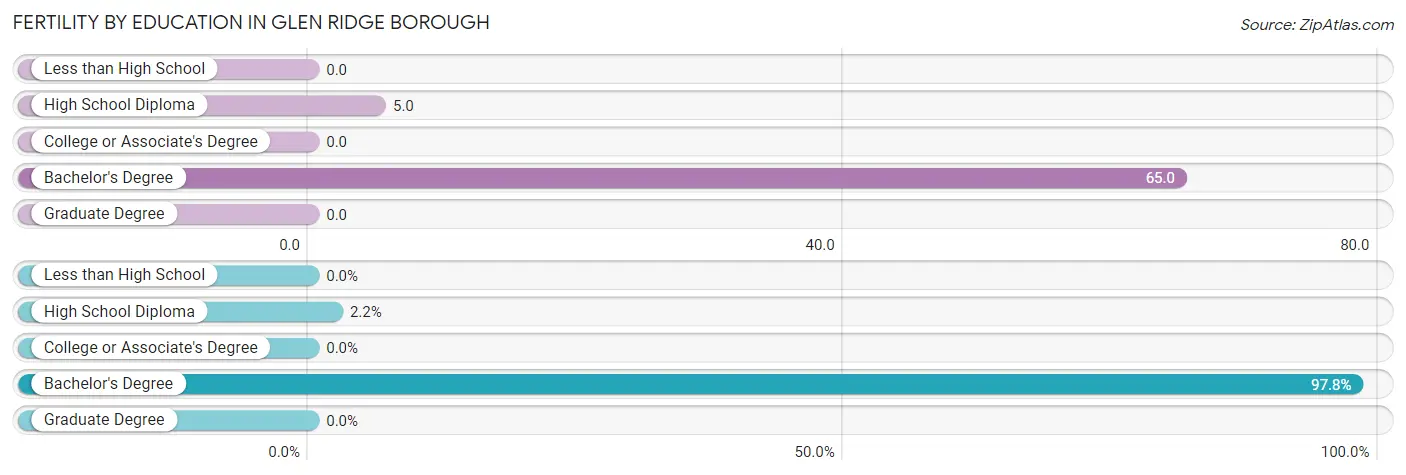
| Educational Attainment | Women with Births | Births / 1,000 Women |
| Less than High School | 0 (0.0%) | 0.0 |
| High School Diploma | 1 (2.2%) | 5.0 |
| College or Associate's Degree | 0 (0.0%) | 0.0 |
| Bachelor's Degree | 44 (97.8%) | 65.0 |
| Graduate Degree | 0 (0.0%) | 0.0 |
| Total | 45 (100.0%) | 24.0 |
Fertility by Education by Marriage Status in Glen Ridge borough
2.2% of women with births in Glen Ridge borough are unmarried. Women with the educational attainment of bachelor's degree are most likely to be married with 100.0% of them married at childbirth, while women with the educational attainment of high school diploma are least likely to be married with 100.0% of them unmarried at childbirth.
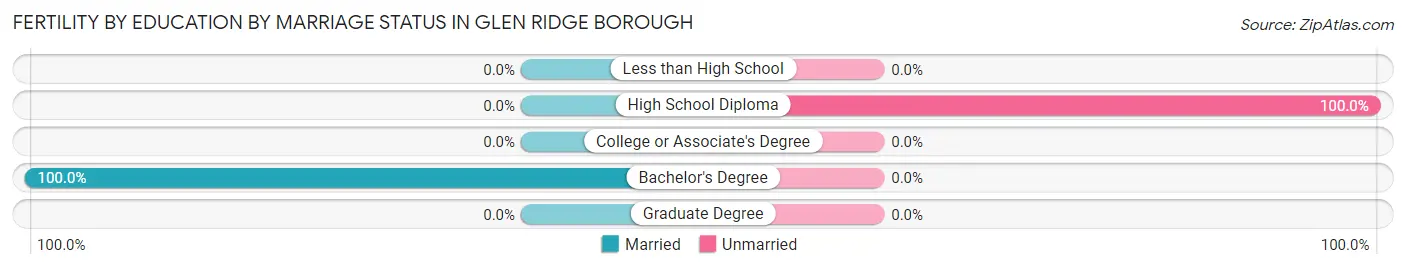
| Educational Attainment | Married | Unmarried |
| Less than High School | 0 (0.0%) | 0 (0.0%) |
| High School Diploma | 0 (0.0%) | 1 (100.0%) |
| College or Associate's Degree | 0 (0.0%) | 0 (0.0%) |
| Bachelor's Degree | 44 (100.0%) | 0 (0.0%) |
| Graduate Degree | 0 (0.0%) | 0 (0.0%) |
| Total | 44 (97.8%) | 1 (2.2%) |
Employment Characteristics in Glen Ridge borough
Employment by Class of Employer in Glen Ridge borough
Among the 3,740 employed individuals in Glen Ridge borough, private company employees (2,586 | 69.1%), local government employees (407 | 10.9%), and not-for-profit organizations (292 | 7.8%) make up the most common classes of employment.
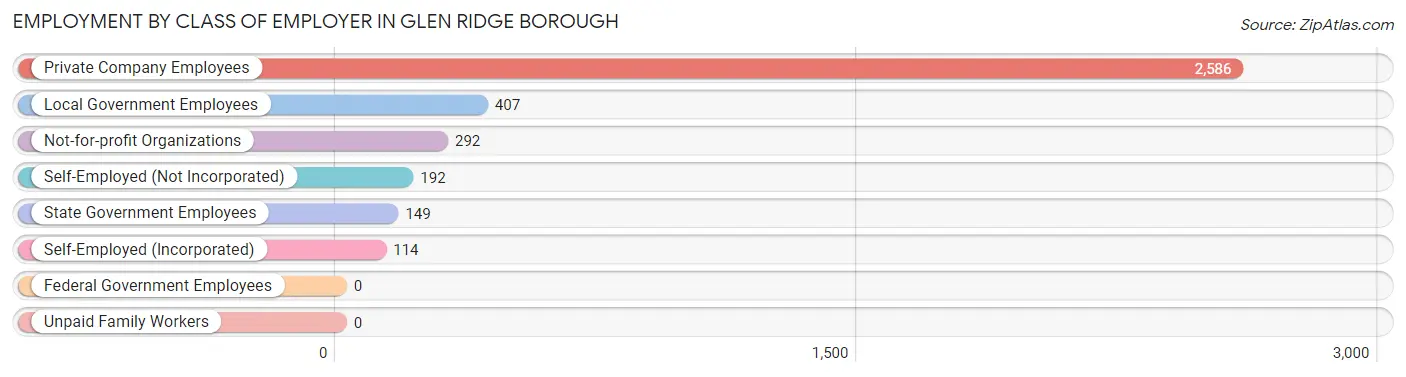
| Employer Class | # Employees | % Employees |
| Private Company Employees | 2,586 | 69.1% |
| Self-Employed (Incorporated) | 114 | 3.0% |
| Self-Employed (Not Incorporated) | 192 | 5.1% |
| Not-for-profit Organizations | 292 | 7.8% |
| Local Government Employees | 407 | 10.9% |
| State Government Employees | 149 | 4.0% |
| Federal Government Employees | 0 | 0.0% |
| Unpaid Family Workers | 0 | 0.0% |
| Total | 3,740 | 100.0% |
Employment Status by Age in Glen Ridge borough
According to the labor force statistics for Glen Ridge borough, out of the total population over 16 years of age (5,744), 69.9% or 4,015 individuals are in the labor force, with 6.2% or 249 of them unemployed. The age group with the highest labor force participation rate is 35 to 44 years, with 91.5% or 999 individuals in the labor force. Within the labor force, the 20 to 24 years age range has the highest percentage of unemployed individuals, with 61.5% or 144 of them being unemployed.
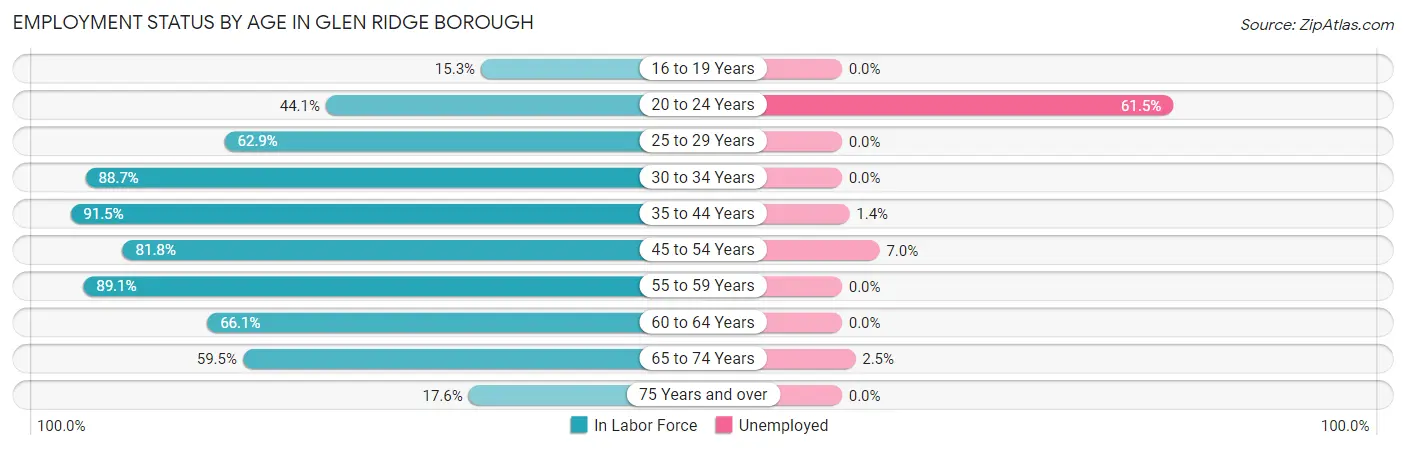
| Age Bracket | In Labor Force | Unemployed |
| 16 to 19 Years | 64 (15.3%) | 0 (0.0%) |
| 20 to 24 Years | 234 (44.1%) | 144 (61.5%) |
| 25 to 29 Years | 117 (62.9%) | 0 (0.0%) |
| 30 to 34 Years | 211 (88.7%) | 0 (0.0%) |
| 35 to 44 Years | 999 (91.5%) | 14 (1.4%) |
| 45 to 54 Years | 1,101 (81.8%) | 77 (7.0%) |
| 55 to 59 Years | 533 (89.1%) | 0 (0.0%) |
| 60 to 64 Years | 255 (66.1%) | 0 (0.0%) |
| 65 to 74 Years | 476 (59.5%) | 12 (2.5%) |
| 75 Years and over | 26 (17.6%) | 0 (0.0%) |
| Total | 4,015 (69.9%) | 249 (6.2%) |
Employment Status by Educational Attainment in Glen Ridge borough
According to labor force statistics for Glen Ridge borough, 83.6% of individuals (3,215) out of the total population between 25 and 64 years of age (3,846) are in the labor force, with 2.8% or 90 of them being unemployed. The group with the highest labor force participation rate are those with the educational attainment of college / associate degree, with 88.7% or 289 individuals in the labor force. Within the labor force, individuals with high school diploma education have the highest percentage of unemployment, with 20.1% or 35 of them being unemployed.
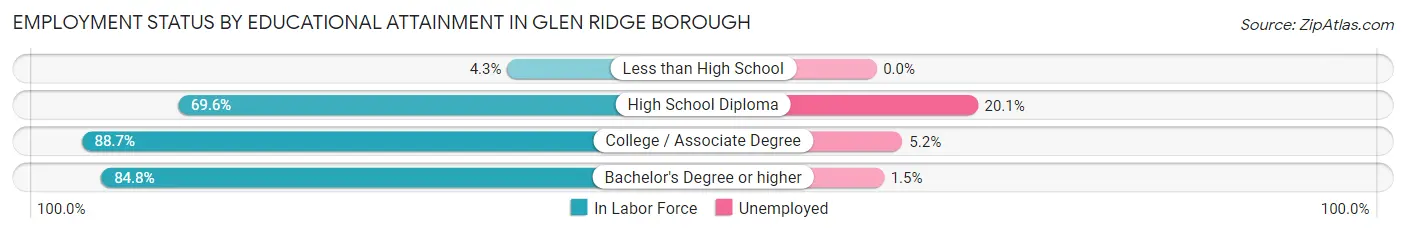
| Educational Attainment | In Labor Force | Unemployed |
| Less than High School | 1 (4.3%) | 0 (0.0%) |
| High School Diploma | 174 (69.6%) | 50 (20.1%) |
| College / Associate Degree | 289 (88.7%) | 17 (5.2%) |
| Bachelor's Degree or higher | 2,753 (84.8%) | 49 (1.5%) |
| Total | 3,215 (83.6%) | 108 (2.8%) |
Employment Occupations by Sex in Glen Ridge borough
Management, Business, Science and Arts Occupations
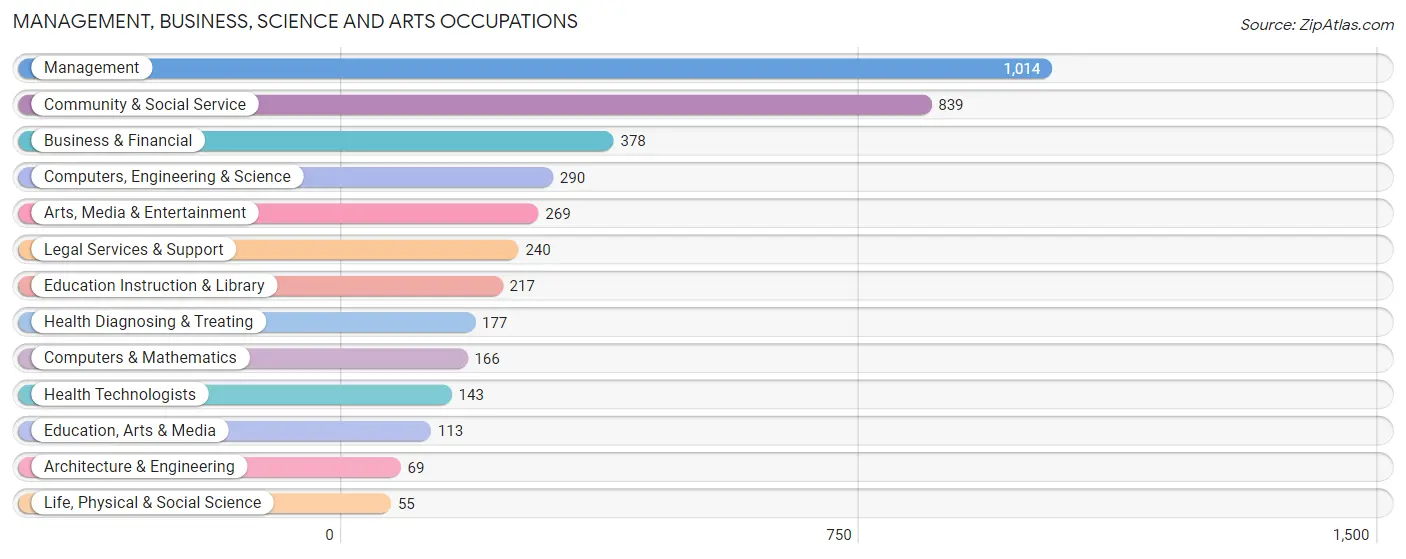
The most common Management, Business, Science and Arts occupations in Glen Ridge borough are Management (1,014 | 26.9%), Community & Social Service (839 | 22.3%), Business & Financial (378 | 10.0%), Computers, Engineering & Science (290 | 7.7%), and Arts, Media & Entertainment (269 | 7.1%).
Management, Business, Science and Arts Occupations by Sex
Within the Management, Business, Science and Arts occupations in Glen Ridge borough, the most male-oriented occupations are Architecture & Engineering (100.0%), Legal Services & Support (82.5%), and Management (69.0%), while the most female-oriented occupations are Education, Arts & Media (100.0%), Education Instruction & Library (83.9%), and Arts, Media & Entertainment (80.7%).
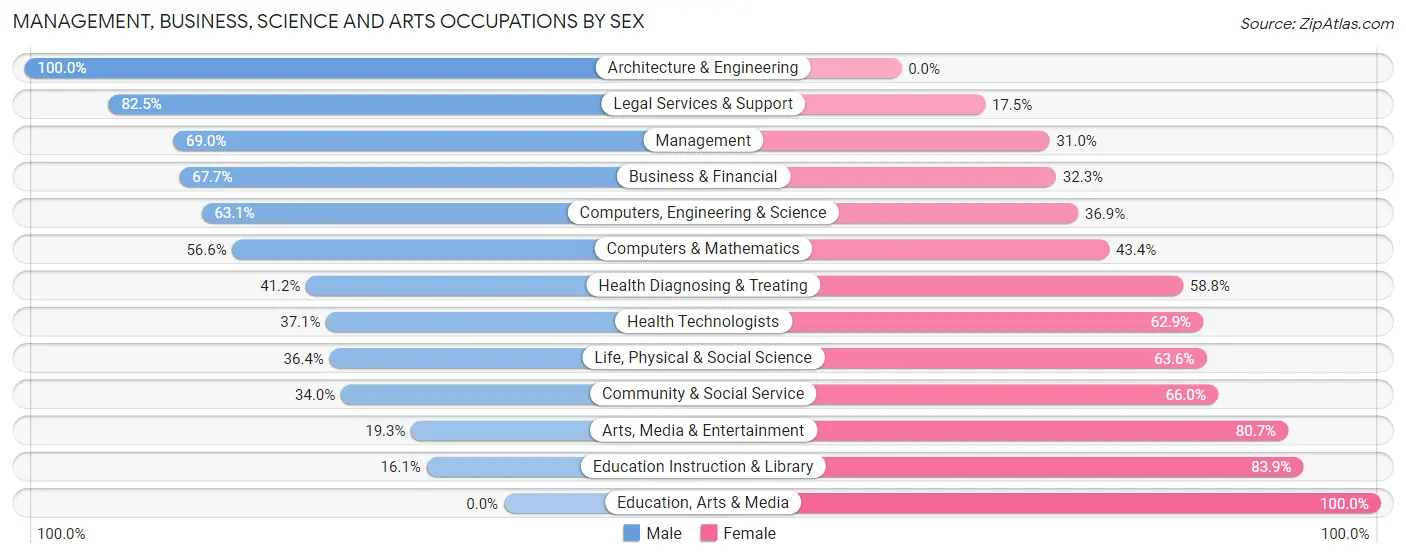
| Occupation | Male | Female |
| Management | 700 (69.0%) | 314 (31.0%) |
| Business & Financial | 256 (67.7%) | 122 (32.3%) |
| Computers, Engineering & Science | 183 (63.1%) | 107 (36.9%) |
| Computers & Mathematics | 94 (56.6%) | 72 (43.4%) |
| Architecture & Engineering | 69 (100.0%) | 0 (0.0%) |
| Life, Physical & Social Science | 20 (36.4%) | 35 (63.6%) |
| Community & Social Service | 285 (34.0%) | 554 (66.0%) |
| Education, Arts & Media | 0 (0.0%) | 113 (100.0%) |
| Legal Services & Support | 198 (82.5%) | 42 (17.5%) |
| Education Instruction & Library | 35 (16.1%) | 182 (83.9%) |
| Arts, Media & Entertainment | 52 (19.3%) | 217 (80.7%) |
| Health Diagnosing & Treating | 73 (41.2%) | 104 (58.8%) |
| Health Technologists | 53 (37.1%) | 90 (62.9%) |
| Total (Category) | 1,497 (55.5%) | 1,201 (44.5%) |
| Total (Overall) | 1,940 (51.5%) | 1,829 (48.5%) |
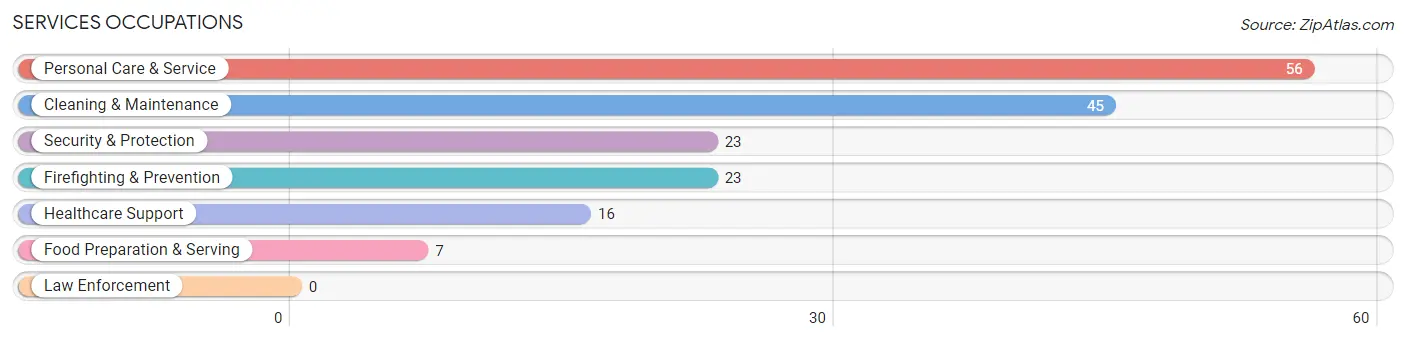
Services Occupations
The most common Services occupations in Glen Ridge borough are Personal Care & Service (56 | 1.5%), Cleaning & Maintenance (45 | 1.2%), Security & Protection (23 | 0.6%), Firefighting & Prevention (23 | 0.6%), and Healthcare Support (16 | 0.4%).
Services Occupations by Sex
Within the Services occupations in Glen Ridge borough, the most male-oriented occupations are Security & Protection (100.0%), Firefighting & Prevention (100.0%), and Food Preparation & Serving (100.0%), while the most female-oriented occupations are Healthcare Support (100.0%), and Personal Care & Service (89.3%).
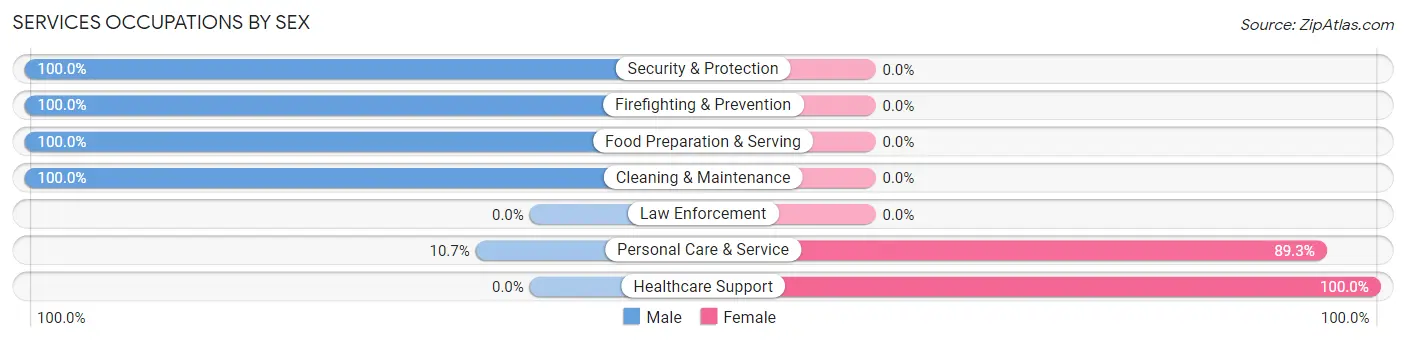
| Occupation | Male | Female |
| Healthcare Support | 0 (0.0%) | 16 (100.0%) |
| Security & Protection | 23 (100.0%) | 0 (0.0%) |
| Firefighting & Prevention | 23 (100.0%) | 0 (0.0%) |
| Law Enforcement | 0 (0.0%) | 0 (0.0%) |
| Food Preparation & Serving | 7 (100.0%) | 0 (0.0%) |
| Cleaning & Maintenance | 45 (100.0%) | 0 (0.0%) |
| Personal Care & Service | 6 (10.7%) | 50 (89.3%) |
| Total (Category) | 81 (55.1%) | 66 (44.9%) |
| Total (Overall) | 1,940 (51.5%) | 1,829 (48.5%) |
Sales and Office Occupations
The most common Sales and Office occupations in Glen Ridge borough are Sales & Related (500 | 13.3%), and Office & Administration (339 | 9.0%).
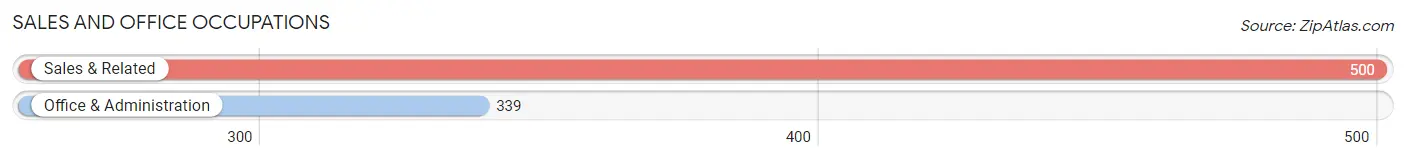
Sales and Office Occupations by Sex

| Occupation | Male | Female |
| Sales & Related | 219 (43.8%) | 281 (56.2%) |
| Office & Administration | 58 (17.1%) | 281 (82.9%) |
| Total (Category) | 277 (33.0%) | 562 (67.0%) |
| Total (Overall) | 1,940 (51.5%) | 1,829 (48.5%) |
Natural Resources, Construction and Maintenance Occupations
The most common Natural Resources, Construction and Maintenance occupations in Glen Ridge borough are , and Installation, Maintenance & Repair (70 | 1.9%).
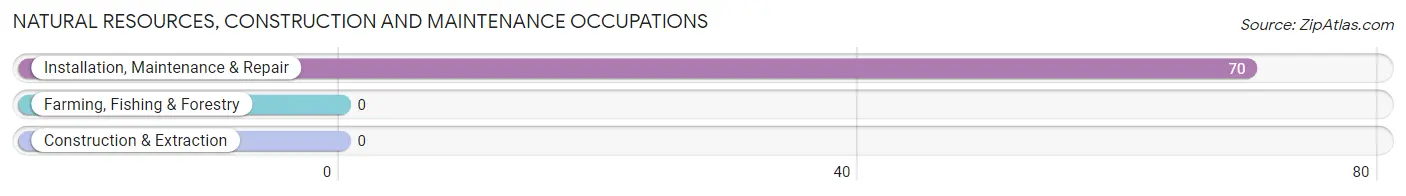
Natural Resources, Construction and Maintenance Occupations by Sex

| Occupation | Male | Female |
| Farming, Fishing & Forestry | 0 (0.0%) | 0 (0.0%) |
| Construction & Extraction | 0 (0.0%) | 0 (0.0%) |
| Installation, Maintenance & Repair | 70 (100.0%) | 0 (0.0%) |
| Total (Category) | 70 (100.0%) | 0 (0.0%) |
| Total (Overall) | 1,940 (51.5%) | 1,829 (48.5%) |
Production, Transportation and Moving Occupations
The most common Production, Transportation and Moving occupations in Glen Ridge borough are , and Production (15 | 0.4%).
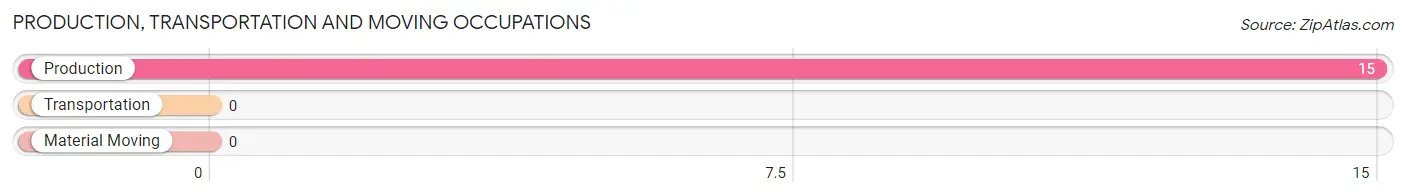
Production, Transportation and Moving Occupations by Sex
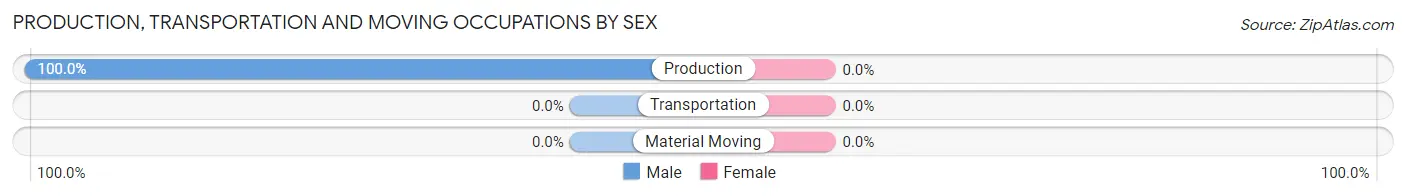
| Occupation | Male | Female |
| Production | 15 (100.0%) | 0 (0.0%) |
| Transportation | 0 (0.0%) | 0 (0.0%) |
| Material Moving | 0 (0.0%) | 0 (0.0%) |
| Total (Category) | 15 (100.0%) | 0 (0.0%) |
| Total (Overall) | 1,940 (51.5%) | 1,829 (48.5%) |
Employment Industries by Sex in Glen Ridge borough
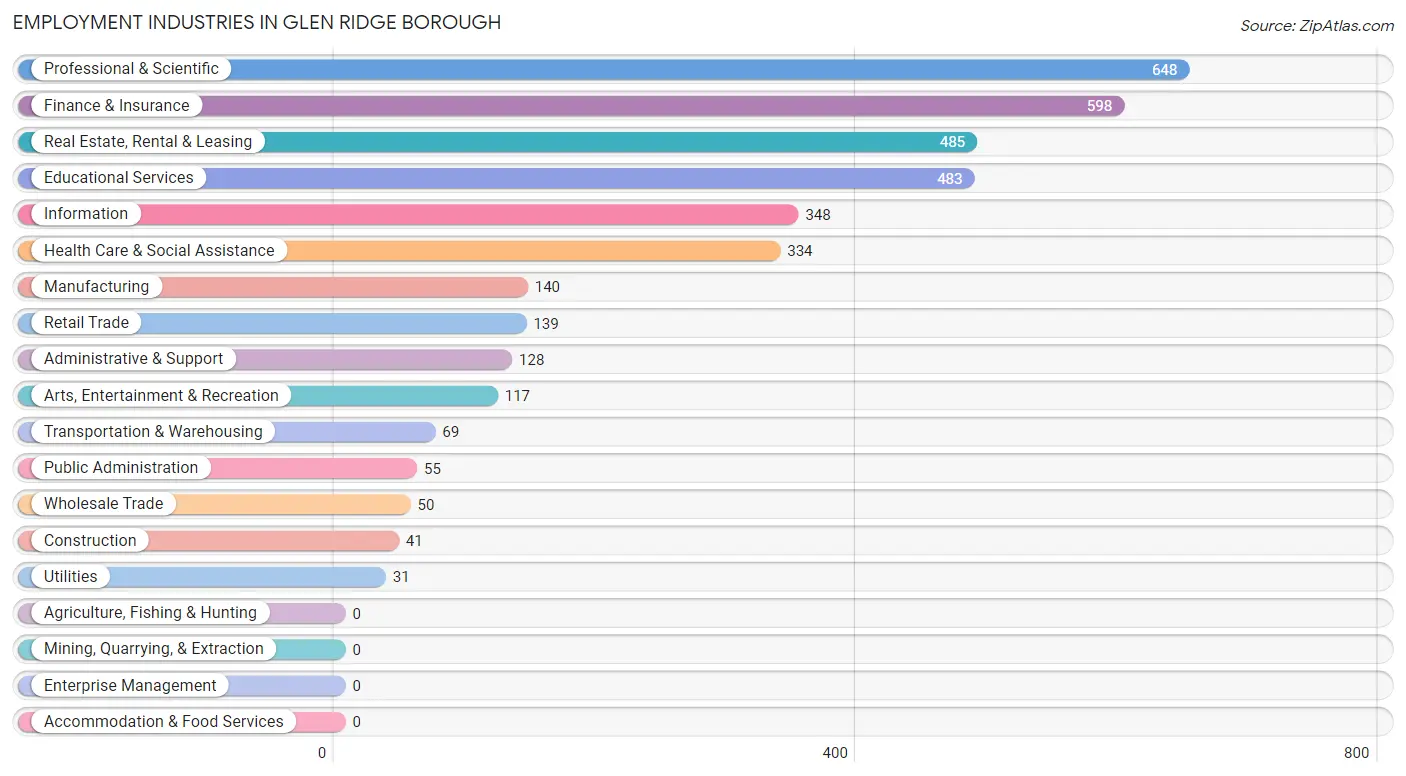
Employment Industries in Glen Ridge borough
The major employment industries in Glen Ridge borough include Professional & Scientific (648 | 17.2%), Finance & Insurance (598 | 15.9%), Real Estate, Rental & Leasing (485 | 12.9%), Educational Services (483 | 12.8%), and Information (348 | 9.2%).
Employment Industries by Sex in Glen Ridge borough
The Glen Ridge borough industries that see more men than women are Transportation & Warehousing (100.0%), Utilities (100.0%), and Finance & Insurance (82.9%), whereas the industries that tend to have a higher number of women are Retail Trade (88.5%), Construction (80.5%), and Arts, Entertainment & Recreation (75.2%).
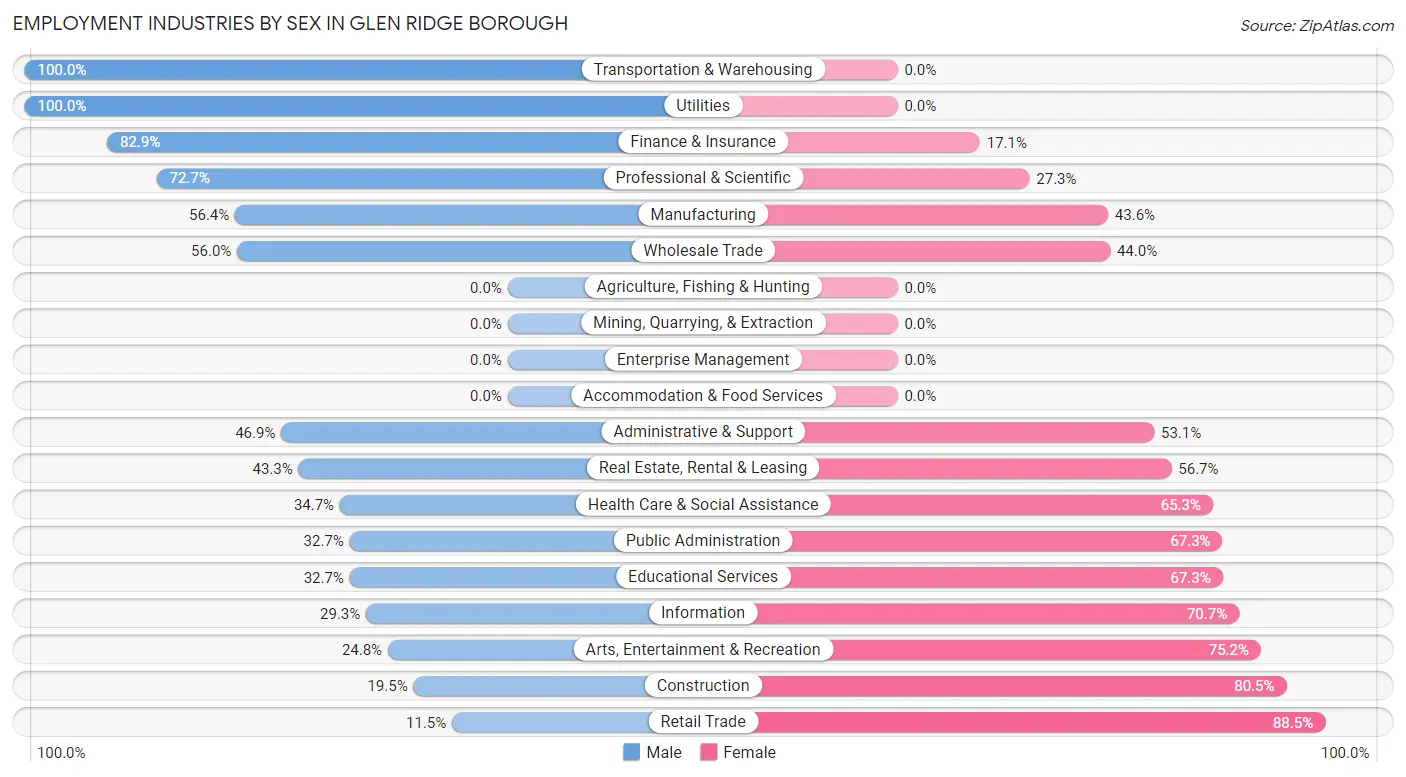
| Industry | Male | Female |
| Agriculture, Fishing & Hunting | 0 (0.0%) | 0 (0.0%) |
| Mining, Quarrying, & Extraction | 0 (0.0%) | 0 (0.0%) |
| Construction | 8 (19.5%) | 33 (80.5%) |
| Manufacturing | 79 (56.4%) | 61 (43.6%) |
| Wholesale Trade | 28 (56.0%) | 22 (44.0%) |
| Retail Trade | 16 (11.5%) | 123 (88.5%) |
| Transportation & Warehousing | 69 (100.0%) | 0 (0.0%) |
| Utilities | 31 (100.0%) | 0 (0.0%) |
| Information | 102 (29.3%) | 246 (70.7%) |
| Finance & Insurance | 496 (82.9%) | 102 (17.1%) |
| Real Estate, Rental & Leasing | 210 (43.3%) | 275 (56.7%) |
| Professional & Scientific | 471 (72.7%) | 177 (27.3%) |
| Enterprise Management | 0 (0.0%) | 0 (0.0%) |
| Administrative & Support | 60 (46.9%) | 68 (53.1%) |
| Educational Services | 158 (32.7%) | 325 (67.3%) |
| Health Care & Social Assistance | 116 (34.7%) | 218 (65.3%) |
| Arts, Entertainment & Recreation | 29 (24.8%) | 88 (75.2%) |
| Accommodation & Food Services | 0 (0.0%) | 0 (0.0%) |
| Public Administration | 18 (32.7%) | 37 (67.3%) |
| Total | 1,940 (51.5%) | 1,829 (48.5%) |
Education in Glen Ridge borough
School Enrollment in Glen Ridge borough
The most common levels of schooling among the 2,507 students in Glen Ridge borough are middle school (858 | 34.2%), high school (469 | 18.7%), and elementary school (391 | 15.6%).
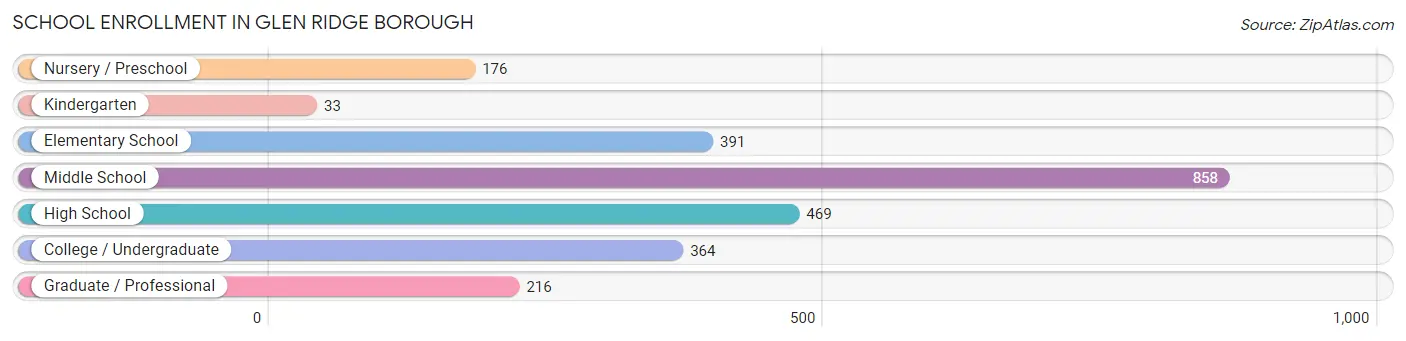
| School Level | # Students | % Students |
| Nursery / Preschool | 176 | 7.0% |
| Kindergarten | 33 | 1.3% |
| Elementary School | 391 | 15.6% |
| Middle School | 858 | 34.2% |
| High School | 469 | 18.7% |
| College / Undergraduate | 364 | 14.5% |
| Graduate / Professional | 216 | 8.6% |
| Total | 2,507 | 100.0% |
School Enrollment by Age by Funding Source in Glen Ridge borough
Out of a total of 2,507 students who are enrolled in schools in Glen Ridge borough, 456 (18.2%) attend a private institution, while the remaining 2,051 (81.8%) are enrolled in public schools. The age group of 18 to 19 year olds has the highest likelihood of being enrolled in private schools, with 93 (75.0% in the age bracket) enrolled. Conversely, the age group of 10 to 14 year olds has the lowest likelihood of being enrolled in a private school, with 971 (98.1% in the age bracket) attending a public institution.
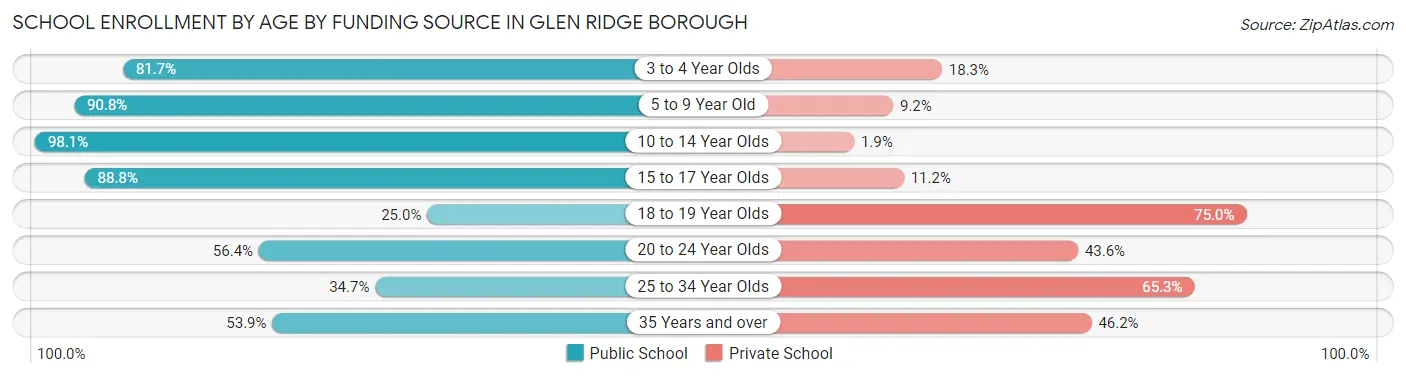
| Age Bracket | Public School | Private School |
| 3 to 4 Year Olds | 67 (81.7%) | 15 (18.3%) |
| 5 to 9 Year Old | 454 (90.8%) | 46 (9.2%) |
| 10 to 14 Year Olds | 971 (98.1%) | 19 (1.9%) |
| 15 to 17 Year Olds | 262 (88.8%) | 33 (11.2%) |
| 18 to 19 Year Olds | 31 (25.0%) | 93 (75.0%) |
| 20 to 24 Year Olds | 155 (56.4%) | 120 (43.6%) |
| 25 to 34 Year Olds | 34 (34.7%) | 64 (65.3%) |
| 35 Years and over | 77 (53.8%) | 66 (46.2%) |
| Total | 2,051 (81.8%) | 456 (18.2%) |
Educational Attainment by Field of Study in Glen Ridge borough
Business (875 | 20.3%), social sciences (707 | 16.4%), literature & languages (510 | 11.8%), liberal arts & history (423 | 9.8%), and communications (375 | 8.7%) are the most common fields of study among 4,304 individuals in Glen Ridge borough who have obtained a bachelor's degree or higher.
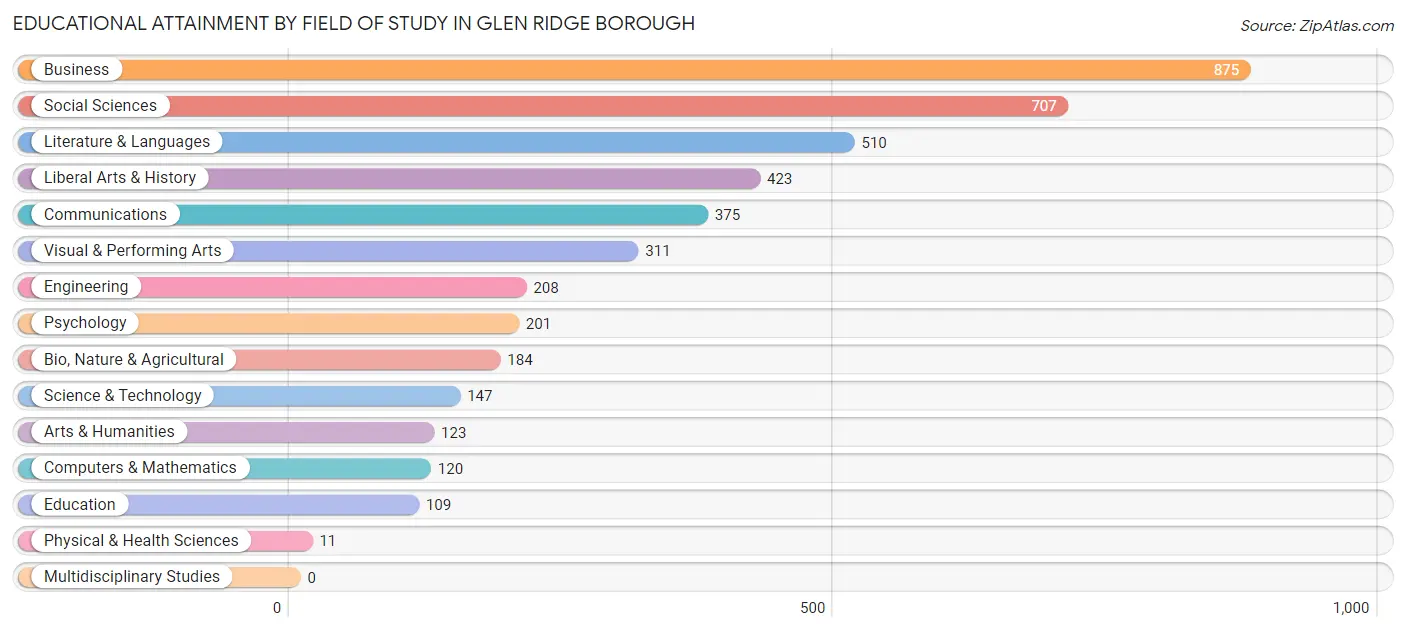
| Field of Study | # Graduates | % Graduates |
| Computers & Mathematics | 120 | 2.8% |
| Bio, Nature & Agricultural | 184 | 4.3% |
| Physical & Health Sciences | 11 | 0.3% |
| Psychology | 201 | 4.7% |
| Social Sciences | 707 | 16.4% |
| Engineering | 208 | 4.8% |
| Multidisciplinary Studies | 0 | 0.0% |
| Science & Technology | 147 | 3.4% |
| Business | 875 | 20.3% |
| Education | 109 | 2.5% |
| Literature & Languages | 510 | 11.8% |
| Liberal Arts & History | 423 | 9.8% |
| Visual & Performing Arts | 311 | 7.2% |
| Communications | 375 | 8.7% |
| Arts & Humanities | 123 | 2.9% |
| Total | 4,304 | 100.0% |
Transportation & Commute in Glen Ridge borough
Vehicle Availability by Sex in Glen Ridge borough
The most prevalent vehicle ownership categories in Glen Ridge borough are males with 2 vehicles (1,048, accounting for 54.0%) and females with 2 vehicles (879, making up 58.2%).
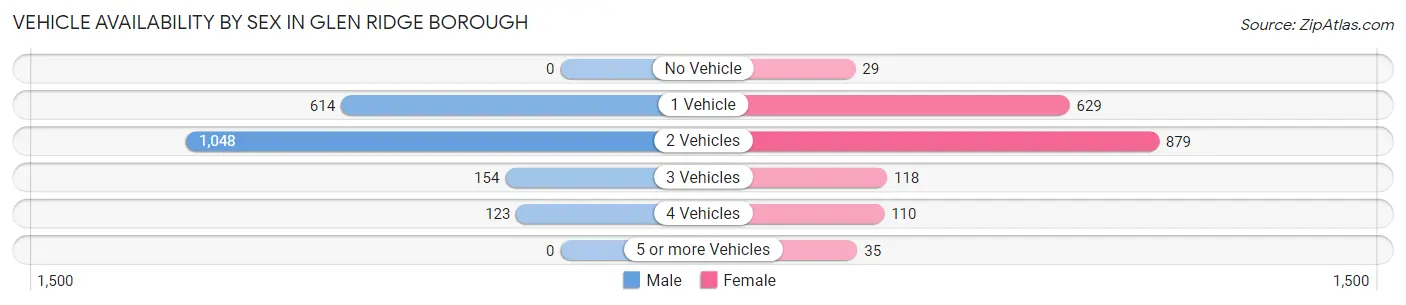
| Vehicles Available | Male | Female |
| No Vehicle | 0 (0.0%) | 29 (1.6%) |
| 1 Vehicle | 614 (31.7%) | 629 (34.9%) |
| 2 Vehicles | 1,048 (54.0%) | 879 (48.8%) |
| 3 Vehicles | 154 (7.9%) | 118 (6.6%) |
| 4 Vehicles | 123 (6.3%) | 110 (6.1%) |
| 5 or more Vehicles | 0 (0.0%) | 35 (1.9%) |
| Total | 1,939 (100.0%) | 1,800 (100.0%) |
Commute Time in Glen Ridge borough
The most frequently occuring commute durations in Glen Ridge borough are 60 to 89 minutes (666 commuters, 23.9%), 10 to 14 minutes (465 commuters, 16.7%), and 30 to 34 minutes (344 commuters, 12.3%).
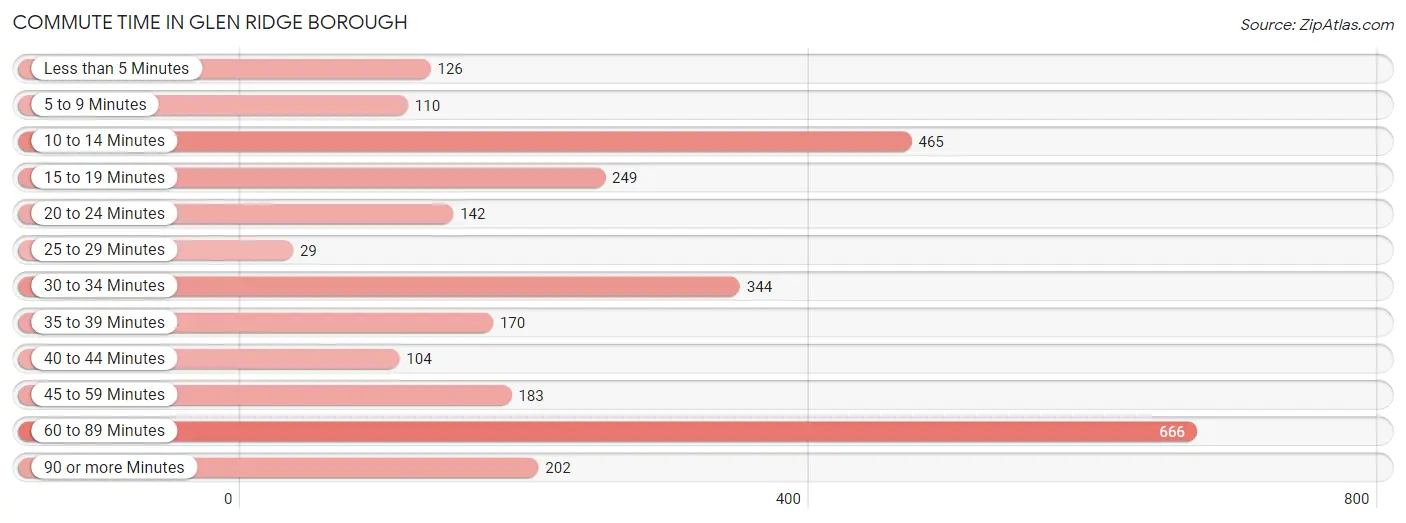
| Commute Time | # Commuters | % Commuters |
| Less than 5 Minutes | 126 | 4.5% |
| 5 to 9 Minutes | 110 | 3.9% |
| 10 to 14 Minutes | 465 | 16.7% |
| 15 to 19 Minutes | 249 | 8.9% |
| 20 to 24 Minutes | 142 | 5.1% |
| 25 to 29 Minutes | 29 | 1.0% |
| 30 to 34 Minutes | 344 | 12.3% |
| 35 to 39 Minutes | 170 | 6.1% |
| 40 to 44 Minutes | 104 | 3.7% |
| 45 to 59 Minutes | 183 | 6.6% |
| 60 to 89 Minutes | 666 | 23.9% |
| 90 or more Minutes | 202 | 7.2% |
Commute Time by Sex in Glen Ridge borough
The most common commute times in Glen Ridge borough are 60 to 89 minutes (438 commuters, 30.2%) for males and 10 to 14 minutes (381 commuters, 28.4%) for females.
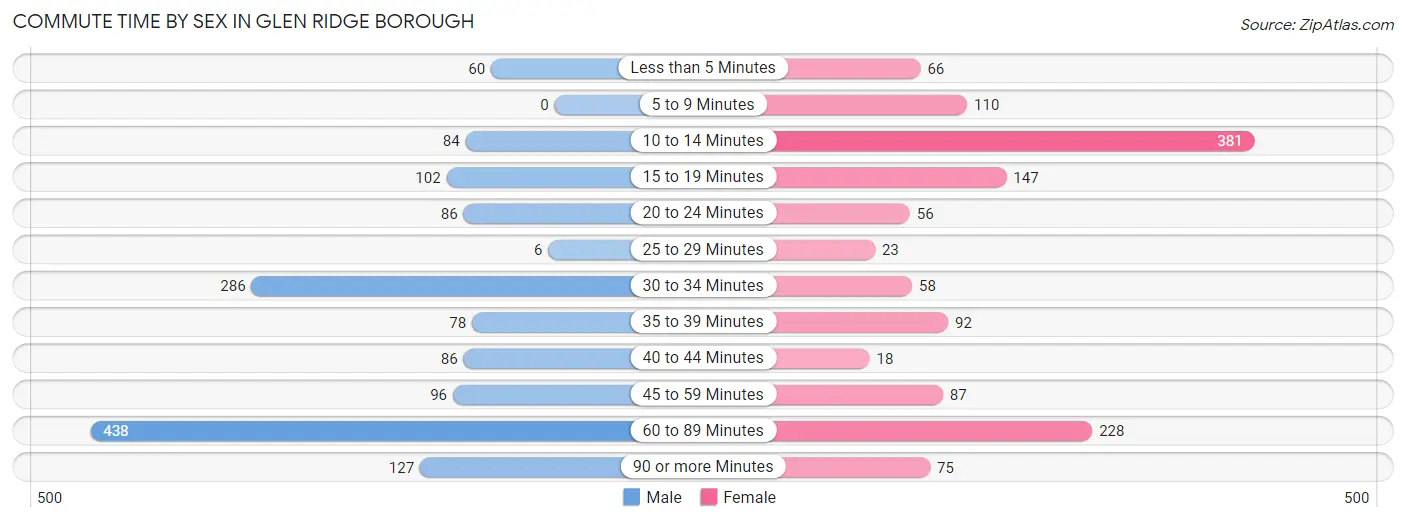
| Commute Time | Male | Female |
| Less than 5 Minutes | 60 (4.1%) | 66 (4.9%) |
| 5 to 9 Minutes | 0 (0.0%) | 110 (8.2%) |
| 10 to 14 Minutes | 84 (5.8%) | 381 (28.4%) |
| 15 to 19 Minutes | 102 (7.0%) | 147 (11.0%) |
| 20 to 24 Minutes | 86 (5.9%) | 56 (4.2%) |
| 25 to 29 Minutes | 6 (0.4%) | 23 (1.7%) |
| 30 to 34 Minutes | 286 (19.7%) | 58 (4.3%) |
| 35 to 39 Minutes | 78 (5.4%) | 92 (6.9%) |
| 40 to 44 Minutes | 86 (5.9%) | 18 (1.3%) |
| 45 to 59 Minutes | 96 (6.6%) | 87 (6.5%) |
| 60 to 89 Minutes | 438 (30.2%) | 228 (17.0%) |
| 90 or more Minutes | 127 (8.8%) | 75 (5.6%) |
Time of Departure to Work by Sex in Glen Ridge borough
The most frequent times of departure to work in Glen Ridge borough are 8:00 AM to 8:29 AM (460, 31.8%) for males and 8:00 AM to 8:29 AM (441, 32.9%) for females.
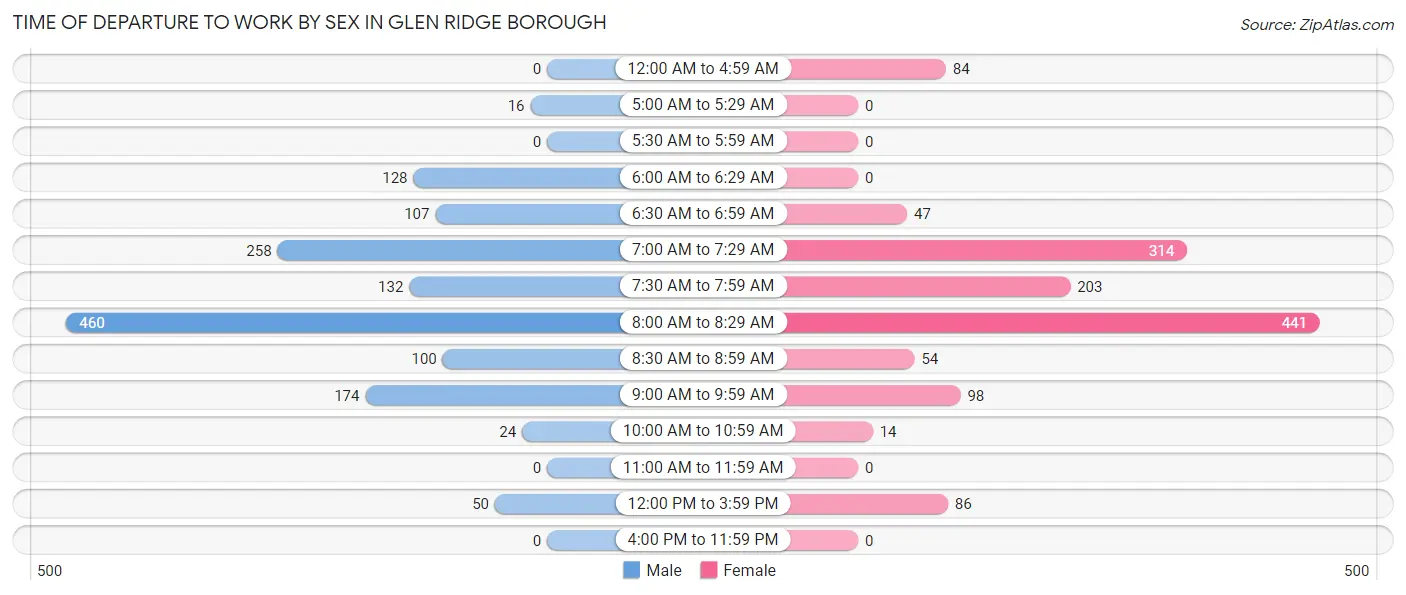
| Time of Departure | Male | Female |
| 12:00 AM to 4:59 AM | 0 (0.0%) | 84 (6.3%) |
| 5:00 AM to 5:29 AM | 16 (1.1%) | 0 (0.0%) |
| 5:30 AM to 5:59 AM | 0 (0.0%) | 0 (0.0%) |
| 6:00 AM to 6:29 AM | 128 (8.8%) | 0 (0.0%) |
| 6:30 AM to 6:59 AM | 107 (7.4%) | 47 (3.5%) |
| 7:00 AM to 7:29 AM | 258 (17.8%) | 314 (23.4%) |
| 7:30 AM to 7:59 AM | 132 (9.1%) | 203 (15.1%) |
| 8:00 AM to 8:29 AM | 460 (31.8%) | 441 (32.9%) |
| 8:30 AM to 8:59 AM | 100 (6.9%) | 54 (4.0%) |
| 9:00 AM to 9:59 AM | 174 (12.0%) | 98 (7.3%) |
| 10:00 AM to 10:59 AM | 24 (1.7%) | 14 (1.0%) |
| 11:00 AM to 11:59 AM | 0 (0.0%) | 0 (0.0%) |
| 12:00 PM to 3:59 PM | 50 (3.5%) | 86 (6.4%) |
| 4:00 PM to 11:59 PM | 0 (0.0%) | 0 (0.0%) |
| Total | 1,449 (100.0%) | 1,341 (100.0%) |
Housing Occupancy in Glen Ridge borough
Occupancy by Ownership in Glen Ridge borough
Of the total 2,462 dwellings in Glen Ridge borough, owner-occupied units account for 2,346 (95.3%), while renter-occupied units make up 116 (4.7%).
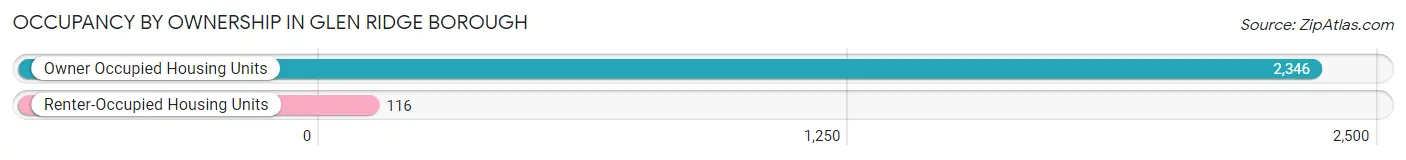
| Occupancy | # Housing Units | % Housing Units |
| Owner Occupied Housing Units | 2,346 | 95.3% |
| Renter-Occupied Housing Units | 116 | 4.7% |
| Total Occupied Housing Units | 2,462 | 100.0% |
Occupancy by Household Size in Glen Ridge borough
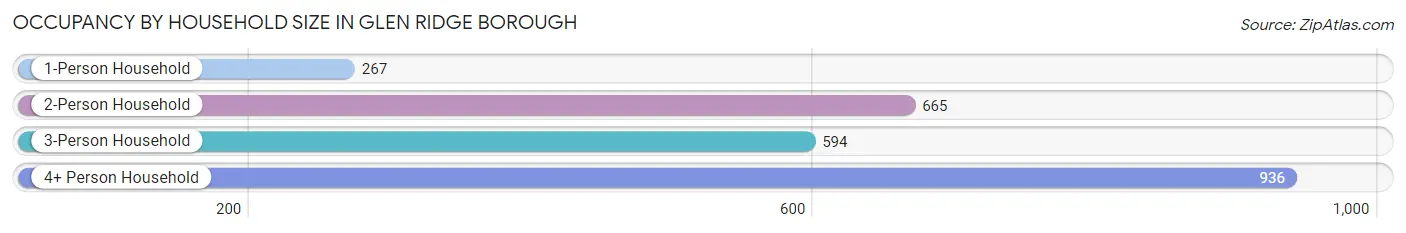
| Household Size | # Housing Units | % Housing Units |
| 1-Person Household | 267 | 10.8% |
| 2-Person Household | 665 | 27.0% |
| 3-Person Household | 594 | 24.1% |
| 4+ Person Household | 936 | 38.0% |
| Total Housing Units | 2,462 | 100.0% |
Occupancy by Ownership by Household Size in Glen Ridge borough
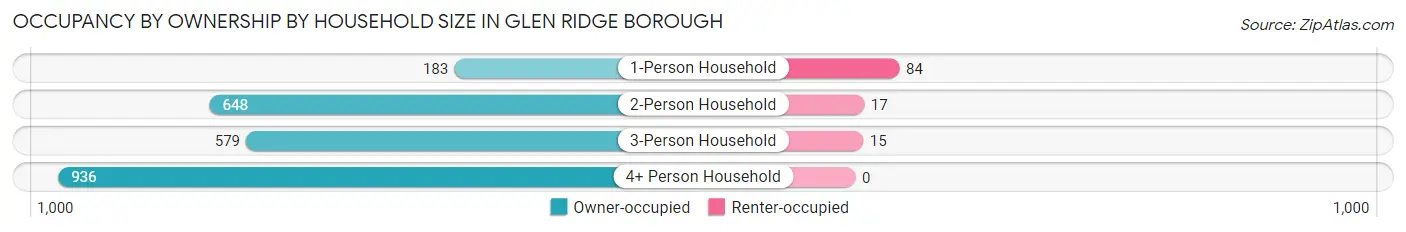
| Household Size | Owner-occupied | Renter-occupied |
| 1-Person Household | 183 (68.5%) | 84 (31.5%) |
| 2-Person Household | 648 (97.4%) | 17 (2.6%) |
| 3-Person Household | 579 (97.5%) | 15 (2.5%) |
| 4+ Person Household | 936 (100.0%) | 0 (0.0%) |
| Total Housing Units | 2,346 (95.3%) | 116 (4.7%) |
Occupancy by Educational Attainment in Glen Ridge borough
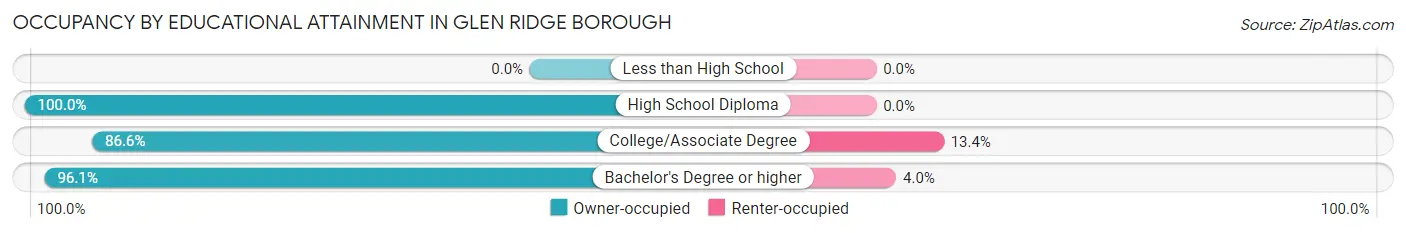
| Household Size | Owner-occupied | Renter-occupied |
| Less than High School | 0 (0.0%) | 0 (0.0%) |
| High School Diploma | 63 (100.0%) | 0 (0.0%) |
| College/Associate Degree | 194 (86.6%) | 30 (13.4%) |
| Bachelor's Degree or higher | 2,089 (96.1%) | 86 (4.0%) |
Occupancy by Age of Householder in Glen Ridge borough
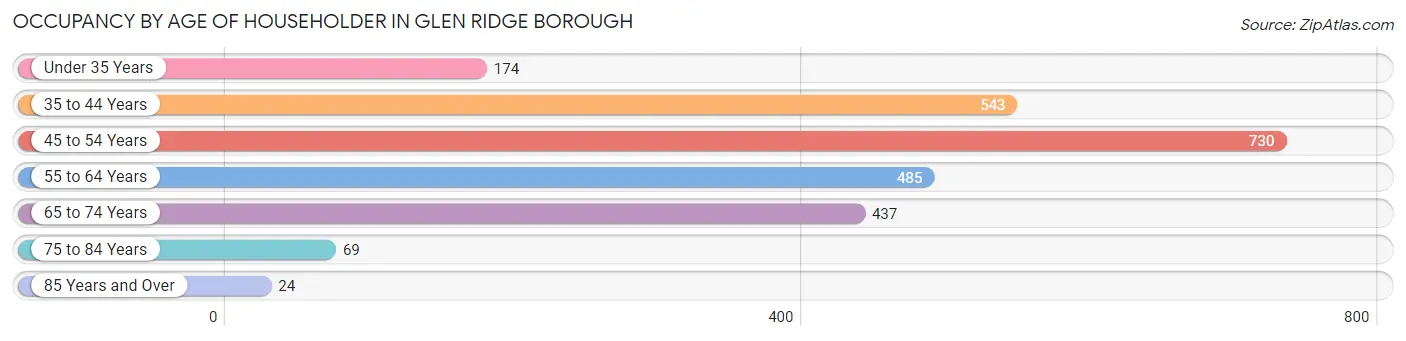
| Age Bracket | # Households | % Households |
| Under 35 Years | 174 | 7.1% |
| 35 to 44 Years | 543 | 22.1% |
| 45 to 54 Years | 730 | 29.6% |
| 55 to 64 Years | 485 | 19.7% |
| 65 to 74 Years | 437 | 17.7% |
| 75 to 84 Years | 69 | 2.8% |
| 85 Years and Over | 24 | 1.0% |
| Total | 2,462 | 100.0% |
Housing Finances in Glen Ridge borough
Median Income by Occupancy in Glen Ridge borough
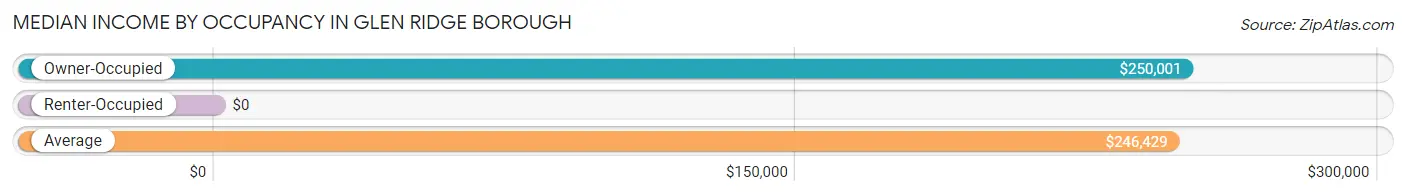
| Occupancy Type | # Households | Median Income |
| Owner-Occupied | 2,346 (95.3%) | $250,001 |
| Renter-Occupied | 116 (4.7%) | $0 |
| Average | 2,462 (100.0%) | $246,429 |
Occupancy by Householder Income Bracket in Glen Ridge borough
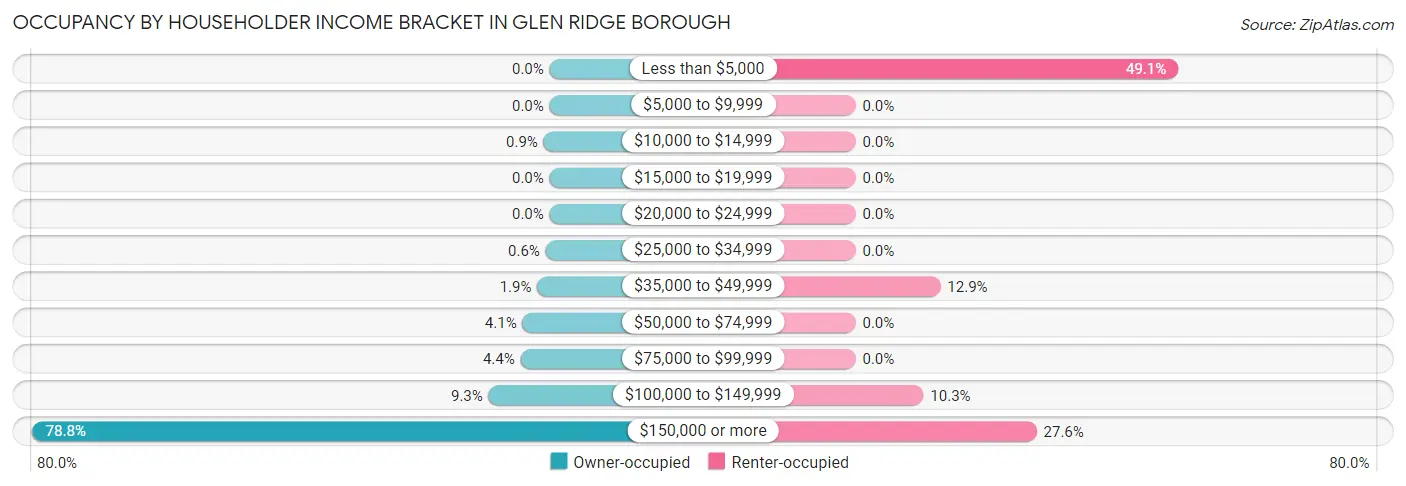
| Income Bracket | Owner-occupied | Renter-occupied |
| Less than $5,000 | 0 (0.0%) | 57 (49.1%) |
| $5,000 to $9,999 | 0 (0.0%) | 0 (0.0%) |
| $10,000 to $14,999 | 21 (0.9%) | 0 (0.0%) |
| $15,000 to $19,999 | 0 (0.0%) | 0 (0.0%) |
| $20,000 to $24,999 | 0 (0.0%) | 0 (0.0%) |
| $25,000 to $34,999 | 14 (0.6%) | 0 (0.0%) |
| $35,000 to $49,999 | 44 (1.9%) | 15 (12.9%) |
| $50,000 to $74,999 | 97 (4.1%) | 0 (0.0%) |
| $75,000 to $99,999 | 104 (4.4%) | 0 (0.0%) |
| $100,000 to $149,999 | 218 (9.3%) | 12 (10.3%) |
| $150,000 or more | 1,848 (78.8%) | 32 (27.6%) |
| Total | 2,346 (100.0%) | 116 (100.0%) |
Monthly Housing Cost Tiers in Glen Ridge borough
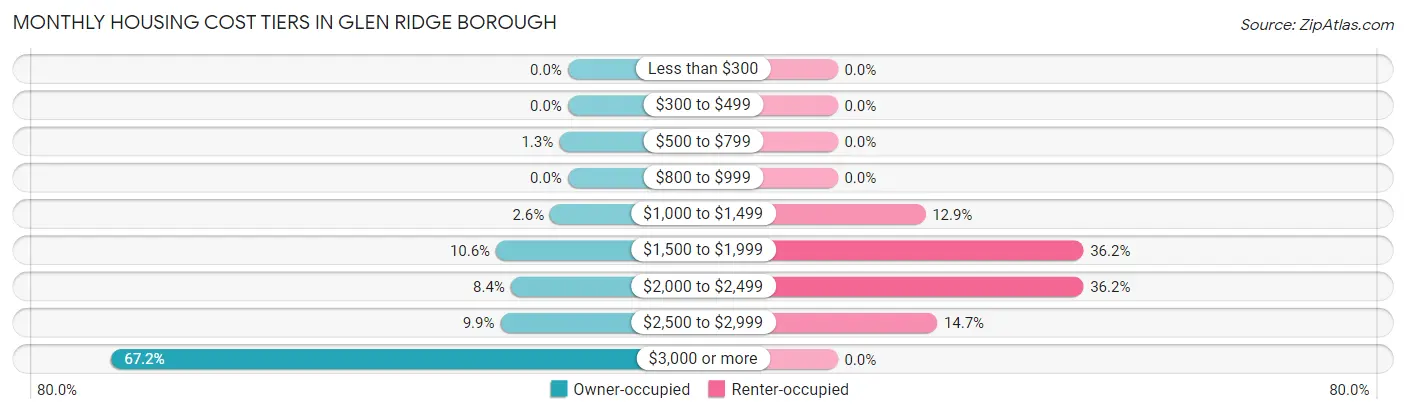
| Monthly Cost | Owner-occupied | Renter-occupied |
| Less than $300 | 0 (0.0%) | 0 (0.0%) |
| $300 to $499 | 0 (0.0%) | 0 (0.0%) |
| $500 to $799 | 30 (1.3%) | 0 (0.0%) |
| $800 to $999 | 0 (0.0%) | 0 (0.0%) |
| $1,000 to $1,499 | 61 (2.6%) | 15 (12.9%) |
| $1,500 to $1,999 | 248 (10.6%) | 42 (36.2%) |
| $2,000 to $2,499 | 197 (8.4%) | 42 (36.2%) |
| $2,500 to $2,999 | 233 (9.9%) | 17 (14.7%) |
| $3,000 or more | 1,577 (67.2%) | 0 (0.0%) |
| Total | 2,346 (100.0%) | 116 (100.0%) |
Physical Housing Characteristics in Glen Ridge borough
Housing Structures in Glen Ridge borough
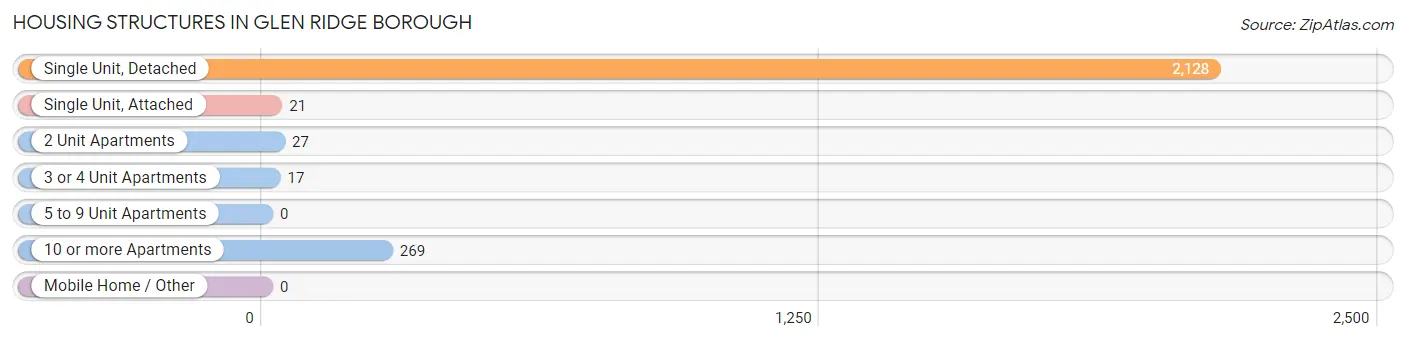
| Structure Type | # Housing Units | % Housing Units |
| Single Unit, Detached | 2,128 | 86.4% |
| Single Unit, Attached | 21 | 0.9% |
| 2 Unit Apartments | 27 | 1.1% |
| 3 or 4 Unit Apartments | 17 | 0.7% |
| 5 to 9 Unit Apartments | 0 | 0.0% |
| 10 or more Apartments | 269 | 10.9% |
| Mobile Home / Other | 0 | 0.0% |
| Total | 2,462 | 100.0% |
Housing Structures by Occupancy in Glen Ridge borough
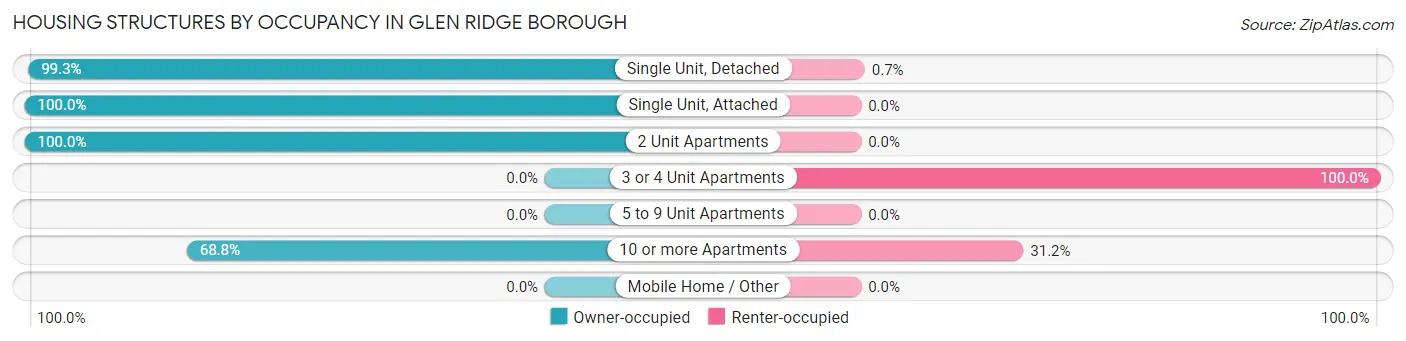
| Structure Type | Owner-occupied | Renter-occupied |
| Single Unit, Detached | 2,113 (99.3%) | 15 (0.7%) |
| Single Unit, Attached | 21 (100.0%) | 0 (0.0%) |
| 2 Unit Apartments | 27 (100.0%) | 0 (0.0%) |
| 3 or 4 Unit Apartments | 0 (0.0%) | 17 (100.0%) |
| 5 to 9 Unit Apartments | 0 (0.0%) | 0 (0.0%) |
| 10 or more Apartments | 185 (68.8%) | 84 (31.2%) |
| Mobile Home / Other | 0 (0.0%) | 0 (0.0%) |
| Total | 2,346 (95.3%) | 116 (4.7%) |
Housing Structures by Number of Rooms in Glen Ridge borough
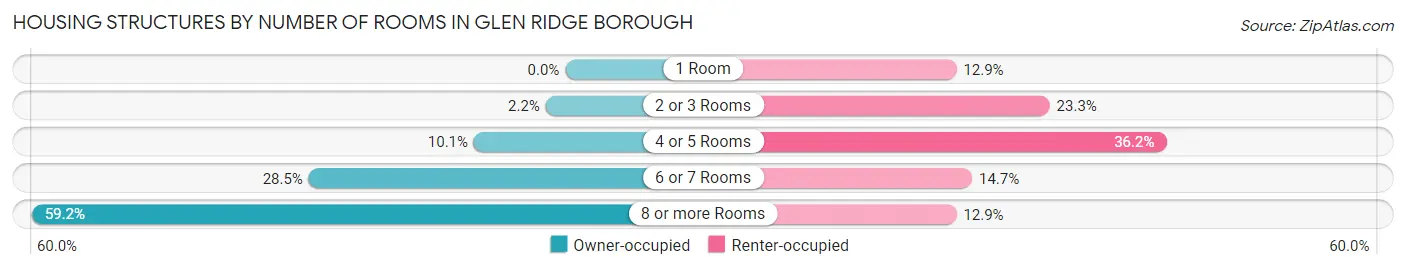
| Number of Rooms | Owner-occupied | Renter-occupied |
| 1 Room | 0 (0.0%) | 15 (12.9%) |
| 2 or 3 Rooms | 51 (2.2%) | 27 (23.3%) |
| 4 or 5 Rooms | 238 (10.1%) | 42 (36.2%) |
| 6 or 7 Rooms | 668 (28.5%) | 17 (14.7%) |
| 8 or more Rooms | 1,389 (59.2%) | 15 (12.9%) |
| Total | 2,346 (100.0%) | 116 (100.0%) |
Housing Structure by Heating Type in Glen Ridge borough
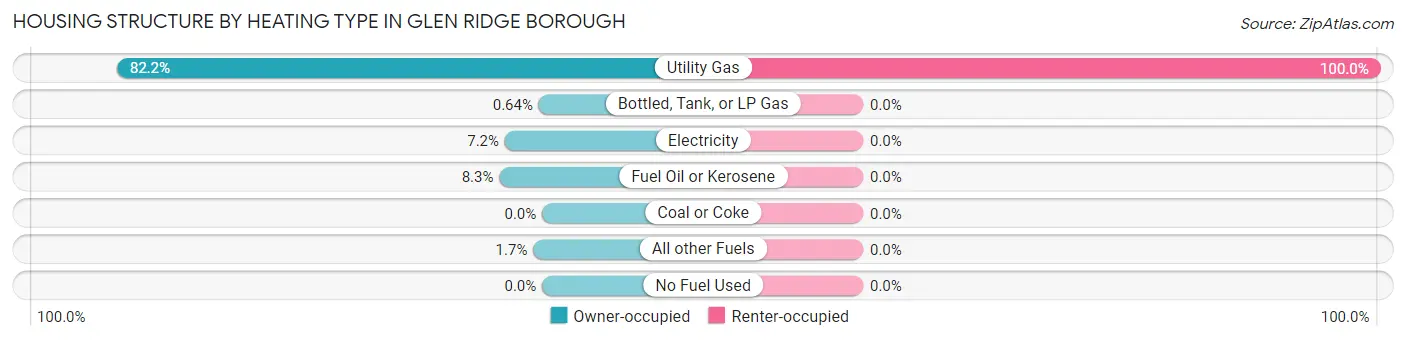
| Heating Type | Owner-occupied | Renter-occupied |
| Utility Gas | 1,928 (82.2%) | 116 (100.0%) |
| Bottled, Tank, or LP Gas | 15 (0.6%) | 0 (0.0%) |
| Electricity | 169 (7.2%) | 0 (0.0%) |
| Fuel Oil or Kerosene | 194 (8.3%) | 0 (0.0%) |
| Coal or Coke | 0 (0.0%) | 0 (0.0%) |
| All other Fuels | 40 (1.7%) | 0 (0.0%) |
| No Fuel Used | 0 (0.0%) | 0 (0.0%) |
| Total | 2,346 (100.0%) | 116 (100.0%) |
Household Vehicle Usage in Glen Ridge borough
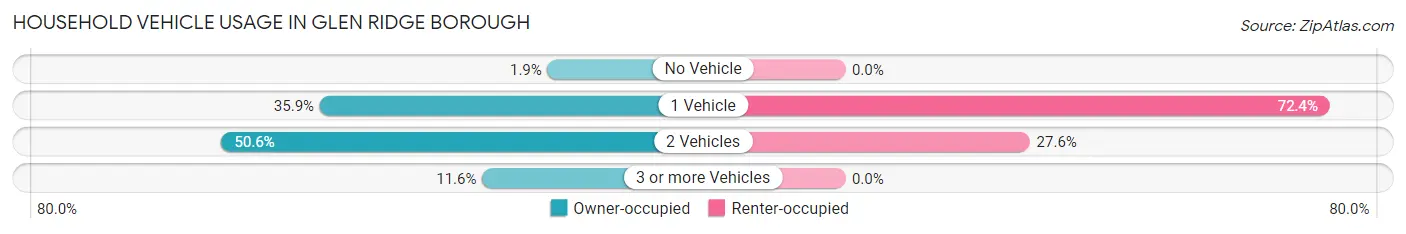
| Vehicles per Household | Owner-occupied | Renter-occupied |
| No Vehicle | 44 (1.9%) | 0 (0.0%) |
| 1 Vehicle | 842 (35.9%) | 84 (72.4%) |
| 2 Vehicles | 1,187 (50.6%) | 32 (27.6%) |
| 3 or more Vehicles | 273 (11.6%) | 0 (0.0%) |
| Total | 2,346 (100.0%) | 116 (100.0%) |
Real Estate & Mortgages in Glen Ridge borough
Real Estate and Mortgage Overview in Glen Ridge borough
| Characteristic | Without Mortgage | With Mortgage |
| Housing Units | 552 | 1,794 |
| Median Property Value | $640,700 | $721,300 |
| Median Household Income | $213,750 | $1,436 |
| Monthly Housing Costs | $1,501 | $1,518 |
| Real Estate Taxes | $10,001 | $0 |
Property Value by Mortgage Status in Glen Ridge borough
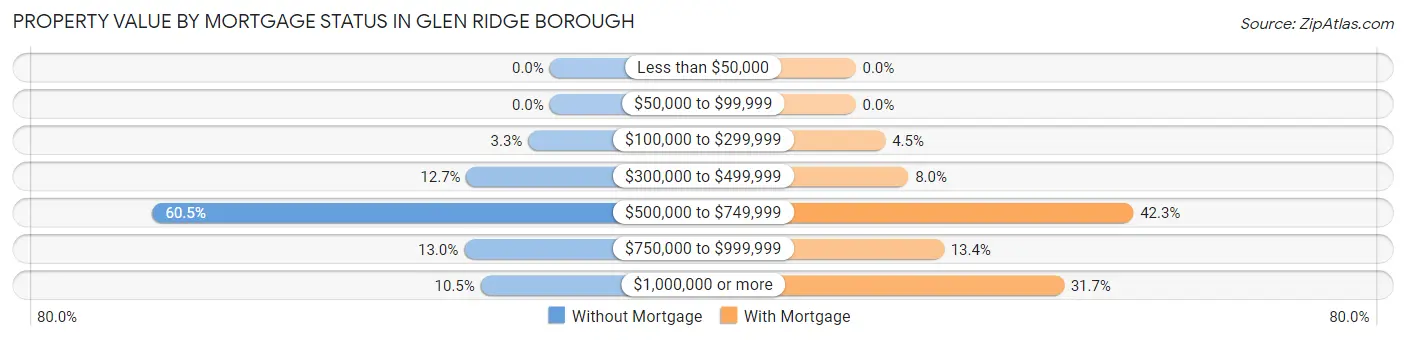
| Property Value | Without Mortgage | With Mortgage |
| Less than $50,000 | 0 (0.0%) | 0 (0.0%) |
| $50,000 to $99,999 | 0 (0.0%) | 0 (0.0%) |
| $100,000 to $299,999 | 18 (3.3%) | 81 (4.5%) |
| $300,000 to $499,999 | 70 (12.7%) | 144 (8.0%) |
| $500,000 to $749,999 | 334 (60.5%) | 759 (42.3%) |
| $750,000 to $999,999 | 72 (13.0%) | 241 (13.4%) |
| $1,000,000 or more | 58 (10.5%) | 569 (31.7%) |
| Total | 552 (100.0%) | 1,794 (100.0%) |
Household Income by Mortgage Status in Glen Ridge borough
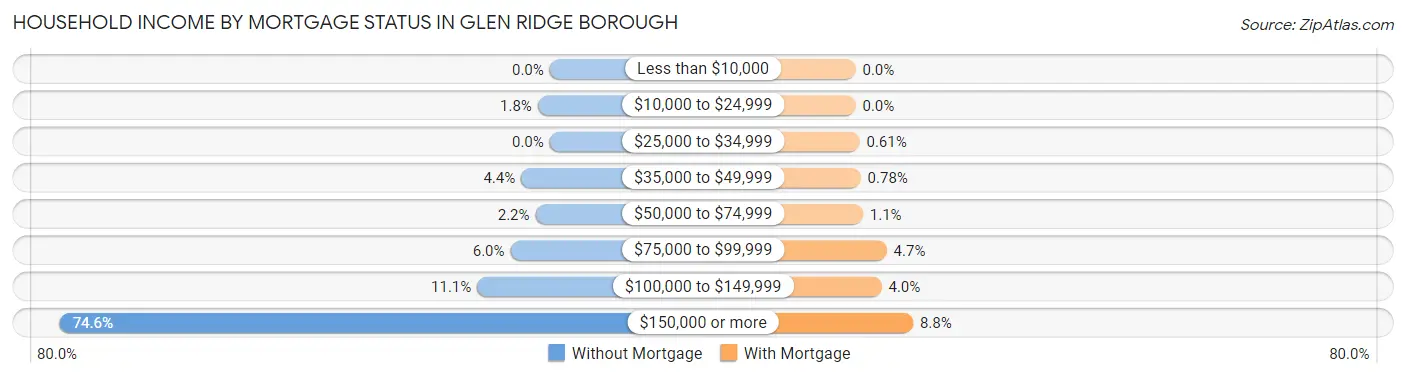
| Household Income | Without Mortgage | With Mortgage |
| Less than $10,000 | 0 (0.0%) | 0 (0.0%) |
| $10,000 to $24,999 | 10 (1.8%) | 0 (0.0%) |
| $25,000 to $34,999 | 0 (0.0%) | 11 (0.6%) |
| $35,000 to $49,999 | 24 (4.3%) | 14 (0.8%) |
| $50,000 to $74,999 | 12 (2.2%) | 20 (1.1%) |
| $75,000 to $99,999 | 33 (6.0%) | 85 (4.7%) |
| $100,000 to $149,999 | 61 (11.1%) | 71 (4.0%) |
| $150,000 or more | 412 (74.6%) | 157 (8.7%) |
| Total | 552 (100.0%) | 1,794 (100.0%) |
Property Value to Household Income Ratio in Glen Ridge borough
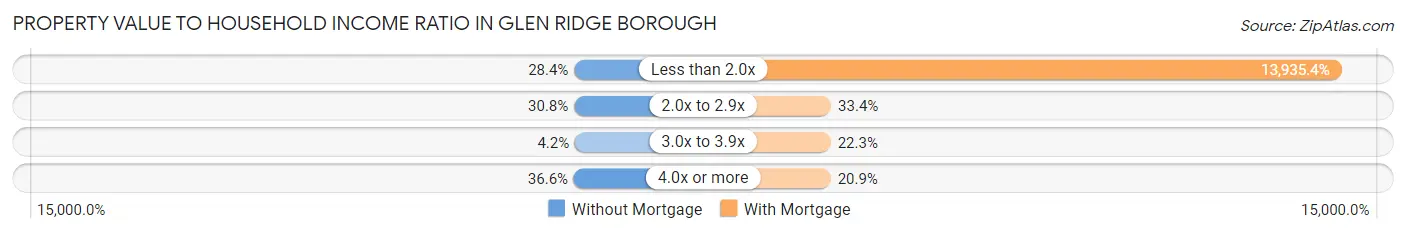
| Value-to-Income Ratio | Without Mortgage | With Mortgage |
| Less than 2.0x | 157 (28.4%) | 250,001 (13,935.4%) |
| 2.0x to 2.9x | 170 (30.8%) | 600 (33.4%) |
| 3.0x to 3.9x | 23 (4.2%) | 400 (22.3%) |
| 4.0x or more | 202 (36.6%) | 375 (20.9%) |
| Total | 552 (100.0%) | 1,794 (100.0%) |
Real Estate Taxes by Mortgage Status in Glen Ridge borough
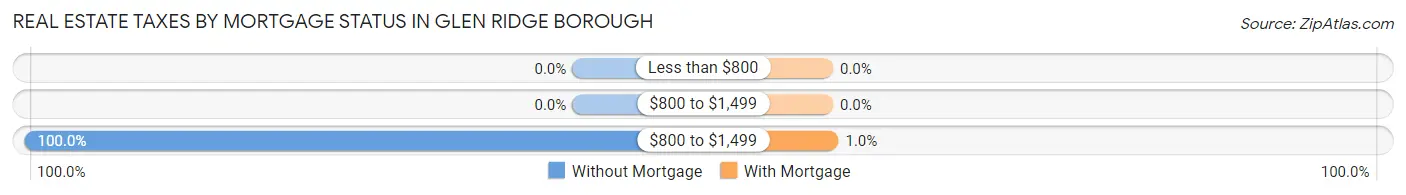
| Property Taxes | Without Mortgage | With Mortgage |
| Less than $800 | 0 (0.0%) | 0 (0.0%) |
| $800 to $1,499 | 0 (0.0%) | 0 (0.0%) |
| $800 to $1,499 | 552 (100.0%) | 18 (1.0%) |
| Total | 552 (100.0%) | 1,794 (100.0%) |
Health & Disability in Glen Ridge borough
Health Insurance Coverage by Age in Glen Ridge borough
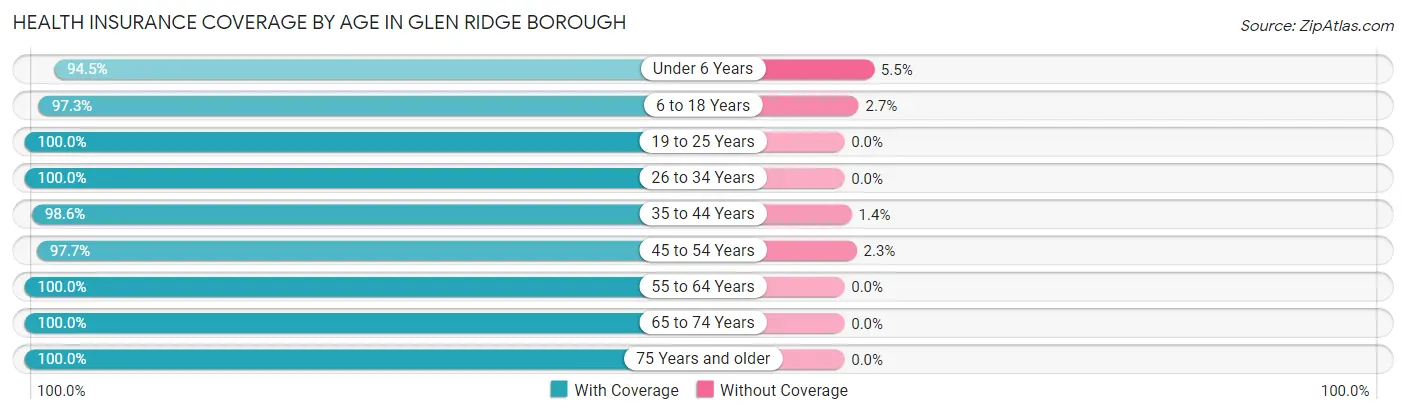
| Age Bracket | With Coverage | Without Coverage |
| Under 6 Years | 548 (94.5%) | 32 (5.5%) |
| 6 to 18 Years | 1,820 (97.3%) | 50 (2.7%) |
| 19 to 25 Years | 640 (100.0%) | 0 (0.0%) |
| 26 to 34 Years | 337 (100.0%) | 0 (0.0%) |
| 35 to 44 Years | 1,077 (98.6%) | 15 (1.4%) |
| 45 to 54 Years | 1,315 (97.7%) | 31 (2.3%) |
| 55 to 64 Years | 984 (100.0%) | 0 (0.0%) |
| 65 to 74 Years | 800 (100.0%) | 0 (0.0%) |
| 75 Years and older | 148 (100.0%) | 0 (0.0%) |
| Total | 7,669 (98.4%) | 128 (1.6%) |
Health Insurance Coverage by Citizenship Status in Glen Ridge borough
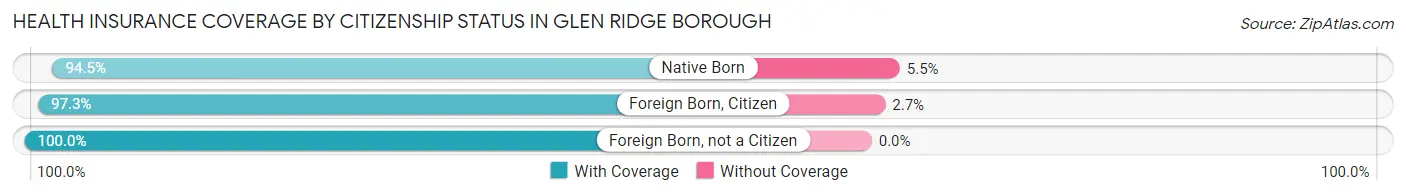
| Citizenship Status | With Coverage | Without Coverage |
| Native Born | 548 (94.5%) | 32 (5.5%) |
| Foreign Born, Citizen | 1,820 (97.3%) | 50 (2.7%) |
| Foreign Born, not a Citizen | 640 (100.0%) | 0 (0.0%) |
Health Insurance Coverage by Household Income in Glen Ridge borough
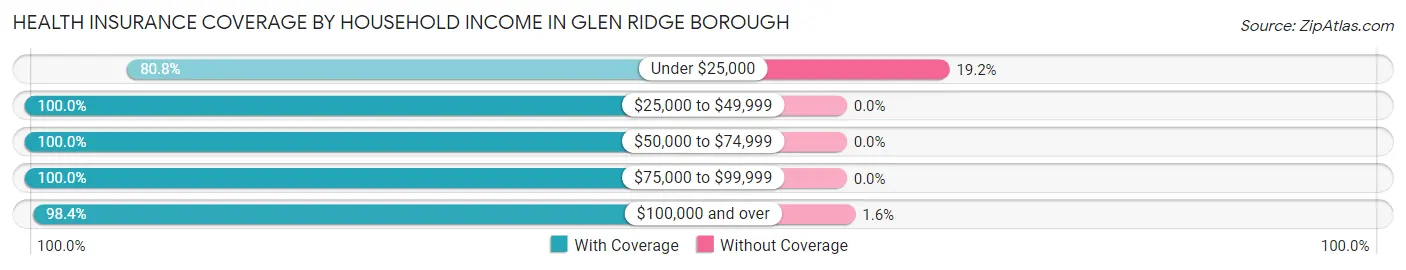
| Household Income | With Coverage | Without Coverage |
| Under $25,000 | 63 (80.8%) | 15 (19.2%) |
| $25,000 to $49,999 | 136 (100.0%) | 0 (0.0%) |
| $50,000 to $74,999 | 255 (100.0%) | 0 (0.0%) |
| $75,000 to $99,999 | 280 (100.0%) | 0 (0.0%) |
| $100,000 and over | 6,902 (98.4%) | 113 (1.6%) |
Public vs Private Health Insurance Coverage by Age in Glen Ridge borough
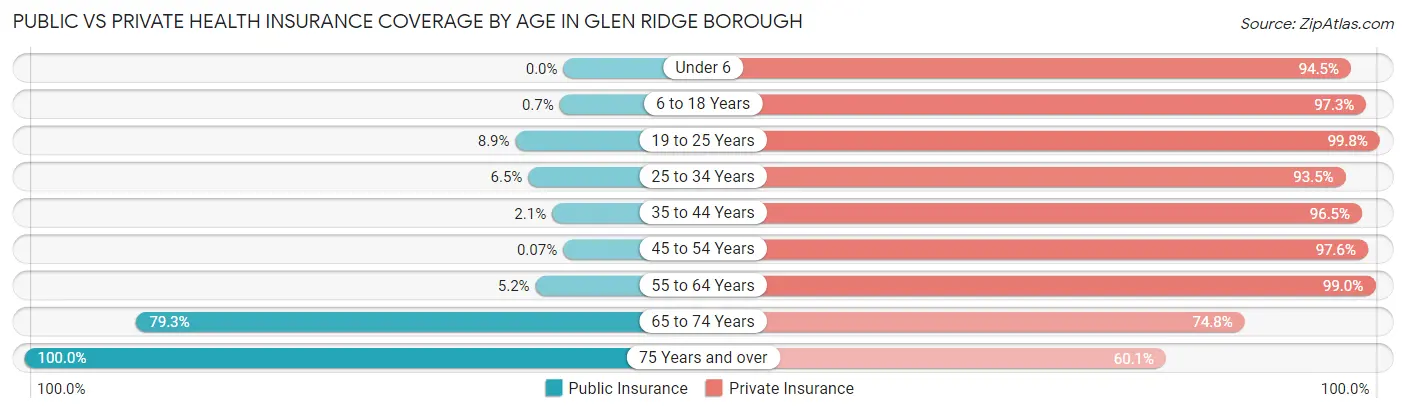
| Age Bracket | Public Insurance | Private Insurance |
| Under 6 | 0 (0.0%) | 548 (94.5%) |
| 6 to 18 Years | 13 (0.7%) | 1,820 (97.3%) |
| 19 to 25 Years | 57 (8.9%) | 639 (99.8%) |
| 25 to 34 Years | 22 (6.5%) | 315 (93.5%) |
| 35 to 44 Years | 23 (2.1%) | 1,054 (96.5%) |
| 45 to 54 Years | 1 (0.1%) | 1,314 (97.6%) |
| 55 to 64 Years | 51 (5.2%) | 974 (99.0%) |
| 65 to 74 Years | 634 (79.2%) | 598 (74.8%) |
| 75 Years and over | 148 (100.0%) | 89 (60.1%) |
| Total | 949 (12.2%) | 7,351 (94.3%) |
Disability Status by Sex by Age in Glen Ridge borough
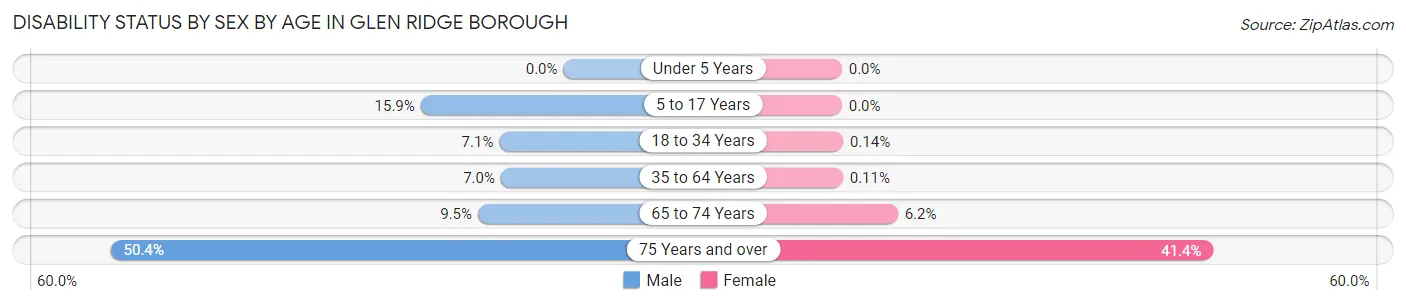
| Age Bracket | Male | Female |
| Under 5 Years | 0 (0.0%) | 0 (0.0%) |
| 5 to 17 Years | 139 (15.9%) | 0 (0.0%) |
| 18 to 34 Years | 29 (7.1%) | 1 (0.1%) |
| 35 to 64 Years | 113 (7.0%) | 2 (0.1%) |
| 65 to 74 Years | 38 (9.5%) | 25 (6.2%) |
| 75 Years and over | 60 (50.4%) | 12 (41.4%) |
Disability Class by Sex by Age in Glen Ridge borough
Disability Class: Hearing Difficulty
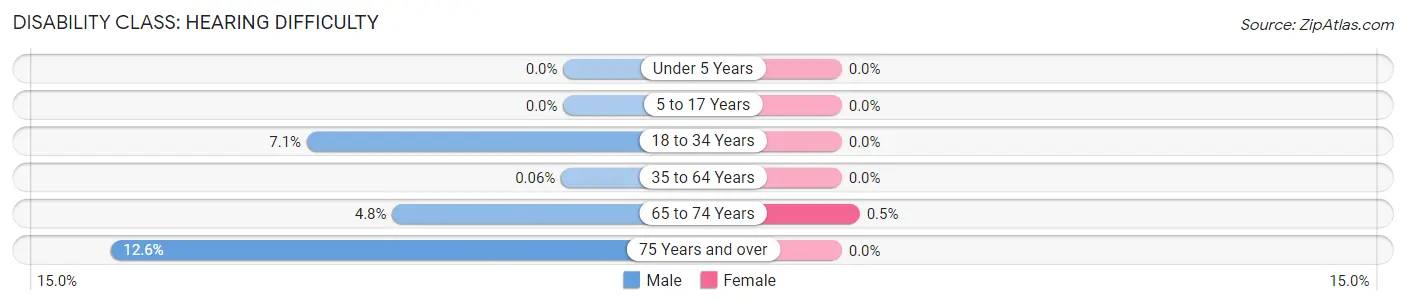
| Age Bracket | Male | Female |
| Under 5 Years | 0 (0.0%) | 0 (0.0%) |
| 5 to 17 Years | 0 (0.0%) | 0 (0.0%) |
| 18 to 34 Years | 29 (7.1%) | 0 (0.0%) |
| 35 to 64 Years | 1 (0.1%) | 0 (0.0%) |
| 65 to 74 Years | 19 (4.8%) | 2 (0.5%) |
| 75 Years and over | 15 (12.6%) | 0 (0.0%) |
Disability Class: Vision Difficulty
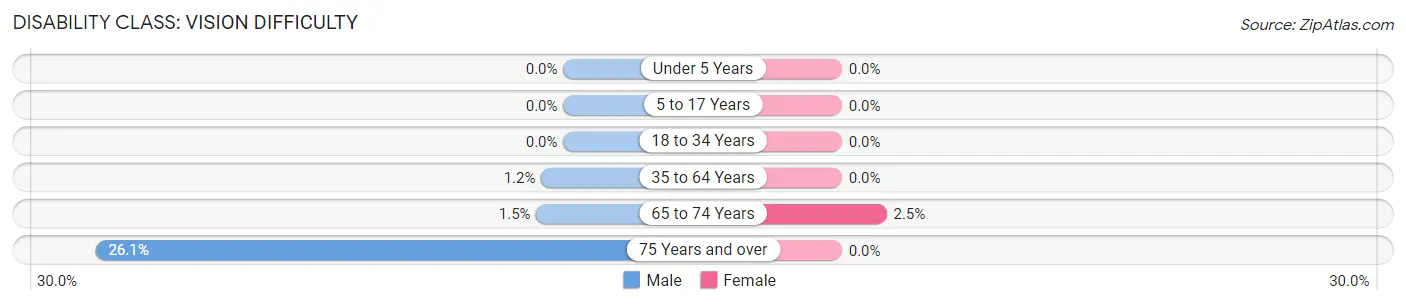
| Age Bracket | Male | Female |
| Under 5 Years | 0 (0.0%) | 0 (0.0%) |
| 5 to 17 Years | 0 (0.0%) | 0 (0.0%) |
| 18 to 34 Years | 0 (0.0%) | 0 (0.0%) |
| 35 to 64 Years | 20 (1.2%) | 0 (0.0%) |
| 65 to 74 Years | 6 (1.5%) | 10 (2.5%) |
| 75 Years and over | 31 (26.1%) | 0 (0.0%) |
Disability Class: Cognitive Difficulty
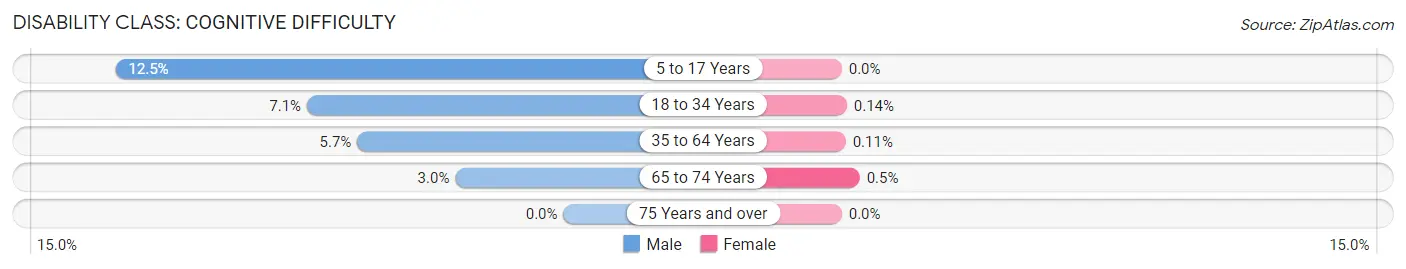
| Age Bracket | Male | Female |
| 5 to 17 Years | 109 (12.5%) | 0 (0.0%) |
| 18 to 34 Years | 29 (7.1%) | 1 (0.1%) |
| 35 to 64 Years | 93 (5.7%) | 2 (0.1%) |
| 65 to 74 Years | 12 (3.0%) | 2 (0.5%) |
| 75 Years and over | 0 (0.0%) | 0 (0.0%) |
Disability Class: Ambulatory Difficulty
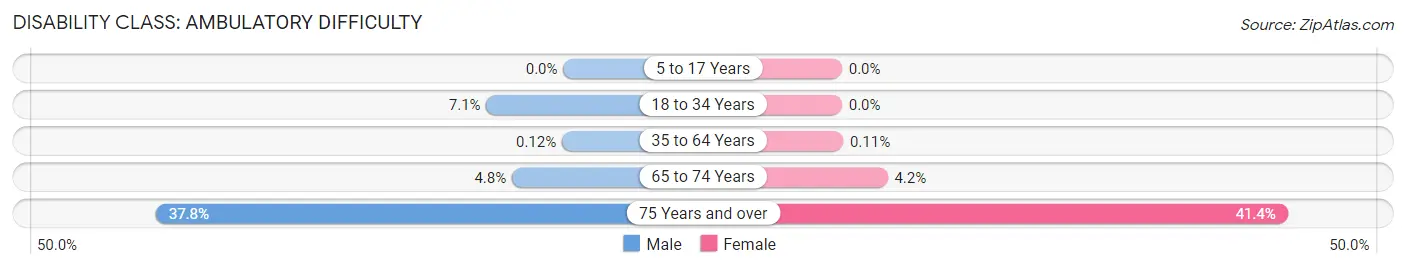
| Age Bracket | Male | Female |
| 5 to 17 Years | 0 (0.0%) | 0 (0.0%) |
| 18 to 34 Years | 29 (7.1%) | 0 (0.0%) |
| 35 to 64 Years | 2 (0.1%) | 2 (0.1%) |
| 65 to 74 Years | 19 (4.8%) | 17 (4.2%) |
| 75 Years and over | 45 (37.8%) | 12 (41.4%) |
Disability Class: Self-Care Difficulty
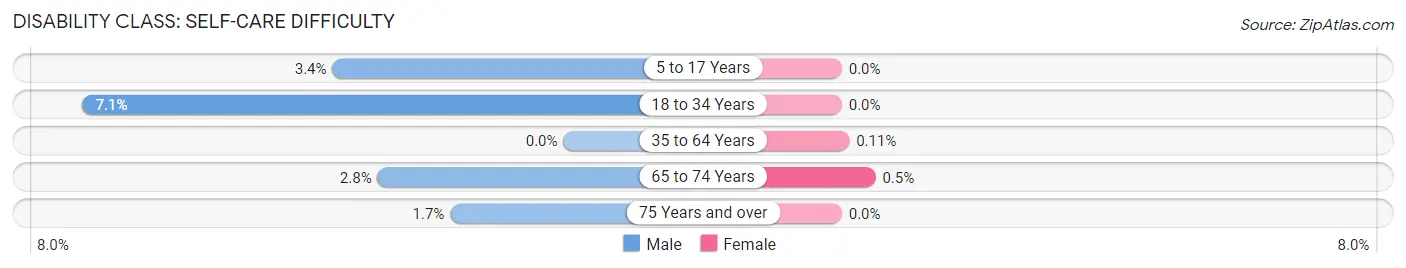
| Age Bracket | Male | Female |
| 5 to 17 Years | 30 (3.4%) | 0 (0.0%) |
| 18 to 34 Years | 29 (7.1%) | 0 (0.0%) |
| 35 to 64 Years | 0 (0.0%) | 2 (0.1%) |
| 65 to 74 Years | 11 (2.8%) | 2 (0.5%) |
| 75 Years and over | 2 (1.7%) | 0 (0.0%) |
Technology Access in Glen Ridge borough
Computing Device Access in Glen Ridge borough
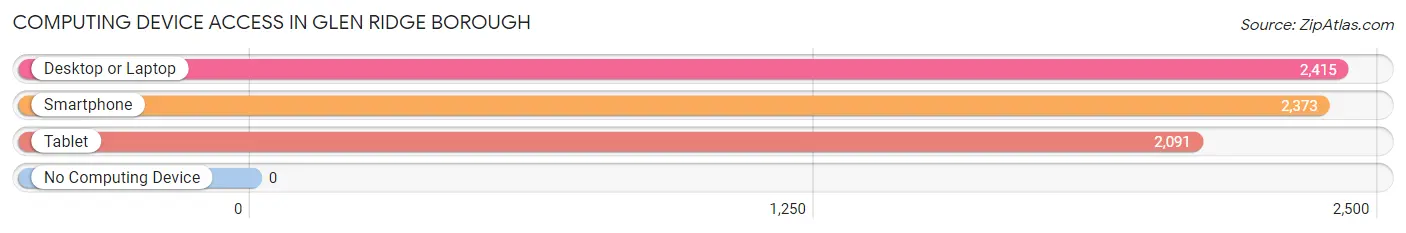
| Device Type | # Households | % Households |
| Desktop or Laptop | 2,415 | 98.1% |
| Smartphone | 2,373 | 96.4% |
| Tablet | 2,091 | 84.9% |
| No Computing Device | 0 | 0.0% |
| Total | 2,462 | 100.0% |
Internet Access in Glen Ridge borough
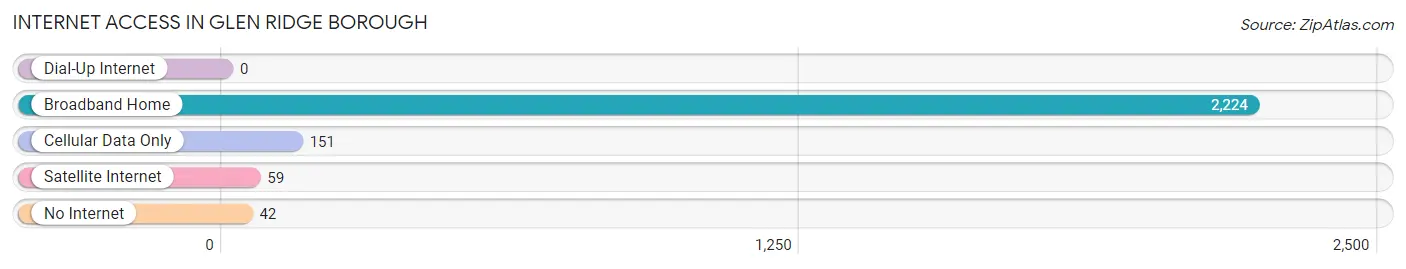
| Internet Type | # Households | % Households |
| Dial-Up Internet | 0 | 0.0% |
| Broadband Home | 2,224 | 90.3% |
| Cellular Data Only | 151 | 6.1% |
| Satellite Internet | 59 | 2.4% |
| No Internet | 42 | 1.7% |
| Total | 2,462 | 100.0% |
Glen Ridge borough Summary
Glen Ridge Borough is a small, suburban community located in Essex County, New Jersey. It is situated just west of the city of Newark and is part of the larger New York metropolitan area. The borough is home to approximately 7,500 residents and covers an area of 1.8 square miles.
History
Glen Ridge was originally inhabited by the Lenni Lenape Native Americans. The area was first settled by Europeans in the early 1700s and was known as “Cranetown”. The name was changed to “Glen Ridge” in 1868 when the area was incorporated as a borough. The name was chosen to reflect the area’s topography, which is characterized by a series of ridges and valleys.
The borough was originally a farming community, but it began to develop into a residential suburb in the late 19th century. The construction of the Montclair Branch of the Delaware, Lackawanna and Western Railroad in 1856 helped to spur the growth of the area. The railroad provided easy access to New York City and other nearby cities, making Glen Ridge an attractive place to live for commuters.
Geography
Glen Ridge is located in the northern part of Essex County, New Jersey. It is bordered by the cities of Bloomfield and Montclair to the north, Nutley to the east, and Belleville to the south. The borough is situated on a series of ridges and valleys, which gives it its name. The highest point in the borough is the First Watchung Mountain, which rises to an elevation of 545 feet.
The borough is located in the humid subtropical climate zone, which is characterized by hot, humid summers and cold, wet winters. The average annual temperature is around 54 degrees Fahrenheit, and the average annual precipitation is around 45 inches.
Economy
The economy of Glen Ridge is largely based on the service industry. The borough is home to a variety of restaurants, retail stores, and professional services. The largest employers in the area are the Glen Ridge Public Schools, the Glen Ridge Country Club, and the Glen Ridge Country Club.
The borough also has a thriving arts and culture scene. The Glen Ridge Performing Arts Center hosts a variety of concerts, plays, and other events throughout the year. The Glen Ridge Historical Society is also active in the community, preserving the borough’s history and culture.
Demographics
As of the 2010 census, the population of Glen Ridge was 7,527. The racial makeup of the borough was 87.3% White, 5.3% African American, 0.2% Native American, 4.2% Asian, and 2.9% from other races. The median household income was $107,917, and the median family income was $125,917.
The borough is home to a diverse population, with a variety of religious and ethnic backgrounds. The largest religious group is Roman Catholic, followed by Protestant, Jewish, and other faiths. The largest ethnic group is Italian, followed by Irish, German, and other European ancestries.
Conclusion
Glen Ridge Borough is a small, suburban community located in Essex County, New Jersey. It is situated just west of the city of Newark and is part of the larger New York metropolitan area. The borough is home to approximately 7,500 residents and covers an area of 1.8 square miles. The economy of Glen Ridge is largely based on the service industry, and the borough is home to a diverse population with a variety of religious and ethnic backgrounds.
Common Questions
What is Per Capita Income in Glen Ridge borough?
Per Capita income in Glen Ridge borough is $101,252.
What is the Median Family Income in Glen Ridge borough?
Median Family Income in Glen Ridge borough is $250,001.
What is the Median Household income in Glen Ridge borough?
Median Household Income in Glen Ridge borough is $246,429.
What is Income or Wage Gap in Glen Ridge borough?
Income or Wage Gap in Glen Ridge borough is 70.0%.
Women in Glen Ridge borough earn 30.0 cents for every dollar earned by a man.
What is Inequality or Gini Index in Glen Ridge borough?
Inequality or Gini Index in Glen Ridge borough is 0.40.
What is the Total Population of Glen Ridge borough?
Total Population of Glen Ridge borough is 7,797.
What is the Total Male Population of Glen Ridge borough?
Total Male Population of Glen Ridge borough is 3,560.
What is the Total Female Population of Glen Ridge borough?
Total Female Population of Glen Ridge borough is 4,237.
What is the Ratio of Males per 100 Females in Glen Ridge borough?
There are 84.02 Males per 100 Females in Glen Ridge borough.
What is the Ratio of Females per 100 Males in Glen Ridge borough?
There are 119.02 Females per 100 Males in Glen Ridge borough.
What is the Median Population Age in Glen Ridge borough?
Median Population Age in Glen Ridge borough is 41.1 Years.
What is the Average Family Size in Glen Ridge borough
Average Family Size in Glen Ridge borough is 3.4 People.
What is the Average Household Size in Glen Ridge borough
Average Household Size in Glen Ridge borough is 3.1 People.
How Large is the Labor Force in Glen Ridge borough?
There are 4,015 People in the Labor Forcein in Glen Ridge borough.
What is the Percentage of People in the Labor Force in Glen Ridge borough?
69.9% of People are in the Labor Force in Glen Ridge borough.
What is the Unemployment Rate in Glen Ridge borough?
Unemployment Rate in Glen Ridge borough is 6.2%.