Longport borough, NJ Map & Demographics
Longport borough Overview
$102,167
PER CAPITA INCOME
$129,583
AVG FAMILY INCOME
$101,250
AVG HOUSEHOLD INCOME
43.4%
WAGE / INCOME GAP [ % ]
56.6¢/ $1
WAGE / INCOME GAP [ $ ]
0.58
INEQUALITY / GINI INDEX
776
TOTAL POPULATION
342
MALE POPULATION
434
FEMALE POPULATION
78.80
MALES / 100 FEMALES
126.90
FEMALES / 100 MALES
66.4
MEDIAN AGE
2.3
AVG FAMILY SIZE
1.8
AVG HOUSEHOLD SIZE
301
LABOR FORCE [ PEOPLE ]
40.6%
PERCENT IN LABOR FORCE
8.6%
UNEMPLOYMENT RATE
Income in Longport borough
Income Overview in Longport borough
Per Capita Income in Longport borough is $102,167, while median incomes of families and households are $129,583 and $101,250 respectively.
| Characteristic | Number | Measure |
| Per Capita Income | 776 | $102,167 |
| Median Family Income | 262 | $129,583 |
| Mean Family Income | 262 | $226,594 |
| Median Household Income | 436 | $101,250 |
| Mean Household Income | 436 | $180,434 |
| Income Deficit | 262 | $0 |
| Wage / Income Gap (%) | 776 | 43.37% |
| Wage / Income Gap ($) | 776 | 56.63¢ per $1 |
| Gini / Inequality Index | 776 | 0.58 |
Earnings by Sex in Longport borough
Average Earnings in Longport borough are $67,708, $79,464 for men and $45,000 for women, a difference of 43.4%.
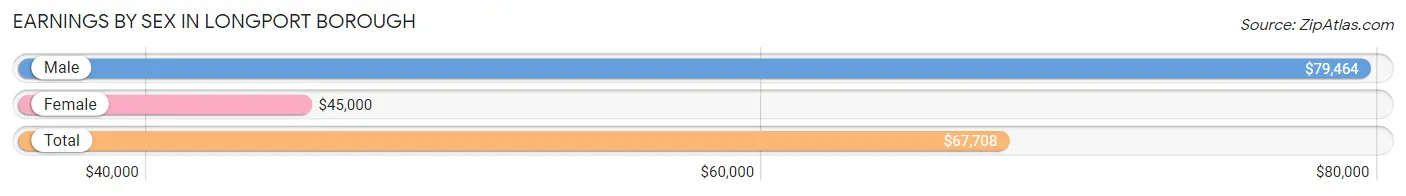
| Sex | Number | Average Earnings |
| Male | 197 (61.8%) | $79,464 |
| Female | 122 (38.2%) | $45,000 |
| Total | 319 (100.0%) | $67,708 |
Earnings by Sex by Income Bracket in Longport borough
The most common earnings brackets in Longport borough are $100,000+ for men (88 | 44.7%) and $100,000+ for women (22 | 18.0%).
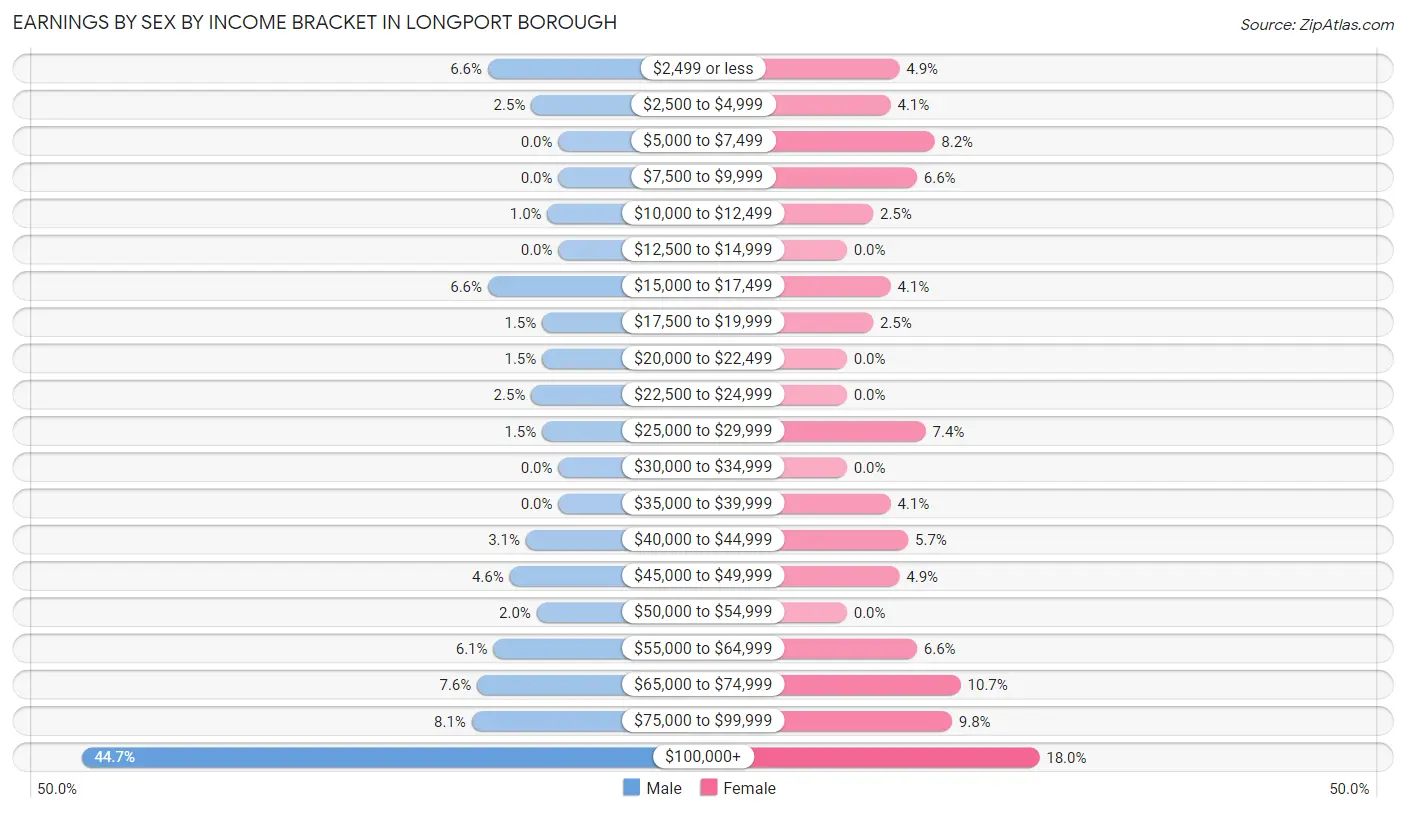
| Income | Male | Female |
| $2,499 or less | 13 (6.6%) | 6 (4.9%) |
| $2,500 to $4,999 | 5 (2.5%) | 5 (4.1%) |
| $5,000 to $7,499 | 0 (0.0%) | 10 (8.2%) |
| $7,500 to $9,999 | 0 (0.0%) | 8 (6.6%) |
| $10,000 to $12,499 | 2 (1.0%) | 3 (2.5%) |
| $12,500 to $14,999 | 0 (0.0%) | 0 (0.0%) |
| $15,000 to $17,499 | 13 (6.6%) | 5 (4.1%) |
| $17,500 to $19,999 | 3 (1.5%) | 3 (2.5%) |
| $20,000 to $22,499 | 3 (1.5%) | 0 (0.0%) |
| $22,500 to $24,999 | 5 (2.5%) | 0 (0.0%) |
| $25,000 to $29,999 | 3 (1.5%) | 9 (7.4%) |
| $30,000 to $34,999 | 0 (0.0%) | 0 (0.0%) |
| $35,000 to $39,999 | 0 (0.0%) | 5 (4.1%) |
| $40,000 to $44,999 | 6 (3.0%) | 7 (5.7%) |
| $45,000 to $49,999 | 9 (4.6%) | 6 (4.9%) |
| $50,000 to $54,999 | 4 (2.0%) | 0 (0.0%) |
| $55,000 to $64,999 | 12 (6.1%) | 8 (6.6%) |
| $65,000 to $74,999 | 15 (7.6%) | 13 (10.7%) |
| $75,000 to $99,999 | 16 (8.1%) | 12 (9.8%) |
| $100,000+ | 88 (44.7%) | 22 (18.0%) |
| Total | 197 (100.0%) | 122 (100.0%) |
Earnings by Sex by Educational Attainment in Longport borough
Average earnings in Longport borough are $83,958 for men and $47,500 for women, a difference of 43.4%. Men with an educational attainment of bachelor's degree enjoy the highest average annual earnings of $87,917, while those with high school diploma education earn the least with $59,167. Women with an educational attainment of college or associate's degree earn the most with the average annual earnings of $52,500, while those with college or associate's degree education have the smallest earnings of $52,500.
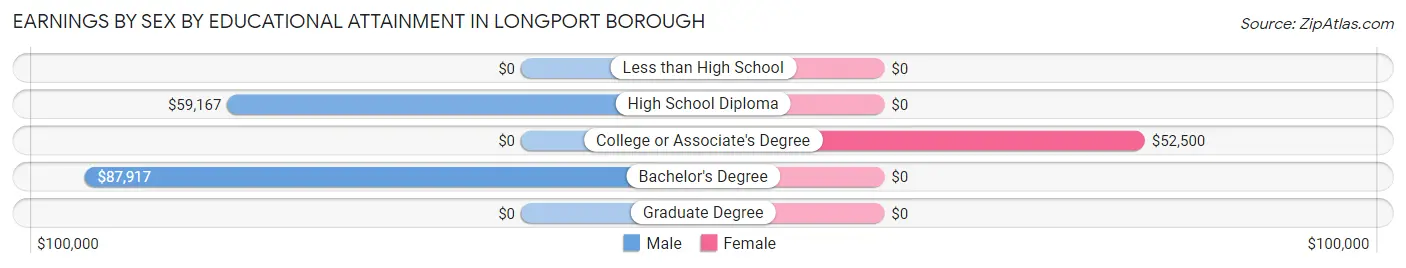
| Educational Attainment | Male Income | Female Income |
| Less than High School | - | - |
| High School Diploma | $59,167 | $0 |
| College or Associate's Degree | - | - |
| Bachelor's Degree | $87,917 | $0 |
| Graduate Degree | - | - |
| Total | $83,958 | $47,500 |
Family Income in Longport borough
Family Income Brackets in Longport borough
According to the Longport borough family income data, there are 82 families falling into the $200,000+ income range, which is the most common income bracket and makes up 31.3% of all families.
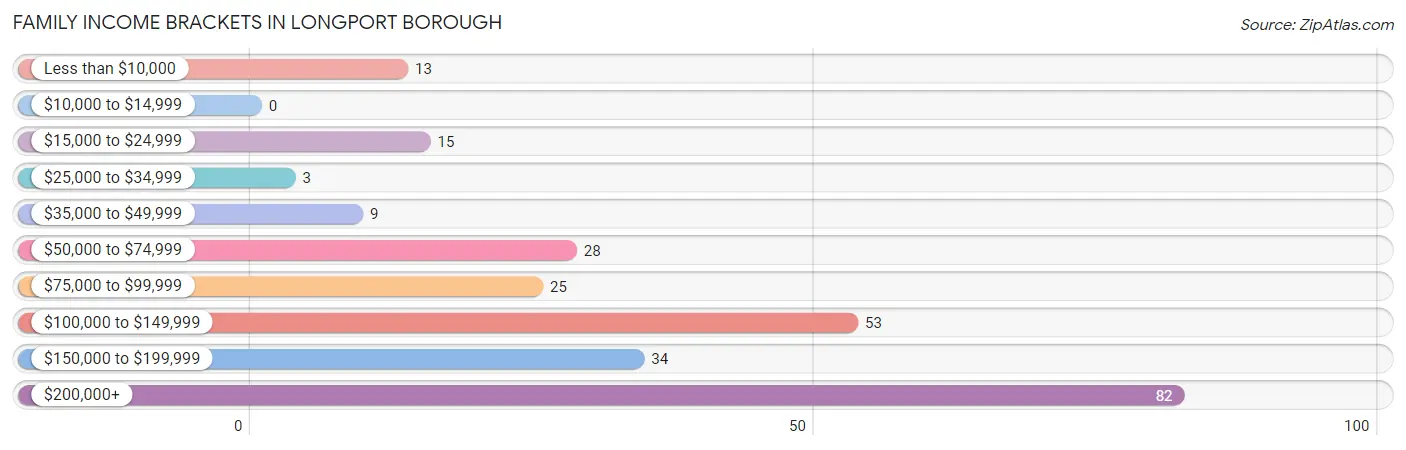
| Income Bracket | # Families | % Families |
| Less than $10,000 | 13 | 5.0% |
| $10,000 to $14,999 | 0 | 0.0% |
| $15,000 to $24,999 | 15 | 5.7% |
| $25,000 to $34,999 | 3 | 1.1% |
| $35,000 to $49,999 | 9 | 3.4% |
| $50,000 to $74,999 | 28 | 10.7% |
| $75,000 to $99,999 | 25 | 9.5% |
| $100,000 to $149,999 | 53 | 20.2% |
| $150,000 to $199,999 | 34 | 13.0% |
| $200,000+ | 82 | 31.3% |
Family Income by Famaliy Size in Longport borough
4-person families (15 | 5.7%) account for the highest median family income in Longport borough with $250,001 per family, while 3-person families (15 | 5.7%) have the highest median income of $74,375 per family member.
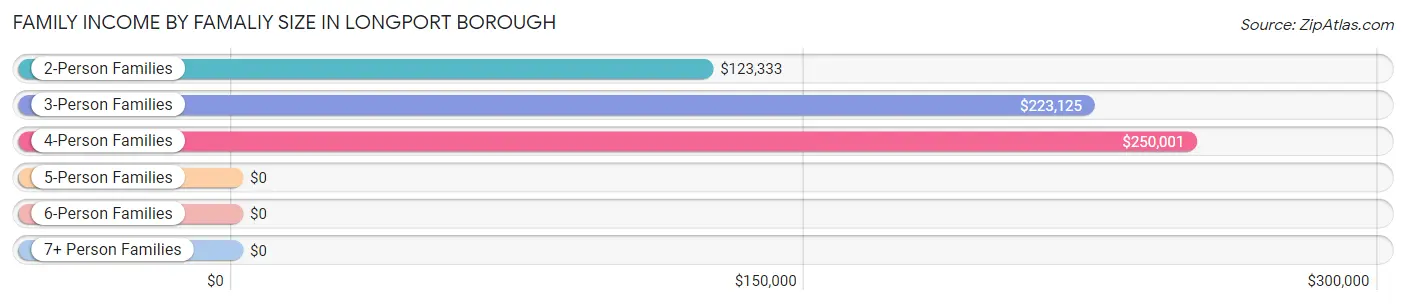
| Income Bracket | # Families | Median Income |
| 2-Person Families | 232 (88.5%) | $123,333 |
| 3-Person Families | 15 (5.7%) | $223,125 |
| 4-Person Families | 15 (5.7%) | $250,001 |
| 5-Person Families | 0 (0.0%) | $0 |
| 6-Person Families | 0 (0.0%) | $0 |
| 7+ Person Families | 0 (0.0%) | $0 |
| Total | 262 (100.0%) | $129,583 |
Family Income by Number of Earners in Longport borough
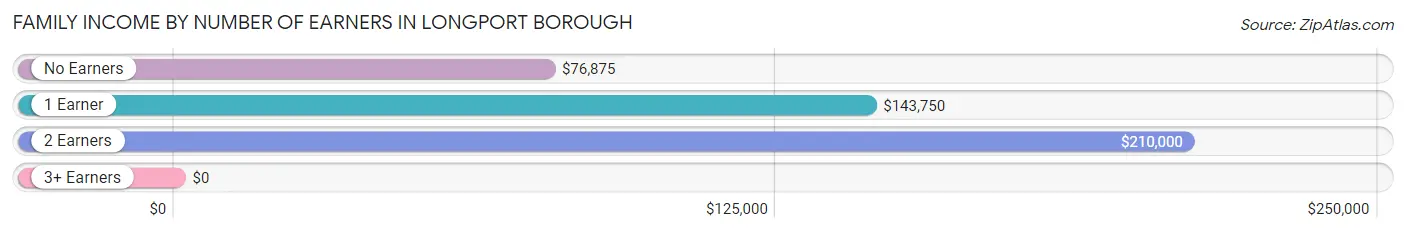
| Number of Earners | # Families | Median Income |
| No Earners | 83 (31.7%) | $76,875 |
| 1 Earner | 105 (40.1%) | $143,750 |
| 2 Earners | 68 (26.0%) | $210,000 |
| 3+ Earners | 6 (2.3%) | $0 |
| Total | 262 (100.0%) | $129,583 |
Household Income in Longport borough
Household Income Brackets in Longport borough
With 104 households falling in the category, the $200,000+ income range is the most frequent in Longport borough, accounting for 23.8% of all households. In contrast, only 12 households (2.8%) fall into the $25,000 to $34,999 income bracket, making it the least populous group.
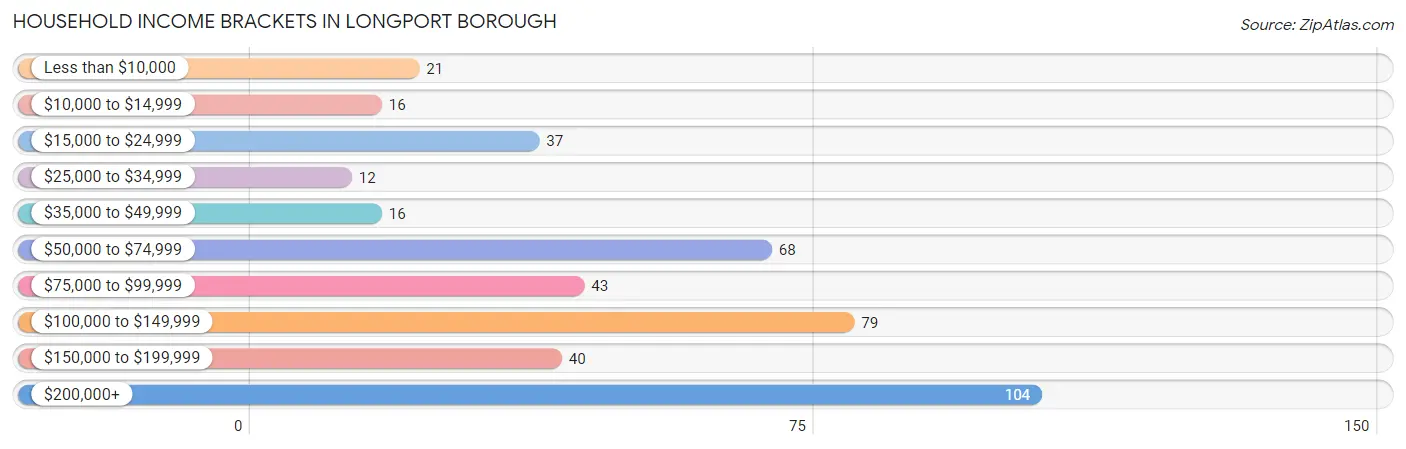
| Income Bracket | # Households | % Households |
| Less than $10,000 | 21 | 4.8% |
| $10,000 to $14,999 | 16 | 3.7% |
| $15,000 to $24,999 | 37 | 8.5% |
| $25,000 to $34,999 | 12 | 2.8% |
| $35,000 to $49,999 | 16 | 3.7% |
| $50,000 to $74,999 | 68 | 15.6% |
| $75,000 to $99,999 | 43 | 9.9% |
| $100,000 to $149,999 | 79 | 18.1% |
| $150,000 to $199,999 | 40 | 9.2% |
| $200,000+ | 104 | 23.9% |
Household Income by Householder Age in Longport borough
The median household income in Longport borough is $101,250, with the highest median household income of $127,083 found in the 25 to 44 years age bracket for the primary householder. A total of 15 households (3.4%) fall into this category.
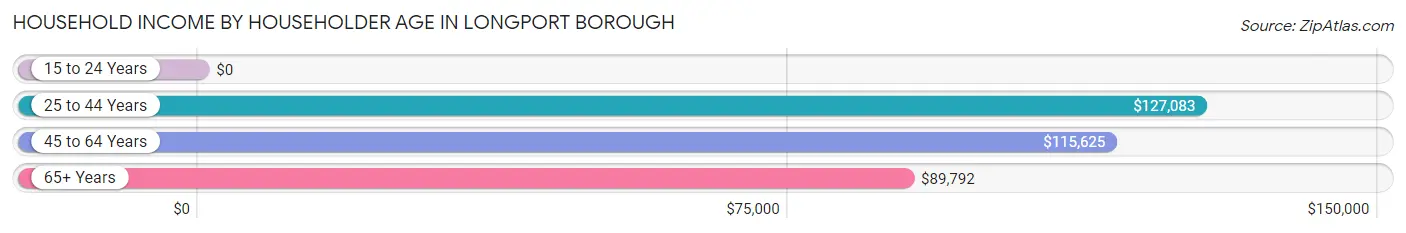
| Income Bracket | # Households | Median Income |
| 15 to 24 Years | 0 (0.0%) | $0 |
| 25 to 44 Years | 15 (3.4%) | $127,083 |
| 45 to 64 Years | 152 (34.9%) | $115,625 |
| 65+ Years | 269 (61.7%) | $89,792 |
| Total | 436 (100.0%) | $101,250 |
Poverty in Longport borough
Income Below Poverty by Sex and Age in Longport borough
With 4.1% poverty level for males and 7.4% for females among the residents of Longport borough, 12 to 14 year old males and 45 to 54 year old females are the most vulnerable to poverty, with 9 males (56.2%) and 10 females (18.5%) in their respective age groups living below the poverty level.
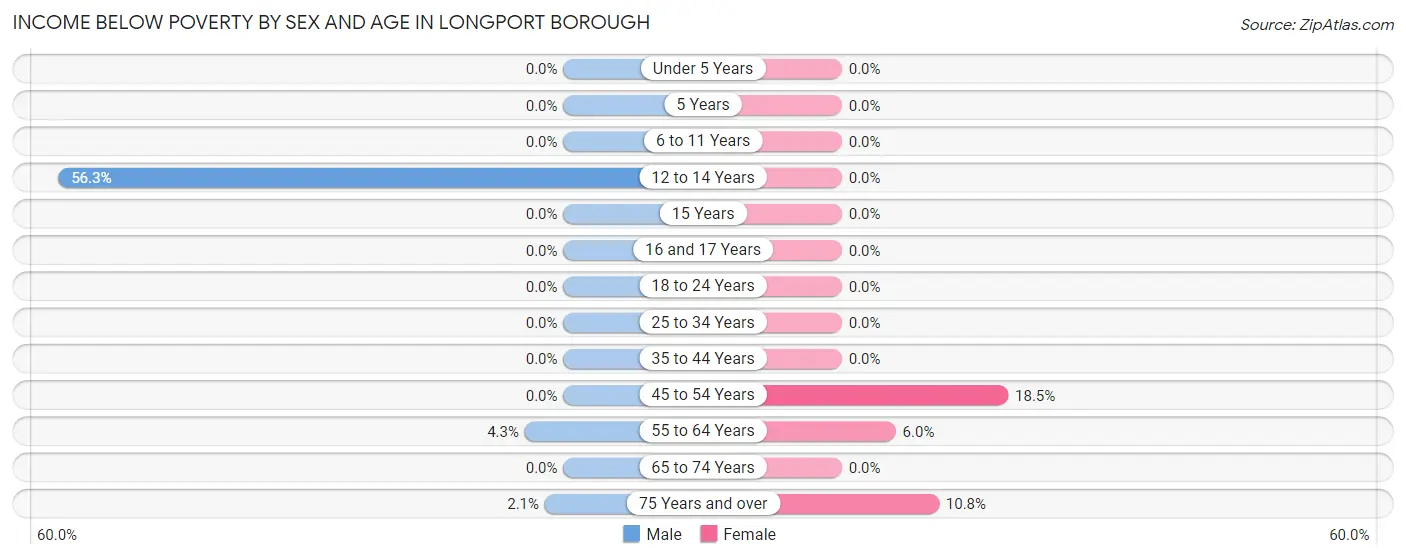
| Age Bracket | Male | Female |
| Under 5 Years | 0 (0.0%) | 0 (0.0%) |
| 5 Years | 0 (0.0%) | 0 (0.0%) |
| 6 to 11 Years | 0 (0.0%) | 0 (0.0%) |
| 12 to 14 Years | 9 (56.2%) | 0 (0.0%) |
| 15 Years | 0 (0.0%) | 0 (0.0%) |
| 16 and 17 Years | 0 (0.0%) | 0 (0.0%) |
| 18 to 24 Years | 0 (0.0%) | 0 (0.0%) |
| 25 to 34 Years | 0 (0.0%) | 0 (0.0%) |
| 35 to 44 Years | 0 (0.0%) | 0 (0.0%) |
| 45 to 54 Years | 0 (0.0%) | 10 (18.5%) |
| 55 to 64 Years | 3 (4.3%) | 6 (6.0%) |
| 65 to 74 Years | 0 (0.0%) | 0 (0.0%) |
| 75 Years and over | 2 (2.1%) | 16 (10.8%) |
| Total | 14 (4.1%) | 32 (7.4%) |
Income Above Poverty by Sex and Age in Longport borough
According to the poverty statistics in Longport borough, males aged 6 to 11 years and females aged under 5 years are the age groups that are most secure financially, with 100.0% of males and 100.0% of females in these age groups living above the poverty line.
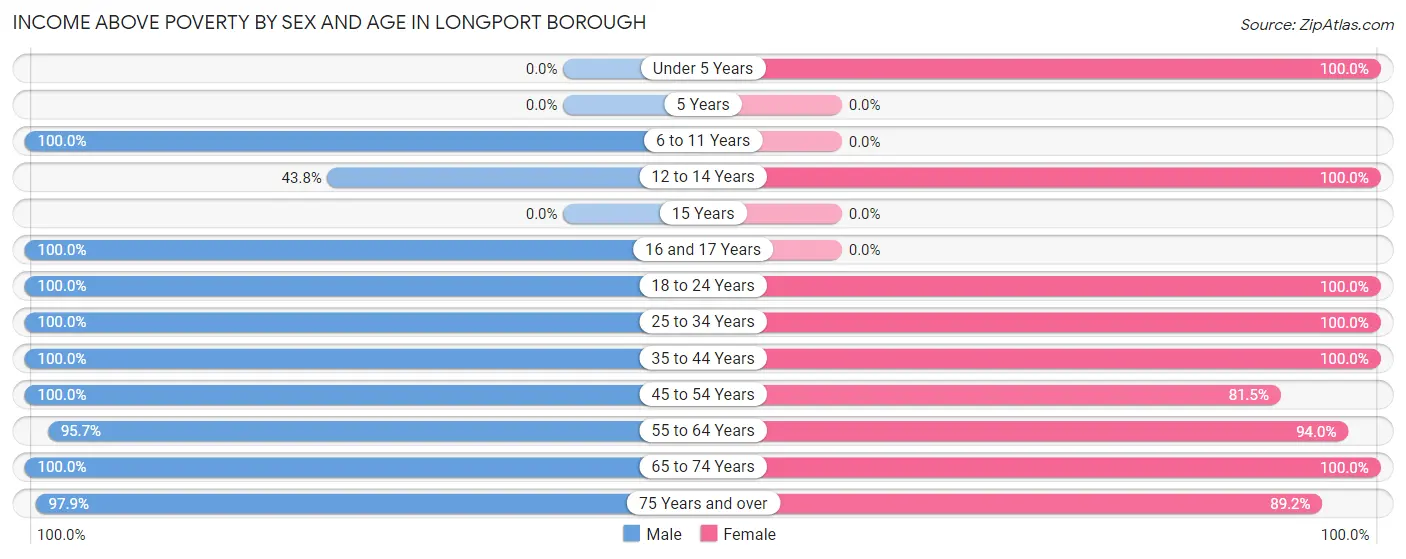
| Age Bracket | Male | Female |
| Under 5 Years | 0 (0.0%) | 4 (100.0%) |
| 5 Years | 0 (0.0%) | 0 (0.0%) |
| 6 to 11 Years | 11 (100.0%) | 0 (0.0%) |
| 12 to 14 Years | 7 (43.8%) | 4 (100.0%) |
| 15 Years | 0 (0.0%) | 0 (0.0%) |
| 16 and 17 Years | 4 (100.0%) | 0 (0.0%) |
| 18 to 24 Years | 6 (100.0%) | 16 (100.0%) |
| 25 to 34 Years | 9 (100.0%) | 4 (100.0%) |
| 35 to 44 Years | 9 (100.0%) | 18 (100.0%) |
| 45 to 54 Years | 30 (100.0%) | 44 (81.5%) |
| 55 to 64 Years | 67 (95.7%) | 94 (94.0%) |
| 65 to 74 Years | 90 (100.0%) | 86 (100.0%) |
| 75 Years and over | 95 (97.9%) | 132 (89.2%) |
| Total | 328 (95.9%) | 402 (92.6%) |
Income Below Poverty Among Married-Couple Families in Longport borough
The poverty statistics for married-couple families in Longport borough show that 1.4% or 3 of the total 220 families live below the poverty line. Families with no children have the highest poverty rate of 1.5%, comprising of 3 families. On the other hand, families with 1 or 2 children have the lowest poverty rate of 0.0%, which includes 0 families.
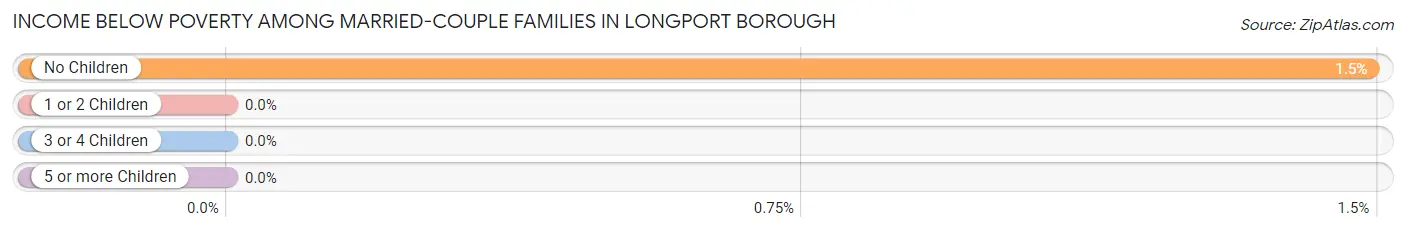
| Children | Above Poverty | Below Poverty |
| No Children | 199 (98.5%) | 3 (1.5%) |
| 1 or 2 Children | 18 (100.0%) | 0 (0.0%) |
| 3 or 4 Children | 0 (0.0%) | 0 (0.0%) |
| 5 or more Children | 0 (0.0%) | 0 (0.0%) |
| Total | 217 (98.6%) | 3 (1.4%) |
Income Below Poverty Among Single-Parent Households in Longport borough
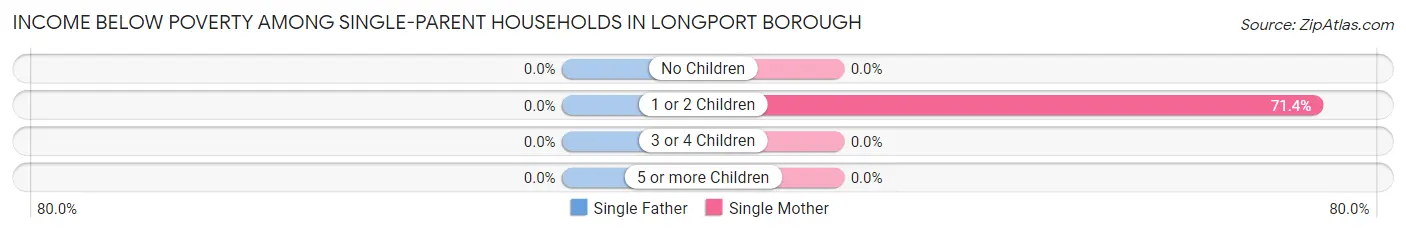
| Children | Single Father | Single Mother |
| No Children | 0 (0.0%) | 0 (0.0%) |
| 1 or 2 Children | 0 (0.0%) | 10 (71.4%) |
| 3 or 4 Children | 0 (0.0%) | 0 (0.0%) |
| 5 or more Children | 0 (0.0%) | 0 (0.0%) |
| Total | 0 (0.0%) | 10 (29.4%) |
Income Below Poverty Among Married-Couple vs Single-Parent Households in Longport borough
The poverty data for Longport borough shows that 3 of the married-couple family households (1.4%) and 10 of the single-parent households (23.8%) are living below the poverty level. Within the married-couple family households, those with no children have the highest poverty rate, with 3 households (1.5%) falling below the poverty line. Among the single-parent households, those with 1 or 2 children have the highest poverty rate, with 10 household (71.4%) living below poverty.
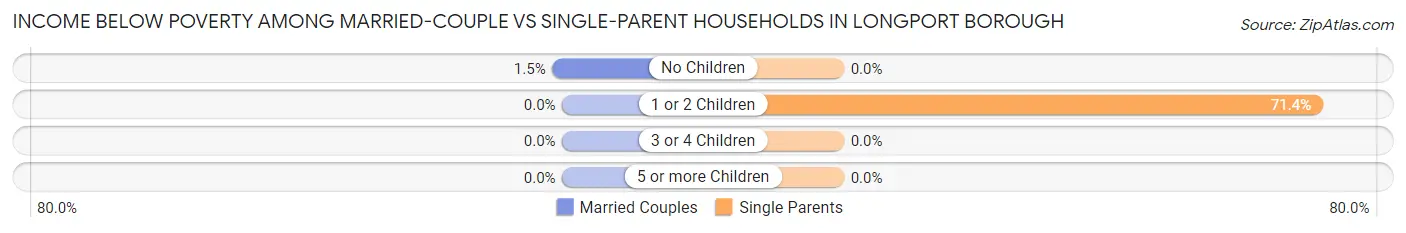
| Children | Married-Couple Families | Single-Parent Households |
| No Children | 3 (1.5%) | 0 (0.0%) |
| 1 or 2 Children | 0 (0.0%) | 10 (71.4%) |
| 3 or 4 Children | 0 (0.0%) | 0 (0.0%) |
| 5 or more Children | 0 (0.0%) | 0 (0.0%) |
| Total | 3 (1.4%) | 10 (23.8%) |
Race in Longport borough
The most populous races in Longport borough are White / Caucasian (759 | 97.8%), Asian (14 | 1.8%), and Hispanic or Latino (3 | 0.4%).
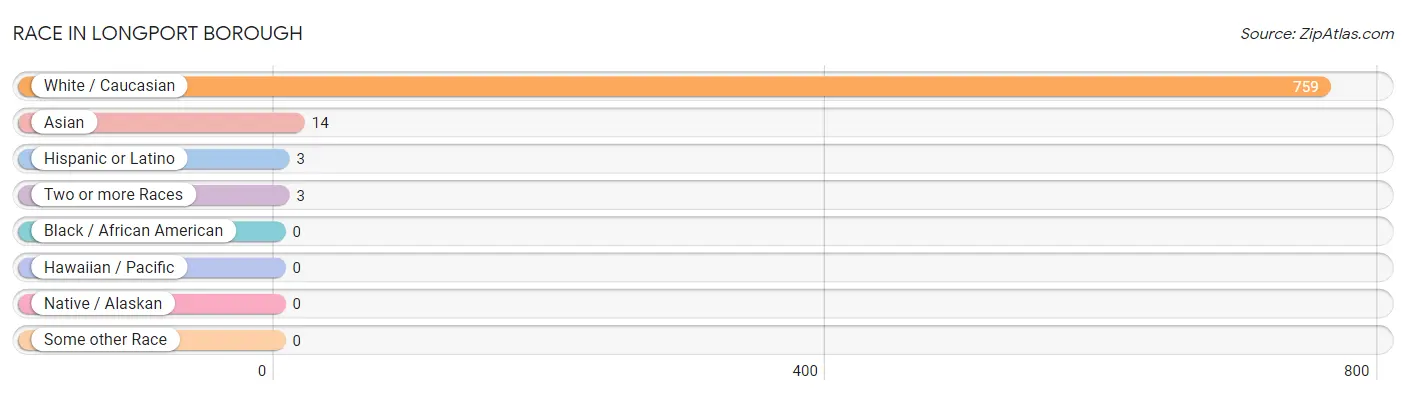
| Race | # Population | % Population |
| Asian | 14 | 1.8% |
| Black / African American | 0 | 0.0% |
| Hawaiian / Pacific | 0 | 0.0% |
| Hispanic or Latino | 3 | 0.4% |
| Native / Alaskan | 0 | 0.0% |
| White / Caucasian | 759 | 97.8% |
| Two or more Races | 3 | 0.4% |
| Some other Race | 0 | 0.0% |
| Total | 776 | 100.0% |
Ancestry in Longport borough
The most populous ancestries reported in Longport borough are Italian (253 | 32.6%), Irish (217 | 28.0%), English (77 | 9.9%), German (65 | 8.4%), and Russian (53 | 6.8%), together accounting for 85.7% of all Longport borough residents.
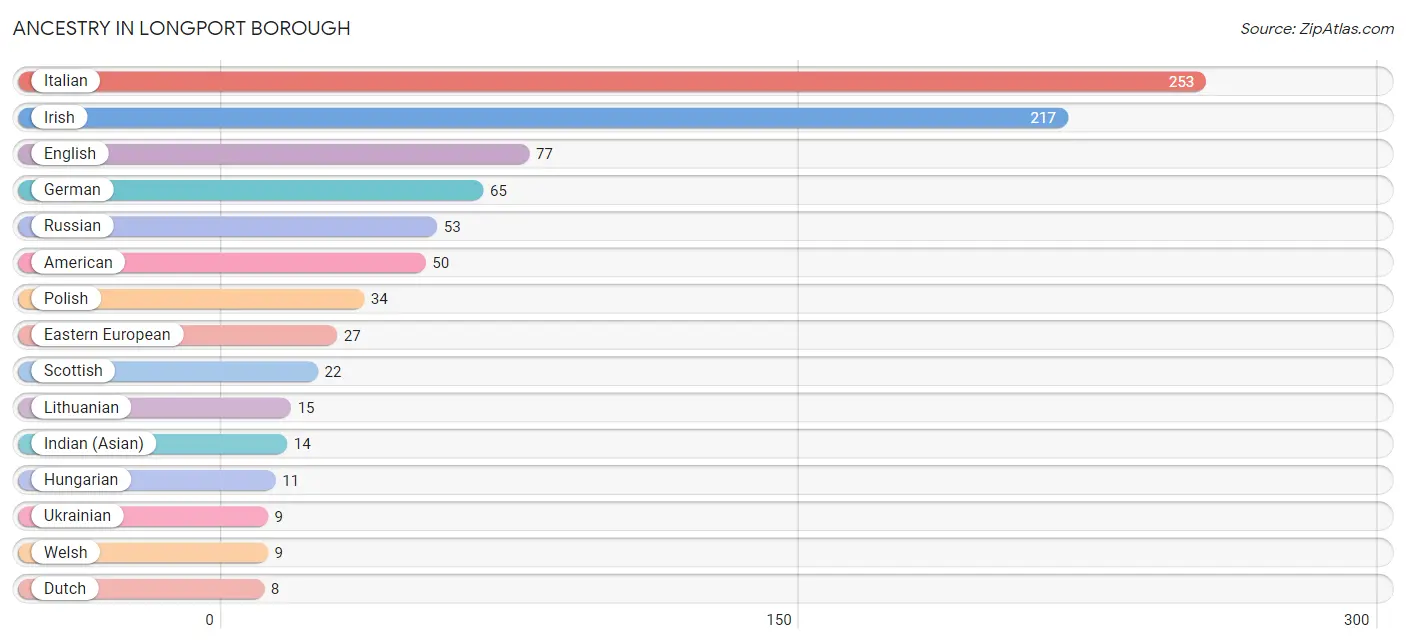
| Ancestry | # Population | % Population |
| American | 50 | 6.4% |
| Austrian | 4 | 0.5% |
| British | 3 | 0.4% |
| Croatian | 3 | 0.4% |
| Czech | 3 | 0.4% |
| Czechoslovakian | 3 | 0.4% |
| Dutch | 8 | 1.0% |
| Eastern European | 27 | 3.5% |
| English | 77 | 9.9% |
| European | 6 | 0.8% |
| French | 8 | 1.0% |
| German | 65 | 8.4% |
| Greek | 2 | 0.3% |
| Hungarian | 11 | 1.4% |
| Indian (Asian) | 14 | 1.8% |
| Irish | 217 | 28.0% |
| Italian | 253 | 32.6% |
| Latvian | 4 | 0.5% |
| Lithuanian | 15 | 1.9% |
| Norwegian | 3 | 0.4% |
| Polish | 34 | 4.4% |
| Portuguese | 3 | 0.4% |
| Romanian | 8 | 1.0% |
| Russian | 53 | 6.8% |
| Scottish | 22 | 2.8% |
| Spanish | 3 | 0.4% |
| Swedish | 3 | 0.4% |
| Ukrainian | 9 | 1.2% |
| Welsh | 9 | 1.2% |
| Yugoslavian | 3 | 0.4% | View All 30 Rows |
Immigrants in Longport borough
The most numerous immigrant groups reported in Longport borough came from Asia (6 | 0.8%), China (6 | 0.8%), Eastern Asia (6 | 0.8%), Africa (2 | 0.3%), and Egypt (2 | 0.3%), together accounting for 2.8% of all Longport borough residents.
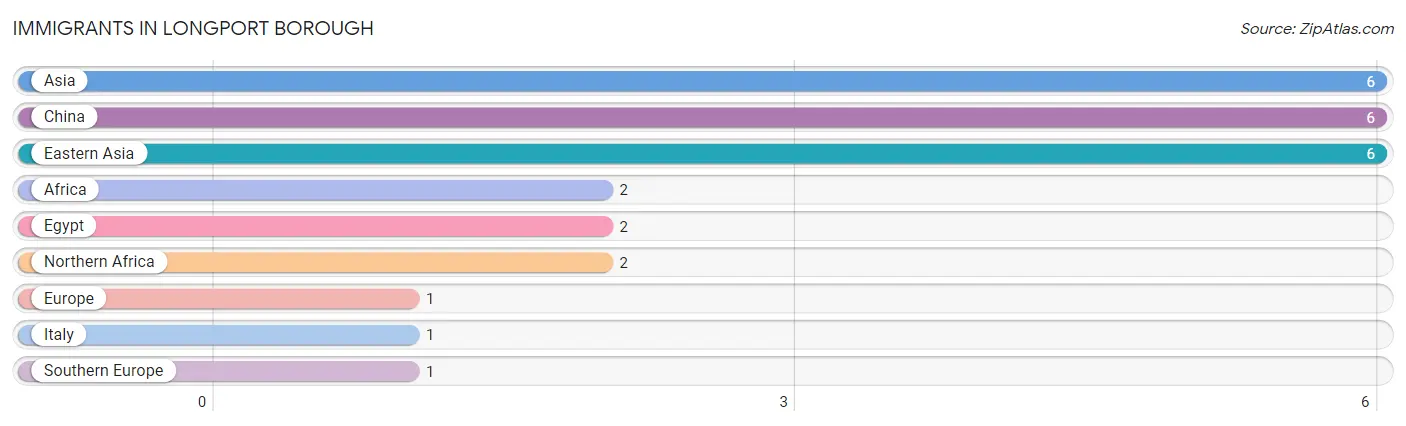
| Immigration Origin | # Population | % Population |
| Africa | 2 | 0.3% |
| Asia | 6 | 0.8% |
| China | 6 | 0.8% |
| Eastern Asia | 6 | 0.8% |
| Egypt | 2 | 0.3% |
| Europe | 1 | 0.1% |
| Italy | 1 | 0.1% |
| Northern Africa | 2 | 0.3% |
| Southern Europe | 1 | 0.1% | View All 9 Rows |
Sex and Age in Longport borough
Sex and Age in Longport borough
The most populous age groups in Longport borough are 75 to 79 Years (62 | 18.1%) for men and 75 to 79 Years (78 | 18.0%) for women.
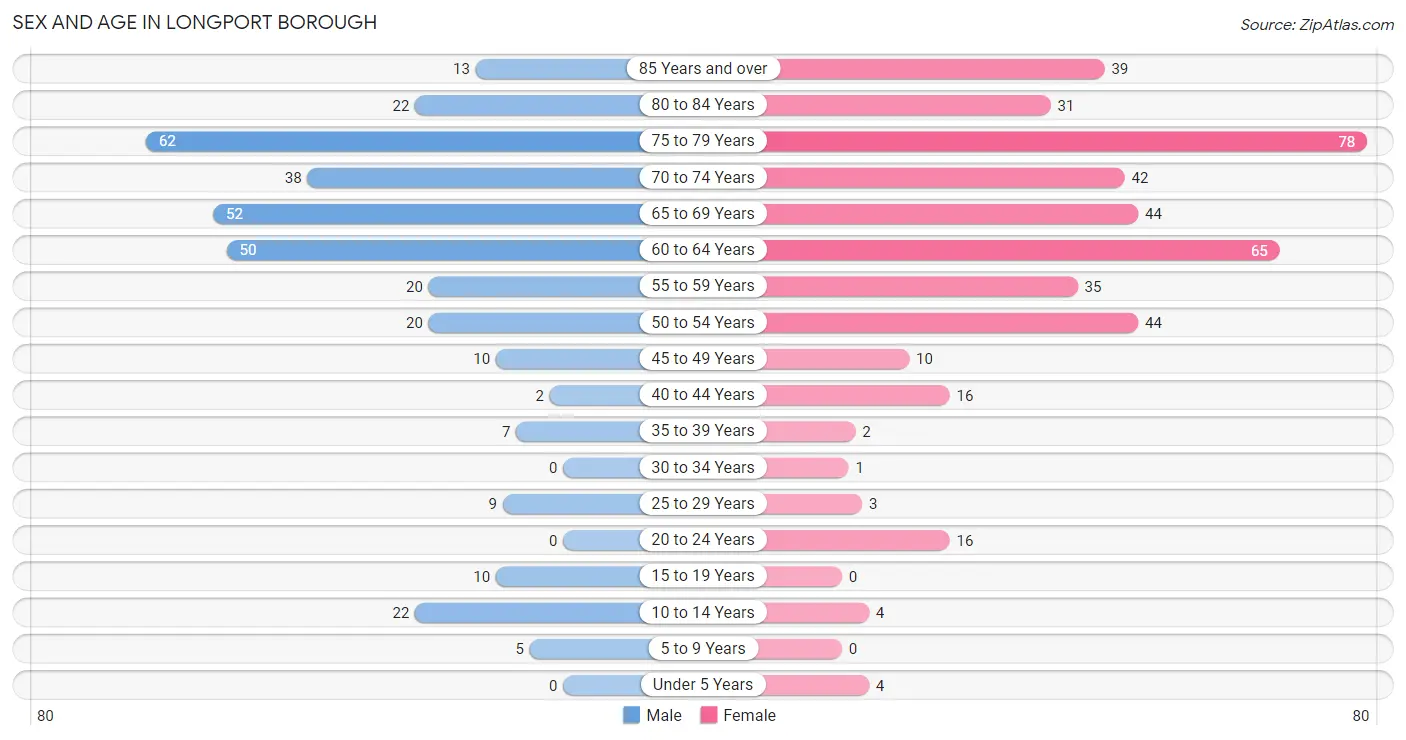
| Age Bracket | Male | Female |
| Under 5 Years | 0 (0.0%) | 4 (0.9%) |
| 5 to 9 Years | 5 (1.5%) | 0 (0.0%) |
| 10 to 14 Years | 22 (6.4%) | 4 (0.9%) |
| 15 to 19 Years | 10 (2.9%) | 0 (0.0%) |
| 20 to 24 Years | 0 (0.0%) | 16 (3.7%) |
| 25 to 29 Years | 9 (2.6%) | 3 (0.7%) |
| 30 to 34 Years | 0 (0.0%) | 1 (0.2%) |
| 35 to 39 Years | 7 (2.1%) | 2 (0.5%) |
| 40 to 44 Years | 2 (0.6%) | 16 (3.7%) |
| 45 to 49 Years | 10 (2.9%) | 10 (2.3%) |
| 50 to 54 Years | 20 (5.9%) | 44 (10.1%) |
| 55 to 59 Years | 20 (5.9%) | 35 (8.1%) |
| 60 to 64 Years | 50 (14.6%) | 65 (15.0%) |
| 65 to 69 Years | 52 (15.2%) | 44 (10.1%) |
| 70 to 74 Years | 38 (11.1%) | 42 (9.7%) |
| 75 to 79 Years | 62 (18.1%) | 78 (18.0%) |
| 80 to 84 Years | 22 (6.4%) | 31 (7.1%) |
| 85 Years and over | 13 (3.8%) | 39 (9.0%) |
| Total | 342 (100.0%) | 434 (100.0%) |
Families and Households in Longport borough
Median Family Size in Longport borough
The median family size in Longport borough is 2.27 persons per family, with married-couple families (220 | 84.0%) accounting for the largest median family size of 2.28 persons per family. On the other hand, single male/father families (8 | 3.0%) represent the smallest median family size with 2.13 persons per family.
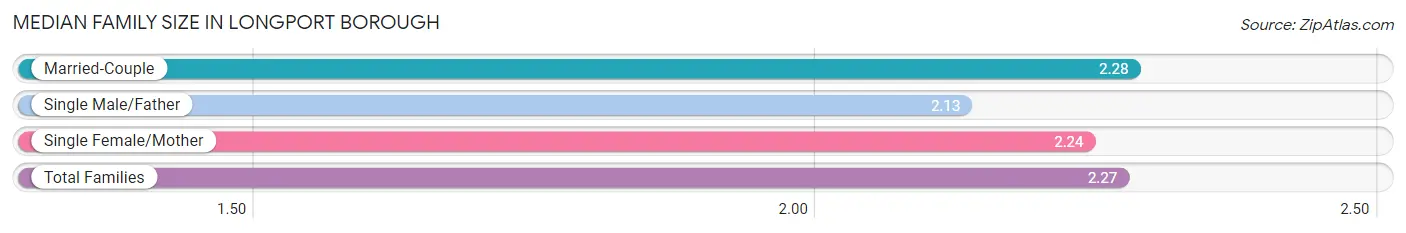
| Family Type | # Families | Family Size |
| Married-Couple | 220 (84.0%) | 2.28 |
| Single Male/Father | 8 (3.0%) | 2.13 |
| Single Female/Mother | 34 (13.0%) | 2.24 |
| Total Families | 262 (100.0%) | 2.27 |
Median Household Size in Longport borough
The median household size in Longport borough is 1.78 persons per household, with married-couple households (220 | 50.5%) accounting for the largest median household size of 2.28 persons per household. non-family households (174 | 39.9%) represent the smallest median household size with 1.05 persons per household.
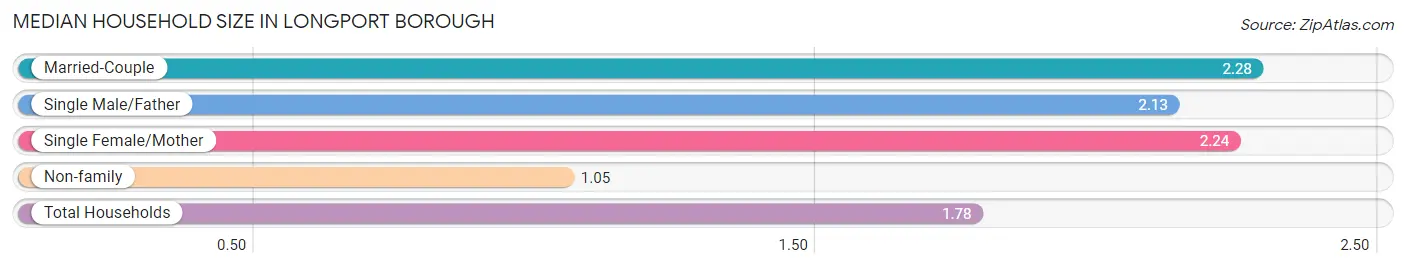
| Household Type | # Households | Household Size |
| Married-Couple | 220 (50.5%) | 2.28 |
| Single Male/Father | 8 (1.8%) | 2.13 |
| Single Female/Mother | 34 (7.8%) | 2.24 |
| Non-family | 174 (39.9%) | 1.05 |
| Total Households | 436 (100.0%) | 1.78 |
Household Size by Marriage Status in Longport borough
Out of a total of 436 households in Longport borough, 262 (60.1%) are family households, while 174 (39.9%) are nonfamily households. The most numerous type of family households are 2-person households, comprising 232, and the most common type of nonfamily households are 1-person households, comprising 165.
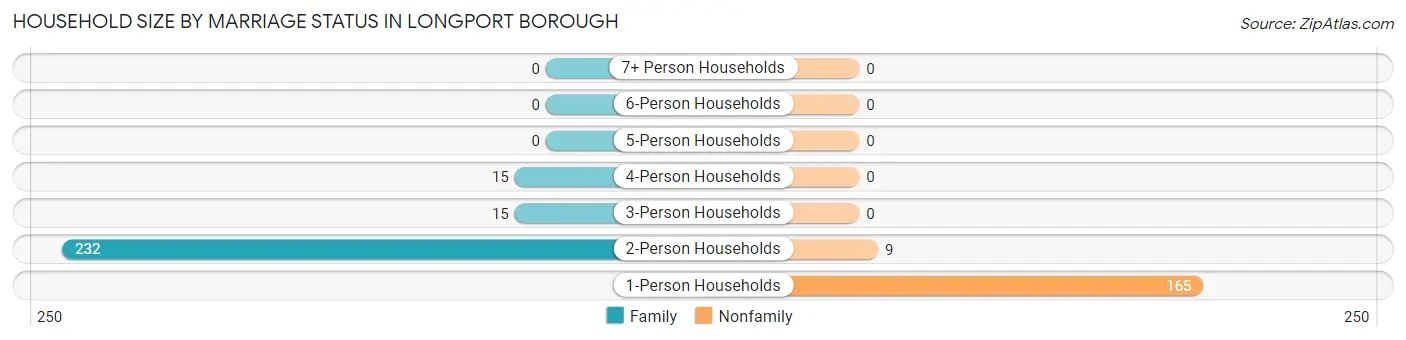
| Household Size | Family Households | Nonfamily Households |
| 1-Person Households | - | 165 (37.8%) |
| 2-Person Households | 232 (53.2%) | 9 (2.1%) |
| 3-Person Households | 15 (3.4%) | 0 (0.0%) |
| 4-Person Households | 15 (3.4%) | 0 (0.0%) |
| 5-Person Households | 0 (0.0%) | 0 (0.0%) |
| 6-Person Households | 0 (0.0%) | 0 (0.0%) |
| 7+ Person Households | 0 (0.0%) | 0 (0.0%) |
| Total | 262 (60.1%) | 174 (39.9%) |
Female Fertility in Longport borough
Fertility by Age in Longport borough
| Age Bracket | Women with Births | Births / 1,000 Women |
| 15 to 19 years | 0 (0.0%) | 0.0 |
| 20 to 34 years | 0 (0.0%) | 0.0 |
| 35 to 50 years | 0 (0.0%) | 0.0 |
| Total | 0 (0.0%) | 0.0 |
Fertility by Age by Marriage Status in Longport borough
| Age Bracket | Married | Unmarried |
| 15 to 19 years | 0 (0.0%) | 0 (0.0%) |
| 20 to 34 years | 0 (0.0%) | 0 (0.0%) |
| 35 to 50 years | 0 (0.0%) | 0 (0.0%) |
| Total | 0 (0.0%) | 0 (0.0%) |
Fertility by Education in Longport borough
| Educational Attainment | Women with Births | Births / 1,000 Women |
| Less than High School | 0 (0.0%) | 0.0 |
| High School Diploma | 0 (0.0%) | 0.0 |
| College or Associate's Degree | 0 (0.0%) | 0.0 |
| Bachelor's Degree | 0 (0.0%) | 0.0 |
| Graduate Degree | 0 (0.0%) | 0.0 |
| Total | 0 (0.0%) | 0.0 |
Fertility by Education by Marriage Status in Longport borough
| Educational Attainment | Married | Unmarried |
| Less than High School | 0 (0.0%) | 0 (0.0%) |
| High School Diploma | 0 (0.0%) | 0 (0.0%) |
| College or Associate's Degree | 0 (0.0%) | 0 (0.0%) |
| Bachelor's Degree | 0 (0.0%) | 0 (0.0%) |
| Graduate Degree | 0 (0.0%) | 0 (0.0%) |
| Total | 0 (0.0%) | 0 (0.0%) |
Employment Characteristics in Longport borough
Employment by Class of Employer in Longport borough
Among the 261 employed individuals in Longport borough, private company employees (130 | 49.8%), self-employed (incorporated) (37 | 14.2%), and local government employees (31 | 11.9%) make up the most common classes of employment.
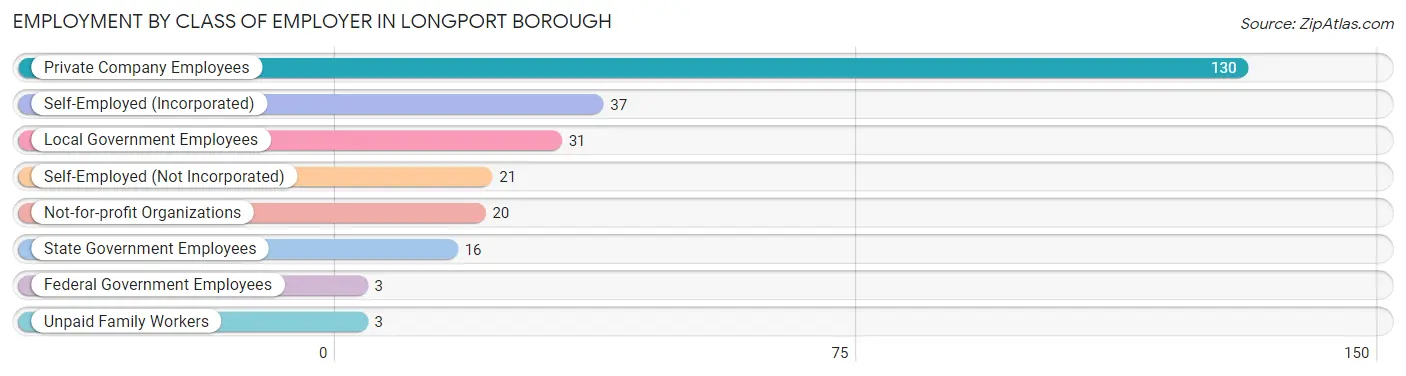
| Employer Class | # Employees | % Employees |
| Private Company Employees | 130 | 49.8% |
| Self-Employed (Incorporated) | 37 | 14.2% |
| Self-Employed (Not Incorporated) | 21 | 8.1% |
| Not-for-profit Organizations | 20 | 7.7% |
| Local Government Employees | 31 | 11.9% |
| State Government Employees | 16 | 6.1% |
| Federal Government Employees | 3 | 1.1% |
| Unpaid Family Workers | 3 | 1.1% |
| Total | 261 | 100.0% |
Employment Status by Age in Longport borough
According to the labor force statistics for Longport borough, out of the total population over 16 years of age (741), 40.6% or 301 individuals are in the labor force, with 8.6% or 26 of them unemployed. The age group with the highest labor force participation rate is 25 to 29 years, with 100.0% or 12 individuals in the labor force. Within the labor force, the 20 to 24 years age range has the highest percentage of unemployed individuals, with 54.5% or 6 of them being unemployed.
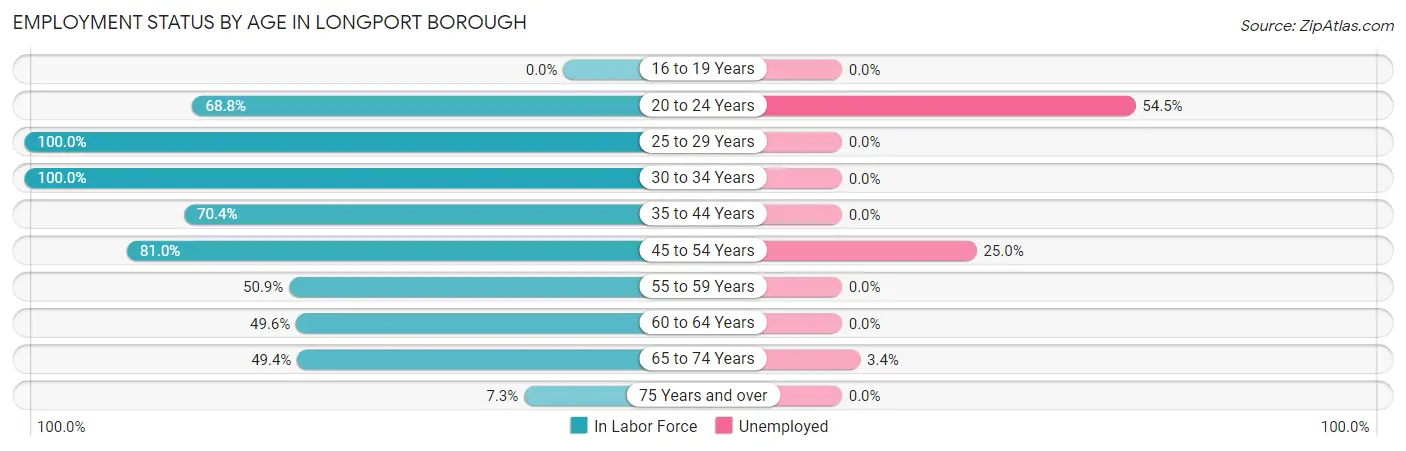
| Age Bracket | In Labor Force | Unemployed |
| 16 to 19 Years | 0 (0.0%) | 0 (0.0%) |
| 20 to 24 Years | 11 (68.8%) | 6 (54.5%) |
| 25 to 29 Years | 12 (100.0%) | 0 (0.0%) |
| 30 to 34 Years | 1 (100.0%) | 0 (0.0%) |
| 35 to 44 Years | 19 (70.4%) | 0 (0.0%) |
| 45 to 54 Years | 68 (81.0%) | 17 (25.0%) |
| 55 to 59 Years | 28 (50.9%) | 0 (0.0%) |
| 60 to 64 Years | 57 (49.6%) | 0 (0.0%) |
| 65 to 74 Years | 87 (49.4%) | 3 (3.4%) |
| 75 Years and over | 18 (7.3%) | 0 (0.0%) |
| Total | 301 (40.6%) | 26 (8.6%) |
Employment Status by Educational Attainment in Longport borough
According to labor force statistics for Longport borough, 62.9% of individuals (185) out of the total population between 25 and 64 years of age (294) are in the labor force, with 9.2% or 17 of them being unemployed. The group with the highest labor force participation rate are those with the educational attainment of college / associate degree, with 77.1% or 54 individuals in the labor force. Within the labor force, individuals with bachelor's degree or higher education have the highest percentage of unemployment, with 11.8% or 13 of them being unemployed.
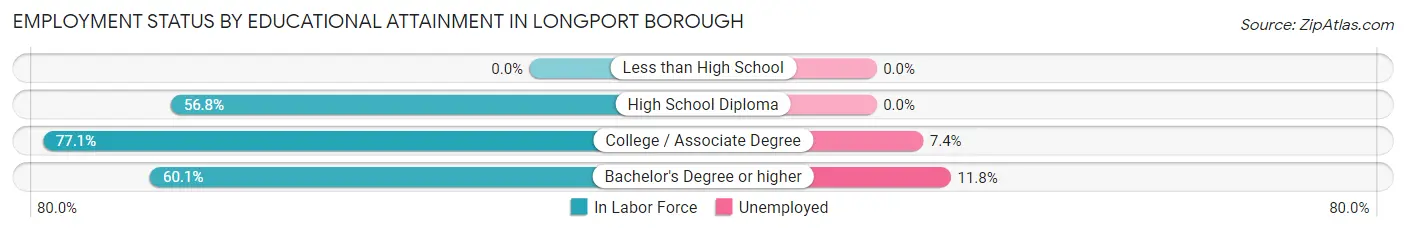
| Educational Attainment | In Labor Force | Unemployed |
| Less than High School | 0 (0.0%) | 0 (0.0%) |
| High School Diploma | 21 (56.8%) | 0 (0.0%) |
| College / Associate Degree | 54 (77.1%) | 5 (7.4%) |
| Bachelor's Degree or higher | 110 (60.1%) | 22 (11.8%) |
| Total | 185 (62.9%) | 27 (9.2%) |
Employment Occupations by Sex in Longport borough
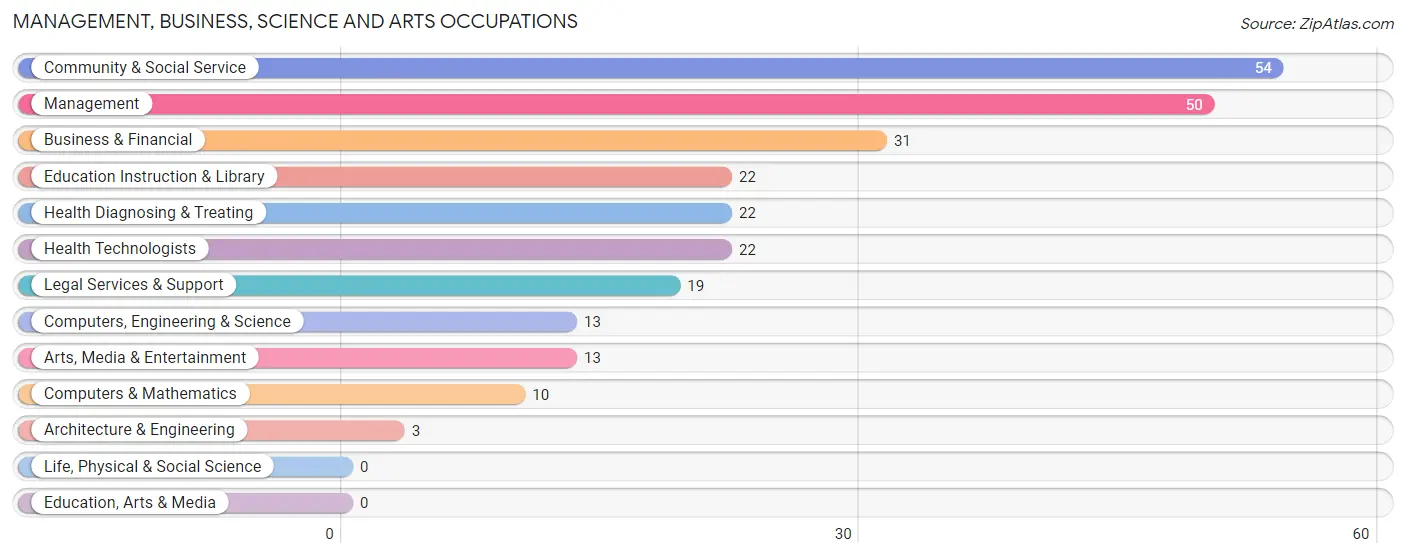
Management, Business, Science and Arts Occupations
The most common Management, Business, Science and Arts occupations in Longport borough are Community & Social Service (54 | 19.6%), Management (50 | 18.2%), Business & Financial (31 | 11.3%), Education Instruction & Library (22 | 8.0%), and Health Diagnosing & Treating (22 | 8.0%).
Management, Business, Science and Arts Occupations by Sex
Within the Management, Business, Science and Arts occupations in Longport borough, the most male-oriented occupations are Computers, Engineering & Science (100.0%), Computers & Mathematics (100.0%), and Architecture & Engineering (100.0%), while the most female-oriented occupations are Education Instruction & Library (77.3%), Business & Financial (32.3%), and Community & Social Service (31.5%).
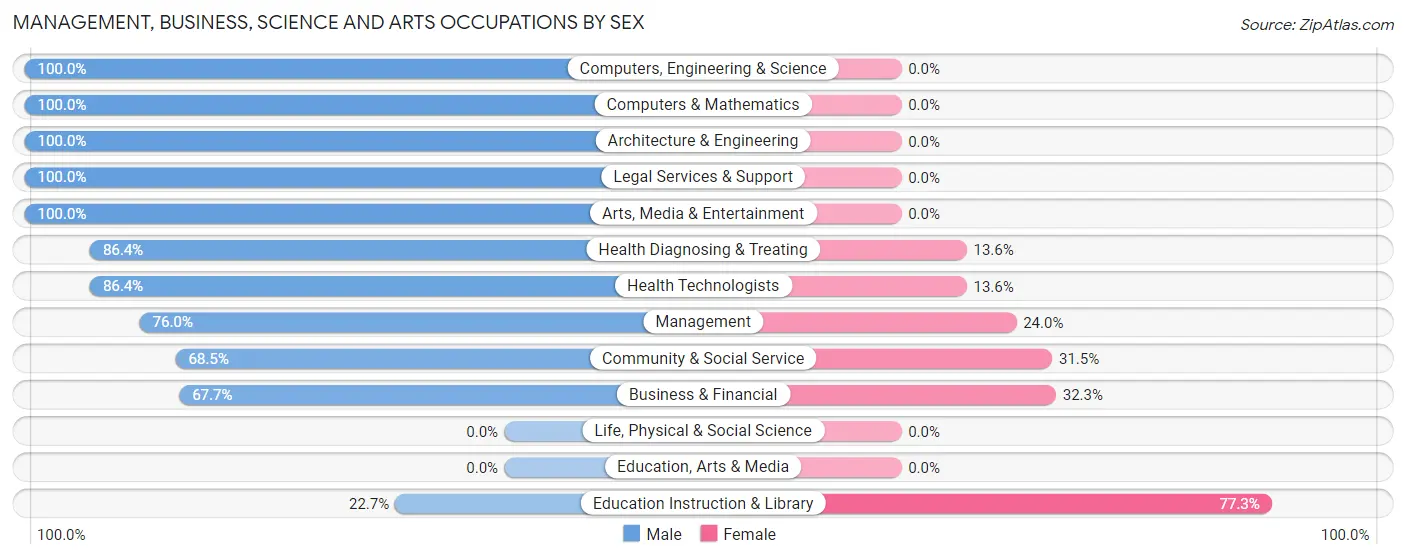
| Occupation | Male | Female |
| Management | 38 (76.0%) | 12 (24.0%) |
| Business & Financial | 21 (67.7%) | 10 (32.3%) |
| Computers, Engineering & Science | 13 (100.0%) | 0 (0.0%) |
| Computers & Mathematics | 10 (100.0%) | 0 (0.0%) |
| Architecture & Engineering | 3 (100.0%) | 0 (0.0%) |
| Life, Physical & Social Science | 0 (0.0%) | 0 (0.0%) |
| Community & Social Service | 37 (68.5%) | 17 (31.5%) |
| Education, Arts & Media | 0 (0.0%) | 0 (0.0%) |
| Legal Services & Support | 19 (100.0%) | 0 (0.0%) |
| Education Instruction & Library | 5 (22.7%) | 17 (77.3%) |
| Arts, Media & Entertainment | 13 (100.0%) | 0 (0.0%) |
| Health Diagnosing & Treating | 19 (86.4%) | 3 (13.6%) |
| Health Technologists | 19 (86.4%) | 3 (13.6%) |
| Total (Category) | 128 (75.3%) | 42 (24.7%) |
| Total (Overall) | 174 (63.3%) | 101 (36.7%) |
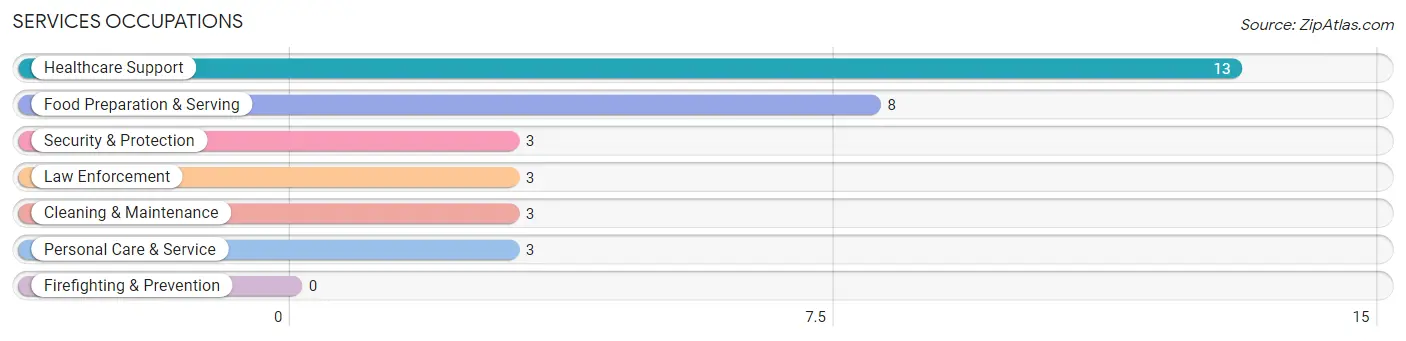
Services Occupations
The most common Services occupations in Longport borough are Healthcare Support (13 | 4.7%), Food Preparation & Serving (8 | 2.9%), Security & Protection (3 | 1.1%), Law Enforcement (3 | 1.1%), and Cleaning & Maintenance (3 | 1.1%).
Services Occupations by Sex
Within the Services occupations in Longport borough, the most male-oriented occupations are Security & Protection (100.0%), Law Enforcement (100.0%), and Cleaning & Maintenance (100.0%), while the most female-oriented occupations are Healthcare Support (100.0%), Personal Care & Service (100.0%), and Food Preparation & Serving (37.5%).
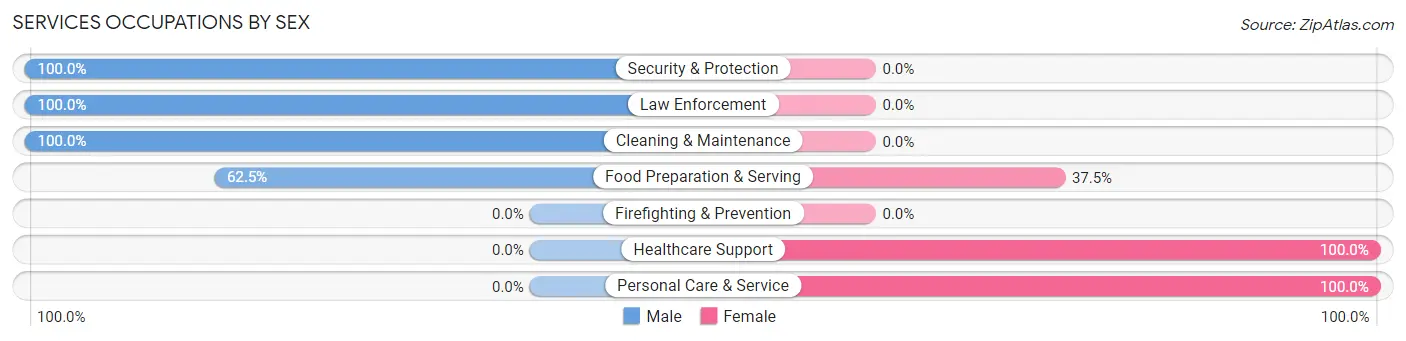
| Occupation | Male | Female |
| Healthcare Support | 0 (0.0%) | 13 (100.0%) |
| Security & Protection | 3 (100.0%) | 0 (0.0%) |
| Firefighting & Prevention | 0 (0.0%) | 0 (0.0%) |
| Law Enforcement | 3 (100.0%) | 0 (0.0%) |
| Food Preparation & Serving | 5 (62.5%) | 3 (37.5%) |
| Cleaning & Maintenance | 3 (100.0%) | 0 (0.0%) |
| Personal Care & Service | 0 (0.0%) | 3 (100.0%) |
| Total (Category) | 11 (36.7%) | 19 (63.3%) |
| Total (Overall) | 174 (63.3%) | 101 (36.7%) |
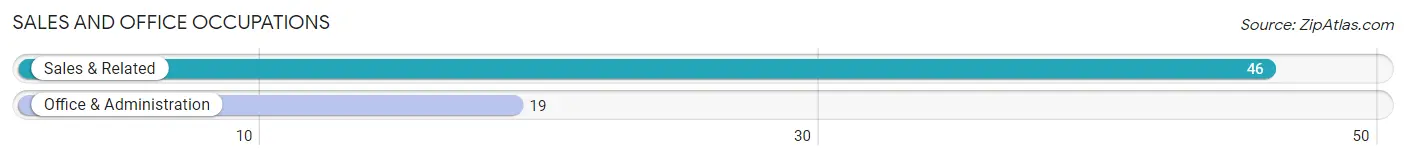
Sales and Office Occupations
The most common Sales and Office occupations in Longport borough are Sales & Related (46 | 16.7%), and Office & Administration (19 | 6.9%).
Sales and Office Occupations by Sex

| Occupation | Male | Female |
| Sales & Related | 25 (54.3%) | 21 (45.7%) |
| Office & Administration | 0 (0.0%) | 19 (100.0%) |
| Total (Category) | 25 (38.5%) | 40 (61.5%) |
| Total (Overall) | 174 (63.3%) | 101 (36.7%) |
Natural Resources, Construction and Maintenance Occupations
The most common Natural Resources, Construction and Maintenance occupations in Longport borough are , and Construction & Extraction (10 | 3.6%).
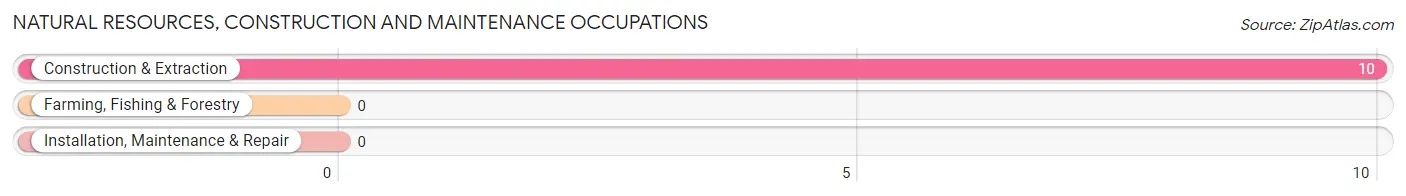
Natural Resources, Construction and Maintenance Occupations by Sex

| Occupation | Male | Female |
| Farming, Fishing & Forestry | 0 (0.0%) | 0 (0.0%) |
| Construction & Extraction | 10 (100.0%) | 0 (0.0%) |
| Installation, Maintenance & Repair | 0 (0.0%) | 0 (0.0%) |
| Total (Category) | 10 (100.0%) | 0 (0.0%) |
| Total (Overall) | 174 (63.3%) | 101 (36.7%) |
Production, Transportation and Moving Occupations
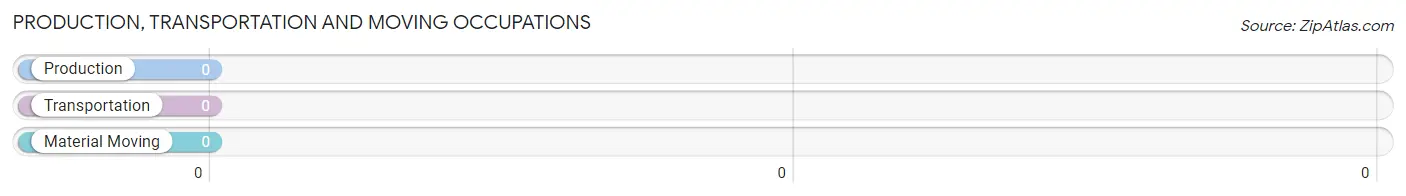
Production, Transportation and Moving Occupations by Sex
| Occupation | Male | Female |
| Production | 0 (0.0%) | 0 (0.0%) |
| Transportation | 0 (0.0%) | 0 (0.0%) |
| Material Moving | 0 (0.0%) | 0 (0.0%) |
| Total (Category) | 0 (0.0%) | 0 (0.0%) |
| Total (Overall) | 174 (63.3%) | 101 (36.7%) |
Employment Industries by Sex in Longport borough
Employment Industries in Longport borough
The major employment industries in Longport borough include Professional & Scientific (60 | 21.8%), Health Care & Social Assistance (43 | 15.6%), Finance & Insurance (30 | 10.9%), Educational Services (29 | 10.5%), and Construction (22 | 8.0%).
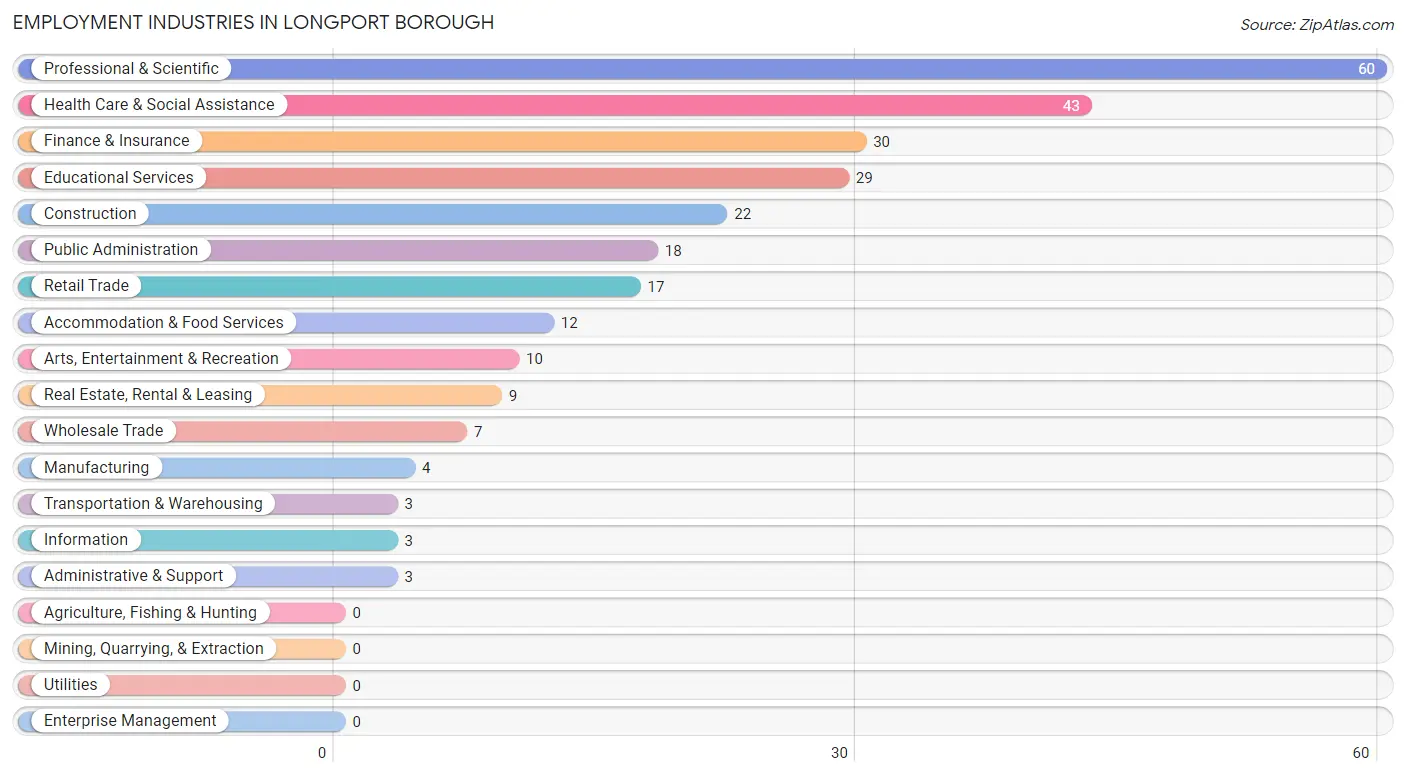
Employment Industries by Sex in Longport borough
The Longport borough industries that see more men than women are Transportation & Warehousing (100.0%), Information (100.0%), and Real Estate, Rental & Leasing (100.0%), whereas the industries that tend to have a higher number of women are Manufacturing (100.0%), Educational Services (58.6%), and Health Care & Social Assistance (51.2%).
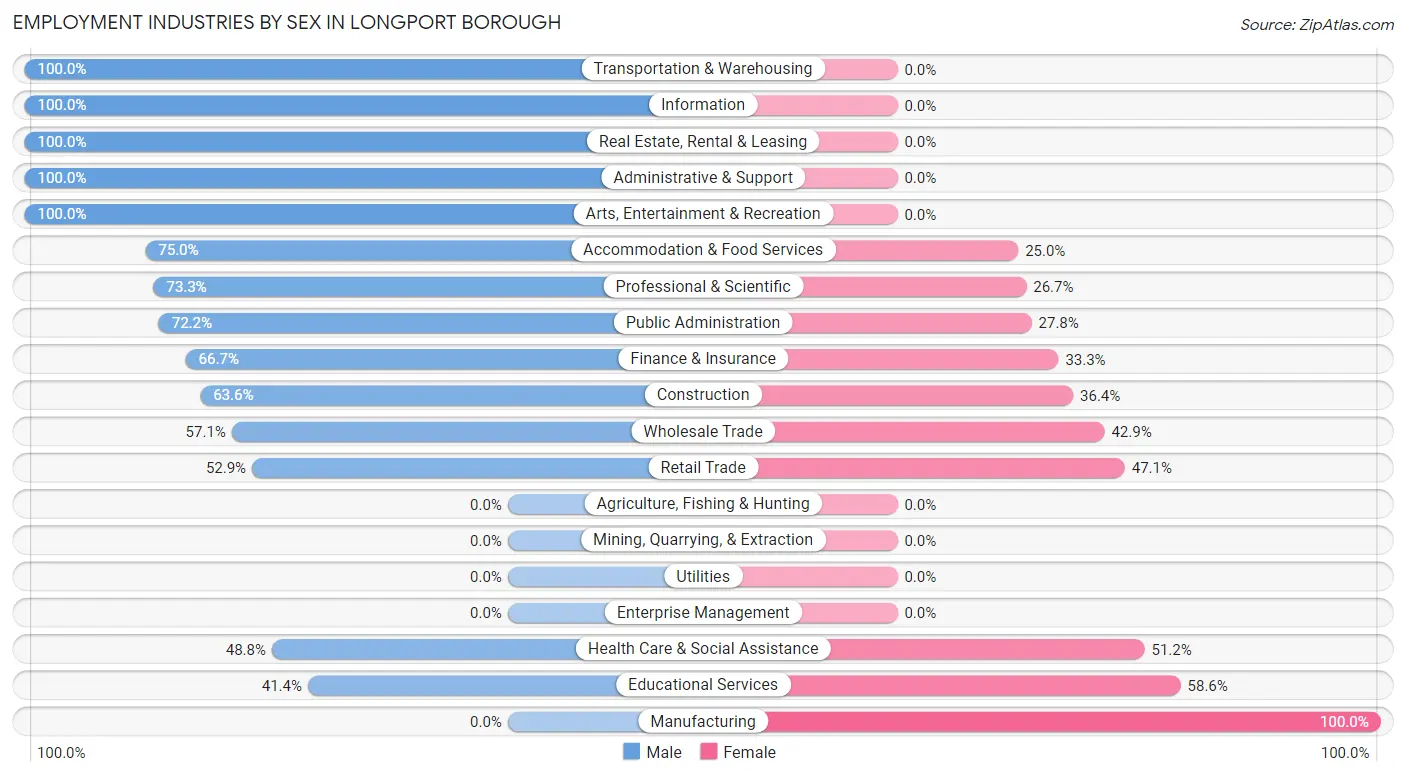
| Industry | Male | Female |
| Agriculture, Fishing & Hunting | 0 (0.0%) | 0 (0.0%) |
| Mining, Quarrying, & Extraction | 0 (0.0%) | 0 (0.0%) |
| Construction | 14 (63.6%) | 8 (36.4%) |
| Manufacturing | 0 (0.0%) | 4 (100.0%) |
| Wholesale Trade | 4 (57.1%) | 3 (42.9%) |
| Retail Trade | 9 (52.9%) | 8 (47.1%) |
| Transportation & Warehousing | 3 (100.0%) | 0 (0.0%) |
| Utilities | 0 (0.0%) | 0 (0.0%) |
| Information | 3 (100.0%) | 0 (0.0%) |
| Finance & Insurance | 20 (66.7%) | 10 (33.3%) |
| Real Estate, Rental & Leasing | 9 (100.0%) | 0 (0.0%) |
| Professional & Scientific | 44 (73.3%) | 16 (26.7%) |
| Enterprise Management | 0 (0.0%) | 0 (0.0%) |
| Administrative & Support | 3 (100.0%) | 0 (0.0%) |
| Educational Services | 12 (41.4%) | 17 (58.6%) |
| Health Care & Social Assistance | 21 (48.8%) | 22 (51.2%) |
| Arts, Entertainment & Recreation | 10 (100.0%) | 0 (0.0%) |
| Accommodation & Food Services | 9 (75.0%) | 3 (25.0%) |
| Public Administration | 13 (72.2%) | 5 (27.8%) |
| Total | 174 (63.3%) | 101 (36.7%) |
Education in Longport borough
School Enrollment in Longport borough
The most common levels of schooling among the 64 students in Longport borough are high school (19 | 29.7%), elementary school (11 | 17.2%), and middle school (11 | 17.2%).
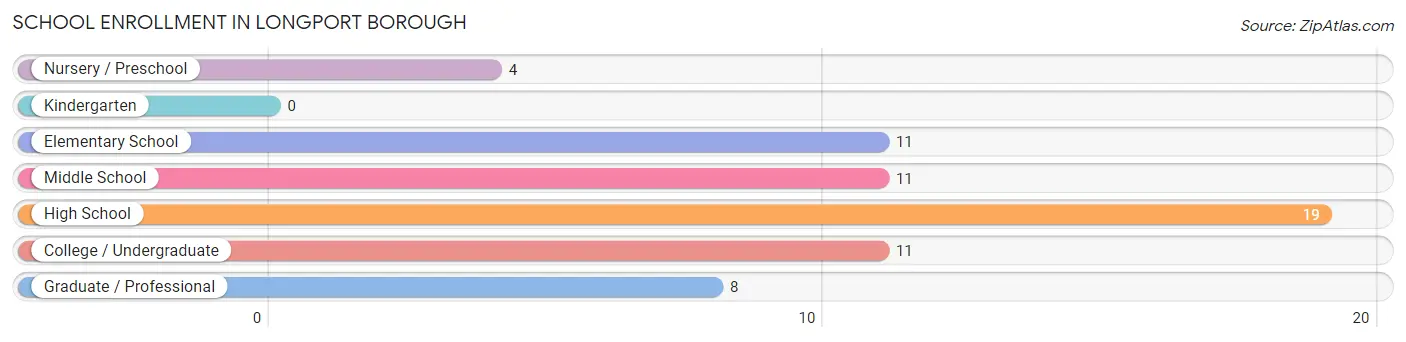
| School Level | # Students | % Students |
| Nursery / Preschool | 4 | 6.2% |
| Kindergarten | 0 | 0.0% |
| Elementary School | 11 | 17.2% |
| Middle School | 11 | 17.2% |
| High School | 19 | 29.7% |
| College / Undergraduate | 11 | 17.2% |
| Graduate / Professional | 8 | 12.5% |
| Total | 64 | 100.0% |
School Enrollment by Age by Funding Source in Longport borough
Out of a total of 64 students who are enrolled in schools in Longport borough, 6 (9.4%) attend a private institution, while the remaining 58 (90.6%) are enrolled in public schools. The age group of 15 to 17 year olds has the highest likelihood of being enrolled in private schools, with 4 (100.0% in the age bracket) enrolled. Conversely, the age group of 3 to 4 year olds has the lowest likelihood of being enrolled in a private school, with 4 (100.0% in the age bracket) attending a public institution.
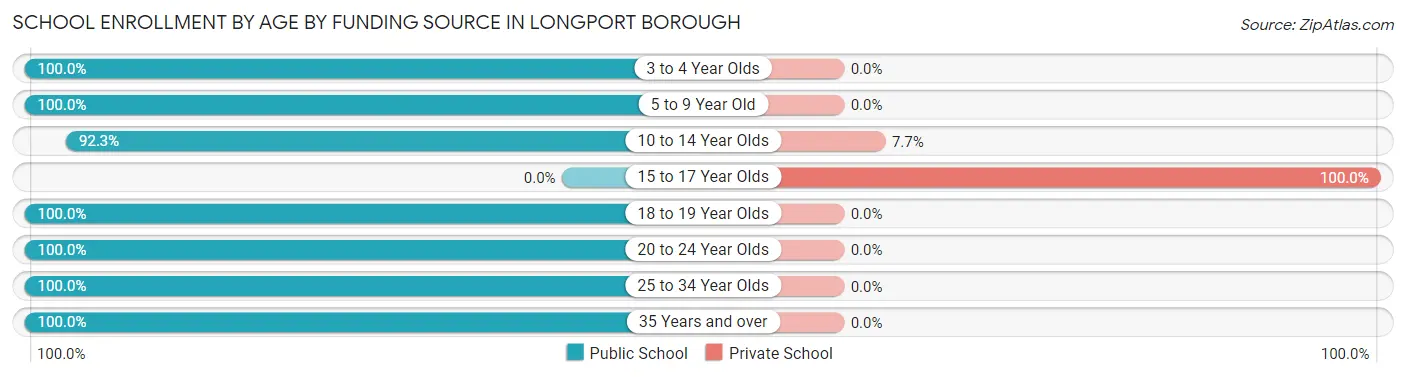
| Age Bracket | Public School | Private School |
| 3 to 4 Year Olds | 4 (100.0%) | 0 (0.0%) |
| 5 to 9 Year Old | 5 (100.0%) | 0 (0.0%) |
| 10 to 14 Year Olds | 24 (92.3%) | 2 (7.7%) |
| 15 to 17 Year Olds | 0 (0.0%) | 4 (100.0%) |
| 18 to 19 Year Olds | 6 (100.0%) | 0 (0.0%) |
| 20 to 24 Year Olds | 11 (100.0%) | 0 (0.0%) |
| 25 to 34 Year Olds | 5 (100.0%) | 0 (0.0%) |
| 35 Years and over | 3 (100.0%) | 0 (0.0%) |
| Total | 58 (90.6%) | 6 (9.4%) |
Educational Attainment by Field of Study in Longport borough
Business (75 | 19.6%), education (61 | 16.0%), social sciences (55 | 14.4%), computers & mathematics (34 | 8.9%), and psychology (31 | 8.1%) are the most common fields of study among 382 individuals in Longport borough who have obtained a bachelor's degree or higher.
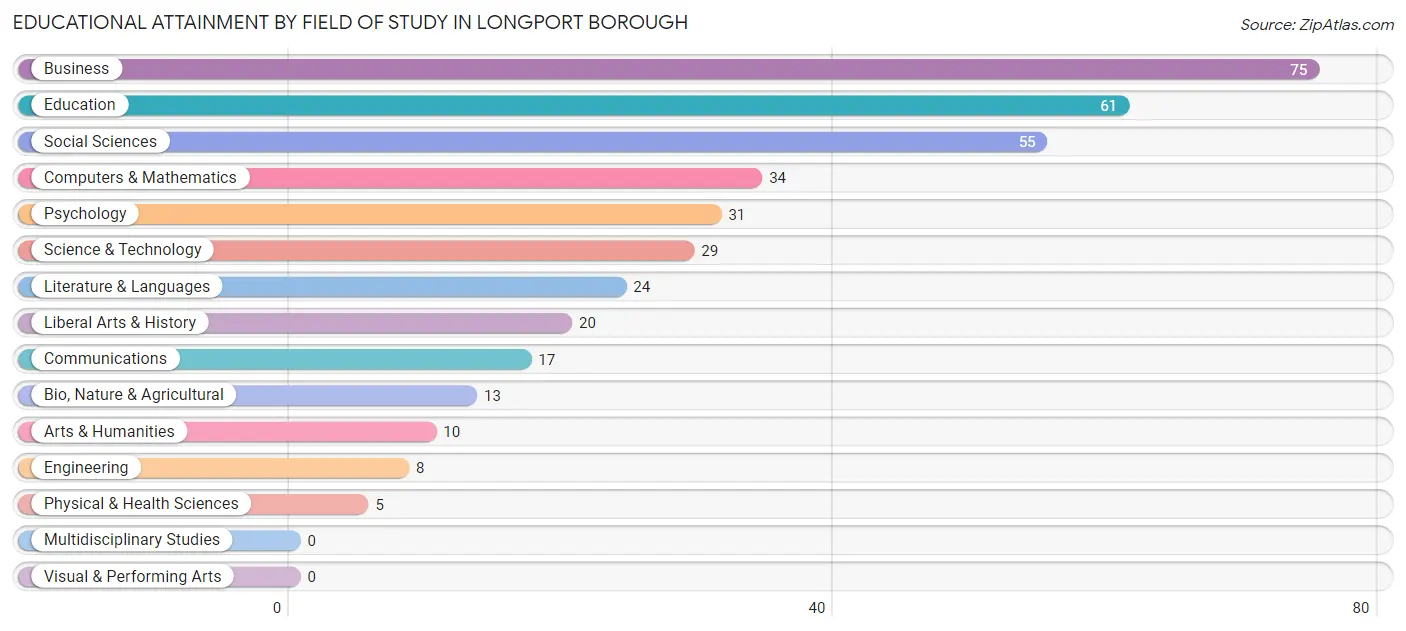
| Field of Study | # Graduates | % Graduates |
| Computers & Mathematics | 34 | 8.9% |
| Bio, Nature & Agricultural | 13 | 3.4% |
| Physical & Health Sciences | 5 | 1.3% |
| Psychology | 31 | 8.1% |
| Social Sciences | 55 | 14.4% |
| Engineering | 8 | 2.1% |
| Multidisciplinary Studies | 0 | 0.0% |
| Science & Technology | 29 | 7.6% |
| Business | 75 | 19.6% |
| Education | 61 | 16.0% |
| Literature & Languages | 24 | 6.3% |
| Liberal Arts & History | 20 | 5.2% |
| Visual & Performing Arts | 0 | 0.0% |
| Communications | 17 | 4.4% |
| Arts & Humanities | 10 | 2.6% |
| Total | 382 | 100.0% |
Transportation & Commute in Longport borough
Vehicle Availability by Sex in Longport borough
The most prevalent vehicle ownership categories in Longport borough are males with 2 vehicles (85, accounting for 51.8%) and females with 2 vehicles (71, making up 87.6%).
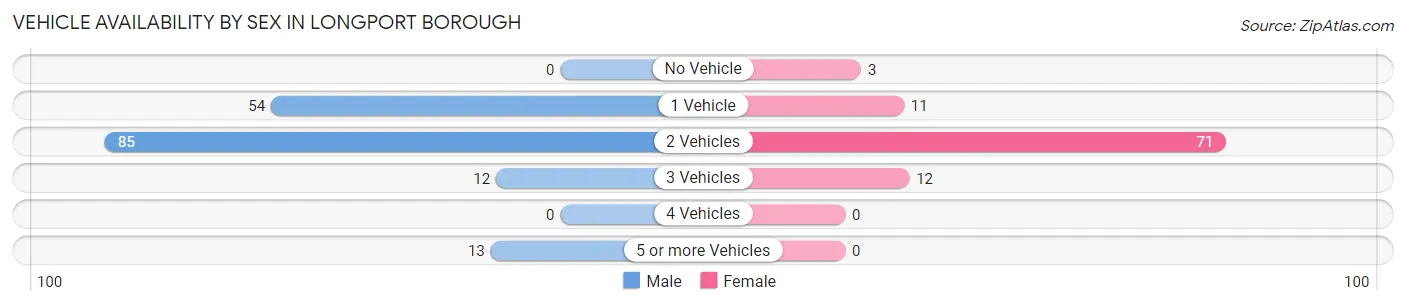
| Vehicles Available | Male | Female |
| No Vehicle | 0 (0.0%) | 3 (3.1%) |
| 1 Vehicle | 54 (32.9%) | 11 (11.3%) |
| 2 Vehicles | 85 (51.8%) | 71 (73.2%) |
| 3 Vehicles | 12 (7.3%) | 12 (12.4%) |
| 4 Vehicles | 0 (0.0%) | 0 (0.0%) |
| 5 or more Vehicles | 13 (7.9%) | 0 (0.0%) |
| Total | 164 (100.0%) | 97 (100.0%) |
Commute Time in Longport borough
The most frequently occuring commute durations in Longport borough are 5 to 9 minutes (59 commuters, 28.1%), 15 to 19 minutes (29 commuters, 13.8%), and 90 or more minutes (27 commuters, 12.9%).
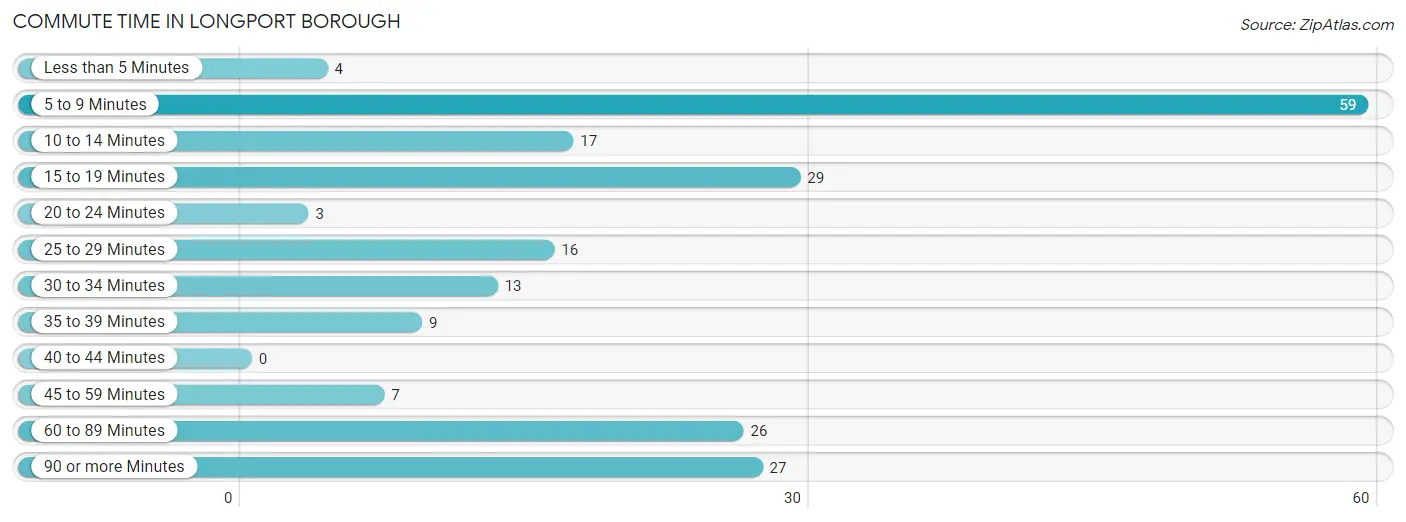
| Commute Time | # Commuters | % Commuters |
| Less than 5 Minutes | 4 | 1.9% |
| 5 to 9 Minutes | 59 | 28.1% |
| 10 to 14 Minutes | 17 | 8.1% |
| 15 to 19 Minutes | 29 | 13.8% |
| 20 to 24 Minutes | 3 | 1.4% |
| 25 to 29 Minutes | 16 | 7.6% |
| 30 to 34 Minutes | 13 | 6.2% |
| 35 to 39 Minutes | 9 | 4.3% |
| 40 to 44 Minutes | 0 | 0.0% |
| 45 to 59 Minutes | 7 | 3.3% |
| 60 to 89 Minutes | 26 | 12.4% |
| 90 or more Minutes | 27 | 12.9% |
Commute Time by Sex in Longport borough
The most common commute times in Longport borough are 5 to 9 minutes (36 commuters, 25.7%) for males and 5 to 9 minutes (23 commuters, 32.9%) for females.
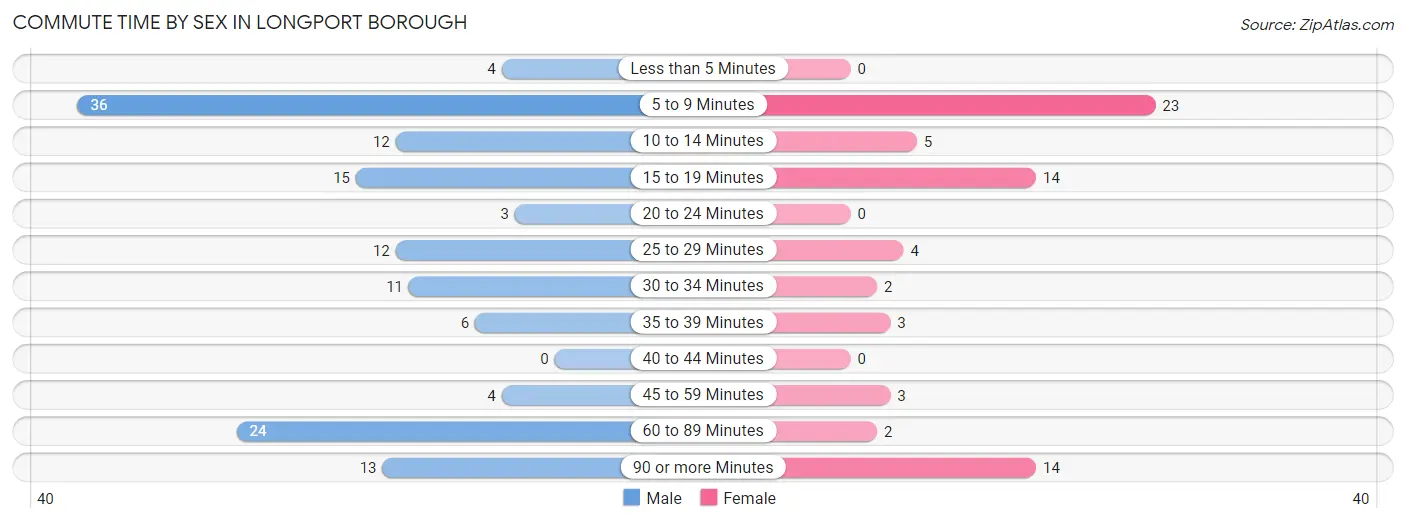
| Commute Time | Male | Female |
| Less than 5 Minutes | 4 (2.9%) | 0 (0.0%) |
| 5 to 9 Minutes | 36 (25.7%) | 23 (32.9%) |
| 10 to 14 Minutes | 12 (8.6%) | 5 (7.1%) |
| 15 to 19 Minutes | 15 (10.7%) | 14 (20.0%) |
| 20 to 24 Minutes | 3 (2.1%) | 0 (0.0%) |
| 25 to 29 Minutes | 12 (8.6%) | 4 (5.7%) |
| 30 to 34 Minutes | 11 (7.9%) | 2 (2.9%) |
| 35 to 39 Minutes | 6 (4.3%) | 3 (4.3%) |
| 40 to 44 Minutes | 0 (0.0%) | 0 (0.0%) |
| 45 to 59 Minutes | 4 (2.9%) | 3 (4.3%) |
| 60 to 89 Minutes | 24 (17.1%) | 2 (2.9%) |
| 90 or more Minutes | 13 (9.3%) | 14 (20.0%) |
Time of Departure to Work by Sex in Longport borough
The most frequent times of departure to work in Longport borough are 8:00 AM to 8:29 AM (26, 18.6%) for males and 7:00 AM to 7:29 AM (15, 21.4%) for females.
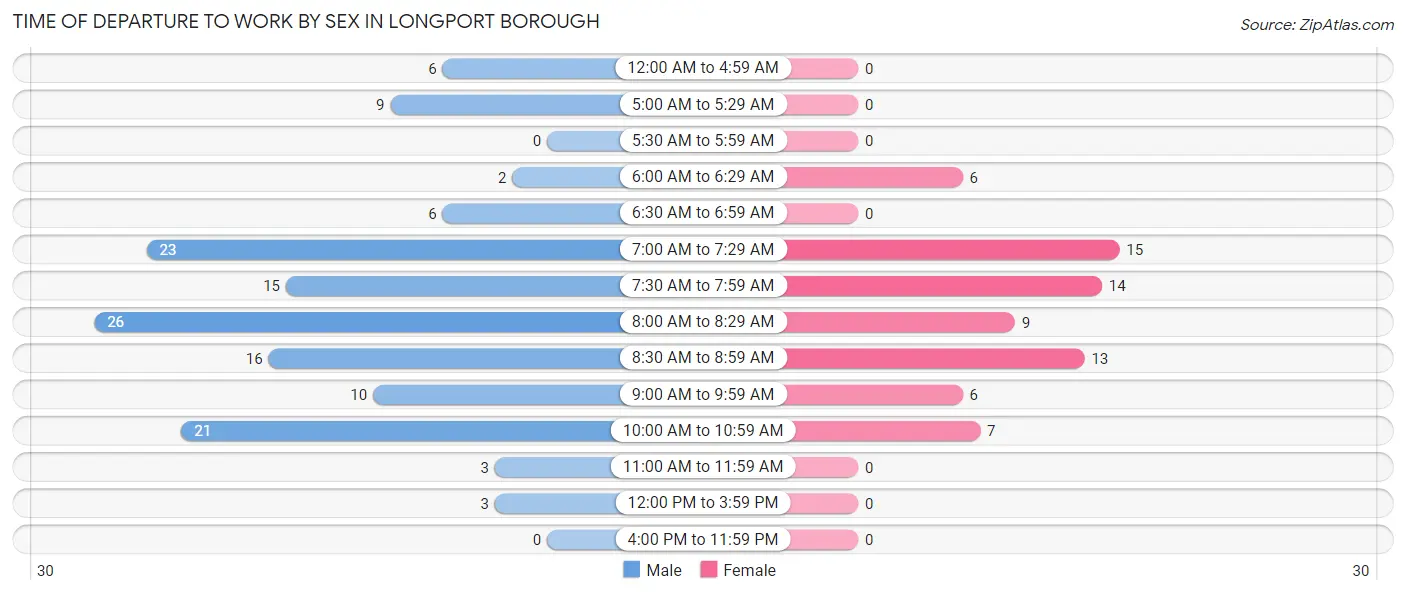
| Time of Departure | Male | Female |
| 12:00 AM to 4:59 AM | 6 (4.3%) | 0 (0.0%) |
| 5:00 AM to 5:29 AM | 9 (6.4%) | 0 (0.0%) |
| 5:30 AM to 5:59 AM | 0 (0.0%) | 0 (0.0%) |
| 6:00 AM to 6:29 AM | 2 (1.4%) | 6 (8.6%) |
| 6:30 AM to 6:59 AM | 6 (4.3%) | 0 (0.0%) |
| 7:00 AM to 7:29 AM | 23 (16.4%) | 15 (21.4%) |
| 7:30 AM to 7:59 AM | 15 (10.7%) | 14 (20.0%) |
| 8:00 AM to 8:29 AM | 26 (18.6%) | 9 (12.9%) |
| 8:30 AM to 8:59 AM | 16 (11.4%) | 13 (18.6%) |
| 9:00 AM to 9:59 AM | 10 (7.1%) | 6 (8.6%) |
| 10:00 AM to 10:59 AM | 21 (15.0%) | 7 (10.0%) |
| 11:00 AM to 11:59 AM | 3 (2.1%) | 0 (0.0%) |
| 12:00 PM to 3:59 PM | 3 (2.1%) | 0 (0.0%) |
| 4:00 PM to 11:59 PM | 0 (0.0%) | 0 (0.0%) |
| Total | 140 (100.0%) | 70 (100.0%) |
Housing Occupancy in Longport borough
Occupancy by Ownership in Longport borough
Of the total 436 dwellings in Longport borough, owner-occupied units account for 394 (90.4%), while renter-occupied units make up 42 (9.6%).
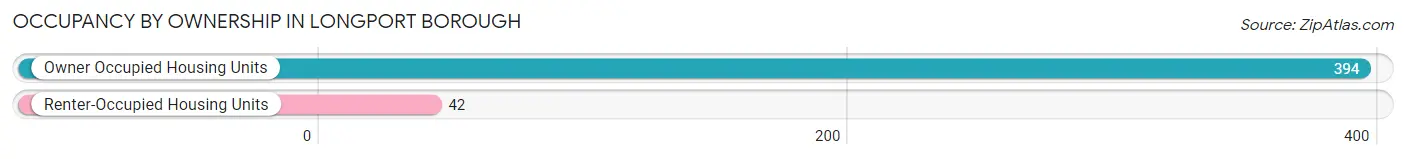
| Occupancy | # Housing Units | % Housing Units |
| Owner Occupied Housing Units | 394 | 90.4% |
| Renter-Occupied Housing Units | 42 | 9.6% |
| Total Occupied Housing Units | 436 | 100.0% |
Occupancy by Household Size in Longport borough
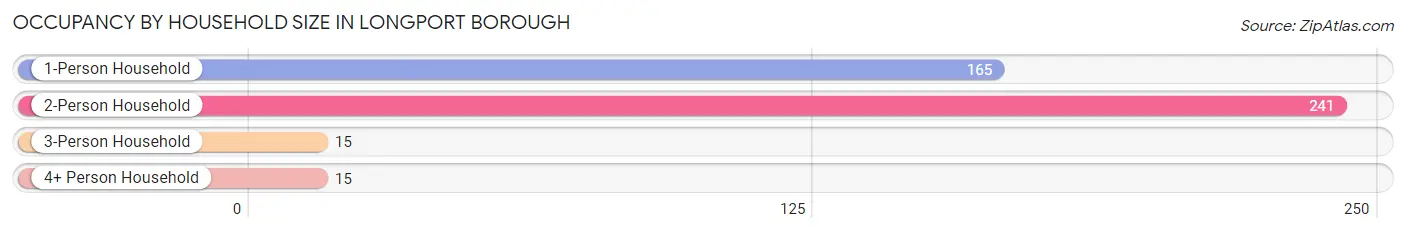
| Household Size | # Housing Units | % Housing Units |
| 1-Person Household | 165 | 37.8% |
| 2-Person Household | 241 | 55.3% |
| 3-Person Household | 15 | 3.4% |
| 4+ Person Household | 15 | 3.4% |
| Total Housing Units | 436 | 100.0% |
Occupancy by Ownership by Household Size in Longport borough
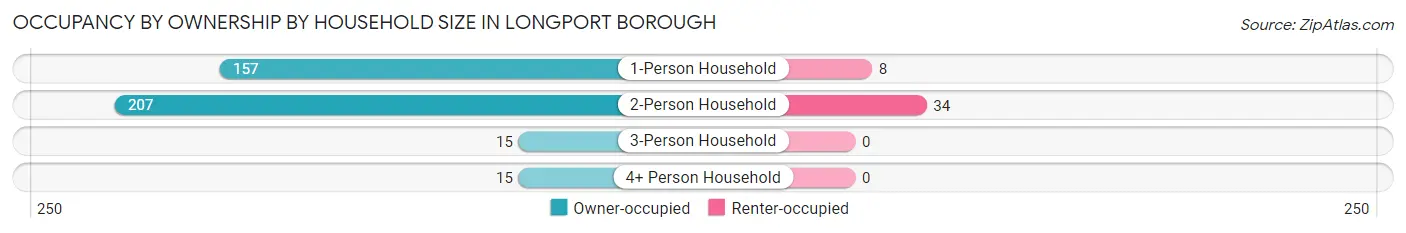
| Household Size | Owner-occupied | Renter-occupied |
| 1-Person Household | 157 (95.2%) | 8 (4.9%) |
| 2-Person Household | 207 (85.9%) | 34 (14.1%) |
| 3-Person Household | 15 (100.0%) | 0 (0.0%) |
| 4+ Person Household | 15 (100.0%) | 0 (0.0%) |
| Total Housing Units | 394 (90.4%) | 42 (9.6%) |
Occupancy by Educational Attainment in Longport borough
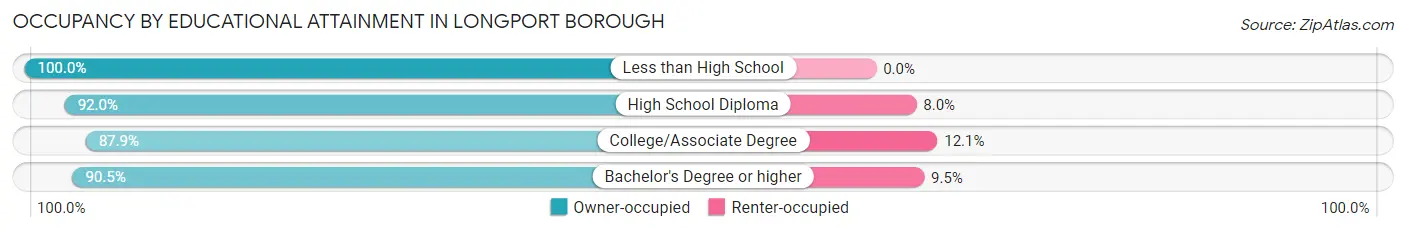
| Household Size | Owner-occupied | Renter-occupied |
| Less than High School | 3 (100.0%) | 0 (0.0%) |
| High School Diploma | 104 (92.0%) | 9 (8.0%) |
| College/Associate Degree | 87 (87.9%) | 12 (12.1%) |
| Bachelor's Degree or higher | 200 (90.5%) | 21 (9.5%) |
Occupancy by Age of Householder in Longport borough
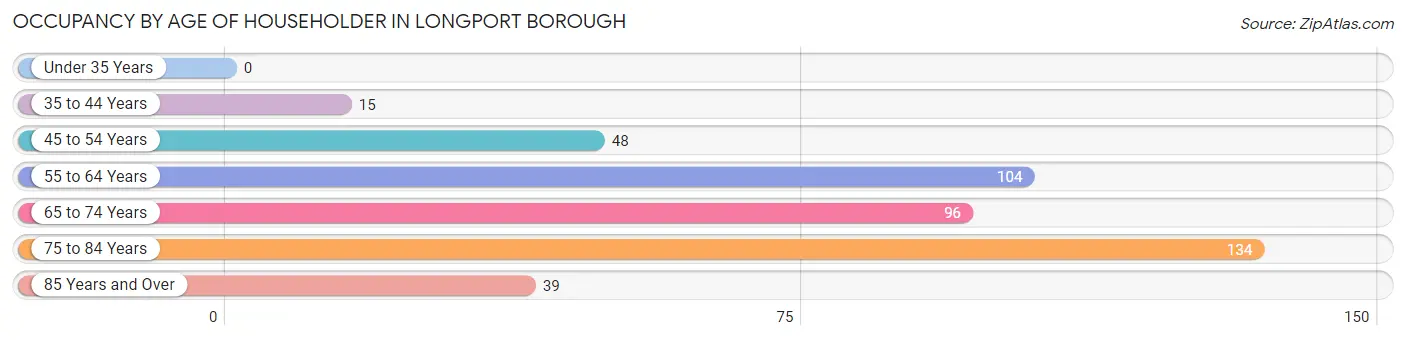
| Age Bracket | # Households | % Households |
| Under 35 Years | 0 | 0.0% |
| 35 to 44 Years | 15 | 3.4% |
| 45 to 54 Years | 48 | 11.0% |
| 55 to 64 Years | 104 | 23.8% |
| 65 to 74 Years | 96 | 22.0% |
| 75 to 84 Years | 134 | 30.7% |
| 85 Years and Over | 39 | 8.9% |
| Total | 436 | 100.0% |
Housing Finances in Longport borough
Median Income by Occupancy in Longport borough
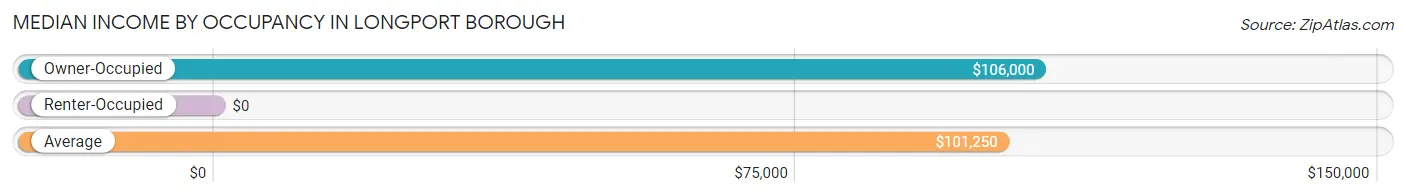
| Occupancy Type | # Households | Median Income |
| Owner-Occupied | 394 (90.4%) | $106,000 |
| Renter-Occupied | 42 (9.6%) | $0 |
| Average | 436 (100.0%) | $101,250 |
Occupancy by Householder Income Bracket in Longport borough
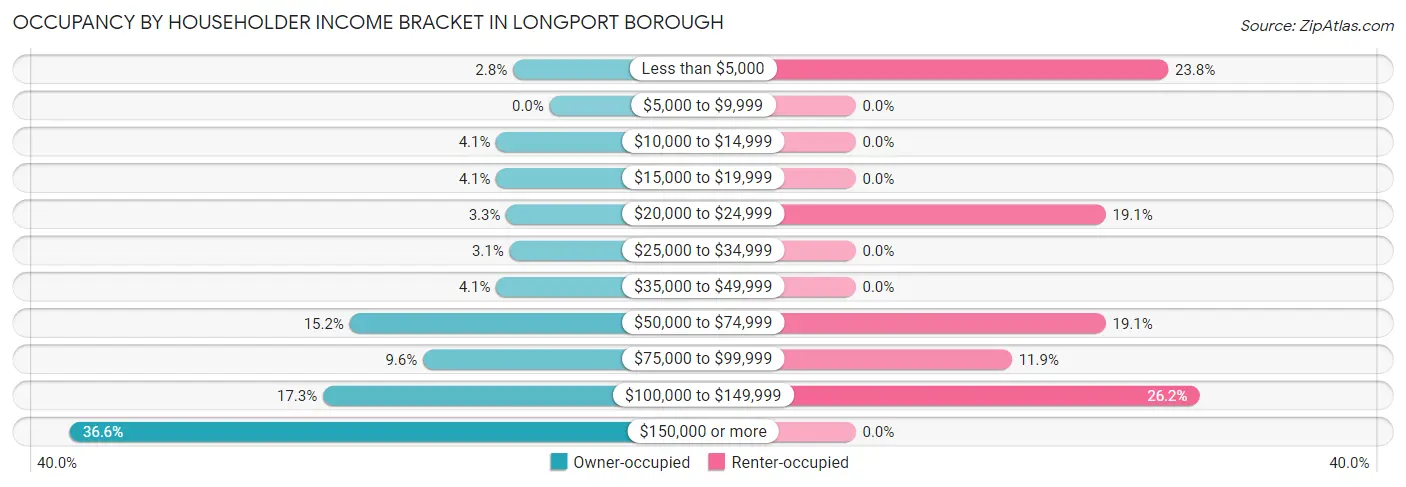
| Income Bracket | Owner-occupied | Renter-occupied |
| Less than $5,000 | 11 (2.8%) | 10 (23.8%) |
| $5,000 to $9,999 | 0 (0.0%) | 0 (0.0%) |
| $10,000 to $14,999 | 16 (4.1%) | 0 (0.0%) |
| $15,000 to $19,999 | 16 (4.1%) | 0 (0.0%) |
| $20,000 to $24,999 | 13 (3.3%) | 8 (19.1%) |
| $25,000 to $34,999 | 12 (3.0%) | 0 (0.0%) |
| $35,000 to $49,999 | 16 (4.1%) | 0 (0.0%) |
| $50,000 to $74,999 | 60 (15.2%) | 8 (19.1%) |
| $75,000 to $99,999 | 38 (9.6%) | 5 (11.9%) |
| $100,000 to $149,999 | 68 (17.3%) | 11 (26.2%) |
| $150,000 or more | 144 (36.5%) | 0 (0.0%) |
| Total | 394 (100.0%) | 42 (100.0%) |
Monthly Housing Cost Tiers in Longport borough
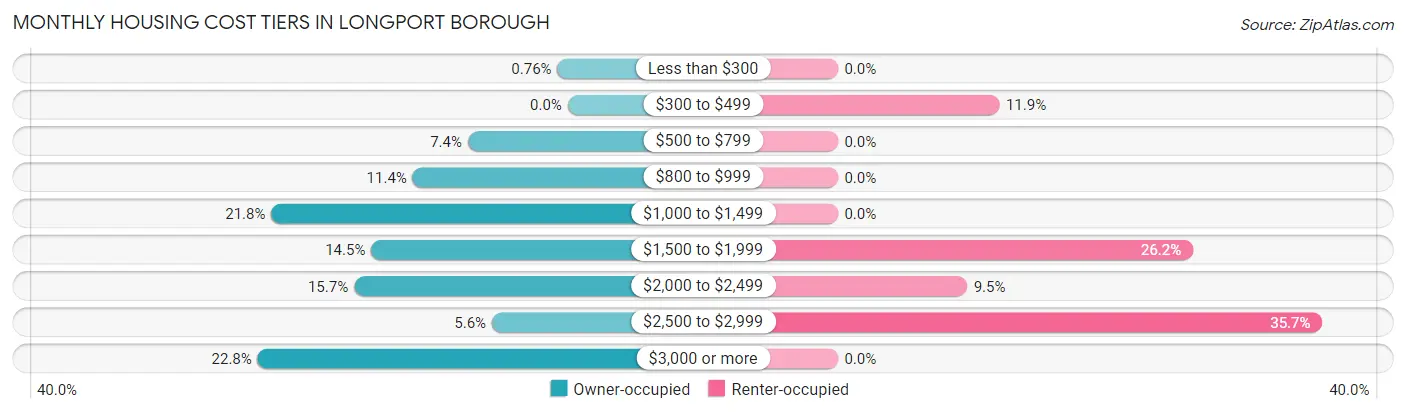
| Monthly Cost | Owner-occupied | Renter-occupied |
| Less than $300 | 3 (0.8%) | 0 (0.0%) |
| $300 to $499 | 0 (0.0%) | 5 (11.9%) |
| $500 to $799 | 29 (7.4%) | 0 (0.0%) |
| $800 to $999 | 45 (11.4%) | 0 (0.0%) |
| $1,000 to $1,499 | 86 (21.8%) | 0 (0.0%) |
| $1,500 to $1,999 | 57 (14.5%) | 11 (26.2%) |
| $2,000 to $2,499 | 62 (15.7%) | 4 (9.5%) |
| $2,500 to $2,999 | 22 (5.6%) | 15 (35.7%) |
| $3,000 or more | 90 (22.8%) | 0 (0.0%) |
| Total | 394 (100.0%) | 42 (100.0%) |
Physical Housing Characteristics in Longport borough
Housing Structures in Longport borough
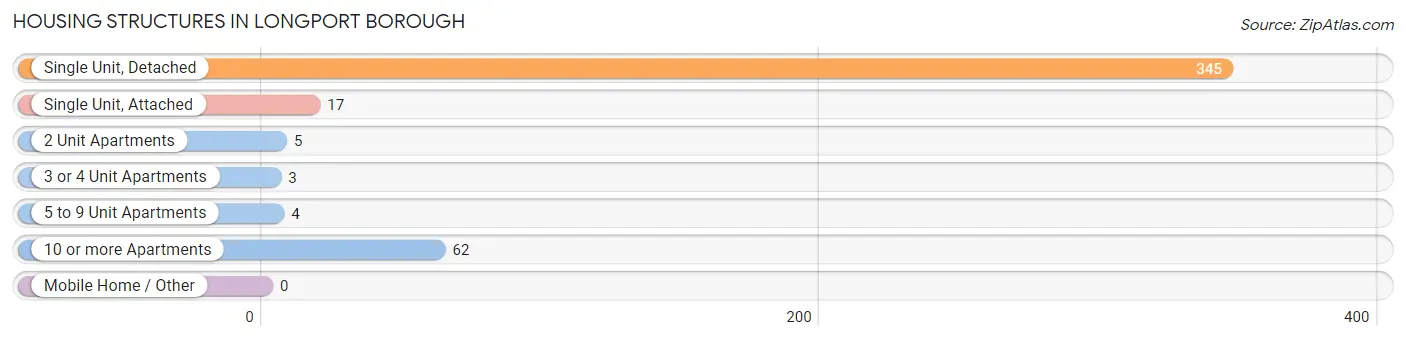
| Structure Type | # Housing Units | % Housing Units |
| Single Unit, Detached | 345 | 79.1% |
| Single Unit, Attached | 17 | 3.9% |
| 2 Unit Apartments | 5 | 1.1% |
| 3 or 4 Unit Apartments | 3 | 0.7% |
| 5 to 9 Unit Apartments | 4 | 0.9% |
| 10 or more Apartments | 62 | 14.2% |
| Mobile Home / Other | 0 | 0.0% |
| Total | 436 | 100.0% |
Housing Structures by Occupancy in Longport borough
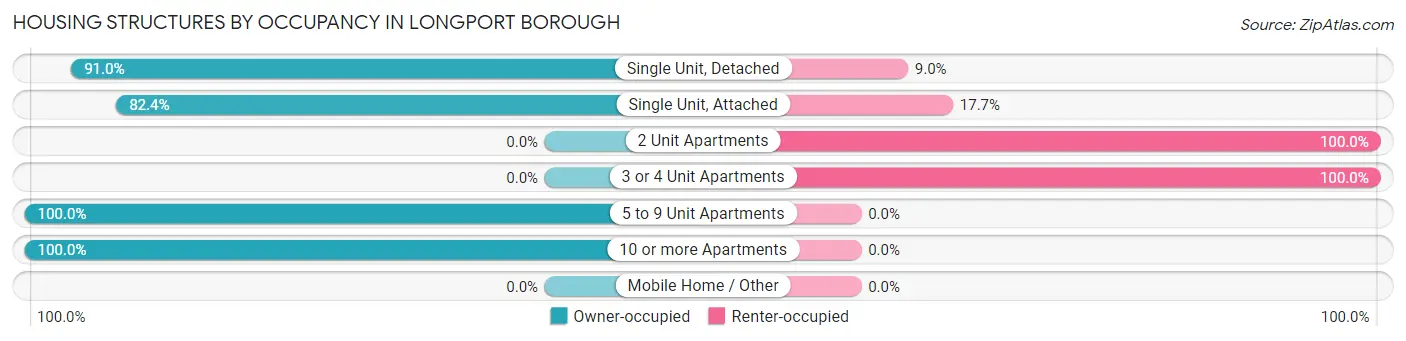
| Structure Type | Owner-occupied | Renter-occupied |
| Single Unit, Detached | 314 (91.0%) | 31 (9.0%) |
| Single Unit, Attached | 14 (82.4%) | 3 (17.6%) |
| 2 Unit Apartments | 0 (0.0%) | 5 (100.0%) |
| 3 or 4 Unit Apartments | 0 (0.0%) | 3 (100.0%) |
| 5 to 9 Unit Apartments | 4 (100.0%) | 0 (0.0%) |
| 10 or more Apartments | 62 (100.0%) | 0 (0.0%) |
| Mobile Home / Other | 0 (0.0%) | 0 (0.0%) |
| Total | 394 (90.4%) | 42 (9.6%) |
Housing Structures by Number of Rooms in Longport borough
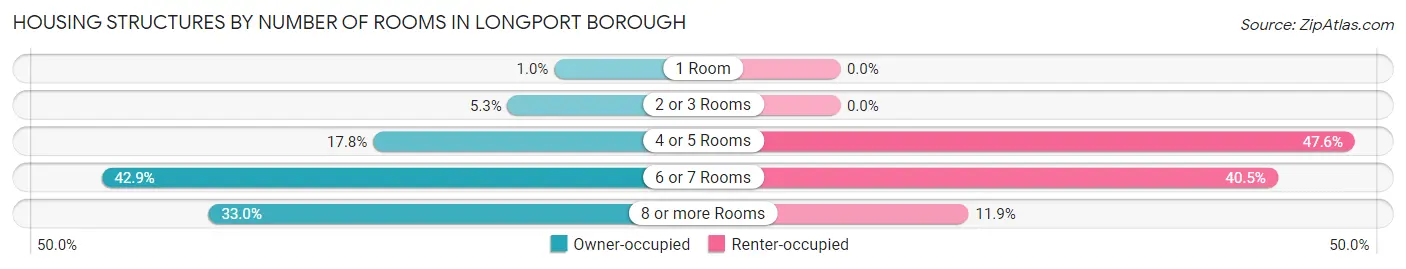
| Number of Rooms | Owner-occupied | Renter-occupied |
| 1 Room | 4 (1.0%) | 0 (0.0%) |
| 2 or 3 Rooms | 21 (5.3%) | 0 (0.0%) |
| 4 or 5 Rooms | 70 (17.8%) | 20 (47.6%) |
| 6 or 7 Rooms | 169 (42.9%) | 17 (40.5%) |
| 8 or more Rooms | 130 (33.0%) | 5 (11.9%) |
| Total | 394 (100.0%) | 42 (100.0%) |
Housing Structure by Heating Type in Longport borough
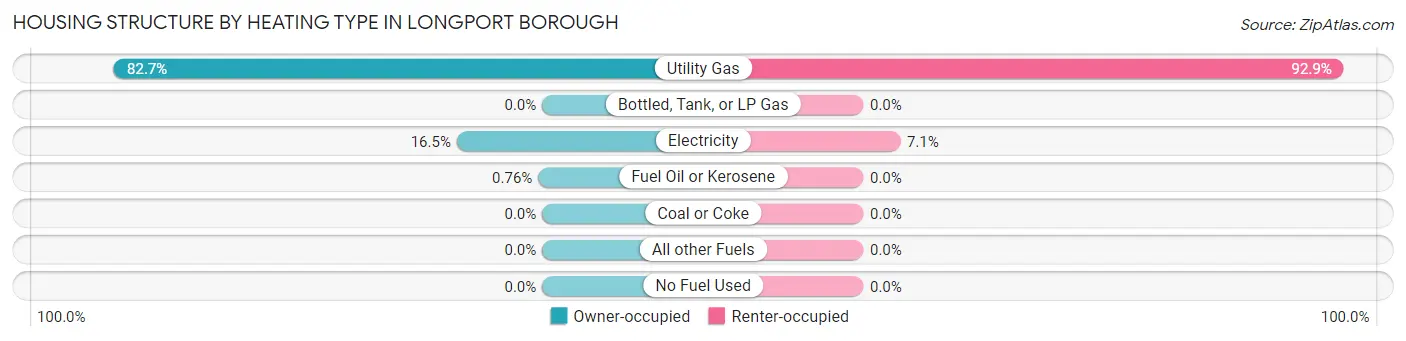
| Heating Type | Owner-occupied | Renter-occupied |
| Utility Gas | 326 (82.7%) | 39 (92.9%) |
| Bottled, Tank, or LP Gas | 0 (0.0%) | 0 (0.0%) |
| Electricity | 65 (16.5%) | 3 (7.1%) |
| Fuel Oil or Kerosene | 3 (0.8%) | 0 (0.0%) |
| Coal or Coke | 0 (0.0%) | 0 (0.0%) |
| All other Fuels | 0 (0.0%) | 0 (0.0%) |
| No Fuel Used | 0 (0.0%) | 0 (0.0%) |
| Total | 394 (100.0%) | 42 (100.0%) |
Household Vehicle Usage in Longport borough
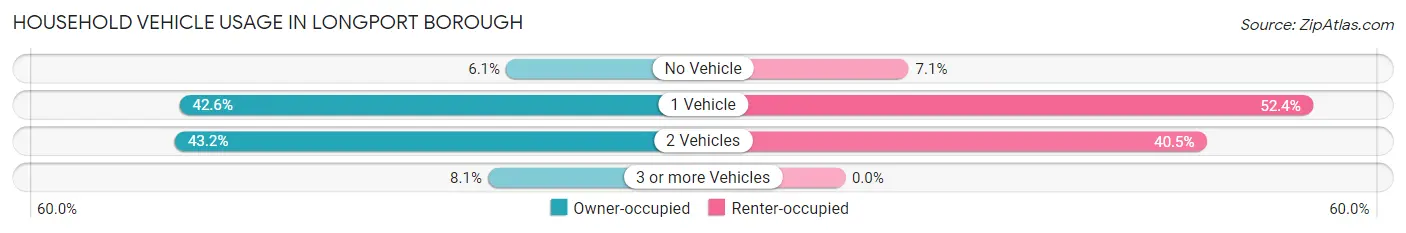
| Vehicles per Household | Owner-occupied | Renter-occupied |
| No Vehicle | 24 (6.1%) | 3 (7.1%) |
| 1 Vehicle | 168 (42.6%) | 22 (52.4%) |
| 2 Vehicles | 170 (43.1%) | 17 (40.5%) |
| 3 or more Vehicles | 32 (8.1%) | 0 (0.0%) |
| Total | 394 (100.0%) | 42 (100.0%) |
Real Estate & Mortgages in Longport borough
Real Estate and Mortgage Overview in Longport borough
| Characteristic | Without Mortgage | With Mortgage |
| Housing Units | 256 | 138 |
| Median Property Value | $940,500 | $1,112,900 |
| Median Household Income | $85,833 | $84 |
| Monthly Housing Costs | $1,294 | $81 |
| Real Estate Taxes | $7,384 | $3 |
Property Value by Mortgage Status in Longport borough
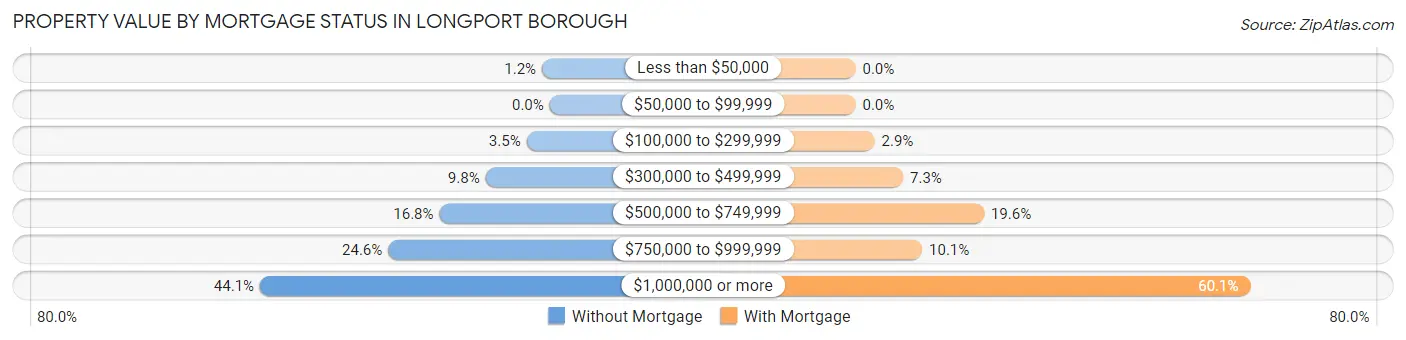
| Property Value | Without Mortgage | With Mortgage |
| Less than $50,000 | 3 (1.2%) | 0 (0.0%) |
| $50,000 to $99,999 | 0 (0.0%) | 0 (0.0%) |
| $100,000 to $299,999 | 9 (3.5%) | 4 (2.9%) |
| $300,000 to $499,999 | 25 (9.8%) | 10 (7.2%) |
| $500,000 to $749,999 | 43 (16.8%) | 27 (19.6%) |
| $750,000 to $999,999 | 63 (24.6%) | 14 (10.1%) |
| $1,000,000 or more | 113 (44.1%) | 83 (60.1%) |
| Total | 256 (100.0%) | 138 (100.0%) |
Household Income by Mortgage Status in Longport borough
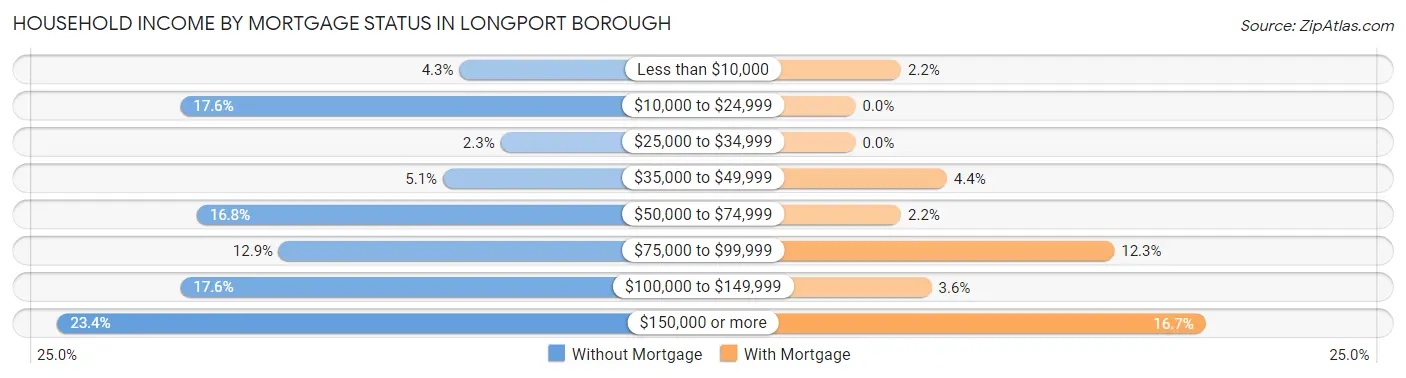
| Household Income | Without Mortgage | With Mortgage |
| Less than $10,000 | 11 (4.3%) | 3 (2.2%) |
| $10,000 to $24,999 | 45 (17.6%) | 0 (0.0%) |
| $25,000 to $34,999 | 6 (2.3%) | 0 (0.0%) |
| $35,000 to $49,999 | 13 (5.1%) | 6 (4.3%) |
| $50,000 to $74,999 | 43 (16.8%) | 3 (2.2%) |
| $75,000 to $99,999 | 33 (12.9%) | 17 (12.3%) |
| $100,000 to $149,999 | 45 (17.6%) | 5 (3.6%) |
| $150,000 or more | 60 (23.4%) | 23 (16.7%) |
| Total | 256 (100.0%) | 138 (100.0%) |
Property Value to Household Income Ratio in Longport borough
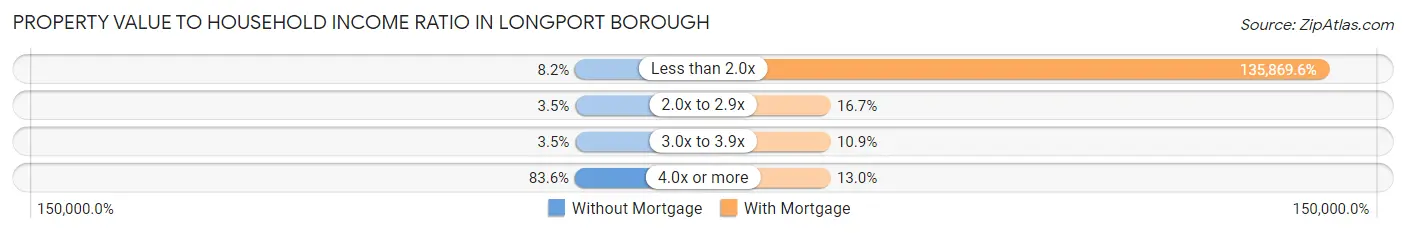
| Value-to-Income Ratio | Without Mortgage | With Mortgage |
| Less than 2.0x | 21 (8.2%) | 187,500 (135,869.6%) |
| 2.0x to 2.9x | 9 (3.5%) | 23 (16.7%) |
| 3.0x to 3.9x | 9 (3.5%) | 15 (10.9%) |
| 4.0x or more | 214 (83.6%) | 18 (13.0%) |
| Total | 256 (100.0%) | 138 (100.0%) |
Real Estate Taxes by Mortgage Status in Longport borough
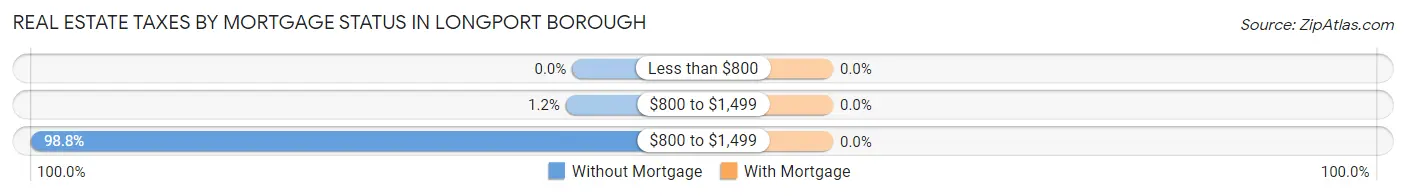
| Property Taxes | Without Mortgage | With Mortgage |
| Less than $800 | 0 (0.0%) | 0 (0.0%) |
| $800 to $1,499 | 3 (1.2%) | 0 (0.0%) |
| $800 to $1,499 | 253 (98.8%) | 0 (0.0%) |
| Total | 256 (100.0%) | 138 (100.0%) |
Health & Disability in Longport borough
Health Insurance Coverage by Age in Longport borough
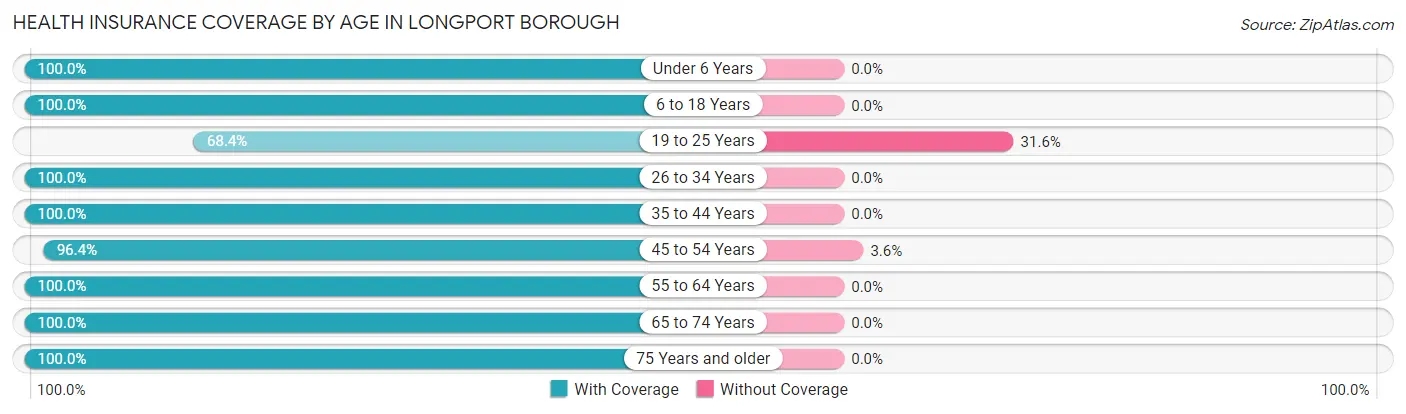
| Age Bracket | With Coverage | Without Coverage |
| Under 6 Years | 4 (100.0%) | 0 (0.0%) |
| 6 to 18 Years | 41 (100.0%) | 0 (0.0%) |
| 19 to 25 Years | 13 (68.4%) | 6 (31.6%) |
| 26 to 34 Years | 10 (100.0%) | 0 (0.0%) |
| 35 to 44 Years | 27 (100.0%) | 0 (0.0%) |
| 45 to 54 Years | 81 (96.4%) | 3 (3.6%) |
| 55 to 64 Years | 170 (100.0%) | 0 (0.0%) |
| 65 to 74 Years | 176 (100.0%) | 0 (0.0%) |
| 75 Years and older | 245 (100.0%) | 0 (0.0%) |
| Total | 767 (98.8%) | 9 (1.2%) |
Health Insurance Coverage by Citizenship Status in Longport borough

| Citizenship Status | With Coverage | Without Coverage |
| Native Born | 4 (100.0%) | 0 (0.0%) |
| Foreign Born, Citizen | 41 (100.0%) | 0 (0.0%) |
| Foreign Born, not a Citizen | 13 (68.4%) | 6 (31.6%) |
Health Insurance Coverage by Household Income in Longport borough
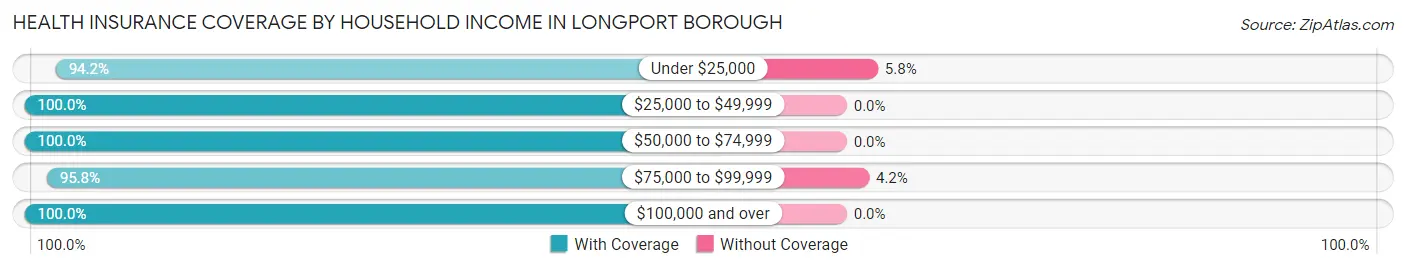
| Household Income | With Coverage | Without Coverage |
| Under $25,000 | 97 (94.2%) | 6 (5.8%) |
| $25,000 to $49,999 | 41 (100.0%) | 0 (0.0%) |
| $50,000 to $74,999 | 96 (100.0%) | 0 (0.0%) |
| $75,000 to $99,999 | 69 (95.8%) | 3 (4.2%) |
| $100,000 and over | 464 (100.0%) | 0 (0.0%) |
Public vs Private Health Insurance Coverage by Age in Longport borough
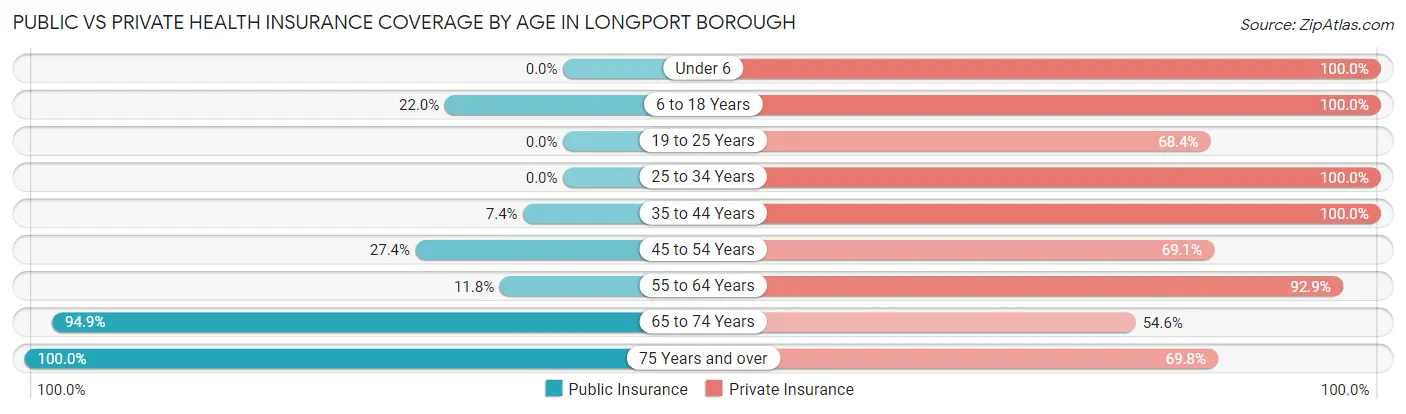
| Age Bracket | Public Insurance | Private Insurance |
| Under 6 | 0 (0.0%) | 4 (100.0%) |
| 6 to 18 Years | 9 (22.0%) | 41 (100.0%) |
| 19 to 25 Years | 0 (0.0%) | 13 (68.4%) |
| 25 to 34 Years | 0 (0.0%) | 10 (100.0%) |
| 35 to 44 Years | 2 (7.4%) | 27 (100.0%) |
| 45 to 54 Years | 23 (27.4%) | 58 (69.1%) |
| 55 to 64 Years | 20 (11.8%) | 158 (92.9%) |
| 65 to 74 Years | 167 (94.9%) | 96 (54.5%) |
| 75 Years and over | 245 (100.0%) | 171 (69.8%) |
| Total | 466 (60.1%) | 578 (74.5%) |
Disability Status by Sex by Age in Longport borough
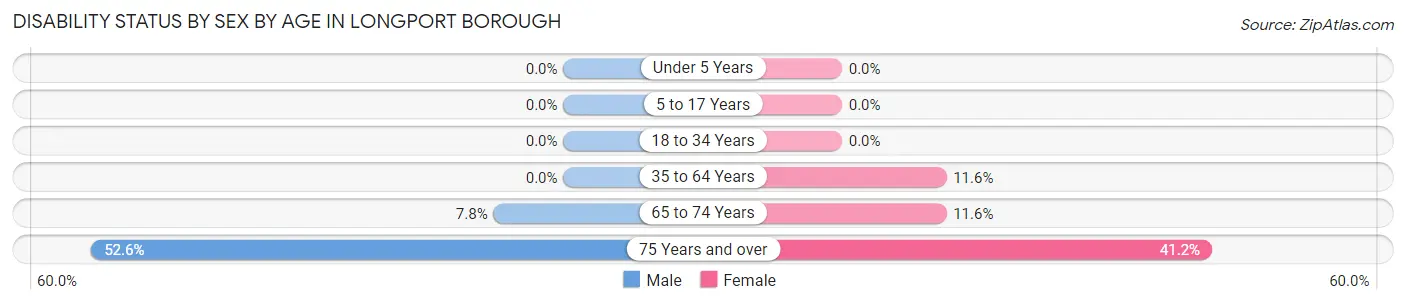
| Age Bracket | Male | Female |
| Under 5 Years | 0 (0.0%) | 0 (0.0%) |
| 5 to 17 Years | 0 (0.0%) | 0 (0.0%) |
| 18 to 34 Years | 0 (0.0%) | 0 (0.0%) |
| 35 to 64 Years | 0 (0.0%) | 20 (11.6%) |
| 65 to 74 Years | 7 (7.8%) | 10 (11.6%) |
| 75 Years and over | 51 (52.6%) | 61 (41.2%) |
Disability Class by Sex by Age in Longport borough
Disability Class: Hearing Difficulty
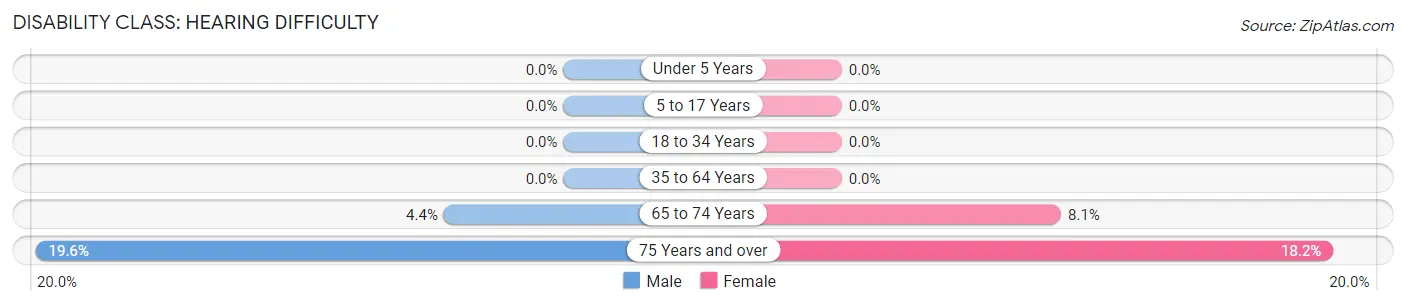
| Age Bracket | Male | Female |
| Under 5 Years | 0 (0.0%) | 0 (0.0%) |
| 5 to 17 Years | 0 (0.0%) | 0 (0.0%) |
| 18 to 34 Years | 0 (0.0%) | 0 (0.0%) |
| 35 to 64 Years | 0 (0.0%) | 0 (0.0%) |
| 65 to 74 Years | 4 (4.4%) | 7 (8.1%) |
| 75 Years and over | 19 (19.6%) | 27 (18.2%) |
Disability Class: Vision Difficulty
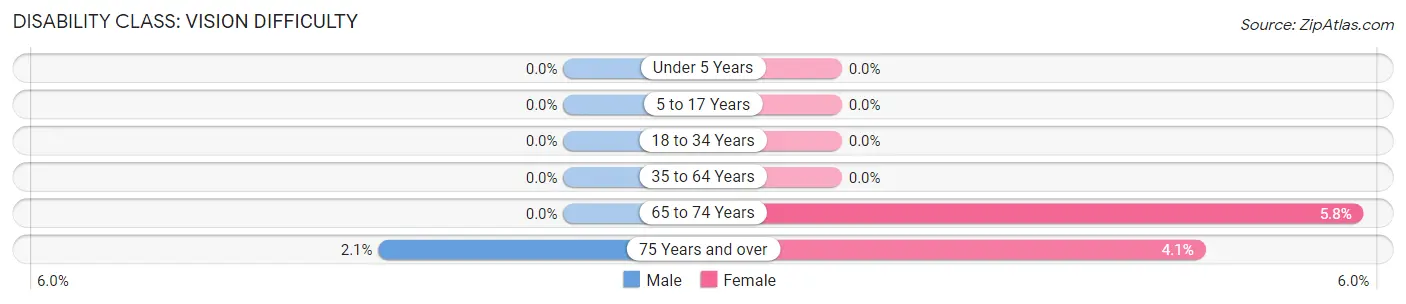
| Age Bracket | Male | Female |
| Under 5 Years | 0 (0.0%) | 0 (0.0%) |
| 5 to 17 Years | 0 (0.0%) | 0 (0.0%) |
| 18 to 34 Years | 0 (0.0%) | 0 (0.0%) |
| 35 to 64 Years | 0 (0.0%) | 0 (0.0%) |
| 65 to 74 Years | 0 (0.0%) | 5 (5.8%) |
| 75 Years and over | 2 (2.1%) | 6 (4.1%) |
Disability Class: Cognitive Difficulty
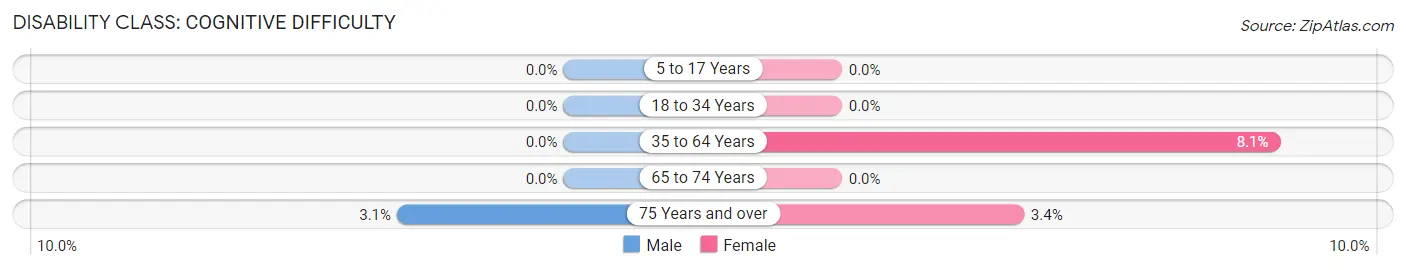
| Age Bracket | Male | Female |
| 5 to 17 Years | 0 (0.0%) | 0 (0.0%) |
| 18 to 34 Years | 0 (0.0%) | 0 (0.0%) |
| 35 to 64 Years | 0 (0.0%) | 14 (8.1%) |
| 65 to 74 Years | 0 (0.0%) | 0 (0.0%) |
| 75 Years and over | 3 (3.1%) | 5 (3.4%) |
Disability Class: Ambulatory Difficulty
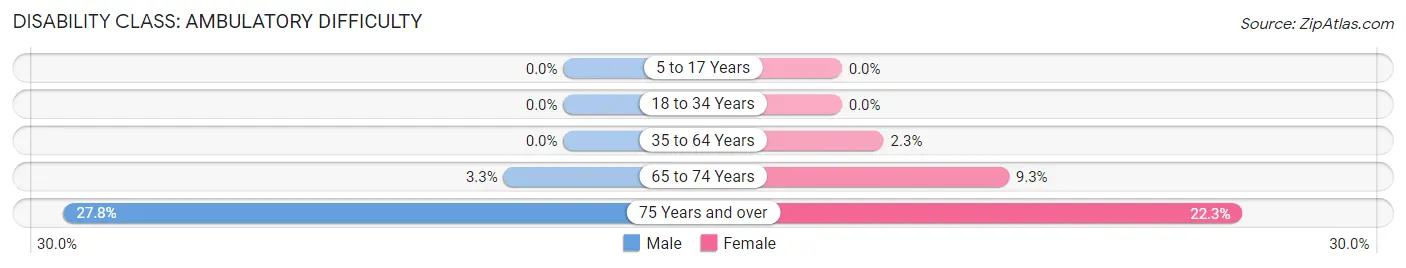
| Age Bracket | Male | Female |
| 5 to 17 Years | 0 (0.0%) | 0 (0.0%) |
| 18 to 34 Years | 0 (0.0%) | 0 (0.0%) |
| 35 to 64 Years | 0 (0.0%) | 4 (2.3%) |
| 65 to 74 Years | 3 (3.3%) | 8 (9.3%) |
| 75 Years and over | 27 (27.8%) | 33 (22.3%) |
Disability Class: Self-Care Difficulty
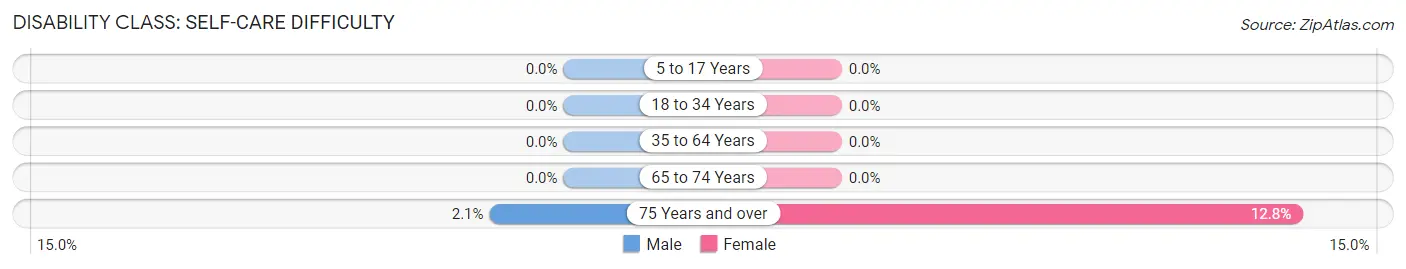
| Age Bracket | Male | Female |
| 5 to 17 Years | 0 (0.0%) | 0 (0.0%) |
| 18 to 34 Years | 0 (0.0%) | 0 (0.0%) |
| 35 to 64 Years | 0 (0.0%) | 0 (0.0%) |
| 65 to 74 Years | 0 (0.0%) | 0 (0.0%) |
| 75 Years and over | 2 (2.1%) | 19 (12.8%) |
Technology Access in Longport borough
Computing Device Access in Longport borough
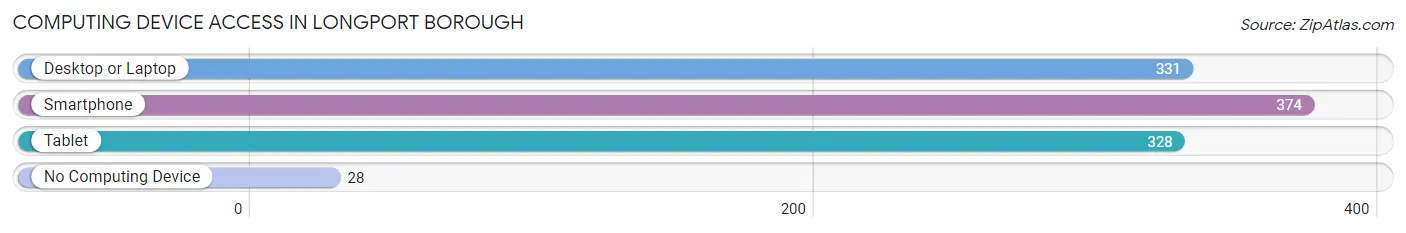
| Device Type | # Households | % Households |
| Desktop or Laptop | 331 | 75.9% |
| Smartphone | 374 | 85.8% |
| Tablet | 328 | 75.2% |
| No Computing Device | 28 | 6.4% |
| Total | 436 | 100.0% |
Internet Access in Longport borough
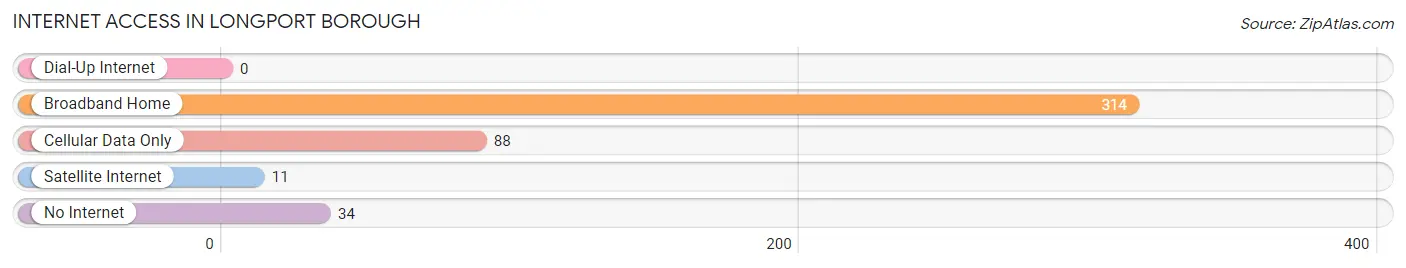
| Internet Type | # Households | % Households |
| Dial-Up Internet | 0 | 0.0% |
| Broadband Home | 314 | 72.0% |
| Cellular Data Only | 88 | 20.2% |
| Satellite Internet | 11 | 2.5% |
| No Internet | 34 | 7.8% |
| Total | 436 | 100.0% |
Longport borough Summary
Longport Borough is a small borough located in Atlantic County, New Jersey. It is situated on Absecon Island, which is bordered by the Atlantic Ocean to the east and the Great Egg Harbor Bay to the west. The borough is located just south of Atlantic City and is part of the Atlantic City Metropolitan Statistical Area. As of the 2010 United States Census, the borough had a total population of 831, making it the smallest municipality in Atlantic County.
Geography
Longport Borough is located at 39°20'25" North, 74°25'17" West (39.340278, -74.421389). According to the United States Census Bureau, the borough has a total area of 0.3 square miles (0.8 km2), all of which is land.
The borough is bordered by the Atlantic Ocean to the east, the Great Egg Harbor Bay to the west, and the City of Margate to the north. Longport is connected to the mainland by the Longport-Somers Point Bridge, which crosses the Great Egg Harbor Bay.
Demographics
As of the 2010 United States Census, there were 831 people, 431 households, and 229 families residing in the borough. The population density was 2,837.0 inhabitants per square mile (1,098.7/km2). There were 1,072 housing units at an average density of 3,566.7 per square mile (1,377.2/km2). The racial makeup of the borough was 97.2% White, 0.7% African American, 0.2% Native American, 0.7% Asian, 0.2% from other races, and 1.0% from two or more races. Hispanic or Latino of any race were 1.7% of the population.
There were 431 households, out of which 11.2% had children under the age of 18 living with them, 44.2% were married couples living together, 8.4% had a female householder with no husband present, and 44.2% were non-families. 38.2% of all households were made up of individuals, and 18.2% had someone living alone who was 65 years of age or older. The average household size was 1.93 and the average family size was 2.50.
In the borough, the population was spread out, with 10.2% under the age of 18, 4.2% from 18 to 24, 17.2% from 25 to 44, 36.2% from 45 to 64, and 32.2% who were 65 years of age or older. The median age was 57.2 years. For every 100 females, there were 91.2 males. For every 100 females age 18 and over, there were 88.2 males.
The median income for a household in the borough was $68,750, and the median income for a family was $90,000. Males had a median income of $60,000 versus $45,000 for females. The per capita income for the borough was $50,000. About 4.2% of families and 6.2% of the population were below the poverty line, including none of those under age 18 and 8.2% of those age 65 or over.
Economy
Longport Borough is a small, residential community with a limited commercial sector. The borough is home to a few small businesses, including a convenience store, a restaurant, and a few small shops. The majority of the borough's residents are employed in the nearby cities of Atlantic City and Ocean City.
The borough is also home to a number of recreational activities, including a beach, a marina, and a golf course. The Longport Beach and Boardwalk are popular attractions for visitors and locals alike.
Conclusion
Longport Borough is a small borough located in Atlantic County, New Jersey. It is situated on Absecon Island, which is bordered by the Atlantic Ocean to the east and the Great Egg Harbor Bay to the west. As of the 2010 United States Census, the borough had a total population of 831, making it the smallest municipality in Atlantic County. The borough is bordered by the Atlantic Ocean to the east, the Great Egg Harbor Bay to the west, and the City of Margate to the north. Longport is connected to the mainland by the Longport-Somers Point Bridge, which crosses the Great Egg Harbor Bay. The borough is a small, residential community with a limited commercial sector. The majority of the borough's residents are employed in the nearby cities of Atlantic City and Ocean City. The borough is also home to a number of recreational activities, including a beach, a marina, and a golf course.
Common Questions
What is Per Capita Income in Longport borough?
Per Capita income in Longport borough is $102,167.
What is the Median Family Income in Longport borough?
Median Family Income in Longport borough is $129,583.
What is the Median Household income in Longport borough?
Median Household Income in Longport borough is $101,250.
What is Income or Wage Gap in Longport borough?
Income or Wage Gap in Longport borough is 43.4%.
Women in Longport borough earn 56.6 cents for every dollar earned by a man.
What is Inequality or Gini Index in Longport borough?
Inequality or Gini Index in Longport borough is 0.58.
What is the Total Population of Longport borough?
Total Population of Longport borough is 776.
What is the Total Male Population of Longport borough?
Total Male Population of Longport borough is 342.
What is the Total Female Population of Longport borough?
Total Female Population of Longport borough is 434.
What is the Ratio of Males per 100 Females in Longport borough?
There are 78.80 Males per 100 Females in Longport borough.
What is the Ratio of Females per 100 Males in Longport borough?
There are 126.90 Females per 100 Males in Longport borough.
What is the Median Population Age in Longport borough?
Median Population Age in Longport borough is 66.4 Years.
What is the Average Family Size in Longport borough
Average Family Size in Longport borough is 2.3 People.
What is the Average Household Size in Longport borough
Average Household Size in Longport borough is 1.8 People.
How Large is the Labor Force in Longport borough?
There are 301 People in the Labor Forcein in Longport borough.
What is the Percentage of People in the Labor Force in Longport borough?
40.6% of People are in the Labor Force in Longport borough.
What is the Unemployment Rate in Longport borough?
Unemployment Rate in Longport borough is 8.6%.