Northvale borough, NJ Map & Demographics
Northvale borough Overview
$54,831
PER CAPITA INCOME
$127,206
AVG FAMILY INCOME
$120,278
AVG HOUSEHOLD INCOME
8.2%
WAGE / INCOME GAP [ % ]
91.8¢/ $1
WAGE / INCOME GAP [ $ ]
0.44
INEQUALITY / GINI INDEX
4,769
TOTAL POPULATION
2,531
MALE POPULATION
2,238
FEMALE POPULATION
113.09
MALES / 100 FEMALES
88.42
FEMALES / 100 MALES
42.4
MEDIAN AGE
3.1
AVG FAMILY SIZE
2.9
AVG HOUSEHOLD SIZE
2,394
LABOR FORCE [ PEOPLE ]
61.8%
PERCENT IN LABOR FORCE
4.1%
UNEMPLOYMENT RATE
Income in Northvale borough
Income Overview in Northvale borough
Per Capita Income in Northvale borough is $54,831, while median incomes of families and households are $127,206 and $120,278 respectively.
| Characteristic | Number | Measure |
| Per Capita Income | 4,769 | $54,831 |
| Median Family Income | 1,432 | $127,206 |
| Mean Family Income | 1,432 | $172,999 |
| Median Household Income | 1,626 | $120,278 |
| Mean Household Income | 1,626 | $161,216 |
| Income Deficit | 1,432 | $0 |
| Wage / Income Gap (%) | 4,769 | 8.18% |
| Wage / Income Gap ($) | 4,769 | 91.82¢ per $1 |
| Gini / Inequality Index | 4,769 | 0.44 |
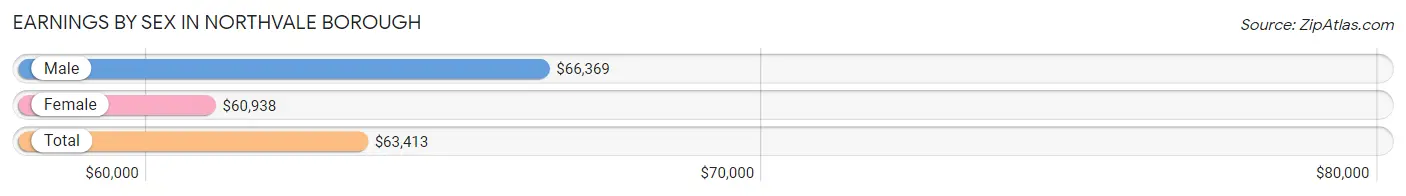
Earnings by Sex in Northvale borough
Average Earnings in Northvale borough are $63,413, $66,369 for men and $60,938 for women, a difference of 8.2%.
| Sex | Number | Average Earnings |
| Male | 1,483 (59.5%) | $66,369 |
| Female | 1,010 (40.5%) | $60,938 |
| Total | 2,493 (100.0%) | $63,413 |
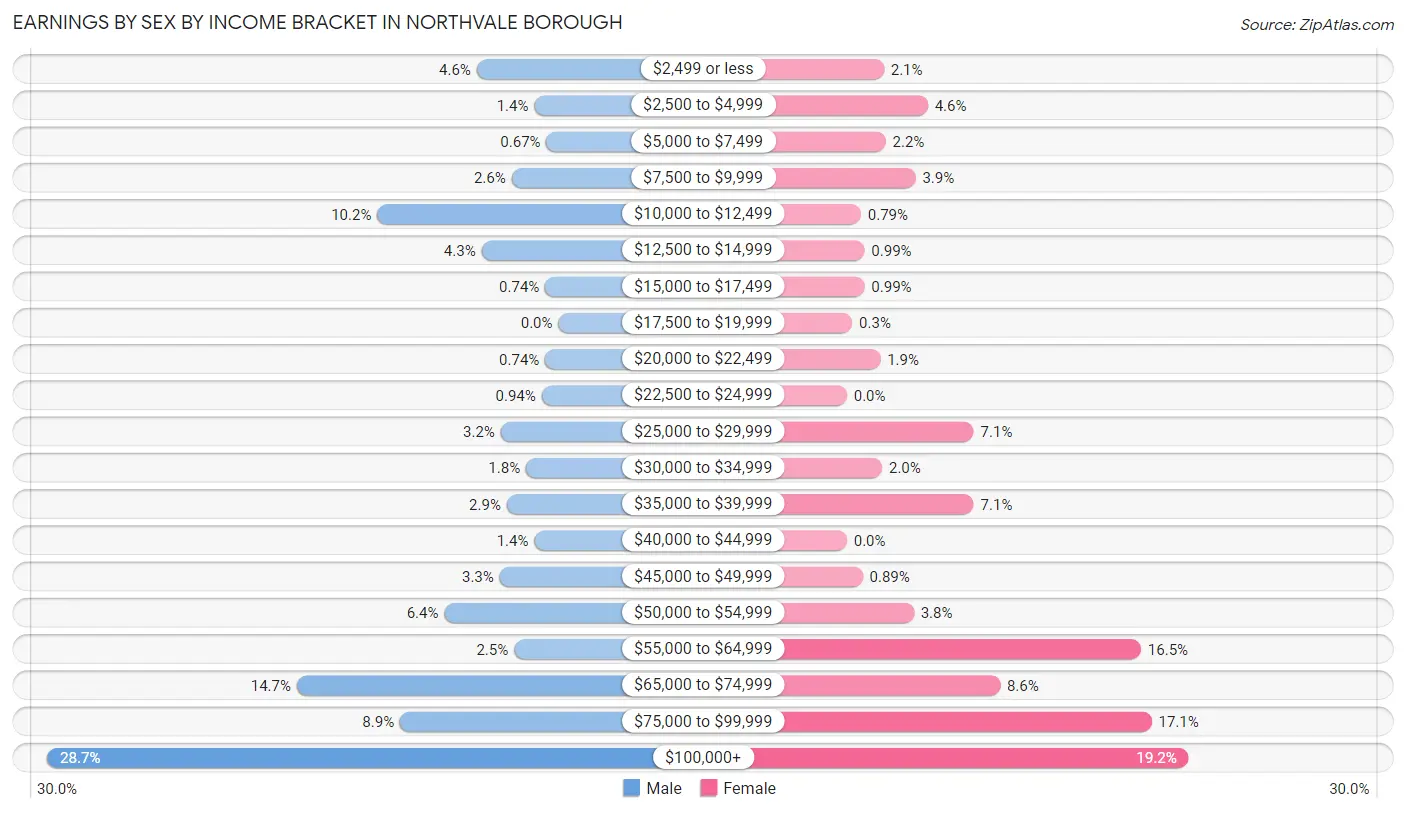
Earnings by Sex by Income Bracket in Northvale borough
The most common earnings brackets in Northvale borough are $100,000+ for men (426 | 28.7%) and $100,000+ for women (194 | 19.2%).
| Income | Male | Female |
| $2,499 or less | 68 (4.6%) | 21 (2.1%) |
| $2,500 to $4,999 | 20 (1.3%) | 46 (4.5%) |
| $5,000 to $7,499 | 10 (0.7%) | 22 (2.2%) |
| $7,500 to $9,999 | 39 (2.6%) | 39 (3.9%) |
| $10,000 to $12,499 | 151 (10.2%) | 8 (0.8%) |
| $12,500 to $14,999 | 64 (4.3%) | 10 (1.0%) |
| $15,000 to $17,499 | 11 (0.7%) | 10 (1.0%) |
| $17,500 to $19,999 | 0 (0.0%) | 3 (0.3%) |
| $20,000 to $22,499 | 11 (0.7%) | 19 (1.9%) |
| $22,500 to $24,999 | 14 (0.9%) | 0 (0.0%) |
| $25,000 to $29,999 | 48 (3.2%) | 72 (7.1%) |
| $30,000 to $34,999 | 27 (1.8%) | 20 (2.0%) |
| $35,000 to $39,999 | 43 (2.9%) | 72 (7.1%) |
| $40,000 to $44,999 | 20 (1.3%) | 0 (0.0%) |
| $45,000 to $49,999 | 49 (3.3%) | 9 (0.9%) |
| $50,000 to $54,999 | 95 (6.4%) | 38 (3.8%) |
| $55,000 to $64,999 | 37 (2.5%) | 167 (16.5%) |
| $65,000 to $74,999 | 218 (14.7%) | 87 (8.6%) |
| $75,000 to $99,999 | 132 (8.9%) | 173 (17.1%) |
| $100,000+ | 426 (28.7%) | 194 (19.2%) |
| Total | 1,483 (100.0%) | 1,010 (100.0%) |
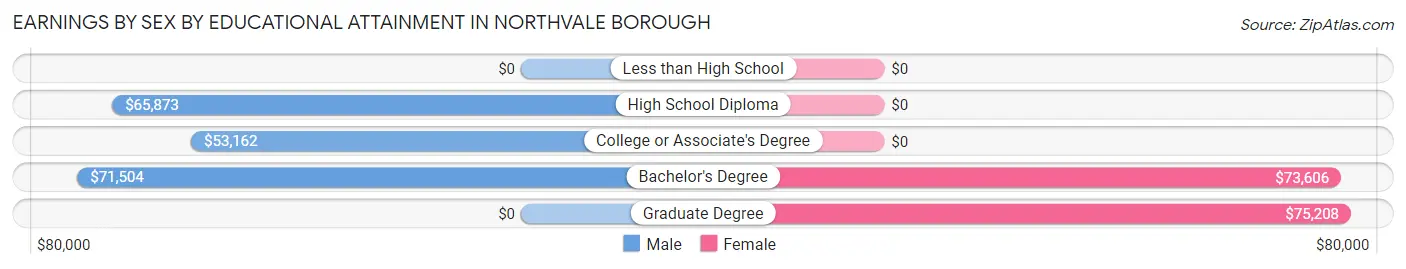
Earnings by Sex by Educational Attainment in Northvale borough
Average earnings in Northvale borough are $70,847 for men and $67,552 for women, a difference of 4.6%. Men with an educational attainment of bachelor's degree enjoy the highest average annual earnings of $71,504, while those with college or associate's degree education earn the least with $53,162. Women with an educational attainment of graduate degree earn the most with the average annual earnings of $75,208, while those with bachelor's degree education have the smallest earnings of $73,606.
| Educational Attainment | Male Income | Female Income |
| Less than High School | - | - |
| High School Diploma | $65,873 | $0 |
| College or Associate's Degree | $53,162 | $0 |
| Bachelor's Degree | $71,504 | $73,606 |
| Graduate Degree | - | - |
| Total | $70,847 | $67,552 |
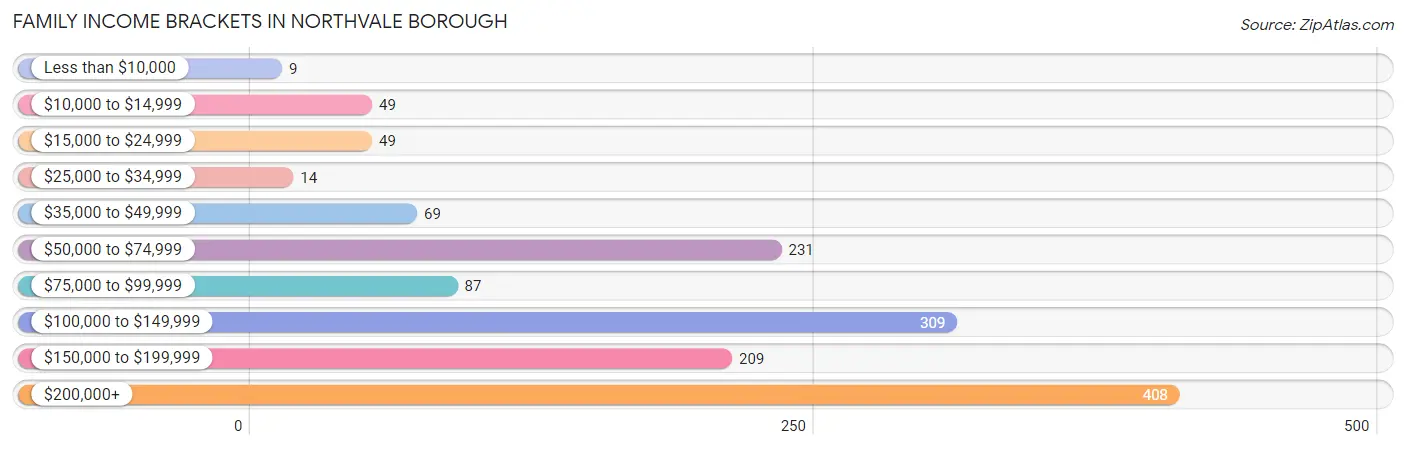
Family Income in Northvale borough
Family Income Brackets in Northvale borough
According to the Northvale borough family income data, there are 408 families falling into the $200,000+ income range, which is the most common income bracket and makes up 28.5% of all families. Conversely, the less than $10,000 income bracket is the least frequent group with only 9 families (0.6%) belonging to this category.
| Income Bracket | # Families | % Families |
| Less than $10,000 | 9 | 0.6% |
| $10,000 to $14,999 | 49 | 3.4% |
| $15,000 to $24,999 | 49 | 3.4% |
| $25,000 to $34,999 | 14 | 1.0% |
| $35,000 to $49,999 | 69 | 4.8% |
| $50,000 to $74,999 | 231 | 16.1% |
| $75,000 to $99,999 | 87 | 6.1% |
| $100,000 to $149,999 | 309 | 21.6% |
| $150,000 to $199,999 | 209 | 14.6% |
| $200,000+ | 408 | 28.5% |
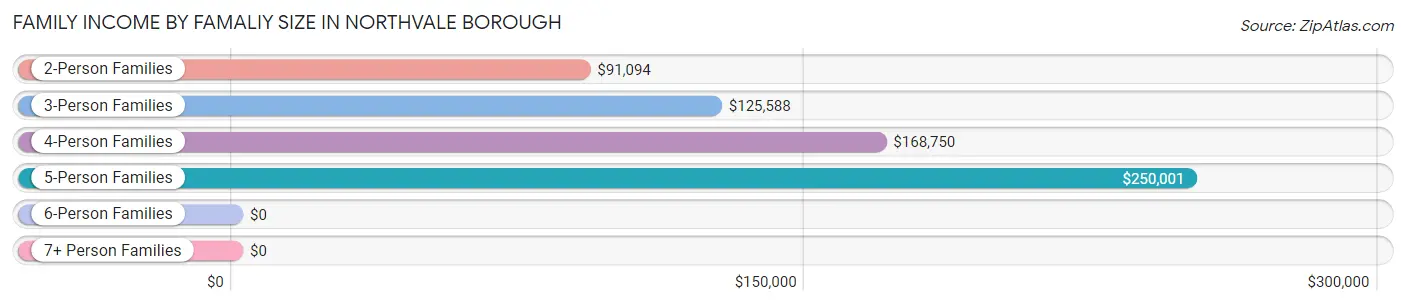
Family Income by Famaliy Size in Northvale borough
5-person families (127 | 8.9%) account for the highest median family income in Northvale borough with $250,001 per family, while 5-person families (127 | 8.9%) have the highest median income of $50,000 per family member.
| Income Bracket | # Families | Median Income |
| 2-Person Families | 576 (40.2%) | $91,094 |
| 3-Person Families | 190 (13.3%) | $125,588 |
| 4-Person Families | 539 (37.6%) | $168,750 |
| 5-Person Families | 127 (8.9%) | $250,001 |
| 6-Person Families | 0 (0.0%) | $0 |
| 7+ Person Families | 0 (0.0%) | $0 |
| Total | 1,432 (100.0%) | $127,206 |
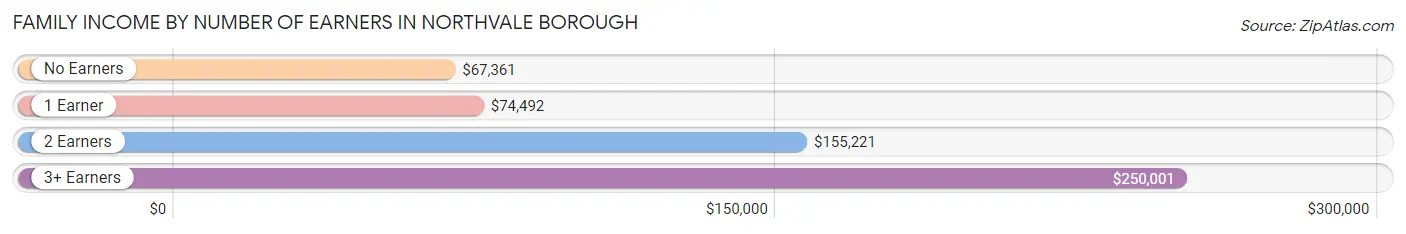
Family Income by Number of Earners in Northvale borough
The median family income in Northvale borough is $127,206, with families comprising 3+ earners (157) having the highest median family income of $250,001, while families with no earners (191) have the lowest median family income of $67,361, accounting for 11.0% and 13.3% of families, respectively.
| Number of Earners | # Families | Median Income |
| No Earners | 191 (13.3%) | $67,361 |
| 1 Earner | 355 (24.8%) | $74,492 |
| 2 Earners | 729 (50.9%) | $155,221 |
| 3+ Earners | 157 (11.0%) | $250,001 |
| Total | 1,432 (100.0%) | $127,206 |
Household Income in Northvale borough
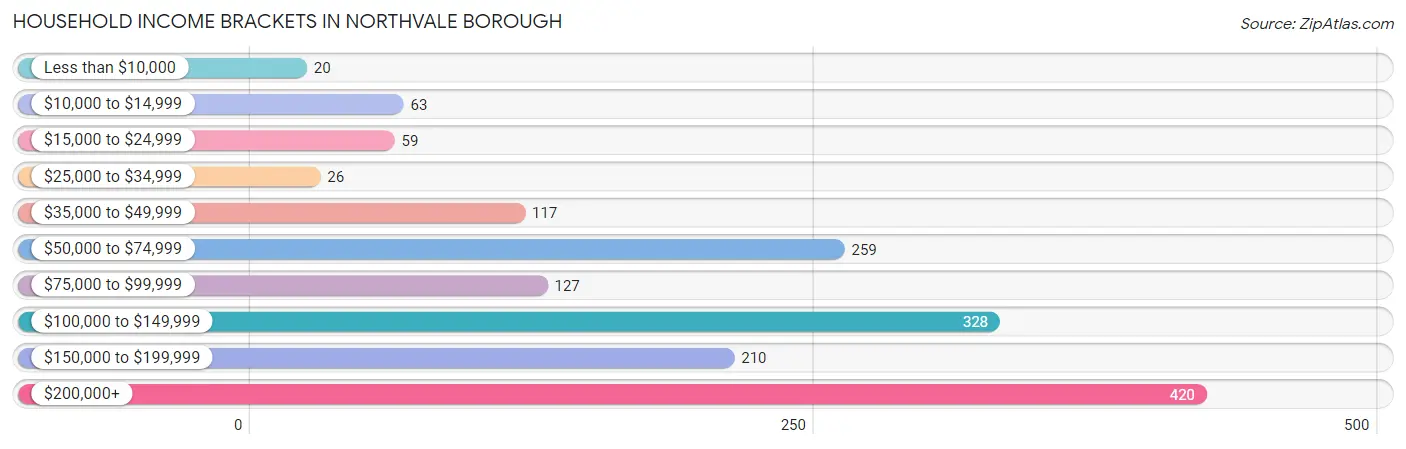
Household Income Brackets in Northvale borough
With 420 households falling in the category, the $200,000+ income range is the most frequent in Northvale borough, accounting for 25.8% of all households. In contrast, only 20 households (1.2%) fall into the less than $10,000 income bracket, making it the least populous group.
| Income Bracket | # Households | % Households |
| Less than $10,000 | 20 | 1.2% |
| $10,000 to $14,999 | 63 | 3.9% |
| $15,000 to $24,999 | 59 | 3.6% |
| $25,000 to $34,999 | 26 | 1.6% |
| $35,000 to $49,999 | 117 | 7.2% |
| $50,000 to $74,999 | 259 | 15.9% |
| $75,000 to $99,999 | 127 | 7.8% |
| $100,000 to $149,999 | 328 | 20.2% |
| $150,000 to $199,999 | 210 | 12.9% |
| $200,000+ | 420 | 25.8% |
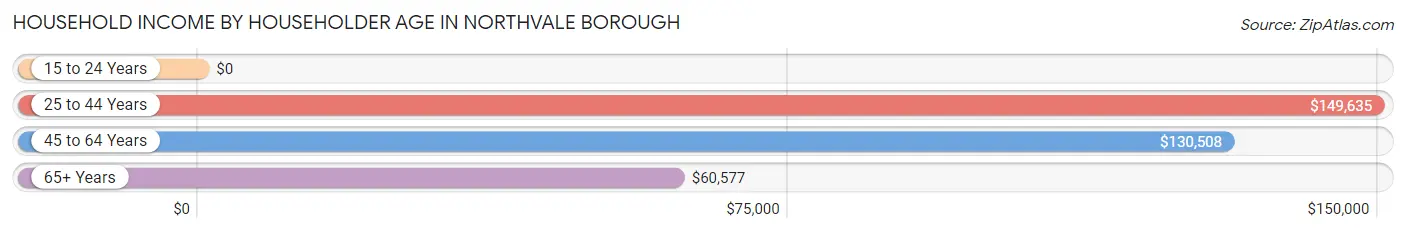
Household Income by Householder Age in Northvale borough
The median household income in Northvale borough is $120,278, with the highest median household income of $149,635 found in the 25 to 44 years age bracket for the primary householder. A total of 375 households (23.1%) fall into this category.
| Income Bracket | # Households | Median Income |
| 15 to 24 Years | 0 (0.0%) | $0 |
| 25 to 44 Years | 375 (23.1%) | $149,635 |
| 45 to 64 Years | 801 (49.3%) | $130,508 |
| 65+ Years | 450 (27.7%) | $60,577 |
| Total | 1,626 (100.0%) | $120,278 |
Poverty in Northvale borough
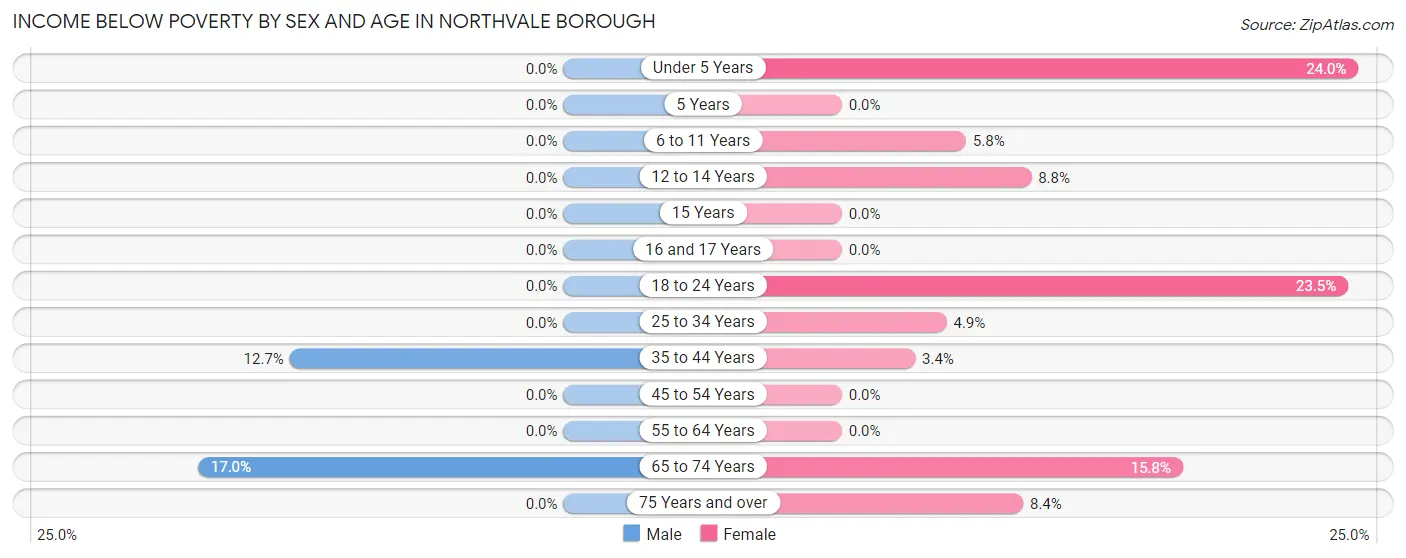
Income Below Poverty by Sex and Age in Northvale borough
With 3.8% poverty level for males and 6.8% for females among the residents of Northvale borough, 65 to 74 year old males and under 5 year old females are the most vulnerable to poverty, with 48 males (17.0%) and 29 females (24.0%) in their respective age groups living below the poverty level.
| Age Bracket | Male | Female |
| Under 5 Years | 0 (0.0%) | 29 (24.0%) |
| 5 Years | 0 (0.0%) | 0 (0.0%) |
| 6 to 11 Years | 0 (0.0%) | 8 (5.8%) |
| 12 to 14 Years | 0 (0.0%) | 8 (8.8%) |
| 15 Years | 0 (0.0%) | 0 (0.0%) |
| 16 and 17 Years | 0 (0.0%) | 0 (0.0%) |
| 18 to 24 Years | 0 (0.0%) | 39 (23.5%) |
| 25 to 34 Years | 0 (0.0%) | 9 (4.9%) |
| 35 to 44 Years | 48 (12.7%) | 8 (3.4%) |
| 45 to 54 Years | 0 (0.0%) | 0 (0.0%) |
| 55 to 64 Years | 0 (0.0%) | 0 (0.0%) |
| 65 to 74 Years | 48 (17.0%) | 31 (15.8%) |
| 75 Years and over | 0 (0.0%) | 19 (8.4%) |
| Total | 96 (3.8%) | 151 (6.8%) |
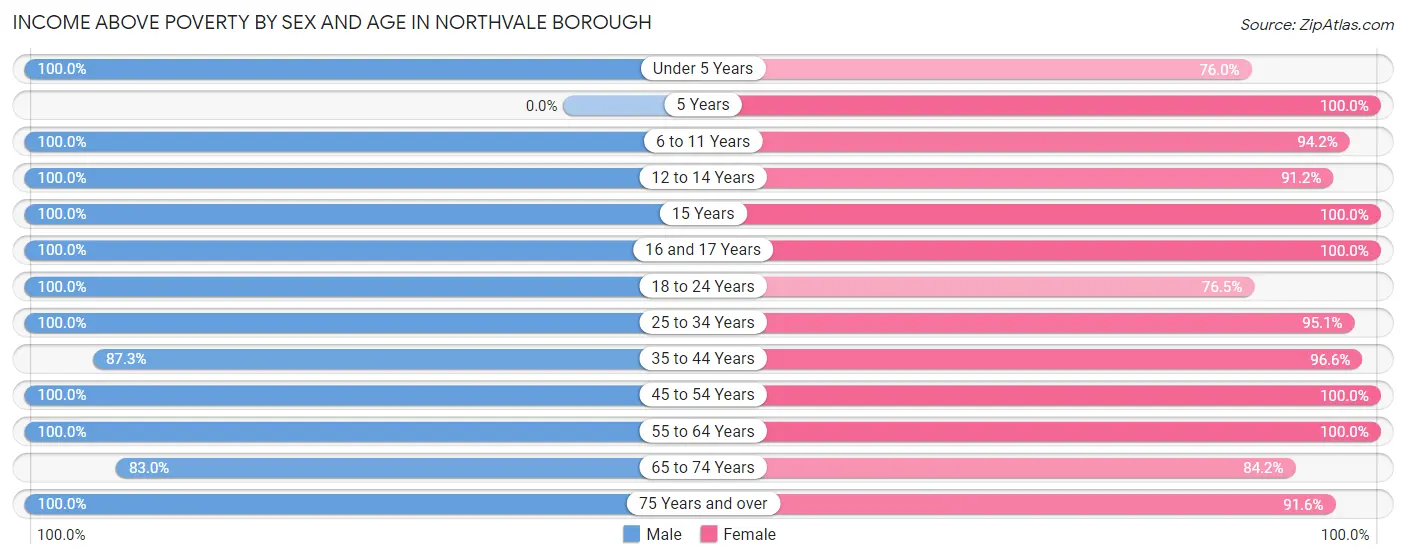
Income Above Poverty by Sex and Age in Northvale borough
According to the poverty statistics in Northvale borough, males aged under 5 years and females aged 5 years are the age groups that are most secure financially, with 100.0% of males and 100.0% of females in these age groups living above the poverty line.
| Age Bracket | Male | Female |
| Under 5 Years | 128 (100.0%) | 92 (76.0%) |
| 5 Years | 0 (0.0%) | 32 (100.0%) |
| 6 to 11 Years | 223 (100.0%) | 131 (94.2%) |
| 12 to 14 Years | 77 (100.0%) | 83 (91.2%) |
| 15 Years | 66 (100.0%) | 18 (100.0%) |
| 16 and 17 Years | 91 (100.0%) | 107 (100.0%) |
| 18 to 24 Years | 233 (100.0%) | 127 (76.5%) |
| 25 to 34 Years | 245 (100.0%) | 176 (95.1%) |
| 35 to 44 Years | 330 (87.3%) | 227 (96.6%) |
| 45 to 54 Years | 397 (100.0%) | 412 (100.0%) |
| 55 to 64 Years | 314 (100.0%) | 310 (100.0%) |
| 65 to 74 Years | 235 (83.0%) | 165 (84.2%) |
| 75 Years and over | 96 (100.0%) | 207 (91.6%) |
| Total | 2,435 (96.2%) | 2,087 (93.2%) |
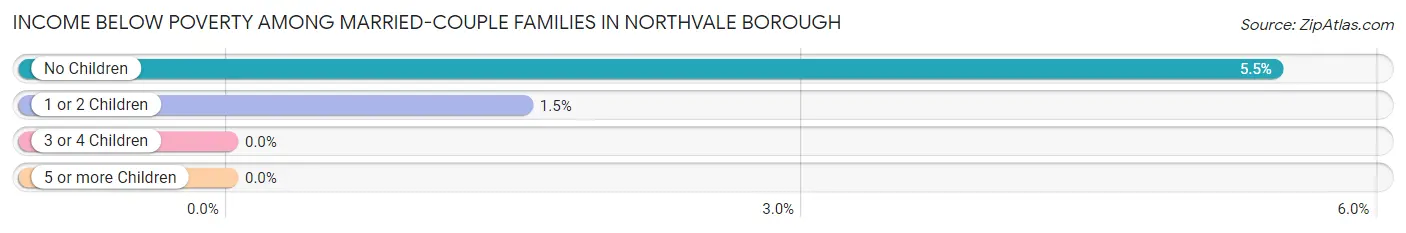
Income Below Poverty Among Married-Couple Families in Northvale borough
The poverty statistics for married-couple families in Northvale borough show that 3.4% or 38 of the total 1,133 families live below the poverty line. Families with no children have the highest poverty rate of 5.5%, comprising of 30 families. On the other hand, families with 3 or 4 children have the lowest poverty rate of 0.0%, which includes 0 families.
| Children | Above Poverty | Below Poverty |
| No Children | 519 (94.5%) | 30 (5.5%) |
| 1 or 2 Children | 513 (98.5%) | 8 (1.5%) |
| 3 or 4 Children | 63 (100.0%) | 0 (0.0%) |
| 5 or more Children | 0 (0.0%) | 0 (0.0%) |
| Total | 1,095 (96.7%) | 38 (3.4%) |
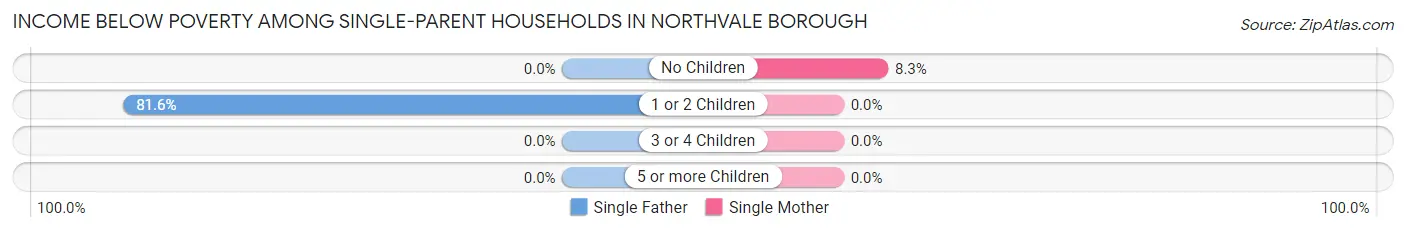
Income Below Poverty Among Single-Parent Households in Northvale borough
According to the poverty data in Northvale borough, 27.4% or 40 single-father households and 5.9% or 9 single-mother households are living below the poverty line. Among single-father households, those with 1 or 2 children have the highest poverty rate, with 40 households (81.6%) experiencing poverty. Likewise, among single-mother households, those with no children have the highest poverty rate, with 9 households (8.3%) falling below the poverty line.
| Children | Single Father | Single Mother |
| No Children | 0 (0.0%) | 9 (8.3%) |
| 1 or 2 Children | 40 (81.6%) | 0 (0.0%) |
| 3 or 4 Children | 0 (0.0%) | 0 (0.0%) |
| 5 or more Children | 0 (0.0%) | 0 (0.0%) |
| Total | 40 (27.4%) | 9 (5.9%) |
Income Below Poverty Among Married-Couple vs Single-Parent Households in Northvale borough
The poverty data for Northvale borough shows that 38 of the married-couple family households (3.4%) and 49 of the single-parent households (16.4%) are living below the poverty level. Within the married-couple family households, those with no children have the highest poverty rate, with 30 households (5.5%) falling below the poverty line. Among the single-parent households, those with 1 or 2 children have the highest poverty rate, with 40 household (43.0%) living below poverty.
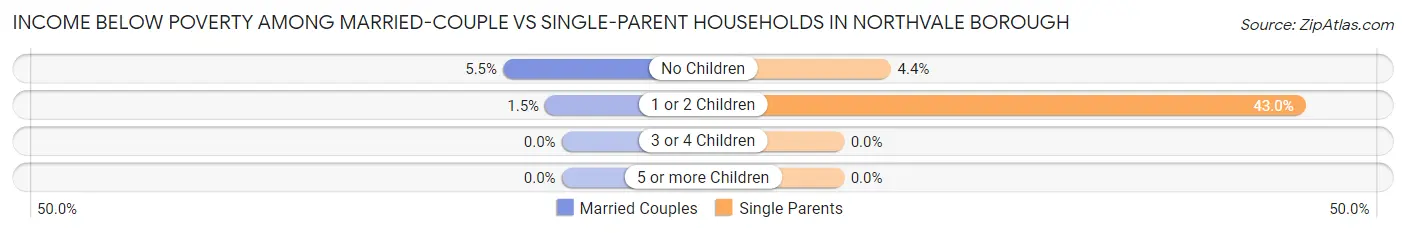
| Children | Married-Couple Families | Single-Parent Households |
| No Children | 30 (5.5%) | 9 (4.4%) |
| 1 or 2 Children | 8 (1.5%) | 40 (43.0%) |
| 3 or 4 Children | 0 (0.0%) | 0 (0.0%) |
| 5 or more Children | 0 (0.0%) | 0 (0.0%) |
| Total | 38 (3.4%) | 49 (16.4%) |
Race in Northvale borough
The most populous races in Northvale borough are White / Caucasian (2,674 | 56.1%), Asian (1,698 | 35.6%), and Hispanic or Latino (544 | 11.4%).
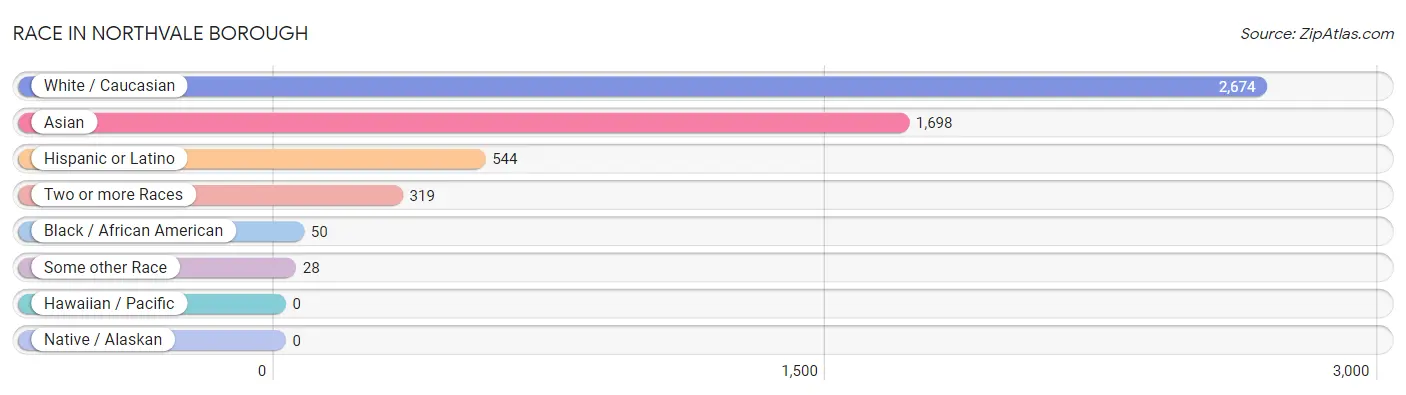
| Race | # Population | % Population |
| Asian | 1,698 | 35.6% |
| Black / African American | 50 | 1.1% |
| Hawaiian / Pacific | 0 | 0.0% |
| Hispanic or Latino | 544 | 11.4% |
| Native / Alaskan | 0 | 0.0% |
| White / Caucasian | 2,674 | 56.1% |
| Two or more Races | 319 | 6.7% |
| Some other Race | 28 | 0.6% |
| Total | 4,769 | 100.0% |
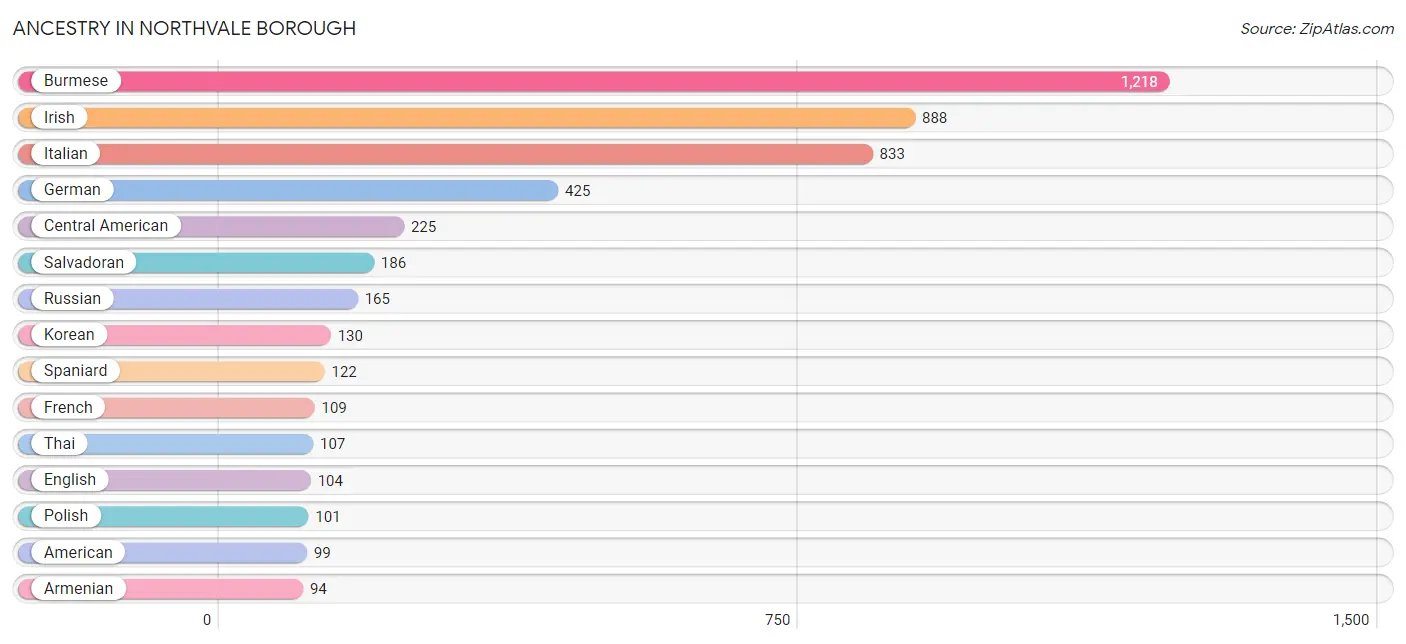
Ancestry in Northvale borough
The most populous ancestries reported in Northvale borough are Burmese (1,218 | 25.5%), Irish (888 | 18.6%), Italian (833 | 17.5%), German (425 | 8.9%), and Central American (225 | 4.7%), together accounting for 75.3% of all Northvale borough residents.
| Ancestry | # Population | % Population |
| American | 99 | 2.1% |
| Arab | 93 | 1.9% |
| Armenian | 94 | 2.0% |
| Austrian | 28 | 0.6% |
| Brazilian | 19 | 0.4% |
| British | 9 | 0.2% |
| Burmese | 1,218 | 25.5% |
| Canadian | 10 | 0.2% |
| Central American | 225 | 4.7% |
| Cherokee | 5 | 0.1% |
| Chilean | 12 | 0.3% |
| Colombian | 55 | 1.1% |
| Croatian | 36 | 0.7% |
| Cuban | 82 | 1.7% |
| Danish | 9 | 0.2% |
| Dominican | 25 | 0.5% |
| Dutch | 16 | 0.3% |
| English | 104 | 2.2% |
| French | 109 | 2.3% |
| German | 425 | 8.9% |
| Greek | 75 | 1.6% |
| Guatemalan | 39 | 0.8% |
| Haitian | 5 | 0.1% |
| Hungarian | 19 | 0.4% |
| Iranian | 19 | 0.4% |
| Irish | 888 | 18.6% |
| Italian | 833 | 17.5% |
| Jamaican | 13 | 0.3% |
| Korean | 130 | 2.7% |
| Lebanese | 4 | 0.1% |
| Lithuanian | 9 | 0.2% |
| Moroccan | 10 | 0.2% |
| Norwegian | 67 | 1.4% |
| Peruvian | 14 | 0.3% |
| Polish | 101 | 2.1% |
| Puerto Rican | 9 | 0.2% |
| Russian | 165 | 3.5% |
| Salvadoran | 186 | 3.9% |
| Slavic | 9 | 0.2% |
| Slovak | 9 | 0.2% |
| South American | 81 | 1.7% |
| Spaniard | 122 | 2.6% |
| Swedish | 9 | 0.2% |
| Syrian | 44 | 0.9% |
| Thai | 107 | 2.2% | View All 45 Rows |
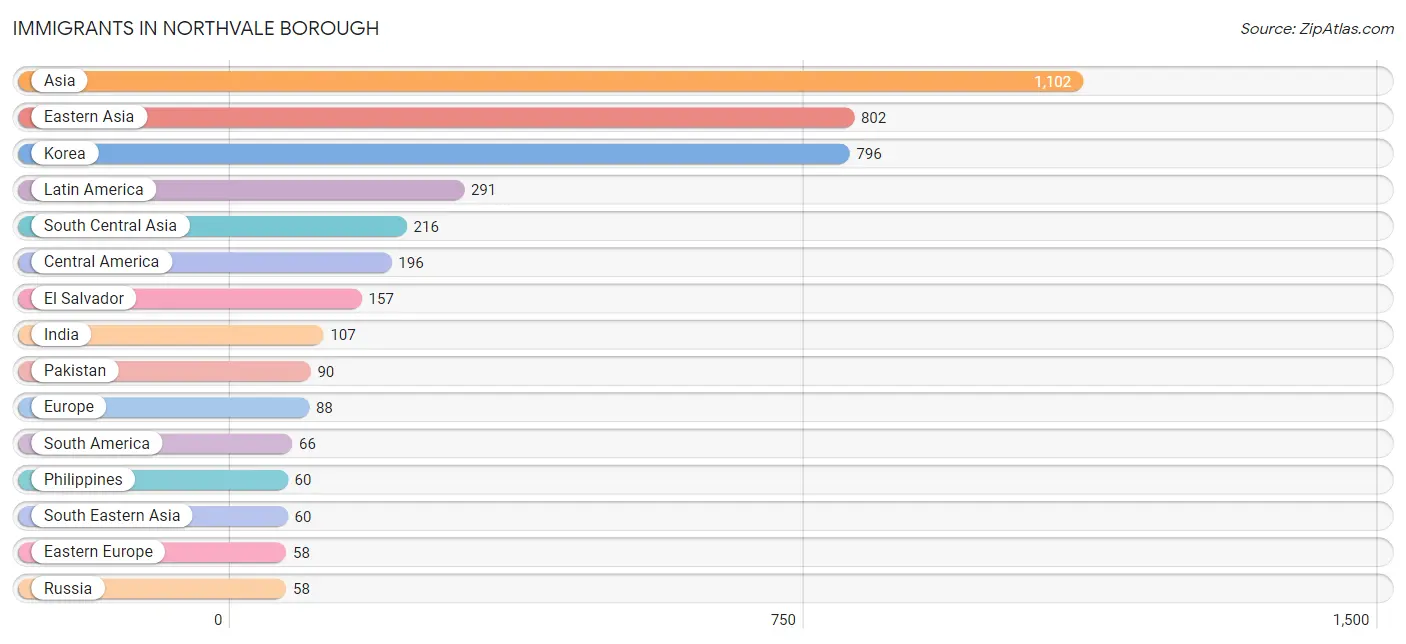
Immigrants in Northvale borough
The most numerous immigrant groups reported in Northvale borough came from Asia (1,102 | 23.1%), Eastern Asia (802 | 16.8%), Korea (796 | 16.7%), Latin America (291 | 6.1%), and South Central Asia (216 | 4.5%), together accounting for 67.2% of all Northvale borough residents.
| Immigration Origin | # Population | % Population |
| Asia | 1,102 | 23.1% |
| Brazil | 19 | 0.4% |
| Canada | 9 | 0.2% |
| Caribbean | 29 | 0.6% |
| Central America | 196 | 4.1% |
| Colombia | 47 | 1.0% |
| Cuba | 11 | 0.2% |
| Eastern Asia | 802 | 16.8% |
| Eastern Europe | 58 | 1.2% |
| El Salvador | 157 | 3.3% |
| Europe | 88 | 1.8% |
| France | 6 | 0.1% |
| Guatemala | 39 | 0.8% |
| Haiti | 5 | 0.1% |
| India | 107 | 2.2% |
| Iran | 19 | 0.4% |
| Iraq | 20 | 0.4% |
| Italy | 24 | 0.5% |
| Jamaica | 13 | 0.3% |
| Japan | 6 | 0.1% |
| Korea | 796 | 16.7% |
| Latin America | 291 | 6.1% |
| Lebanon | 4 | 0.1% |
| Pakistan | 90 | 1.9% |
| Philippines | 60 | 1.3% |
| Russia | 58 | 1.2% |
| South America | 66 | 1.4% |
| South Central Asia | 216 | 4.5% |
| South Eastern Asia | 60 | 1.3% |
| Southern Europe | 24 | 0.5% |
| Western Asia | 24 | 0.5% |
| Western Europe | 6 | 0.1% | View All 32 Rows |
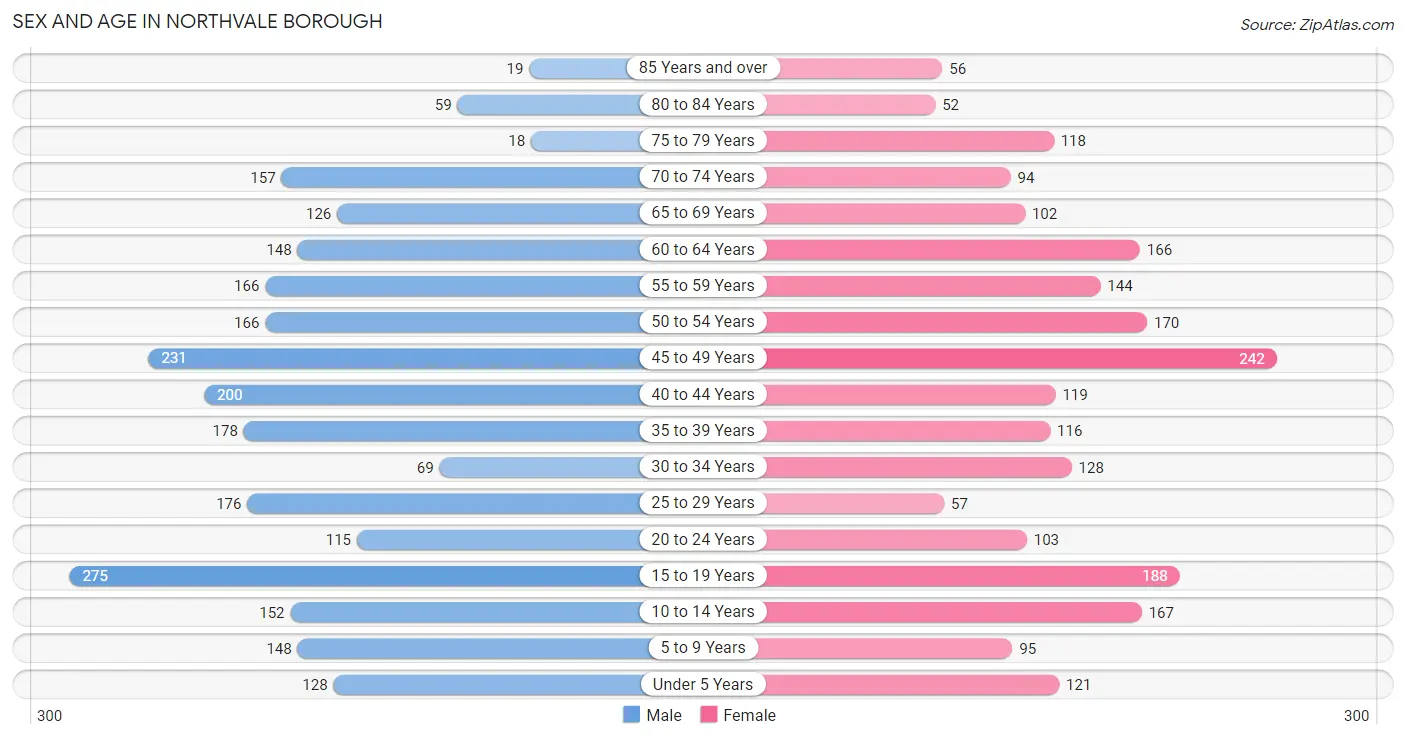
Sex and Age in Northvale borough
Sex and Age in Northvale borough
The most populous age groups in Northvale borough are 15 to 19 Years (275 | 10.9%) for men and 45 to 49 Years (242 | 10.8%) for women.
| Age Bracket | Male | Female |
| Under 5 Years | 128 (5.1%) | 121 (5.4%) |
| 5 to 9 Years | 148 (5.9%) | 95 (4.2%) |
| 10 to 14 Years | 152 (6.0%) | 167 (7.5%) |
| 15 to 19 Years | 275 (10.9%) | 188 (8.4%) |
| 20 to 24 Years | 115 (4.5%) | 103 (4.6%) |
| 25 to 29 Years | 176 (7.0%) | 57 (2.5%) |
| 30 to 34 Years | 69 (2.7%) | 128 (5.7%) |
| 35 to 39 Years | 178 (7.0%) | 116 (5.2%) |
| 40 to 44 Years | 200 (7.9%) | 119 (5.3%) |
| 45 to 49 Years | 231 (9.1%) | 242 (10.8%) |
| 50 to 54 Years | 166 (6.6%) | 170 (7.6%) |
| 55 to 59 Years | 166 (6.6%) | 144 (6.4%) |
| 60 to 64 Years | 148 (5.9%) | 166 (7.4%) |
| 65 to 69 Years | 126 (5.0%) | 102 (4.6%) |
| 70 to 74 Years | 157 (6.2%) | 94 (4.2%) |
| 75 to 79 Years | 18 (0.7%) | 118 (5.3%) |
| 80 to 84 Years | 59 (2.3%) | 52 (2.3%) |
| 85 Years and over | 19 (0.7%) | 56 (2.5%) |
| Total | 2,531 (100.0%) | 2,238 (100.0%) |
Families and Households in Northvale borough
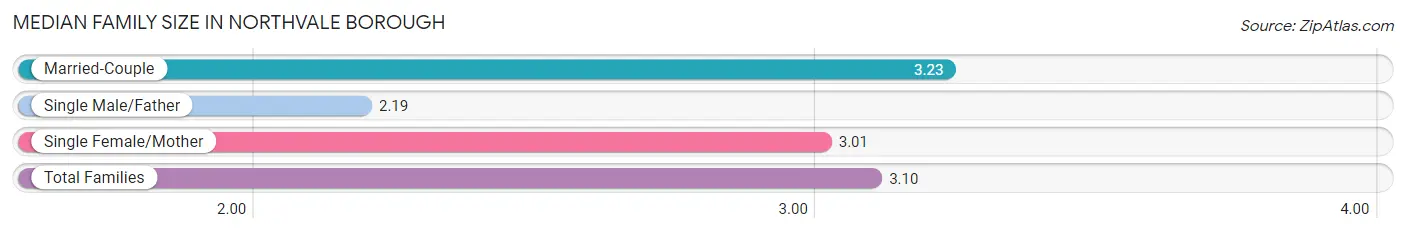
Median Family Size in Northvale borough
The median family size in Northvale borough is 3.10 persons per family, with married-couple families (1,133 | 79.1%) accounting for the largest median family size of 3.23 persons per family. On the other hand, single male/father families (146 | 10.2%) represent the smallest median family size with 2.19 persons per family.
| Family Type | # Families | Family Size |
| Married-Couple | 1,133 (79.1%) | 3.23 |
| Single Male/Father | 146 (10.2%) | 2.19 |
| Single Female/Mother | 153 (10.7%) | 3.01 |
| Total Families | 1,432 (100.0%) | 3.10 |
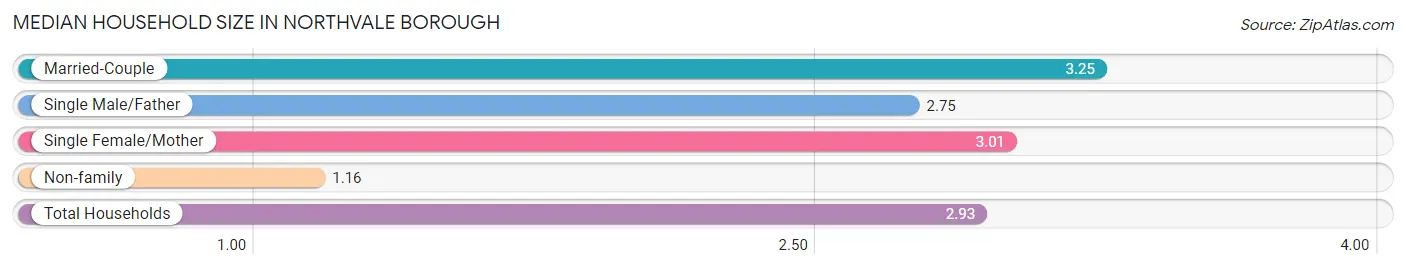
Median Household Size in Northvale borough
The median household size in Northvale borough is 2.93 persons per household, with married-couple households (1,133 | 69.7%) accounting for the largest median household size of 3.25 persons per household. non-family households (194 | 11.9%) represent the smallest median household size with 1.16 persons per household.
| Household Type | # Households | Household Size |
| Married-Couple | 1,133 (69.7%) | 3.25 |
| Single Male/Father | 146 (9.0%) | 2.75 |
| Single Female/Mother | 153 (9.4%) | 3.01 |
| Non-family | 194 (11.9%) | 1.16 |
| Total Households | 1,626 (100.0%) | 2.93 |
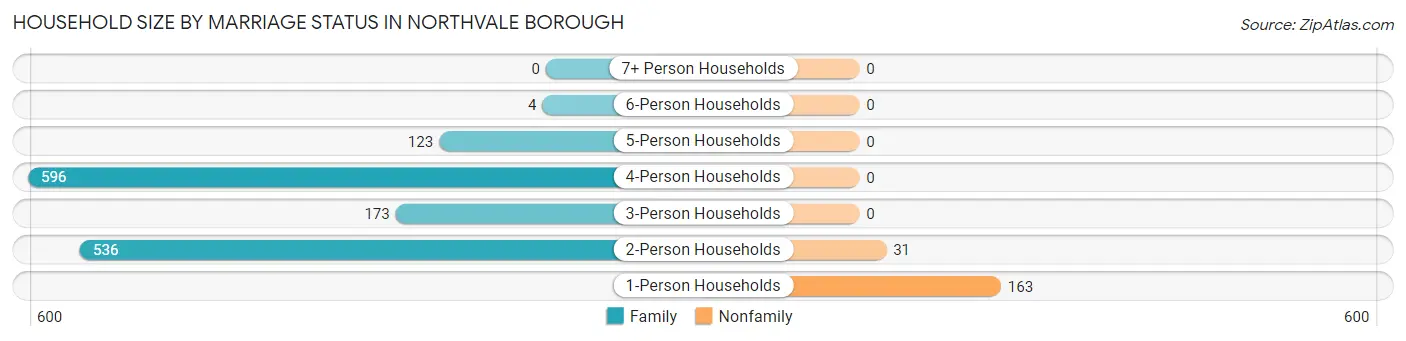
Household Size by Marriage Status in Northvale borough
Out of a total of 1,626 households in Northvale borough, 1,432 (88.1%) are family households, while 194 (11.9%) are nonfamily households. The most numerous type of family households are 4-person households, comprising 596, and the most common type of nonfamily households are 1-person households, comprising 163.
| Household Size | Family Households | Nonfamily Households |
| 1-Person Households | - | 163 (10.0%) |
| 2-Person Households | 536 (33.0%) | 31 (1.9%) |
| 3-Person Households | 173 (10.6%) | 0 (0.0%) |
| 4-Person Households | 596 (36.6%) | 0 (0.0%) |
| 5-Person Households | 123 (7.6%) | 0 (0.0%) |
| 6-Person Households | 4 (0.3%) | 0 (0.0%) |
| 7+ Person Households | 0 (0.0%) | 0 (0.0%) |
| Total | 1,432 (88.1%) | 194 (11.9%) |
Female Fertility in Northvale borough
Fertility by Age in Northvale borough
Average fertility rate in Northvale borough is 62.0 births per 1,000 women. Women in the age bracket of 20 to 34 years have the highest fertility rate with 163.0 births per 1,000 women. Women in the age bracket of 20 to 34 years acount for 75.8% of all women with births.
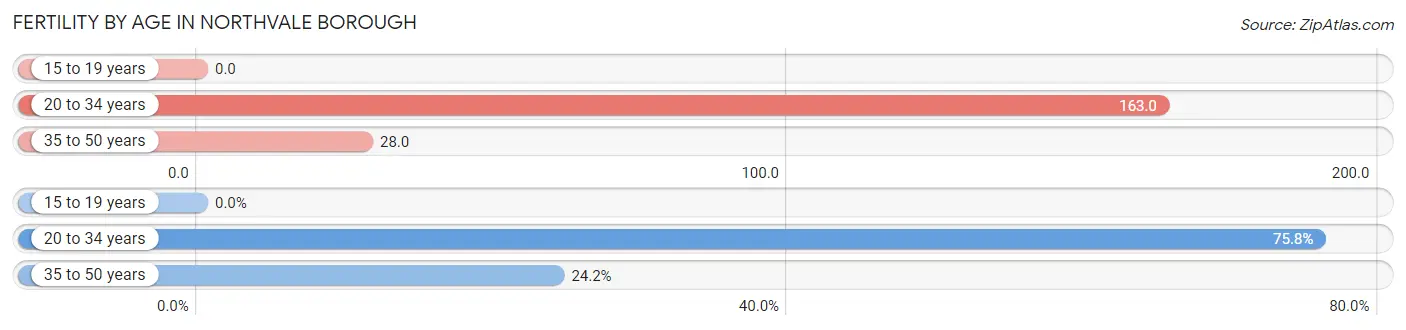
| Age Bracket | Women with Births | Births / 1,000 Women |
| 15 to 19 years | 0 (0.0%) | 0.0 |
| 20 to 34 years | 47 (75.8%) | 163.0 |
| 35 to 50 years | 15 (24.2%) | 28.0 |
| Total | 62 (100.0%) | 62.0 |
Fertility by Age by Marriage Status in Northvale borough
24.2% of women with births (62) in Northvale borough are married. The highest percentage of unmarried women with births falls into 20 to 34 years age bracket with 100.0% of them unmarried at the time of birth, while the lowest percentage of unmarried women with births belong to 35 to 50 years age bracket with 0.0% of them unmarried.
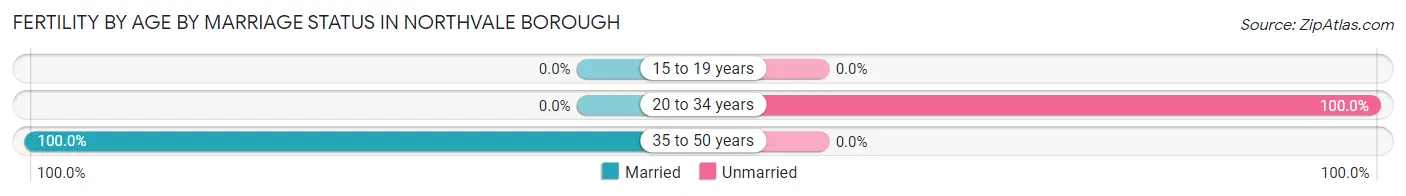
| Age Bracket | Married | Unmarried |
| 15 to 19 years | 0 (0.0%) | 0 (0.0%) |
| 20 to 34 years | 0 (0.0%) | 47 (100.0%) |
| 35 to 50 years | 15 (100.0%) | 0 (0.0%) |
| Total | 15 (24.2%) | 47 (75.8%) |
Fertility by Education in Northvale borough
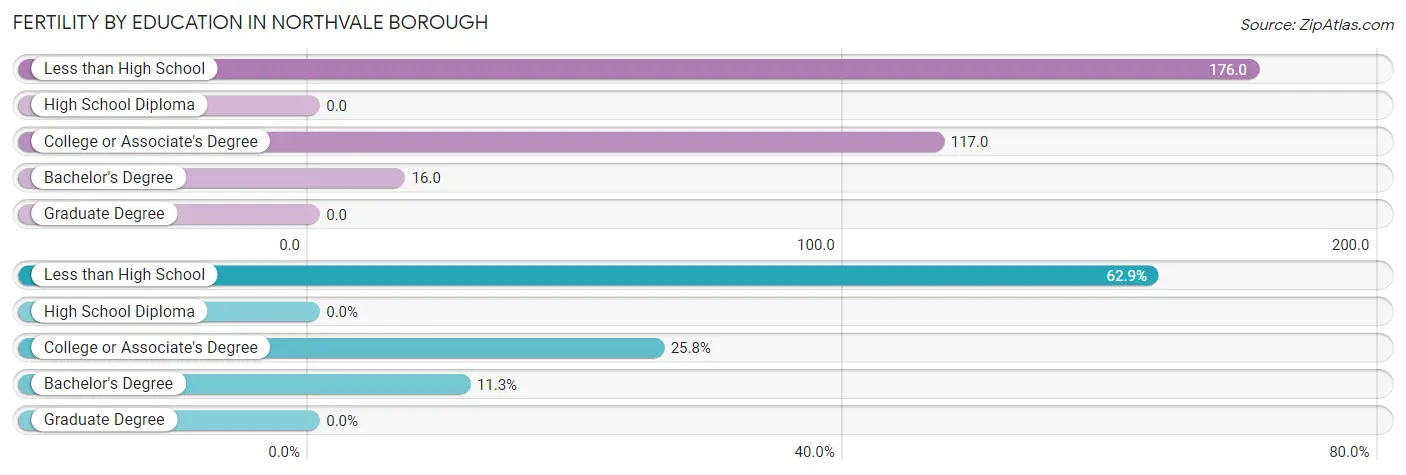
| Educational Attainment | Women with Births | Births / 1,000 Women |
| Less than High School | 39 (62.9%) | 176.0 |
| High School Diploma | 0 (0.0%) | 0.0 |
| College or Associate's Degree | 16 (25.8%) | 117.0 |
| Bachelor's Degree | 7 (11.3%) | 16.0 |
| Graduate Degree | 0 (0.0%) | 0.0 |
| Total | 62 (100.0%) | 62.0 |
Fertility by Education by Marriage Status in Northvale borough
75.8% of women with births in Northvale borough are unmarried. Women with the educational attainment of bachelor's degree are most likely to be married with 100.0% of them married at childbirth, while women with the educational attainment of less than high school are least likely to be married with 100.0% of them unmarried at childbirth.
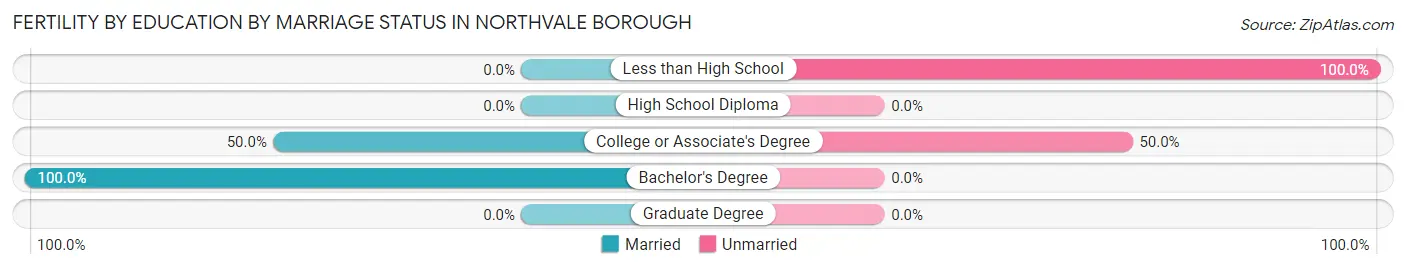
| Educational Attainment | Married | Unmarried |
| Less than High School | 0 (0.0%) | 39 (100.0%) |
| High School Diploma | 0 (0.0%) | 0 (0.0%) |
| College or Associate's Degree | 8 (50.0%) | 8 (50.0%) |
| Bachelor's Degree | 7 (100.0%) | 0 (0.0%) |
| Graduate Degree | 0 (0.0%) | 0 (0.0%) |
| Total | 15 (24.2%) | 47 (75.8%) |
Employment Characteristics in Northvale borough
Employment by Class of Employer in Northvale borough
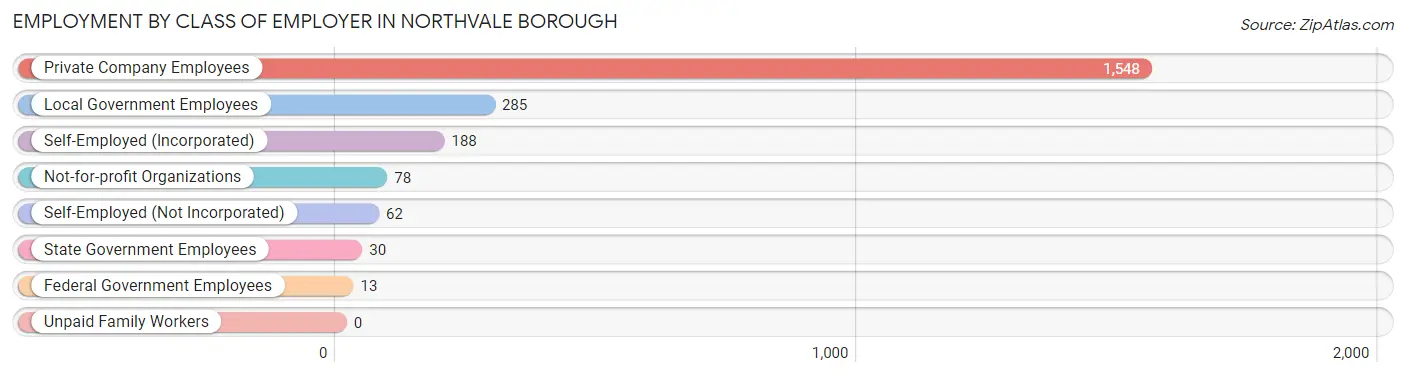
Among the 2,204 employed individuals in Northvale borough, private company employees (1,548 | 70.2%), local government employees (285 | 12.9%), and self-employed (incorporated) (188 | 8.5%) make up the most common classes of employment.
| Employer Class | # Employees | % Employees |
| Private Company Employees | 1,548 | 70.2% |
| Self-Employed (Incorporated) | 188 | 8.5% |
| Self-Employed (Not Incorporated) | 62 | 2.8% |
| Not-for-profit Organizations | 78 | 3.5% |
| Local Government Employees | 285 | 12.9% |
| State Government Employees | 30 | 1.4% |
| Federal Government Employees | 13 | 0.6% |
| Unpaid Family Workers | 0 | 0.0% |
| Total | 2,204 | 100.0% |
Employment Status by Age in Northvale borough
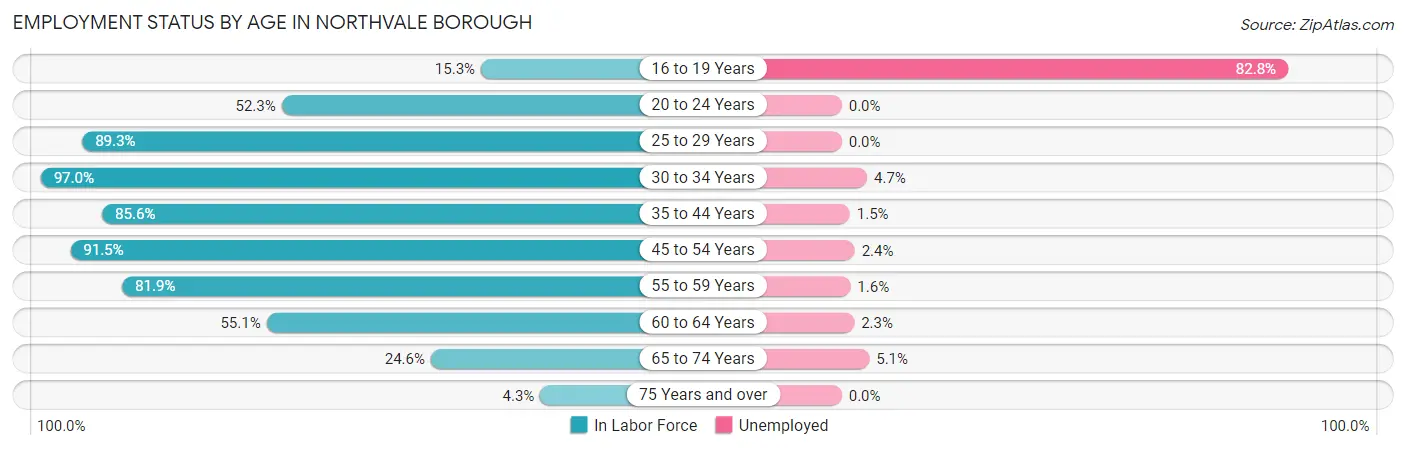
According to the labor force statistics for Northvale borough, out of the total population over 16 years of age (3,874), 61.8% or 2,394 individuals are in the labor force, with 4.1% or 98 of them unemployed. The age group with the highest labor force participation rate is 30 to 34 years, with 97.0% or 191 individuals in the labor force. Within the labor force, the 16 to 19 years age range has the highest percentage of unemployed individuals, with 82.8% or 48 of them being unemployed.
| Age Bracket | In Labor Force | Unemployed |
| 16 to 19 Years | 58 (15.3%) | 48 (82.8%) |
| 20 to 24 Years | 114 (52.3%) | 0 (0.0%) |
| 25 to 29 Years | 208 (89.3%) | 0 (0.0%) |
| 30 to 34 Years | 191 (97.0%) | 9 (4.7%) |
| 35 to 44 Years | 525 (85.6%) | 8 (1.5%) |
| 45 to 54 Years | 740 (91.5%) | 18 (2.4%) |
| 55 to 59 Years | 254 (81.9%) | 4 (1.6%) |
| 60 to 64 Years | 173 (55.1%) | 4 (2.3%) |
| 65 to 74 Years | 118 (24.6%) | 6 (5.1%) |
| 75 Years and over | 14 (4.3%) | 0 (0.0%) |
| Total | 2,394 (61.8%) | 98 (4.1%) |
Employment Status by Educational Attainment in Northvale borough
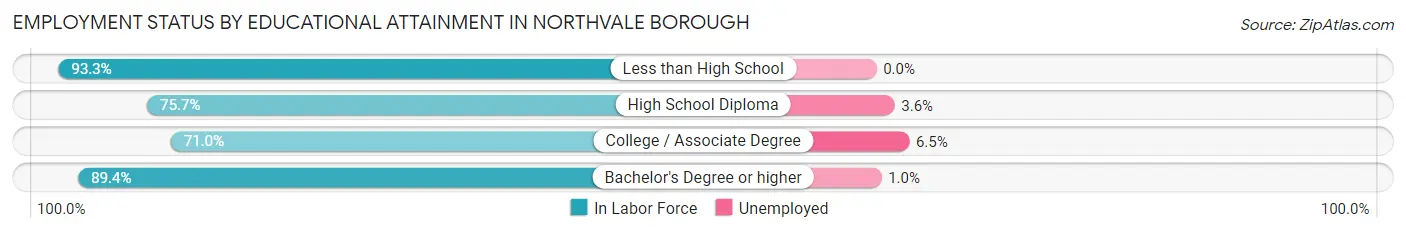
According to labor force statistics for Northvale borough, 84.5% of individuals (2,092) out of the total population between 25 and 64 years of age (2,476) are in the labor force, with 2.1% or 44 of them being unemployed. The group with the highest labor force participation rate are those with the educational attainment of less than high school, with 93.3% or 112 individuals in the labor force. Within the labor force, individuals with college / associate degree education have the highest percentage of unemployment, with 6.5% or 17 of them being unemployed.
| Educational Attainment | In Labor Force | Unemployed |
| Less than High School | 112 (93.3%) | 0 (0.0%) |
| High School Diploma | 330 (75.7%) | 16 (3.6%) |
| College / Associate Degree | 260 (71.0%) | 24 (6.5%) |
| Bachelor's Degree or higher | 1,389 (89.4%) | 16 (1.0%) |
| Total | 2,092 (84.5%) | 52 (2.1%) |
Employment Occupations by Sex in Northvale borough
Management, Business, Science and Arts Occupations
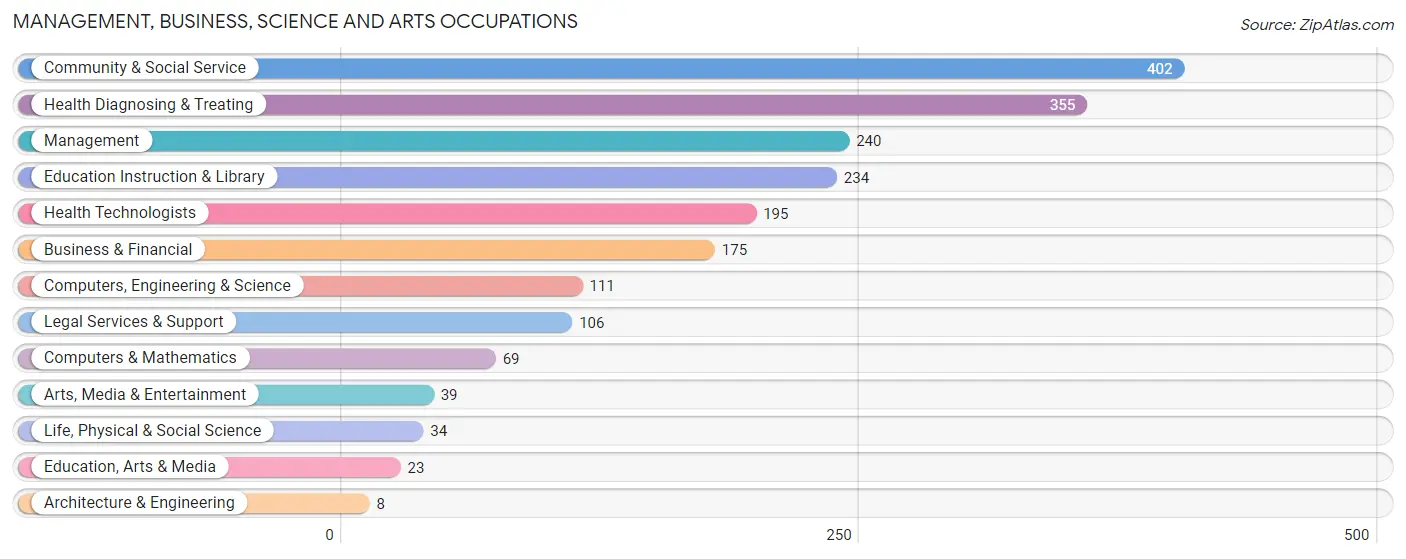
The most common Management, Business, Science and Arts occupations in Northvale borough are Community & Social Service (402 | 17.5%), Health Diagnosing & Treating (355 | 15.4%), Management (240 | 10.4%), Education Instruction & Library (234 | 10.2%), and Health Technologists (195 | 8.5%).
Management, Business, Science and Arts Occupations by Sex
Within the Management, Business, Science and Arts occupations in Northvale borough, the most male-oriented occupations are Computers & Mathematics (100.0%), Architecture & Engineering (100.0%), and Computers, Engineering & Science (94.6%), while the most female-oriented occupations are Education Instruction & Library (88.0%), Community & Social Service (70.4%), and Education, Arts & Media (65.2%).
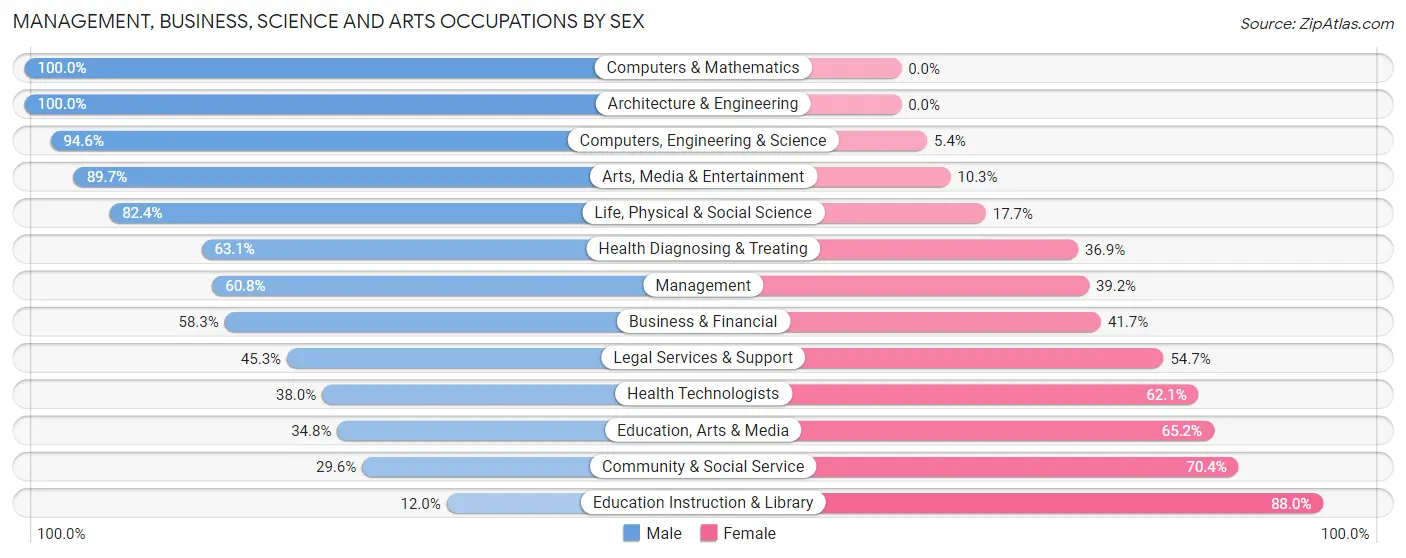
| Occupation | Male | Female |
| Management | 146 (60.8%) | 94 (39.2%) |
| Business & Financial | 102 (58.3%) | 73 (41.7%) |
| Computers, Engineering & Science | 105 (94.6%) | 6 (5.4%) |
| Computers & Mathematics | 69 (100.0%) | 0 (0.0%) |
| Architecture & Engineering | 8 (100.0%) | 0 (0.0%) |
| Life, Physical & Social Science | 28 (82.4%) | 6 (17.6%) |
| Community & Social Service | 119 (29.6%) | 283 (70.4%) |
| Education, Arts & Media | 8 (34.8%) | 15 (65.2%) |
| Legal Services & Support | 48 (45.3%) | 58 (54.7%) |
| Education Instruction & Library | 28 (12.0%) | 206 (88.0%) |
| Arts, Media & Entertainment | 35 (89.7%) | 4 (10.3%) |
| Health Diagnosing & Treating | 224 (63.1%) | 131 (36.9%) |
| Health Technologists | 74 (38.0%) | 121 (62.1%) |
| Total (Category) | 696 (54.2%) | 587 (45.8%) |
| Total (Overall) | 1,399 (60.9%) | 899 (39.1%) |
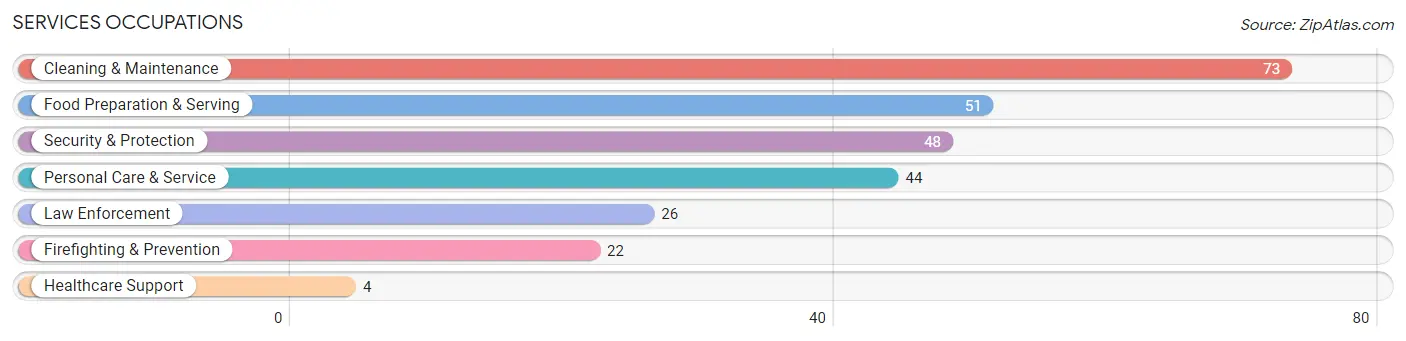
Services Occupations
The most common Services occupations in Northvale borough are Cleaning & Maintenance (73 | 3.2%), Food Preparation & Serving (51 | 2.2%), Security & Protection (48 | 2.1%), Personal Care & Service (44 | 1.9%), and Law Enforcement (26 | 1.1%).
Services Occupations by Sex
Within the Services occupations in Northvale borough, the most male-oriented occupations are Law Enforcement (100.0%), Cleaning & Maintenance (100.0%), and Security & Protection (93.8%), while the most female-oriented occupations are Healthcare Support (100.0%), Food Preparation & Serving (43.1%), and Personal Care & Service (15.9%).
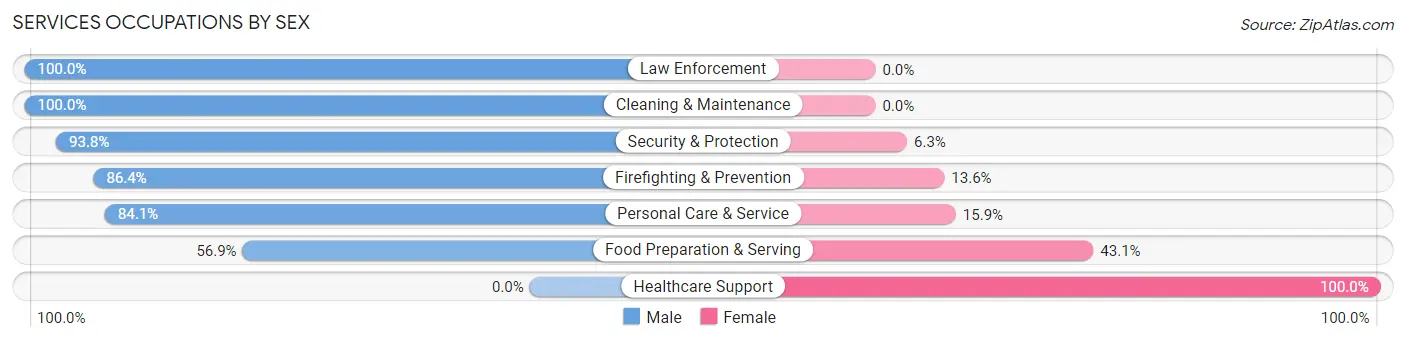
| Occupation | Male | Female |
| Healthcare Support | 0 (0.0%) | 4 (100.0%) |
| Security & Protection | 45 (93.8%) | 3 (6.2%) |
| Firefighting & Prevention | 19 (86.4%) | 3 (13.6%) |
| Law Enforcement | 26 (100.0%) | 0 (0.0%) |
| Food Preparation & Serving | 29 (56.9%) | 22 (43.1%) |
| Cleaning & Maintenance | 73 (100.0%) | 0 (0.0%) |
| Personal Care & Service | 37 (84.1%) | 7 (15.9%) |
| Total (Category) | 184 (83.6%) | 36 (16.4%) |
| Total (Overall) | 1,399 (60.9%) | 899 (39.1%) |
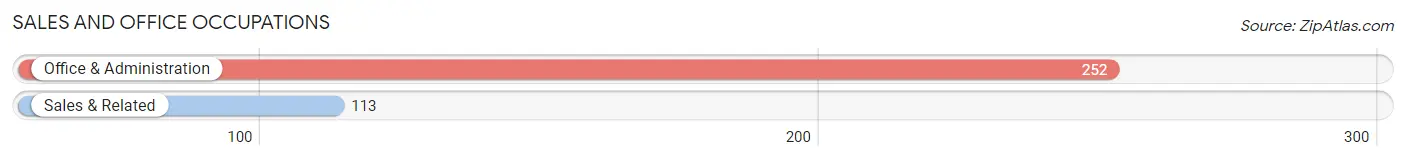
Sales and Office Occupations
The most common Sales and Office occupations in Northvale borough are Office & Administration (252 | 11.0%), and Sales & Related (113 | 4.9%).
Sales and Office Occupations by Sex
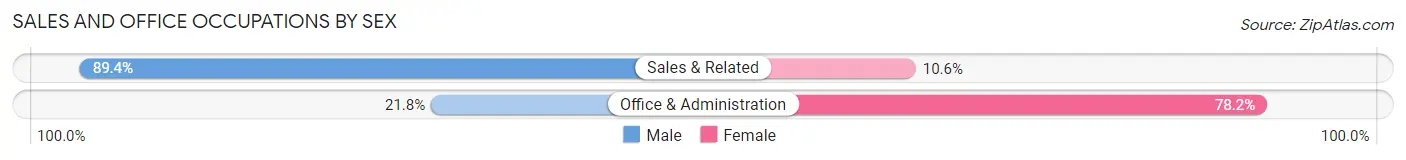
| Occupation | Male | Female |
| Sales & Related | 101 (89.4%) | 12 (10.6%) |
| Office & Administration | 55 (21.8%) | 197 (78.2%) |
| Total (Category) | 156 (42.7%) | 209 (57.3%) |
| Total (Overall) | 1,399 (60.9%) | 899 (39.1%) |
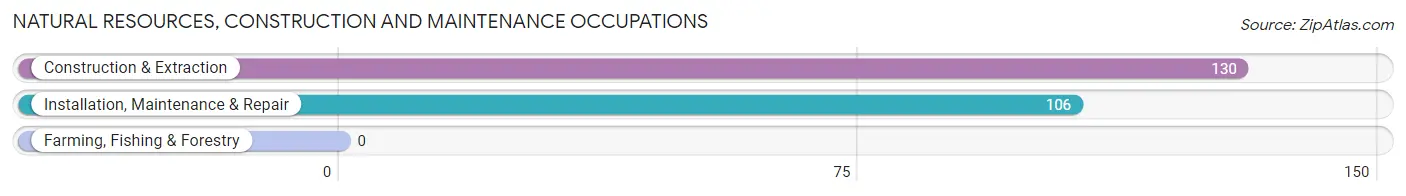
Natural Resources, Construction and Maintenance Occupations
The most common Natural Resources, Construction and Maintenance occupations in Northvale borough are Construction & Extraction (130 | 5.7%), and Installation, Maintenance & Repair (106 | 4.6%).
Natural Resources, Construction and Maintenance Occupations by Sex
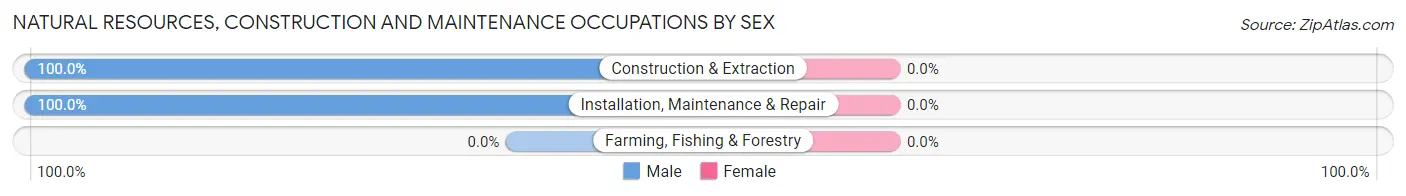
| Occupation | Male | Female |
| Farming, Fishing & Forestry | 0 (0.0%) | 0 (0.0%) |
| Construction & Extraction | 130 (100.0%) | 0 (0.0%) |
| Installation, Maintenance & Repair | 106 (100.0%) | 0 (0.0%) |
| Total (Category) | 236 (100.0%) | 0 (0.0%) |
| Total (Overall) | 1,399 (60.9%) | 899 (39.1%) |
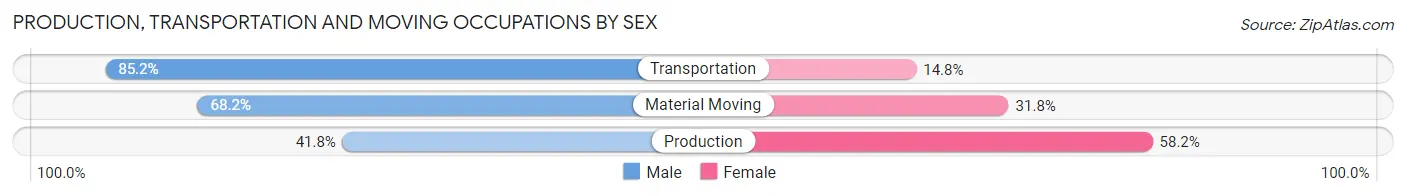
Production, Transportation and Moving Occupations
The most common Production, Transportation and Moving occupations in Northvale borough are Material Moving (85 | 3.7%), Production (55 | 2.4%), and Transportation (54 | 2.4%).
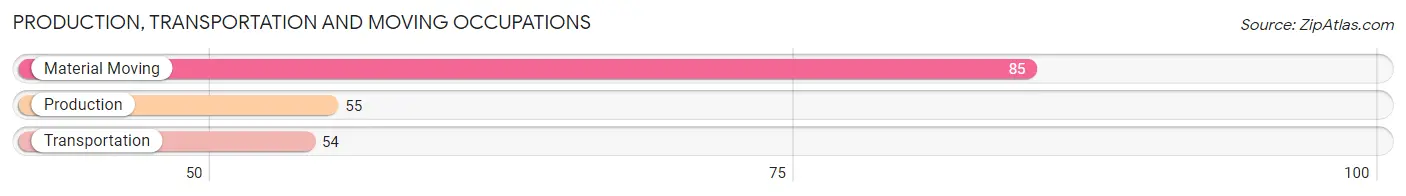
Production, Transportation and Moving Occupations by Sex
| Occupation | Male | Female |
| Production | 23 (41.8%) | 32 (58.2%) |
| Transportation | 46 (85.2%) | 8 (14.8%) |
| Material Moving | 58 (68.2%) | 27 (31.8%) |
| Total (Category) | 127 (65.5%) | 67 (34.5%) |
| Total (Overall) | 1,399 (60.9%) | 899 (39.1%) |
Employment Industries by Sex in Northvale borough
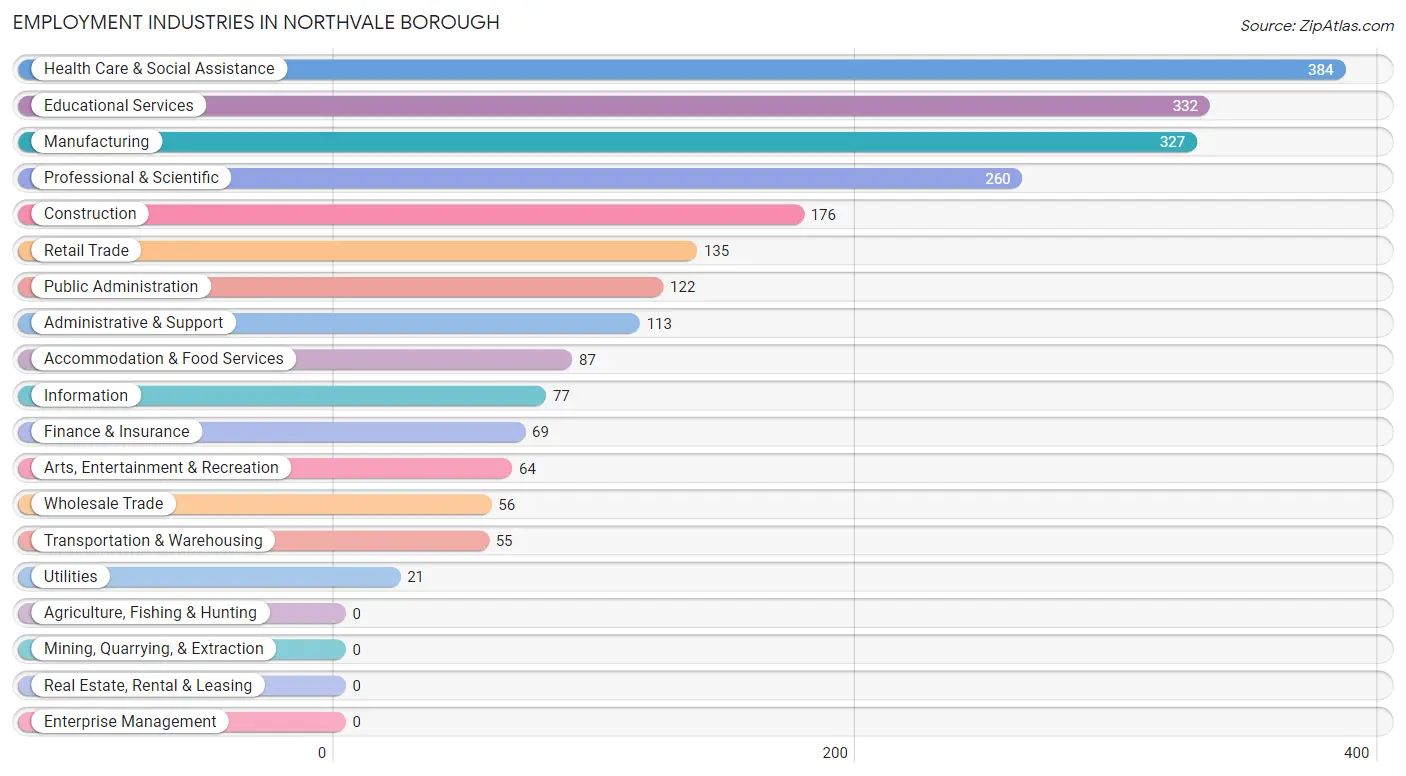
Employment Industries in Northvale borough
The major employment industries in Northvale borough include Health Care & Social Assistance (384 | 16.7%), Educational Services (332 | 14.4%), Manufacturing (327 | 14.2%), Professional & Scientific (260 | 11.3%), and Construction (176 | 7.7%).
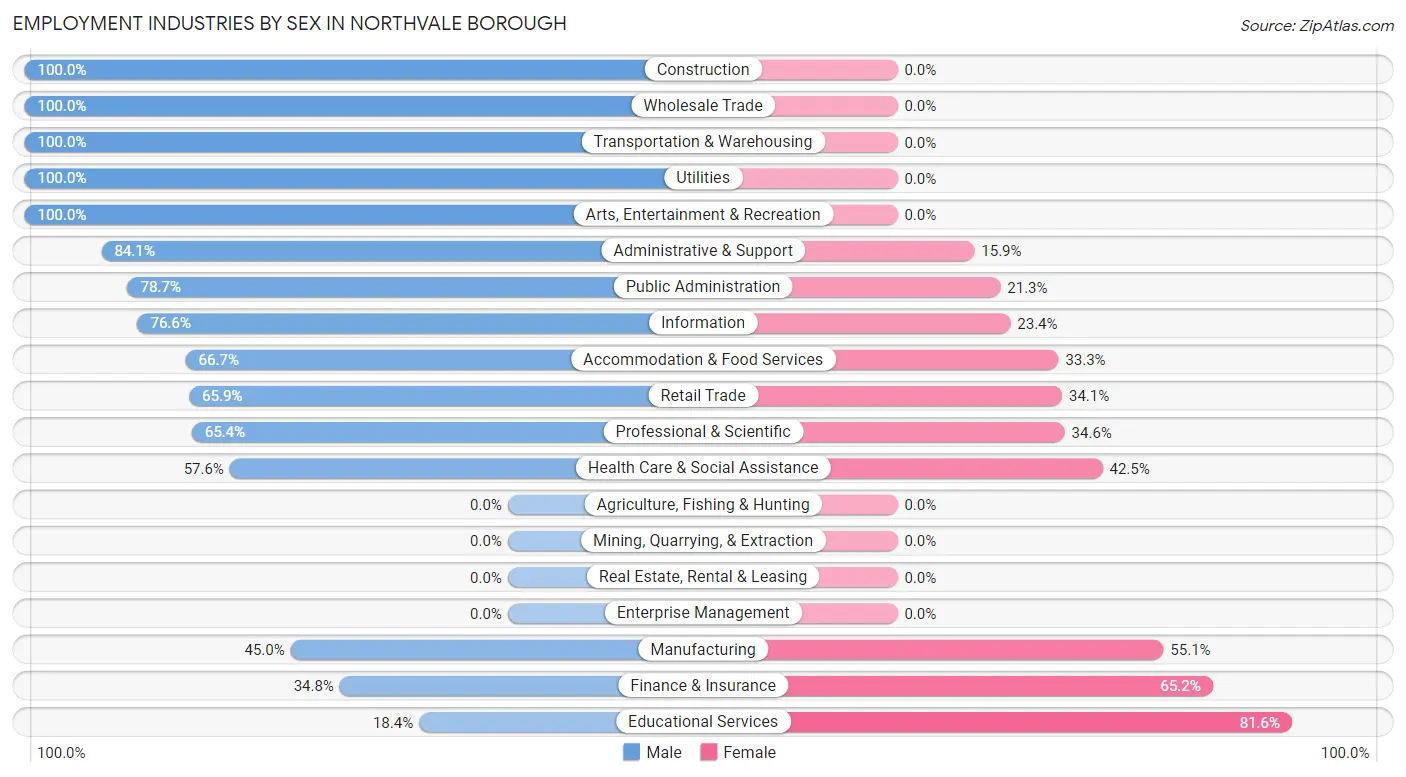
Employment Industries by Sex in Northvale borough
The Northvale borough industries that see more men than women are Construction (100.0%), Wholesale Trade (100.0%), and Transportation & Warehousing (100.0%), whereas the industries that tend to have a higher number of women are Educational Services (81.6%), Finance & Insurance (65.2%), and Manufacturing (55.0%).
| Industry | Male | Female |
| Agriculture, Fishing & Hunting | 0 (0.0%) | 0 (0.0%) |
| Mining, Quarrying, & Extraction | 0 (0.0%) | 0 (0.0%) |
| Construction | 176 (100.0%) | 0 (0.0%) |
| Manufacturing | 147 (45.0%) | 180 (55.0%) |
| Wholesale Trade | 56 (100.0%) | 0 (0.0%) |
| Retail Trade | 89 (65.9%) | 46 (34.1%) |
| Transportation & Warehousing | 55 (100.0%) | 0 (0.0%) |
| Utilities | 21 (100.0%) | 0 (0.0%) |
| Information | 59 (76.6%) | 18 (23.4%) |
| Finance & Insurance | 24 (34.8%) | 45 (65.2%) |
| Real Estate, Rental & Leasing | 0 (0.0%) | 0 (0.0%) |
| Professional & Scientific | 170 (65.4%) | 90 (34.6%) |
| Enterprise Management | 0 (0.0%) | 0 (0.0%) |
| Administrative & Support | 95 (84.1%) | 18 (15.9%) |
| Educational Services | 61 (18.4%) | 271 (81.6%) |
| Health Care & Social Assistance | 221 (57.6%) | 163 (42.4%) |
| Arts, Entertainment & Recreation | 64 (100.0%) | 0 (0.0%) |
| Accommodation & Food Services | 58 (66.7%) | 29 (33.3%) |
| Public Administration | 96 (78.7%) | 26 (21.3%) |
| Total | 1,399 (60.9%) | 899 (39.1%) |
Education in Northvale borough
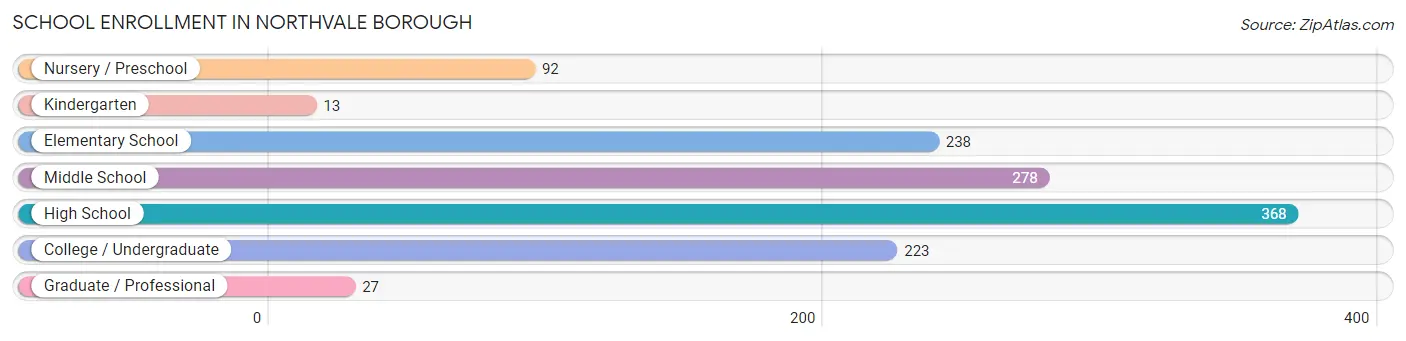
School Enrollment in Northvale borough
The most common levels of schooling among the 1,239 students in Northvale borough are high school (368 | 29.7%), middle school (278 | 22.4%), and elementary school (238 | 19.2%).
| School Level | # Students | % Students |
| Nursery / Preschool | 92 | 7.4% |
| Kindergarten | 13 | 1.1% |
| Elementary School | 238 | 19.2% |
| Middle School | 278 | 22.4% |
| High School | 368 | 29.7% |
| College / Undergraduate | 223 | 18.0% |
| Graduate / Professional | 27 | 2.2% |
| Total | 1,239 | 100.0% |
School Enrollment by Age by Funding Source in Northvale borough
Out of a total of 1,239 students who are enrolled in schools in Northvale borough, 264 (21.3%) attend a private institution, while the remaining 975 (78.7%) are enrolled in public schools. The age group of 25 to 34 year olds has the highest likelihood of being enrolled in private schools, with 37 (69.8% in the age bracket) enrolled. Conversely, the age group of 10 to 14 year olds has the lowest likelihood of being enrolled in a private school, with 301 (94.4% in the age bracket) attending a public institution.
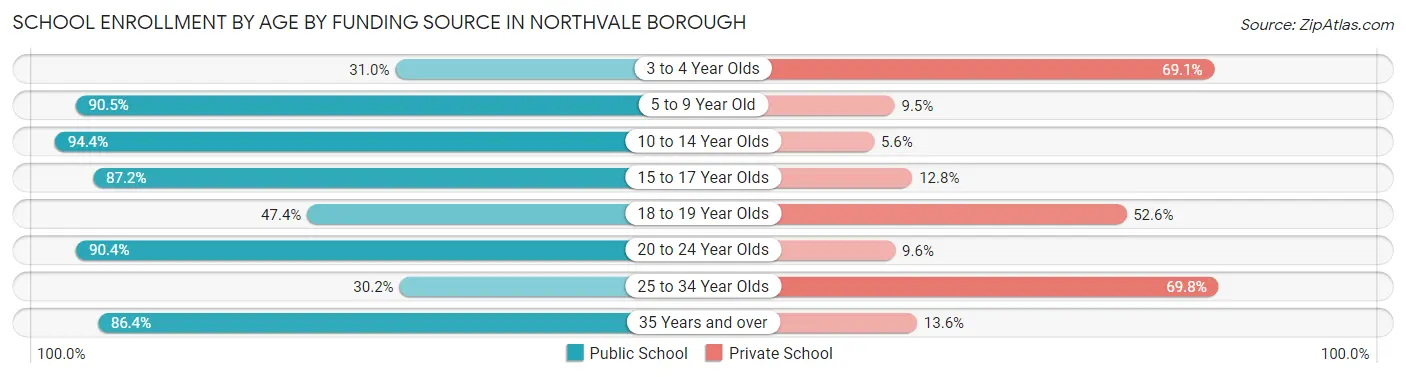
| Age Bracket | Public School | Private School |
| 3 to 4 Year Olds | 26 (30.9%) | 58 (69.1%) |
| 5 to 9 Year Old | 210 (90.5%) | 22 (9.5%) |
| 10 to 14 Year Olds | 301 (94.4%) | 18 (5.6%) |
| 15 to 17 Year Olds | 246 (87.2%) | 36 (12.8%) |
| 18 to 19 Year Olds | 72 (47.4%) | 80 (52.6%) |
| 20 to 24 Year Olds | 66 (90.4%) | 7 (9.6%) |
| 25 to 34 Year Olds | 16 (30.2%) | 37 (69.8%) |
| 35 Years and over | 38 (86.4%) | 6 (13.6%) |
| Total | 975 (78.7%) | 264 (21.3%) |
Educational Attainment by Field of Study in Northvale borough
Business (382 | 19.2%), education (273 | 13.7%), liberal arts & history (201 | 10.1%), social sciences (181 | 9.1%), and physical & health sciences (140 | 7.0%) are the most common fields of study among 1,991 individuals in Northvale borough who have obtained a bachelor's degree or higher.
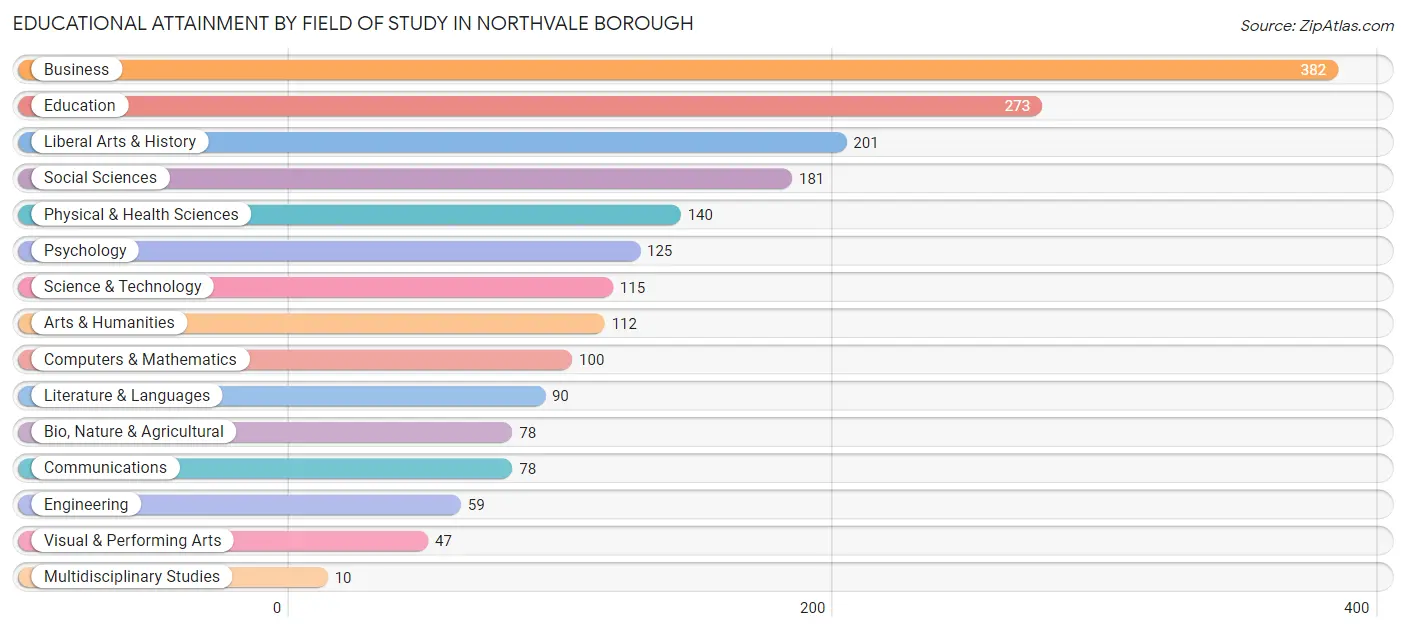
| Field of Study | # Graduates | % Graduates |
| Computers & Mathematics | 100 | 5.0% |
| Bio, Nature & Agricultural | 78 | 3.9% |
| Physical & Health Sciences | 140 | 7.0% |
| Psychology | 125 | 6.3% |
| Social Sciences | 181 | 9.1% |
| Engineering | 59 | 3.0% |
| Multidisciplinary Studies | 10 | 0.5% |
| Science & Technology | 115 | 5.8% |
| Business | 382 | 19.2% |
| Education | 273 | 13.7% |
| Literature & Languages | 90 | 4.5% |
| Liberal Arts & History | 201 | 10.1% |
| Visual & Performing Arts | 47 | 2.4% |
| Communications | 78 | 3.9% |
| Arts & Humanities | 112 | 5.6% |
| Total | 1,991 | 100.0% |
Transportation & Commute in Northvale borough
Vehicle Availability by Sex in Northvale borough
The most prevalent vehicle ownership categories in Northvale borough are males with 2 vehicles (694, accounting for 50.2%) and females with 2 vehicles (409, making up 84.4%).
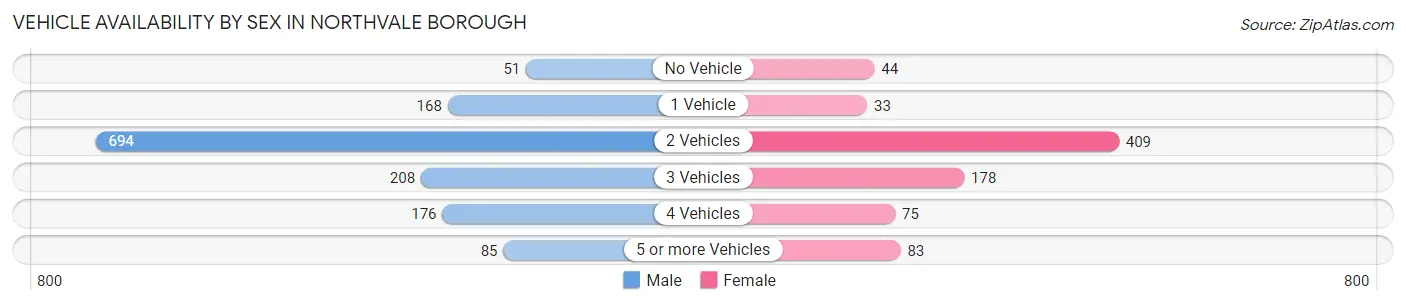
| Vehicles Available | Male | Female |
| No Vehicle | 51 (3.7%) | 44 (5.3%) |
| 1 Vehicle | 168 (12.2%) | 33 (4.0%) |
| 2 Vehicles | 694 (50.2%) | 409 (49.8%) |
| 3 Vehicles | 208 (15.0%) | 178 (21.6%) |
| 4 Vehicles | 176 (12.7%) | 75 (9.1%) |
| 5 or more Vehicles | 85 (6.1%) | 83 (10.1%) |
| Total | 1,382 (100.0%) | 822 (100.0%) |
Commute Time in Northvale borough
The most frequently occuring commute durations in Northvale borough are 10 to 14 minutes (284 commuters, 14.3%), 60 to 89 minutes (256 commuters, 12.9%), and 45 to 59 minutes (238 commuters, 12.0%).
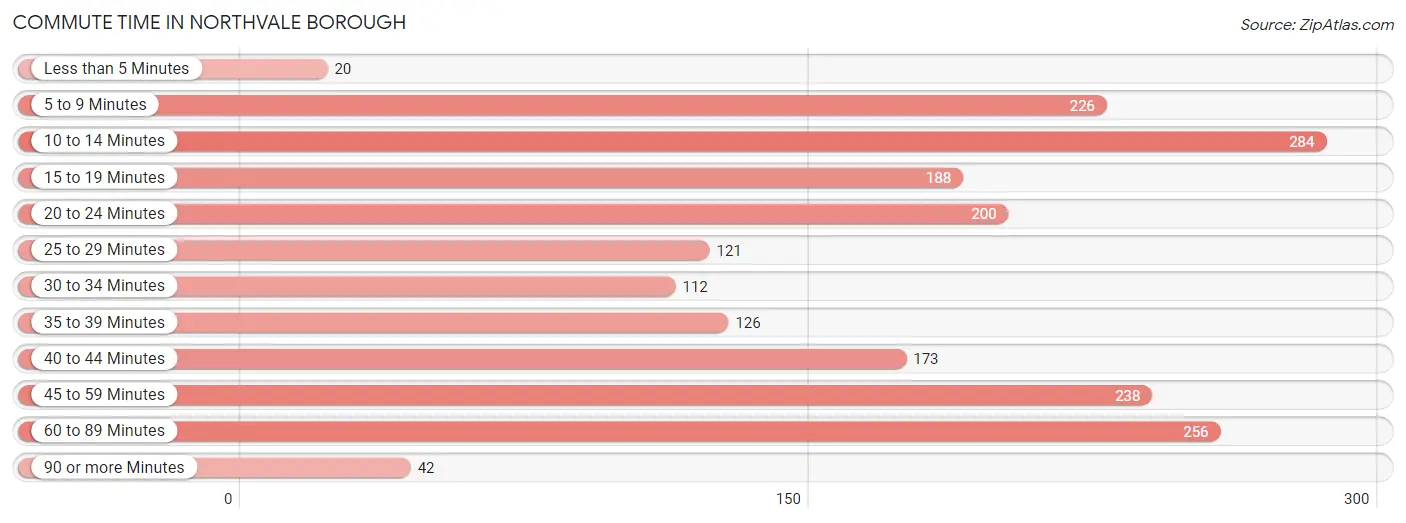
| Commute Time | # Commuters | % Commuters |
| Less than 5 Minutes | 20 | 1.0% |
| 5 to 9 Minutes | 226 | 11.4% |
| 10 to 14 Minutes | 284 | 14.3% |
| 15 to 19 Minutes | 188 | 9.5% |
| 20 to 24 Minutes | 200 | 10.1% |
| 25 to 29 Minutes | 121 | 6.1% |
| 30 to 34 Minutes | 112 | 5.6% |
| 35 to 39 Minutes | 126 | 6.3% |
| 40 to 44 Minutes | 173 | 8.7% |
| 45 to 59 Minutes | 238 | 12.0% |
| 60 to 89 Minutes | 256 | 12.9% |
| 90 or more Minutes | 42 | 2.1% |
Commute Time by Sex in Northvale borough
The most common commute times in Northvale borough are 10 to 14 minutes (201 commuters, 16.2%) for males and 5 to 9 minutes (116 commuters, 15.5%) for females.
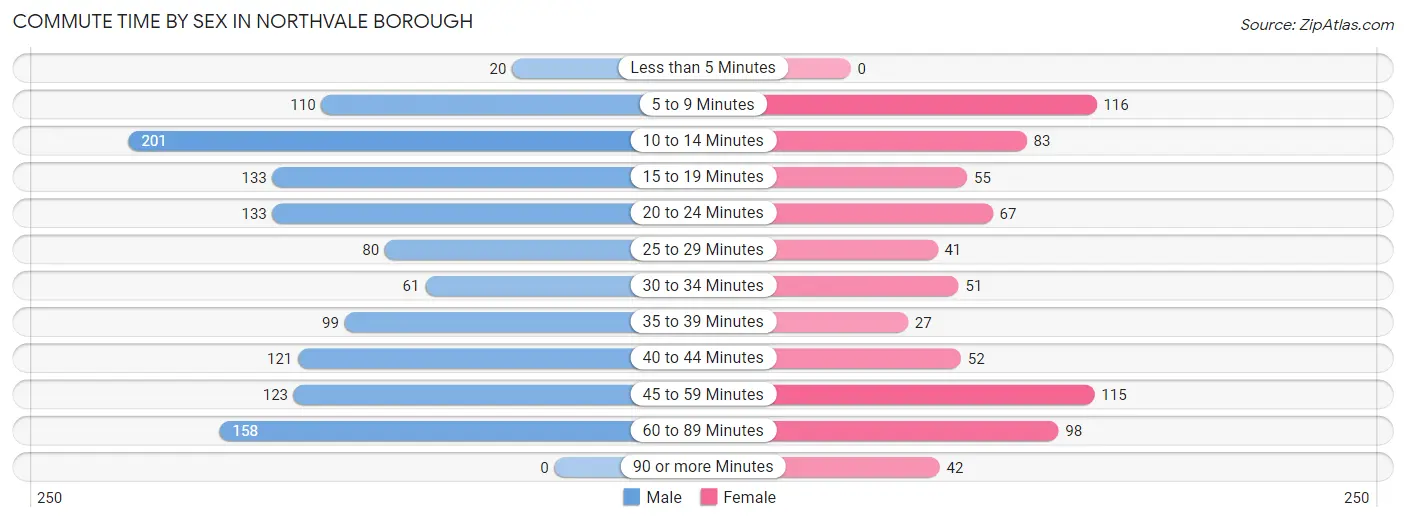
| Commute Time | Male | Female |
| Less than 5 Minutes | 20 (1.6%) | 0 (0.0%) |
| 5 to 9 Minutes | 110 (8.9%) | 116 (15.5%) |
| 10 to 14 Minutes | 201 (16.2%) | 83 (11.1%) |
| 15 to 19 Minutes | 133 (10.7%) | 55 (7.4%) |
| 20 to 24 Minutes | 133 (10.7%) | 67 (9.0%) |
| 25 to 29 Minutes | 80 (6.5%) | 41 (5.5%) |
| 30 to 34 Minutes | 61 (4.9%) | 51 (6.8%) |
| 35 to 39 Minutes | 99 (8.0%) | 27 (3.6%) |
| 40 to 44 Minutes | 121 (9.8%) | 52 (7.0%) |
| 45 to 59 Minutes | 123 (9.9%) | 115 (15.4%) |
| 60 to 89 Minutes | 158 (12.8%) | 98 (13.1%) |
| 90 or more Minutes | 0 (0.0%) | 42 (5.6%) |
Time of Departure to Work by Sex in Northvale borough
The most frequent times of departure to work in Northvale borough are 8:00 AM to 8:29 AM (297, 24.0%) for males and 8:00 AM to 8:29 AM (208, 27.8%) for females.
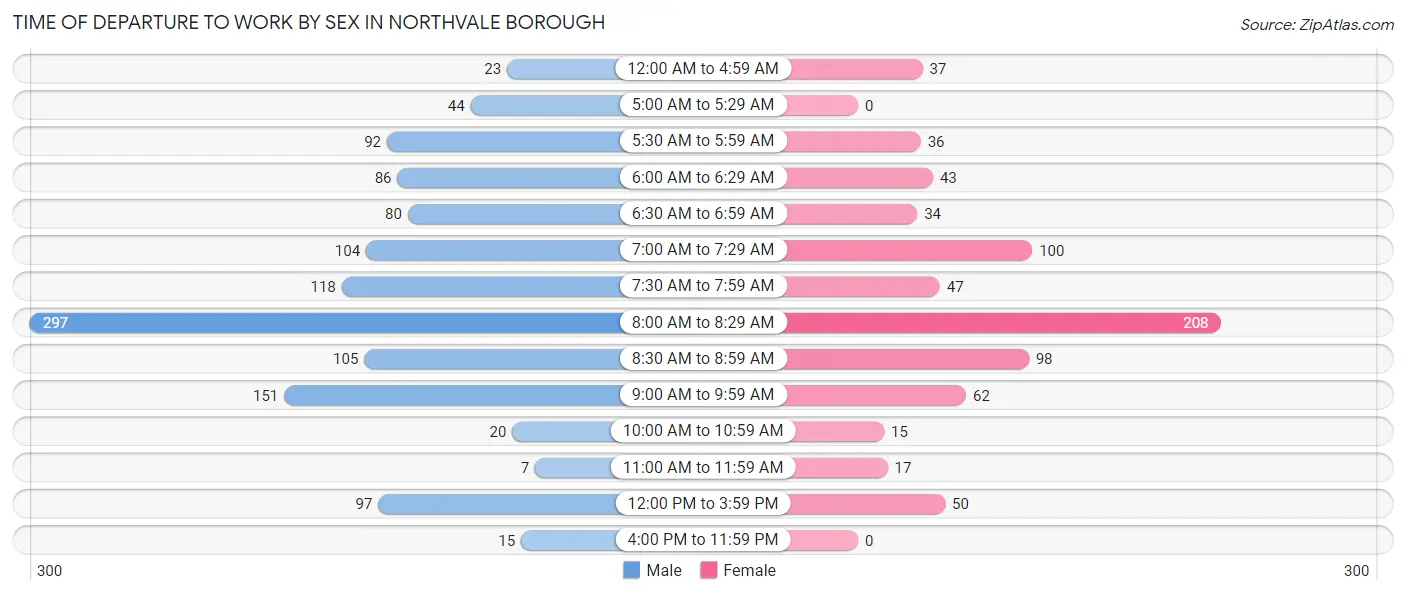
| Time of Departure | Male | Female |
| 12:00 AM to 4:59 AM | 23 (1.9%) | 37 (5.0%) |
| 5:00 AM to 5:29 AM | 44 (3.5%) | 0 (0.0%) |
| 5:30 AM to 5:59 AM | 92 (7.4%) | 36 (4.8%) |
| 6:00 AM to 6:29 AM | 86 (6.9%) | 43 (5.8%) |
| 6:30 AM to 6:59 AM | 80 (6.5%) | 34 (4.5%) |
| 7:00 AM to 7:29 AM | 104 (8.4%) | 100 (13.4%) |
| 7:30 AM to 7:59 AM | 118 (9.5%) | 47 (6.3%) |
| 8:00 AM to 8:29 AM | 297 (24.0%) | 208 (27.8%) |
| 8:30 AM to 8:59 AM | 105 (8.5%) | 98 (13.1%) |
| 9:00 AM to 9:59 AM | 151 (12.2%) | 62 (8.3%) |
| 10:00 AM to 10:59 AM | 20 (1.6%) | 15 (2.0%) |
| 11:00 AM to 11:59 AM | 7 (0.6%) | 17 (2.3%) |
| 12:00 PM to 3:59 PM | 97 (7.8%) | 50 (6.7%) |
| 4:00 PM to 11:59 PM | 15 (1.2%) | 0 (0.0%) |
| Total | 1,239 (100.0%) | 747 (100.0%) |
Housing Occupancy in Northvale borough
Occupancy by Ownership in Northvale borough
Of the total 1,626 dwellings in Northvale borough, owner-occupied units account for 1,277 (78.5%), while renter-occupied units make up 349 (21.5%).
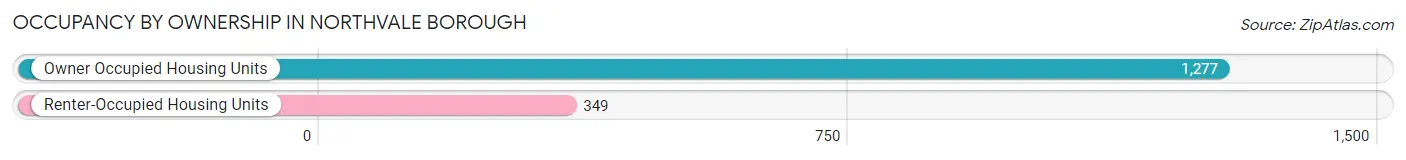
| Occupancy | # Housing Units | % Housing Units |
| Owner Occupied Housing Units | 1,277 | 78.5% |
| Renter-Occupied Housing Units | 349 | 21.5% |
| Total Occupied Housing Units | 1,626 | 100.0% |
Occupancy by Household Size in Northvale borough

| Household Size | # Housing Units | % Housing Units |
| 1-Person Household | 163 | 10.0% |
| 2-Person Household | 567 | 34.9% |
| 3-Person Household | 173 | 10.6% |
| 4+ Person Household | 723 | 44.5% |
| Total Housing Units | 1,626 | 100.0% |
Occupancy by Ownership by Household Size in Northvale borough
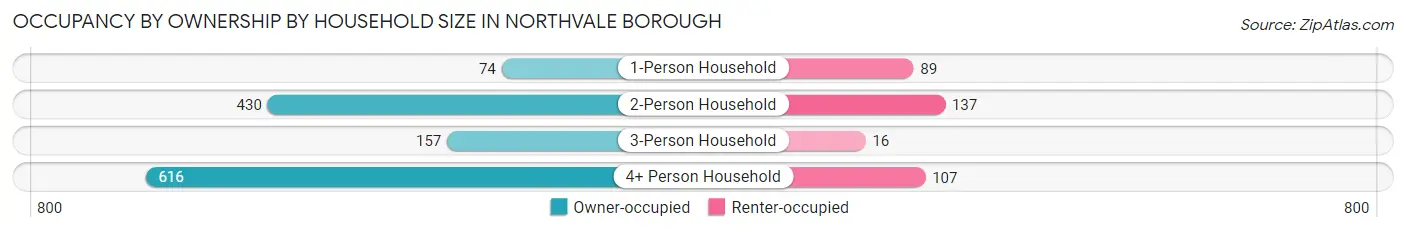
| Household Size | Owner-occupied | Renter-occupied |
| 1-Person Household | 74 (45.4%) | 89 (54.6%) |
| 2-Person Household | 430 (75.8%) | 137 (24.2%) |
| 3-Person Household | 157 (90.7%) | 16 (9.2%) |
| 4+ Person Household | 616 (85.2%) | 107 (14.8%) |
| Total Housing Units | 1,277 (78.5%) | 349 (21.5%) |
Occupancy by Educational Attainment in Northvale borough
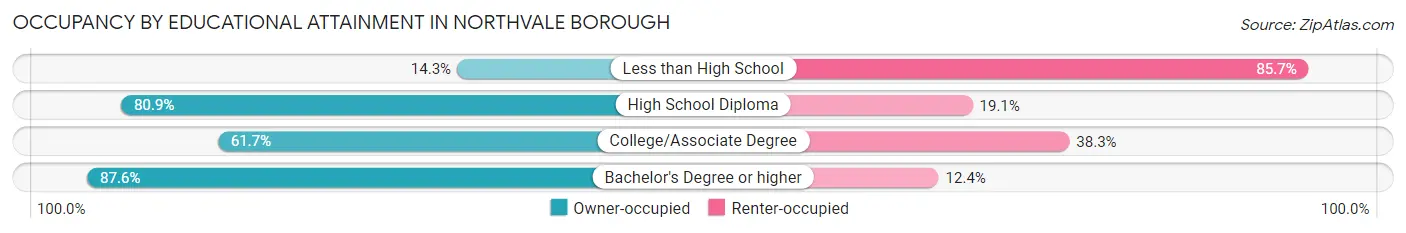
| Household Size | Owner-occupied | Renter-occupied |
| Less than High School | 12 (14.3%) | 72 (85.7%) |
| High School Diploma | 220 (80.9%) | 52 (19.1%) |
| College/Associate Degree | 161 (61.7%) | 100 (38.3%) |
| Bachelor's Degree or higher | 884 (87.6%) | 125 (12.4%) |
Occupancy by Age of Householder in Northvale borough
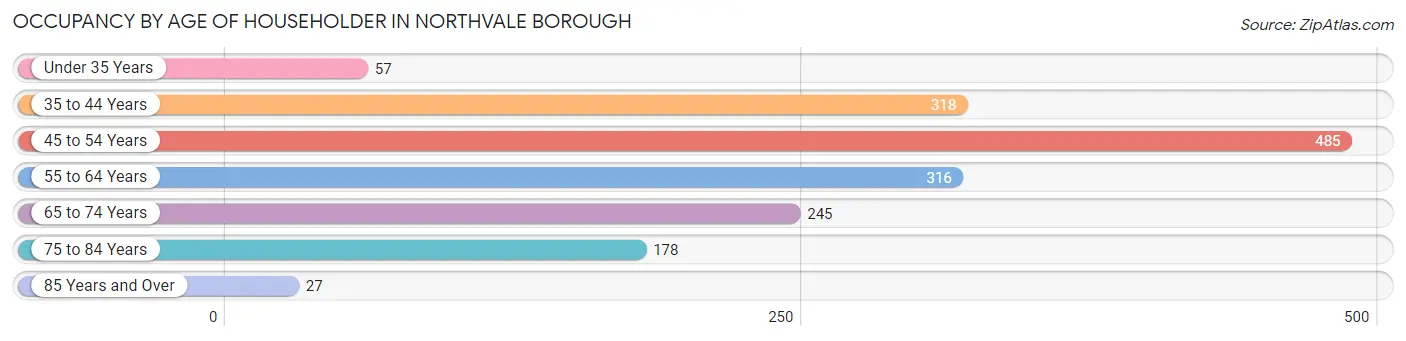
| Age Bracket | # Households | % Households |
| Under 35 Years | 57 | 3.5% |
| 35 to 44 Years | 318 | 19.6% |
| 45 to 54 Years | 485 | 29.8% |
| 55 to 64 Years | 316 | 19.4% |
| 65 to 74 Years | 245 | 15.1% |
| 75 to 84 Years | 178 | 11.0% |
| 85 Years and Over | 27 | 1.7% |
| Total | 1,626 | 100.0% |
Housing Finances in Northvale borough
Median Income by Occupancy in Northvale borough
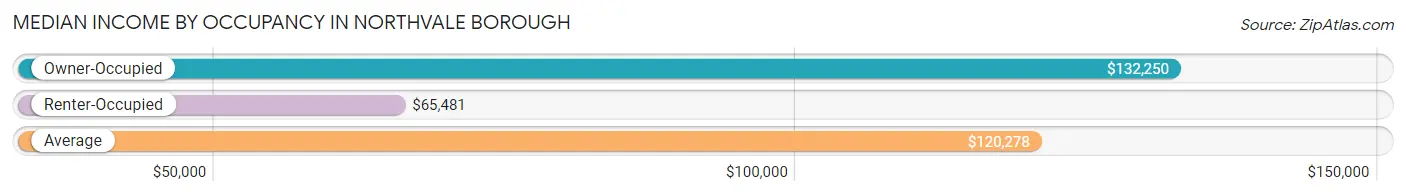
| Occupancy Type | # Households | Median Income |
| Owner-Occupied | 1,277 (78.5%) | $132,250 |
| Renter-Occupied | 349 (21.5%) | $65,481 |
| Average | 1,626 (100.0%) | $120,278 |
Occupancy by Householder Income Bracket in Northvale borough
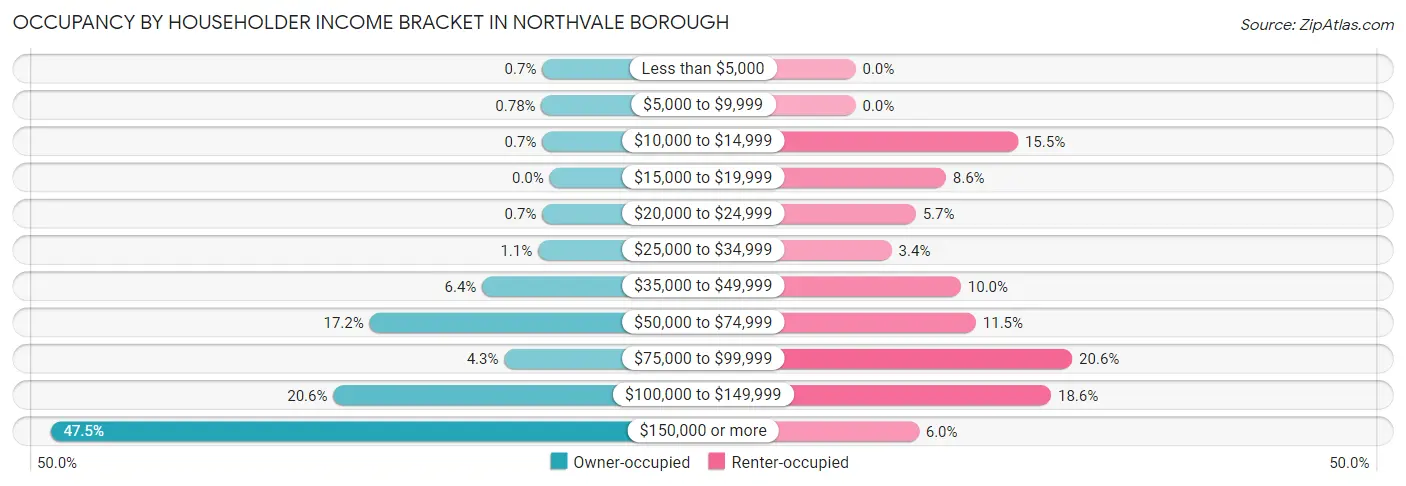
| Income Bracket | Owner-occupied | Renter-occupied |
| Less than $5,000 | 9 (0.7%) | 0 (0.0%) |
| $5,000 to $9,999 | 10 (0.8%) | 0 (0.0%) |
| $10,000 to $14,999 | 9 (0.7%) | 54 (15.5%) |
| $15,000 to $19,999 | 0 (0.0%) | 30 (8.6%) |
| $20,000 to $24,999 | 9 (0.7%) | 20 (5.7%) |
| $25,000 to $34,999 | 14 (1.1%) | 12 (3.4%) |
| $35,000 to $49,999 | 82 (6.4%) | 35 (10.0%) |
| $50,000 to $74,999 | 219 (17.2%) | 40 (11.5%) |
| $75,000 to $99,999 | 55 (4.3%) | 72 (20.6%) |
| $100,000 to $149,999 | 263 (20.6%) | 65 (18.6%) |
| $150,000 or more | 607 (47.5%) | 21 (6.0%) |
| Total | 1,277 (100.0%) | 349 (100.0%) |
Monthly Housing Cost Tiers in Northvale borough
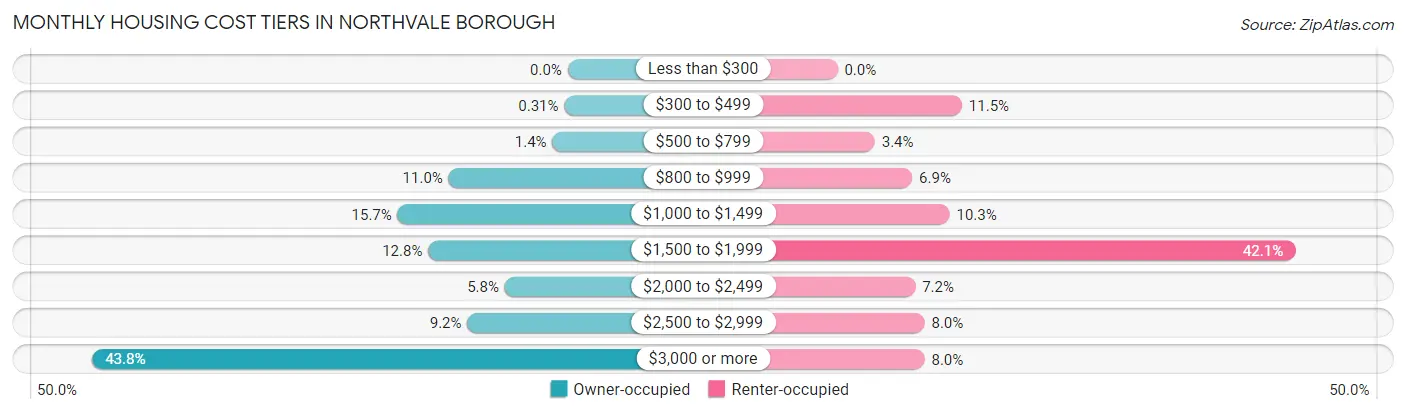
| Monthly Cost | Owner-occupied | Renter-occupied |
| Less than $300 | 0 (0.0%) | 0 (0.0%) |
| $300 to $499 | 4 (0.3%) | 40 (11.5%) |
| $500 to $799 | 18 (1.4%) | 12 (3.4%) |
| $800 to $999 | 140 (11.0%) | 24 (6.9%) |
| $1,000 to $1,499 | 200 (15.7%) | 36 (10.3%) |
| $1,500 to $1,999 | 164 (12.8%) | 147 (42.1%) |
| $2,000 to $2,499 | 74 (5.8%) | 25 (7.2%) |
| $2,500 to $2,999 | 118 (9.2%) | 28 (8.0%) |
| $3,000 or more | 559 (43.8%) | 28 (8.0%) |
| Total | 1,277 (100.0%) | 349 (100.0%) |
Physical Housing Characteristics in Northvale borough
Housing Structures in Northvale borough
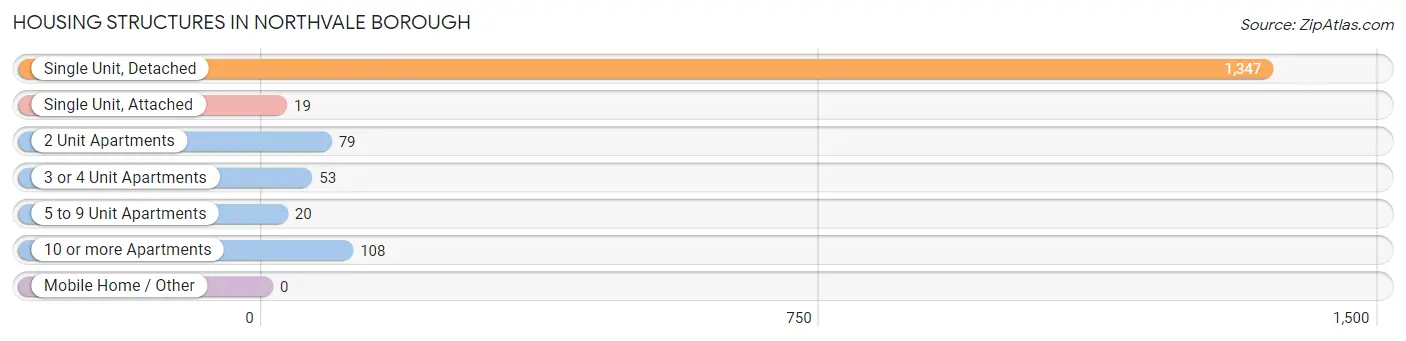
| Structure Type | # Housing Units | % Housing Units |
| Single Unit, Detached | 1,347 | 82.8% |
| Single Unit, Attached | 19 | 1.2% |
| 2 Unit Apartments | 79 | 4.9% |
| 3 or 4 Unit Apartments | 53 | 3.3% |
| 5 to 9 Unit Apartments | 20 | 1.2% |
| 10 or more Apartments | 108 | 6.6% |
| Mobile Home / Other | 0 | 0.0% |
| Total | 1,626 | 100.0% |
Housing Structures by Occupancy in Northvale borough
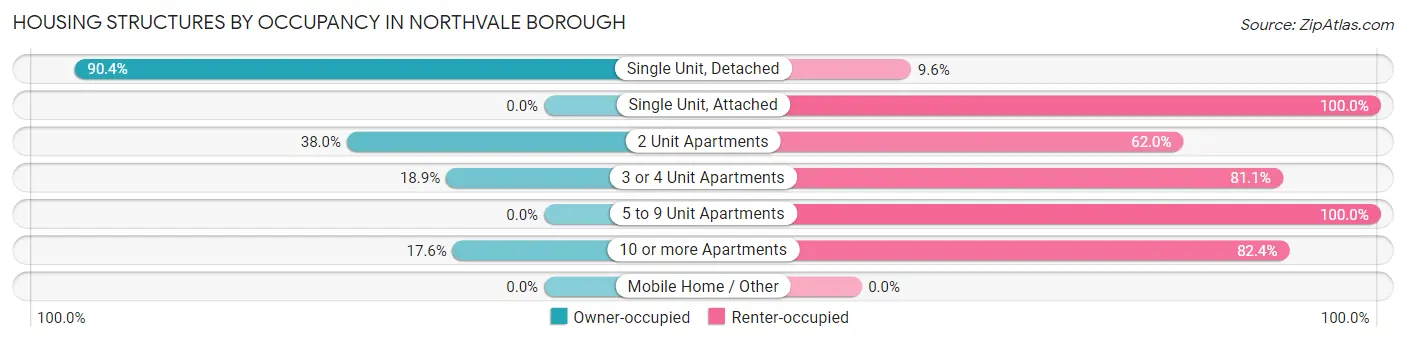
| Structure Type | Owner-occupied | Renter-occupied |
| Single Unit, Detached | 1,218 (90.4%) | 129 (9.6%) |
| Single Unit, Attached | 0 (0.0%) | 19 (100.0%) |
| 2 Unit Apartments | 30 (38.0%) | 49 (62.0%) |
| 3 or 4 Unit Apartments | 10 (18.9%) | 43 (81.1%) |
| 5 to 9 Unit Apartments | 0 (0.0%) | 20 (100.0%) |
| 10 or more Apartments | 19 (17.6%) | 89 (82.4%) |
| Mobile Home / Other | 0 (0.0%) | 0 (0.0%) |
| Total | 1,277 (78.5%) | 349 (21.5%) |
Housing Structures by Number of Rooms in Northvale borough
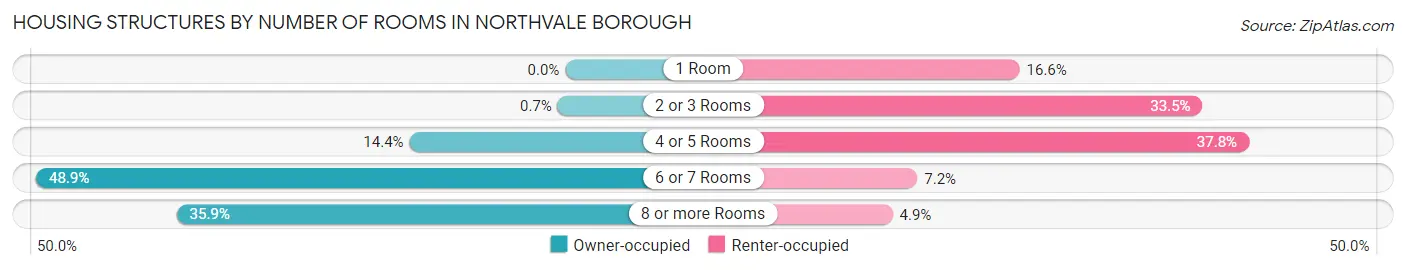
| Number of Rooms | Owner-occupied | Renter-occupied |
| 1 Room | 0 (0.0%) | 58 (16.6%) |
| 2 or 3 Rooms | 9 (0.7%) | 117 (33.5%) |
| 4 or 5 Rooms | 184 (14.4%) | 132 (37.8%) |
| 6 or 7 Rooms | 625 (48.9%) | 25 (7.2%) |
| 8 or more Rooms | 459 (35.9%) | 17 (4.9%) |
| Total | 1,277 (100.0%) | 349 (100.0%) |
Housing Structure by Heating Type in Northvale borough
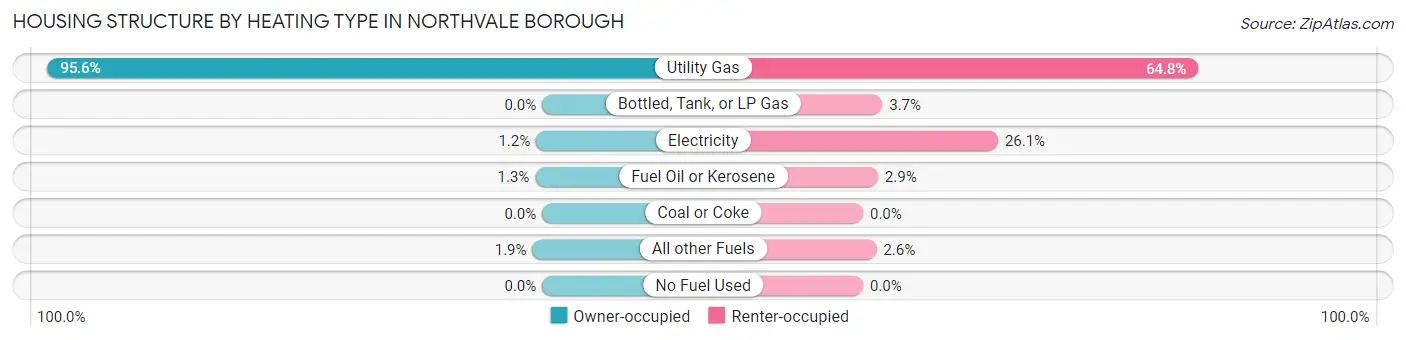
| Heating Type | Owner-occupied | Renter-occupied |
| Utility Gas | 1,221 (95.6%) | 226 (64.8%) |
| Bottled, Tank, or LP Gas | 0 (0.0%) | 13 (3.7%) |
| Electricity | 15 (1.2%) | 91 (26.1%) |
| Fuel Oil or Kerosene | 17 (1.3%) | 10 (2.9%) |
| Coal or Coke | 0 (0.0%) | 0 (0.0%) |
| All other Fuels | 24 (1.9%) | 9 (2.6%) |
| No Fuel Used | 0 (0.0%) | 0 (0.0%) |
| Total | 1,277 (100.0%) | 349 (100.0%) |
Household Vehicle Usage in Northvale borough
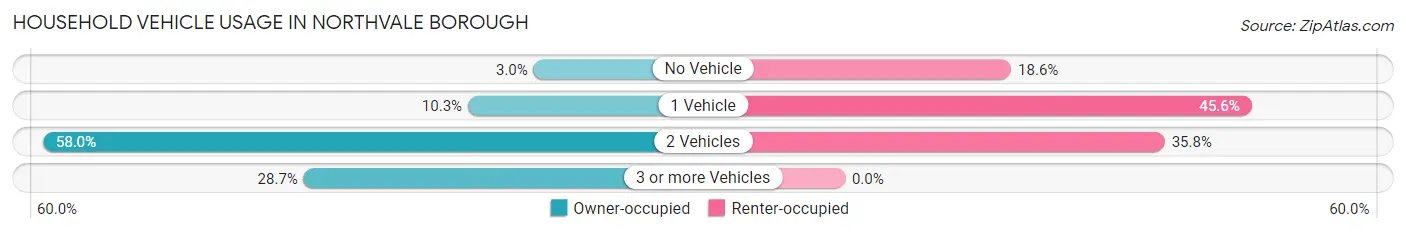
| Vehicles per Household | Owner-occupied | Renter-occupied |
| No Vehicle | 38 (3.0%) | 65 (18.6%) |
| 1 Vehicle | 132 (10.3%) | 159 (45.6%) |
| 2 Vehicles | 740 (58.0%) | 125 (35.8%) |
| 3 or more Vehicles | 367 (28.7%) | 0 (0.0%) |
| Total | 1,277 (100.0%) | 349 (100.0%) |
Real Estate & Mortgages in Northvale borough
Real Estate and Mortgage Overview in Northvale borough
| Characteristic | Without Mortgage | With Mortgage |
| Housing Units | 414 | 863 |
| Median Property Value | $539,200 | $543,300 |
| Median Household Income | $78,889 | $517 |
| Monthly Housing Costs | $1,382 | $559 |
| Real Estate Taxes | $10,001 | $6 |
Property Value by Mortgage Status in Northvale borough
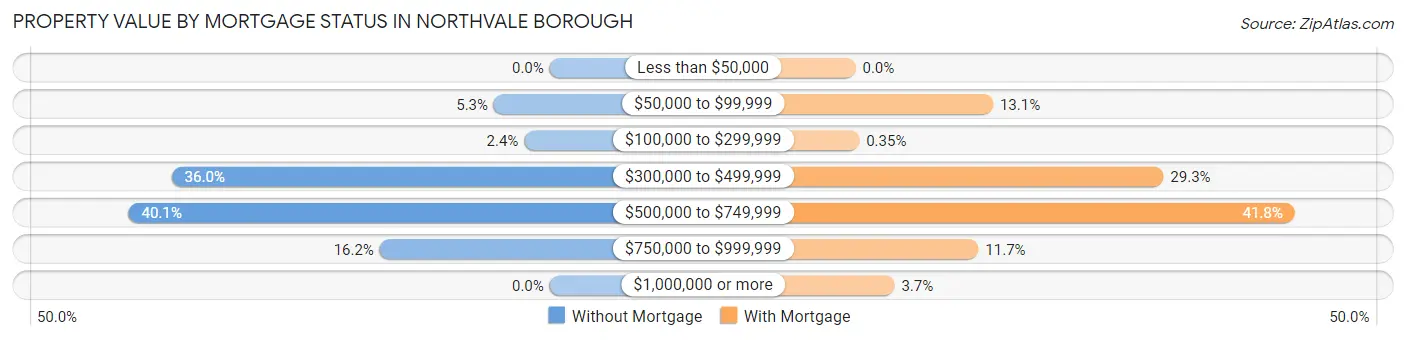
| Property Value | Without Mortgage | With Mortgage |
| Less than $50,000 | 0 (0.0%) | 0 (0.0%) |
| $50,000 to $99,999 | 22 (5.3%) | 113 (13.1%) |
| $100,000 to $299,999 | 10 (2.4%) | 3 (0.4%) |
| $300,000 to $499,999 | 149 (36.0%) | 253 (29.3%) |
| $500,000 to $749,999 | 166 (40.1%) | 361 (41.8%) |
| $750,000 to $999,999 | 67 (16.2%) | 101 (11.7%) |
| $1,000,000 or more | 0 (0.0%) | 32 (3.7%) |
| Total | 414 (100.0%) | 863 (100.0%) |
Household Income by Mortgage Status in Northvale borough
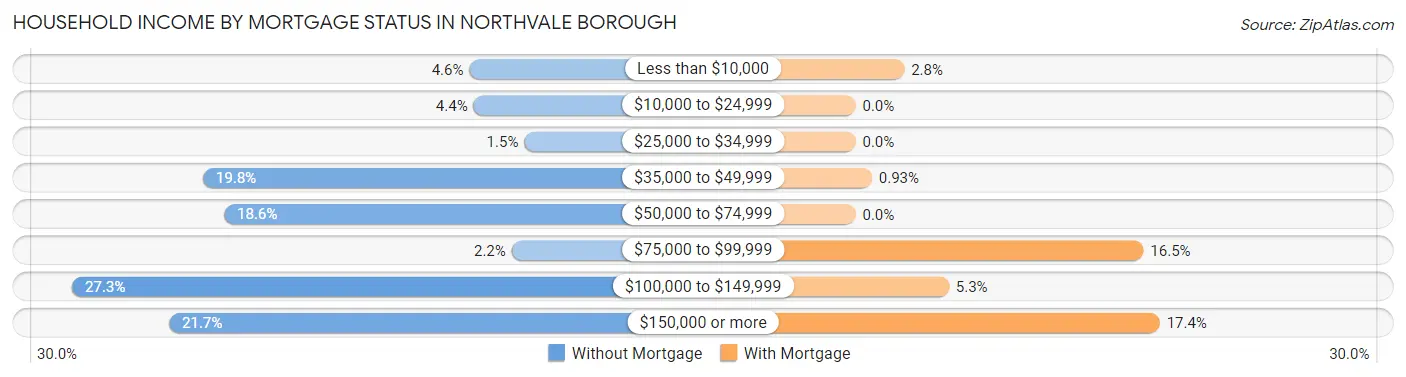
| Household Income | Without Mortgage | With Mortgage |
| Less than $10,000 | 19 (4.6%) | 24 (2.8%) |
| $10,000 to $24,999 | 18 (4.3%) | 0 (0.0%) |
| $25,000 to $34,999 | 6 (1.5%) | 0 (0.0%) |
| $35,000 to $49,999 | 82 (19.8%) | 8 (0.9%) |
| $50,000 to $74,999 | 77 (18.6%) | 0 (0.0%) |
| $75,000 to $99,999 | 9 (2.2%) | 142 (16.5%) |
| $100,000 to $149,999 | 113 (27.3%) | 46 (5.3%) |
| $150,000 or more | 90 (21.7%) | 150 (17.4%) |
| Total | 414 (100.0%) | 863 (100.0%) |
Property Value to Household Income Ratio in Northvale borough
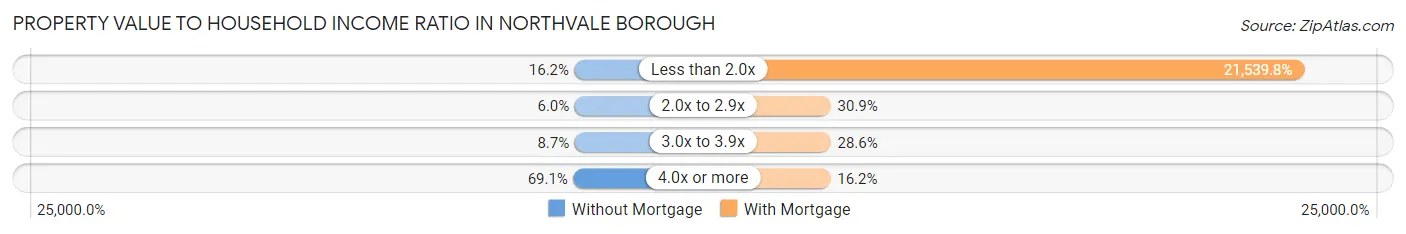
| Value-to-Income Ratio | Without Mortgage | With Mortgage |
| Less than 2.0x | 67 (16.2%) | 185,888 (21,539.8%) |
| 2.0x to 2.9x | 25 (6.0%) | 267 (30.9%) |
| 3.0x to 3.9x | 36 (8.7%) | 247 (28.6%) |
| 4.0x or more | 286 (69.1%) | 140 (16.2%) |
| Total | 414 (100.0%) | 863 (100.0%) |
Real Estate Taxes by Mortgage Status in Northvale borough
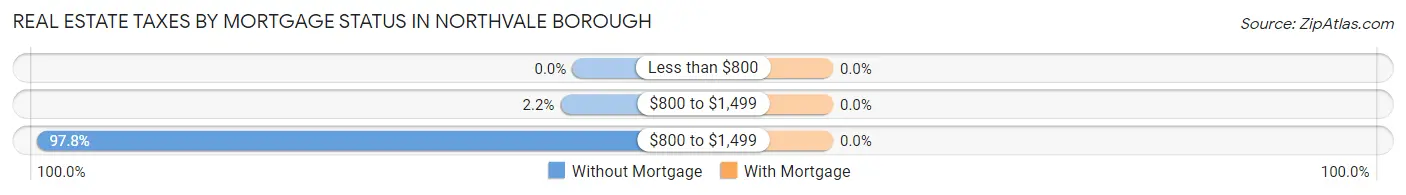
| Property Taxes | Without Mortgage | With Mortgage |
| Less than $800 | 0 (0.0%) | 0 (0.0%) |
| $800 to $1,499 | 9 (2.2%) | 0 (0.0%) |
| $800 to $1,499 | 405 (97.8%) | 0 (0.0%) |
| Total | 414 (100.0%) | 863 (100.0%) |
Health & Disability in Northvale borough
Health Insurance Coverage by Age in Northvale borough
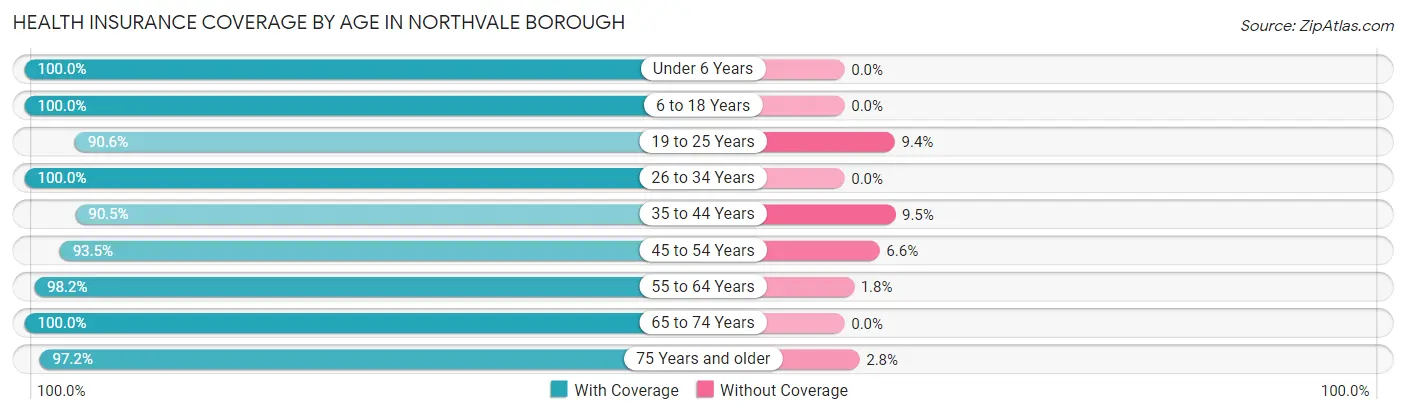
| Age Bracket | With Coverage | Without Coverage |
| Under 6 Years | 281 (100.0%) | 0 (0.0%) |
| 6 to 18 Years | 869 (100.0%) | 0 (0.0%) |
| 19 to 25 Years | 377 (90.6%) | 39 (9.4%) |
| 26 to 34 Years | 356 (100.0%) | 0 (0.0%) |
| 35 to 44 Years | 555 (90.5%) | 58 (9.5%) |
| 45 to 54 Years | 756 (93.4%) | 53 (6.6%) |
| 55 to 64 Years | 613 (98.2%) | 11 (1.8%) |
| 65 to 74 Years | 479 (100.0%) | 0 (0.0%) |
| 75 Years and older | 313 (97.2%) | 9 (2.8%) |
| Total | 4,599 (96.4%) | 170 (3.6%) |
Health Insurance Coverage by Citizenship Status in Northvale borough
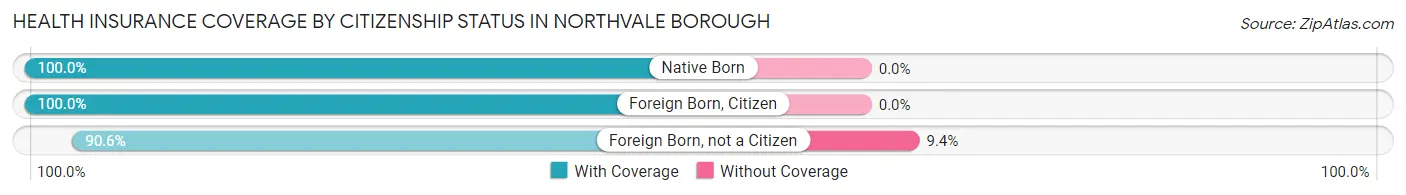
| Citizenship Status | With Coverage | Without Coverage |
| Native Born | 281 (100.0%) | 0 (0.0%) |
| Foreign Born, Citizen | 869 (100.0%) | 0 (0.0%) |
| Foreign Born, not a Citizen | 377 (90.6%) | 39 (9.4%) |
Health Insurance Coverage by Household Income in Northvale borough
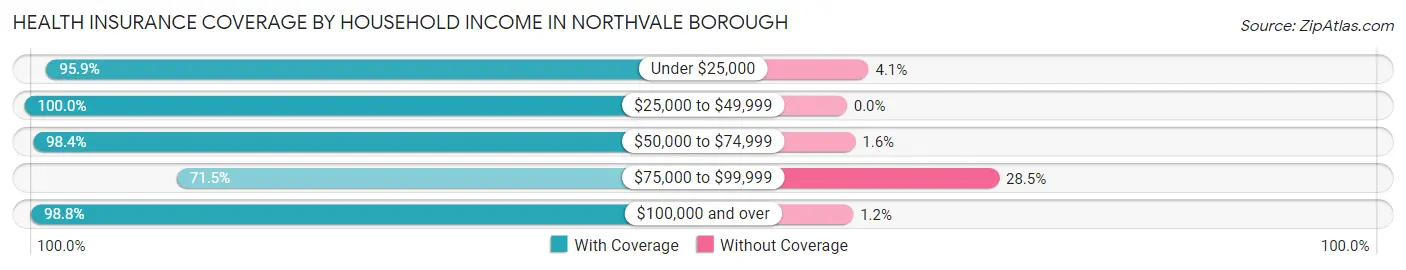
| Household Income | With Coverage | Without Coverage |
| Under $25,000 | 212 (95.9%) | 9 (4.1%) |
| $25,000 to $49,999 | 251 (100.0%) | 0 (0.0%) |
| $50,000 to $74,999 | 672 (98.4%) | 11 (1.6%) |
| $75,000 to $99,999 | 278 (71.5%) | 111 (28.5%) |
| $100,000 and over | 3,186 (98.8%) | 39 (1.2%) |
Public vs Private Health Insurance Coverage by Age in Northvale borough
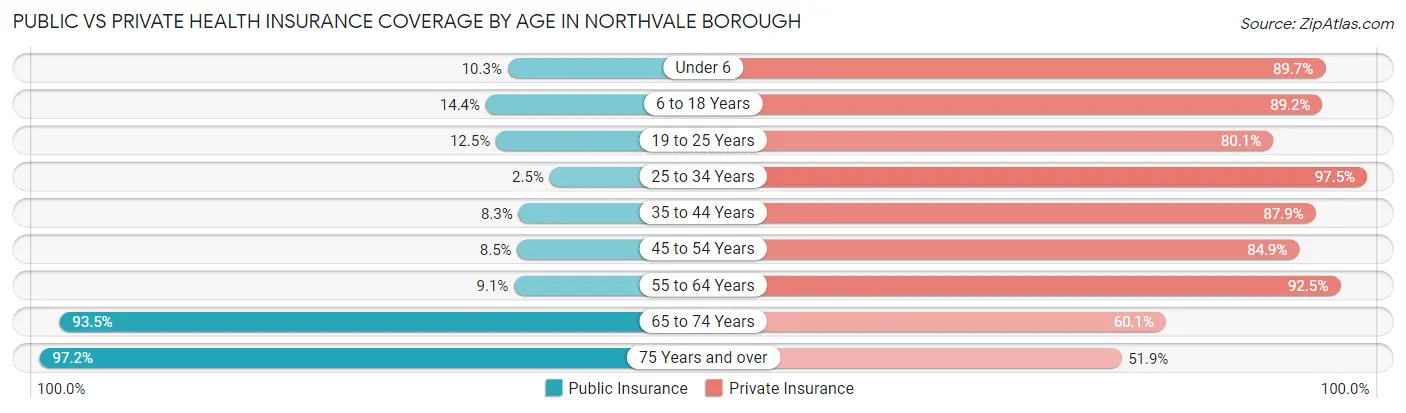
| Age Bracket | Public Insurance | Private Insurance |
| Under 6 | 29 (10.3%) | 252 (89.7%) |
| 6 to 18 Years | 125 (14.4%) | 775 (89.2%) |
| 19 to 25 Years | 52 (12.5%) | 333 (80.0%) |
| 25 to 34 Years | 9 (2.5%) | 347 (97.5%) |
| 35 to 44 Years | 51 (8.3%) | 539 (87.9%) |
| 45 to 54 Years | 69 (8.5%) | 687 (84.9%) |
| 55 to 64 Years | 57 (9.1%) | 577 (92.5%) |
| 65 to 74 Years | 448 (93.5%) | 288 (60.1%) |
| 75 Years and over | 313 (97.2%) | 167 (51.9%) |
| Total | 1,153 (24.2%) | 3,965 (83.1%) |
Disability Status by Sex by Age in Northvale borough
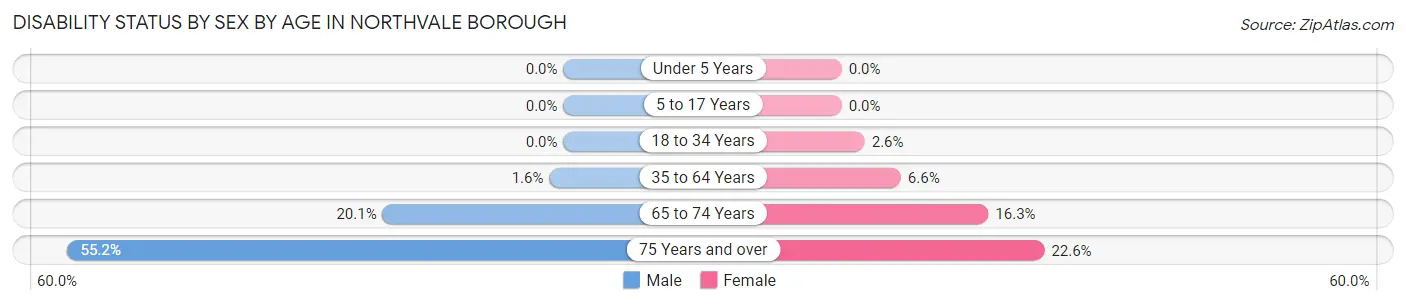
| Age Bracket | Male | Female |
| Under 5 Years | 0 (0.0%) | 0 (0.0%) |
| 5 to 17 Years | 0 (0.0%) | 0 (0.0%) |
| 18 to 34 Years | 0 (0.0%) | 9 (2.6%) |
| 35 to 64 Years | 17 (1.6%) | 63 (6.6%) |
| 65 to 74 Years | 57 (20.1%) | 32 (16.3%) |
| 75 Years and over | 53 (55.2%) | 51 (22.6%) |
Disability Class by Sex by Age in Northvale borough
Disability Class: Hearing Difficulty
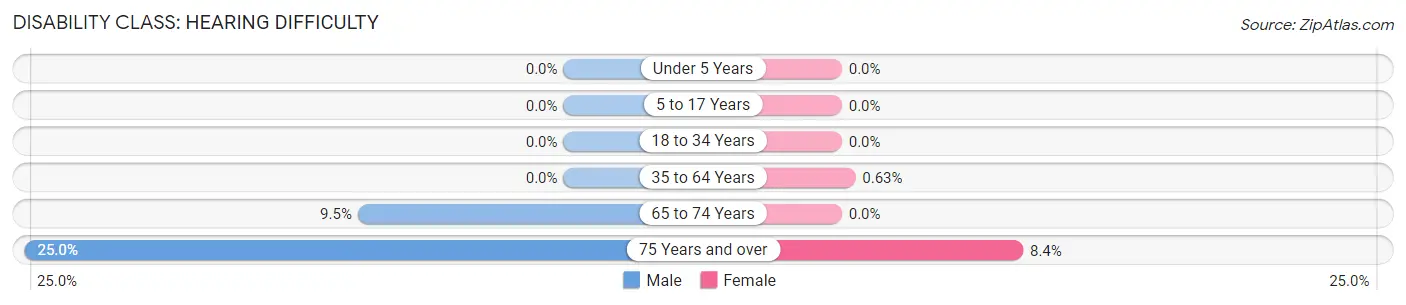
| Age Bracket | Male | Female |
| Under 5 Years | 0 (0.0%) | 0 (0.0%) |
| 5 to 17 Years | 0 (0.0%) | 0 (0.0%) |
| 18 to 34 Years | 0 (0.0%) | 0 (0.0%) |
| 35 to 64 Years | 0 (0.0%) | 6 (0.6%) |
| 65 to 74 Years | 27 (9.5%) | 0 (0.0%) |
| 75 Years and over | 24 (25.0%) | 19 (8.4%) |
Disability Class: Vision Difficulty
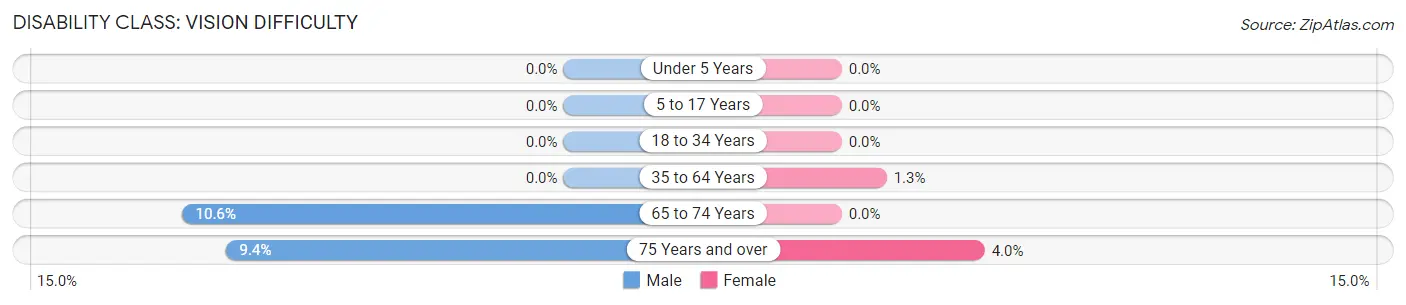
| Age Bracket | Male | Female |
| Under 5 Years | 0 (0.0%) | 0 (0.0%) |
| 5 to 17 Years | 0 (0.0%) | 0 (0.0%) |
| 18 to 34 Years | 0 (0.0%) | 0 (0.0%) |
| 35 to 64 Years | 0 (0.0%) | 12 (1.3%) |
| 65 to 74 Years | 30 (10.6%) | 0 (0.0%) |
| 75 Years and over | 9 (9.4%) | 9 (4.0%) |
Disability Class: Cognitive Difficulty

| Age Bracket | Male | Female |
| 5 to 17 Years | 0 (0.0%) | 0 (0.0%) |
| 18 to 34 Years | 0 (0.0%) | 9 (2.6%) |
| 35 to 64 Years | 8 (0.7%) | 0 (0.0%) |
| 65 to 74 Years | 0 (0.0%) | 8 (4.1%) |
| 75 Years and over | 0 (0.0%) | 9 (4.0%) |
Disability Class: Ambulatory Difficulty
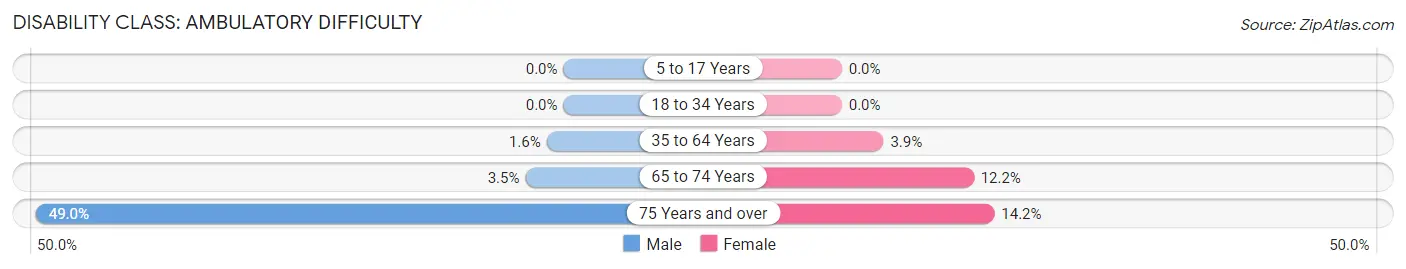
| Age Bracket | Male | Female |
| 5 to 17 Years | 0 (0.0%) | 0 (0.0%) |
| 18 to 34 Years | 0 (0.0%) | 0 (0.0%) |
| 35 to 64 Years | 17 (1.6%) | 37 (3.9%) |
| 65 to 74 Years | 10 (3.5%) | 24 (12.2%) |
| 75 Years and over | 47 (49.0%) | 32 (14.2%) |
Disability Class: Self-Care Difficulty
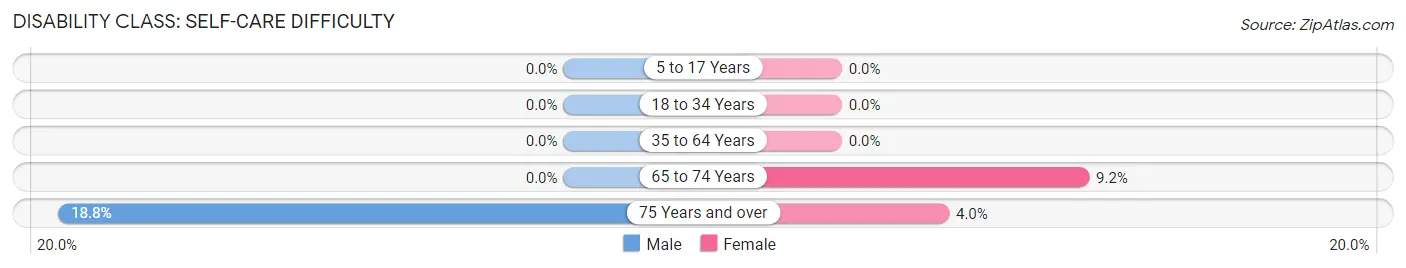
| Age Bracket | Male | Female |
| 5 to 17 Years | 0 (0.0%) | 0 (0.0%) |
| 18 to 34 Years | 0 (0.0%) | 0 (0.0%) |
| 35 to 64 Years | 0 (0.0%) | 0 (0.0%) |
| 65 to 74 Years | 0 (0.0%) | 18 (9.2%) |
| 75 Years and over | 18 (18.8%) | 9 (4.0%) |
Technology Access in Northvale borough
Computing Device Access in Northvale borough
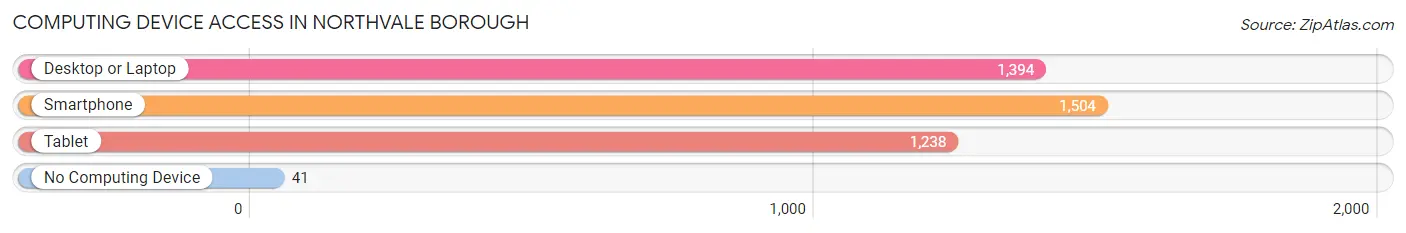
| Device Type | # Households | % Households |
| Desktop or Laptop | 1,394 | 85.7% |
| Smartphone | 1,504 | 92.5% |
| Tablet | 1,238 | 76.1% |
| No Computing Device | 41 | 2.5% |
| Total | 1,626 | 100.0% |
Internet Access in Northvale borough
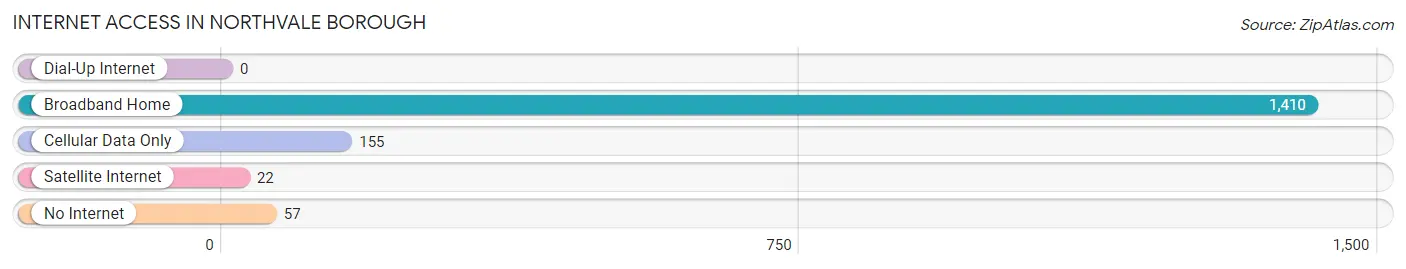
| Internet Type | # Households | % Households |
| Dial-Up Internet | 0 | 0.0% |
| Broadband Home | 1,410 | 86.7% |
| Cellular Data Only | 155 | 9.5% |
| Satellite Internet | 22 | 1.3% |
| No Internet | 57 | 3.5% |
| Total | 1,626 | 100.0% |
Northvale borough Summary
Northvale Borough is a small borough located in Bergen County, New Jersey. It is situated in the northern part of the state, just west of the Hudson River and north of the New York City metropolitan area. The borough is bordered by the towns of Closter, Norwood, Old Tappan, and Rockleigh. As of the 2010 United States Census, the borough had a population of 4,160.
Geography
Northvale Borough is located at 40°57'45" North, 73°59'45" West (40.9625, -73.9958). According to the United States Census Bureau, the borough has a total area of 1.2 square miles (3.1 km2), all of which is land.
The borough is located in the Pascack Valley, which is a region of Bergen County that is characterized by its rolling hills and valleys. The borough is situated on the western side of the valley, and is bordered by the towns of Closter, Norwood, Old Tappan, and Rockleigh.
Demographics
As of the 2010 United States Census, there were 4,160 people, 1,541 households, and 1,093 families residing in the borough. The population density was 3,521.7 people per square mile (1,364.2/km2). There were 1,619 housing units at an average density of 1,364.2 per square mile (521.7/km2). The racial makeup of the borough was 87.2% White, 1.2% African American, 0.2% Native American, 8.2% Asian, 0.7% from other races, and 2.7% from two or more races. Hispanic or Latino of any race were 5.2% of the population.
There were 1,541 households, out of which 33.2% had children under the age of 18 living with them, 57.2% were married couples living together, 9.3% had a female householder with no husband present, and 29.7% were non-families. 24.3% of all households were made up of individuals, and 10.2% had someone living alone who was 65 years of age or older. The average household size was 2.68 and the average family size was 3.24.
In the borough, the population was spread out, with 24.2% under the age of 18, 6.2% from 18 to 24, 28.2% from 25 to 44, 27.2% from 45 to 64, and 14.2% who were 65 years of age or older. The median age was 40 years. For every 100 females, there were 93.2 males. For every 100 females age 18 and over, there were 90.2 males.
The median income for a household in the borough was $76,944, and the median income for a family was $90,938. Males had a median income of $60,000 versus $45,000 for females. The per capita income for the borough was $35,945. About 1.7% of families and 2.7% of the population were below the poverty line, including 2.2% of those under age 18 and 4.2% of those age 65 or over.
Economy
Northvale Borough is home to a variety of businesses, including retail stores, restaurants, and professional services. The borough is also home to a number of corporate headquarters, including the headquarters of the pharmaceutical company, Merck & Co.
The borough is served by the New Jersey Transit rail line, which provides service to New York City and other points in the region. The borough is also served by several major highways, including the Garden State Parkway, the Palisades Interstate Parkway, and the New York State Thruway.
Conclusion
Northvale Borough is a small borough located in Bergen County, New Jersey. It is situated in the northern part of the state, just west of the Hudson River and north of the New York City metropolitan area. As of the 2010 United States Census, the borough had a population of 4,160. The borough is located in the Pascack Valley, which is a region of Bergen County that is characterized by its rolling hills and valleys. The borough is home to a variety of businesses, including retail stores, restaurants, and professional services. The borough is served by the New Jersey Transit rail line, which provides service to New York City and other points in the region. The borough is also served by several major highways, including the Garden State Parkway, the Palisades Interstate Parkway, and the New York State Thruway.
Common Questions
What is Per Capita Income in Northvale borough?
Per Capita income in Northvale borough is $54,831.
What is the Median Family Income in Northvale borough?
Median Family Income in Northvale borough is $127,206.
What is the Median Household income in Northvale borough?
Median Household Income in Northvale borough is $120,278.
What is Income or Wage Gap in Northvale borough?
Income or Wage Gap in Northvale borough is 8.2%.
Women in Northvale borough earn 91.8 cents for every dollar earned by a man.
What is Inequality or Gini Index in Northvale borough?
Inequality or Gini Index in Northvale borough is 0.44.
What is the Total Population of Northvale borough?
Total Population of Northvale borough is 4,769.
What is the Total Male Population of Northvale borough?
Total Male Population of Northvale borough is 2,531.
What is the Total Female Population of Northvale borough?
Total Female Population of Northvale borough is 2,238.
What is the Ratio of Males per 100 Females in Northvale borough?
There are 113.09 Males per 100 Females in Northvale borough.
What is the Ratio of Females per 100 Males in Northvale borough?
There are 88.42 Females per 100 Males in Northvale borough.
What is the Median Population Age in Northvale borough?
Median Population Age in Northvale borough is 42.4 Years.
What is the Average Family Size in Northvale borough
Average Family Size in Northvale borough is 3.1 People.
What is the Average Household Size in Northvale borough
Average Household Size in Northvale borough is 2.9 People.
How Large is the Labor Force in Northvale borough?
There are 2,394 People in the Labor Forcein in Northvale borough.
What is the Percentage of People in the Labor Force in Northvale borough?
61.8% of People are in the Labor Force in Northvale borough.
What is the Unemployment Rate in Northvale borough?
Unemployment Rate in Northvale borough is 4.1%.