Leisure Knoll, NJ Map & Demographics
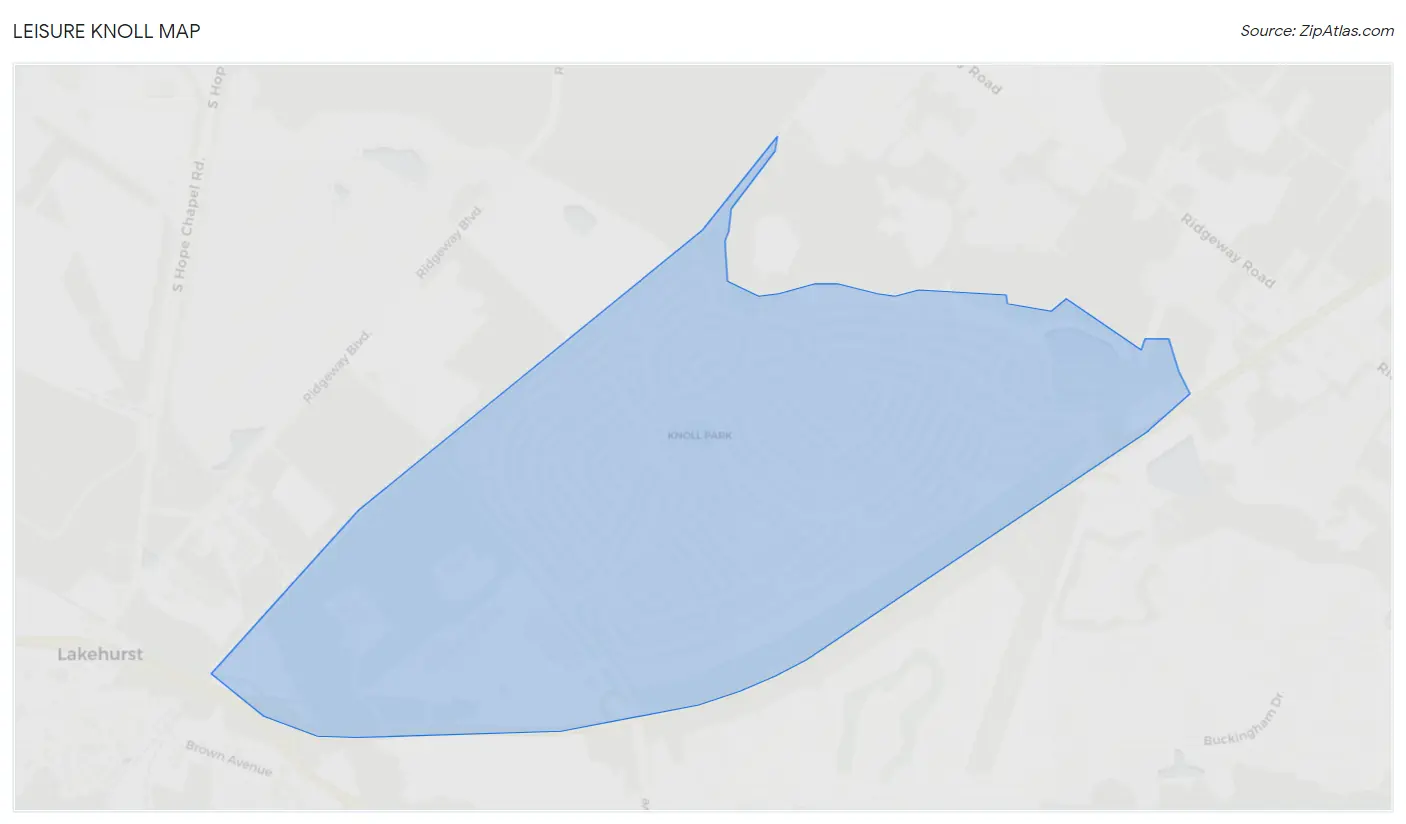
Leisure Knoll Map
Leisure Knoll Overview
$40,267
PER CAPITA INCOME
$80,909
AVG FAMILY INCOME
$52,279
AVG HOUSEHOLD INCOME
15.8%
WAGE / INCOME GAP [ % ]
84.2¢/ $1
WAGE / INCOME GAP [ $ ]
0.36
INEQUALITY / GINI INDEX
2,622
TOTAL POPULATION
925
MALE POPULATION
1,697
FEMALE POPULATION
54.51
MALES / 100 FEMALES
183.46
FEMALES / 100 MALES
70.7
MEDIAN AGE
2.1
AVG FAMILY SIZE
1.6
AVG HOUSEHOLD SIZE
821
LABOR FORCE [ PEOPLE ]
31.3%
PERCENT IN LABOR FORCE
4.4%
UNEMPLOYMENT RATE
Income in Leisure Knoll
Income Overview in Leisure Knoll
Per Capita Income in Leisure Knoll is $40,267, while median incomes of families and households are $80,909 and $52,279 respectively.
| Characteristic | Number | Measure |
| Per Capita Income | 2,622 | $40,267 |
| Median Family Income | 826 | $80,909 |
| Mean Family Income | 826 | $83,729 |
| Median Household Income | 1,523 | $52,279 |
| Mean Household Income | 1,523 | $65,634 |
| Income Deficit | 826 | $0 |
| Wage / Income Gap (%) | 2,622 | 15.82% |
| Wage / Income Gap ($) | 2,622 | 84.18¢ per $1 |
| Gini / Inequality Index | 2,622 | 0.36 |
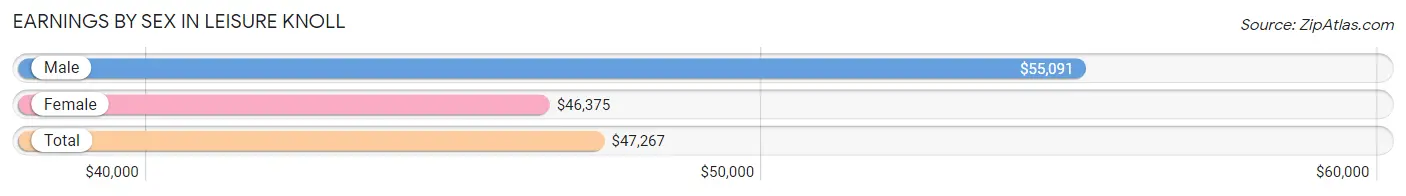
Earnings by Sex in Leisure Knoll
Average Earnings in Leisure Knoll are $47,267, $55,091 for men and $46,375 for women, a difference of 15.8%.
| Sex | Number | Average Earnings |
| Male | 317 (35.9%) | $55,091 |
| Female | 565 (64.1%) | $46,375 |
| Total | 882 (100.0%) | $47,267 |
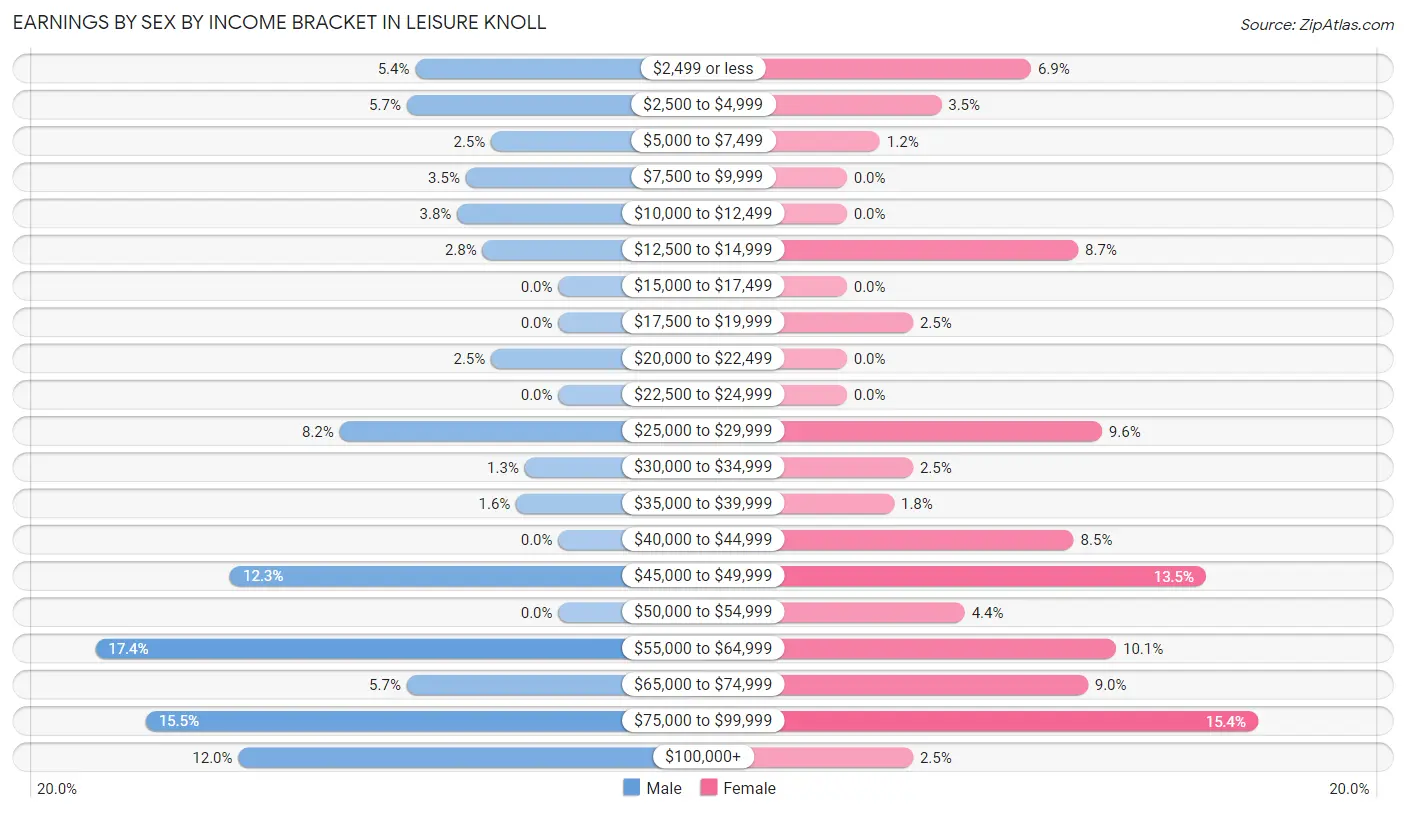
Earnings by Sex by Income Bracket in Leisure Knoll
The most common earnings brackets in Leisure Knoll are $55,000 to $64,999 for men (55 | 17.3%) and $75,000 to $99,999 for women (87 | 15.4%).
| Income | Male | Female |
| $2,499 or less | 17 (5.4%) | 39 (6.9%) |
| $2,500 to $4,999 | 18 (5.7%) | 20 (3.5%) |
| $5,000 to $7,499 | 8 (2.5%) | 7 (1.2%) |
| $7,500 to $9,999 | 11 (3.5%) | 0 (0.0%) |
| $10,000 to $12,499 | 12 (3.8%) | 0 (0.0%) |
| $12,500 to $14,999 | 9 (2.8%) | 49 (8.7%) |
| $15,000 to $17,499 | 0 (0.0%) | 0 (0.0%) |
| $17,500 to $19,999 | 0 (0.0%) | 14 (2.5%) |
| $20,000 to $22,499 | 8 (2.5%) | 0 (0.0%) |
| $22,500 to $24,999 | 0 (0.0%) | 0 (0.0%) |
| $25,000 to $29,999 | 26 (8.2%) | 54 (9.6%) |
| $30,000 to $34,999 | 4 (1.3%) | 14 (2.5%) |
| $35,000 to $39,999 | 5 (1.6%) | 10 (1.8%) |
| $40,000 to $44,999 | 0 (0.0%) | 48 (8.5%) |
| $45,000 to $49,999 | 39 (12.3%) | 76 (13.5%) |
| $50,000 to $54,999 | 0 (0.0%) | 25 (4.4%) |
| $55,000 to $64,999 | 55 (17.3%) | 57 (10.1%) |
| $65,000 to $74,999 | 18 (5.7%) | 51 (9.0%) |
| $75,000 to $99,999 | 49 (15.5%) | 87 (15.4%) |
| $100,000+ | 38 (12.0%) | 14 (2.5%) |
| Total | 317 (100.0%) | 565 (100.0%) |
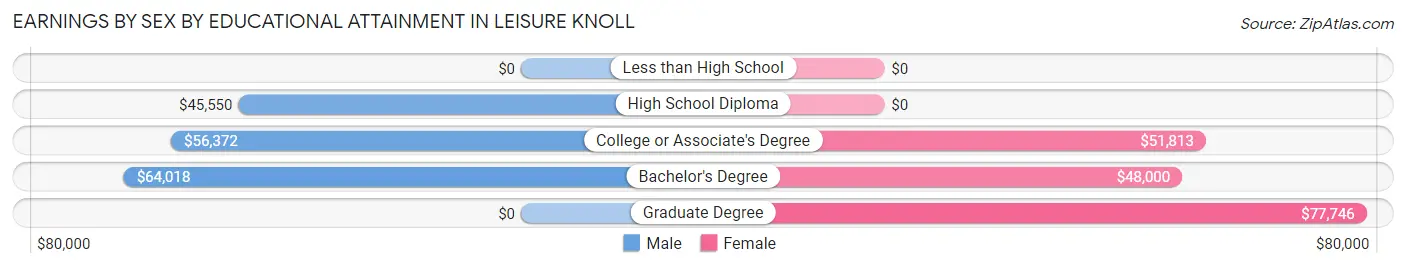
Earnings by Sex by Educational Attainment in Leisure Knoll
Average earnings in Leisure Knoll are $55,091 for men and $46,750 for women, a difference of 15.1%. Men with an educational attainment of bachelor's degree enjoy the highest average annual earnings of $64,018, while those with high school diploma education earn the least with $45,550. Women with an educational attainment of graduate degree earn the most with the average annual earnings of $77,746, while those with bachelor's degree education have the smallest earnings of $48,000.
| Educational Attainment | Male Income | Female Income |
| Less than High School | - | - |
| High School Diploma | $45,550 | $0 |
| College or Associate's Degree | $56,372 | $51,813 |
| Bachelor's Degree | $64,018 | $48,000 |
| Graduate Degree | - | - |
| Total | $55,091 | $46,750 |
Family Income in Leisure Knoll
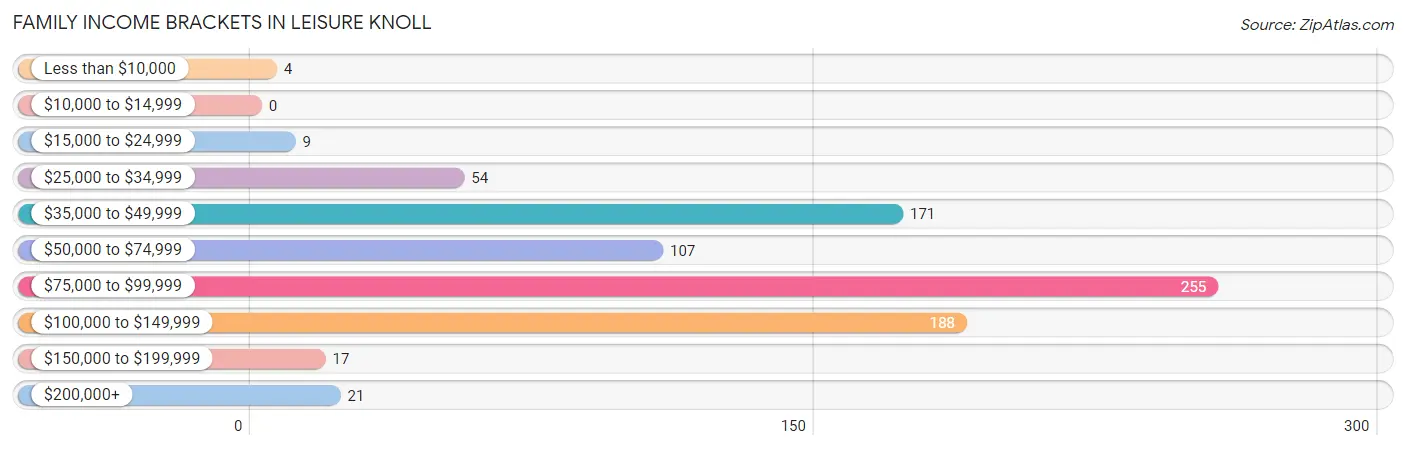
Family Income Brackets in Leisure Knoll
According to the Leisure Knoll family income data, there are 255 families falling into the $75,000 to $99,999 income range, which is the most common income bracket and makes up 30.9% of all families.
| Income Bracket | # Families | % Families |
| Less than $10,000 | 4 | 0.5% |
| $10,000 to $14,999 | 0 | 0.0% |
| $15,000 to $24,999 | 9 | 1.1% |
| $25,000 to $34,999 | 54 | 6.5% |
| $35,000 to $49,999 | 171 | 20.7% |
| $50,000 to $74,999 | 107 | 13.0% |
| $75,000 to $99,999 | 255 | 30.9% |
| $100,000 to $149,999 | 188 | 22.8% |
| $150,000 to $199,999 | 17 | 2.1% |
| $200,000+ | 21 | 2.5% |
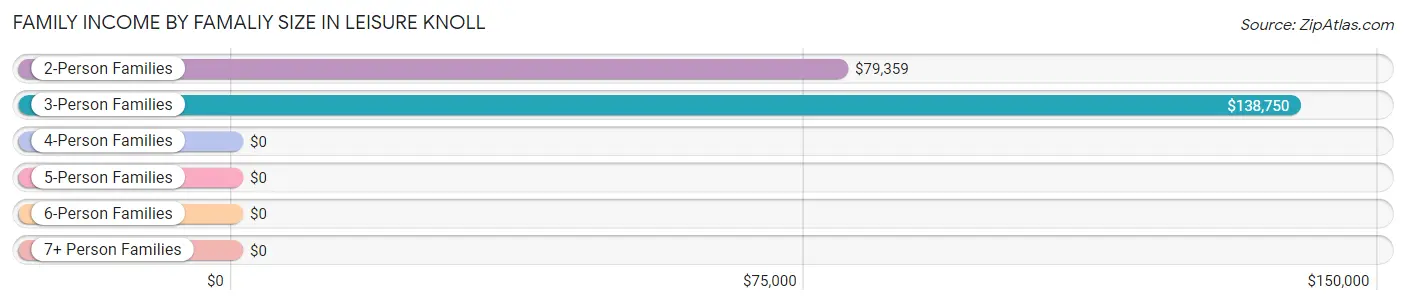
Family Income by Famaliy Size in Leisure Knoll
3-person families (28 | 3.4%) account for the highest median family income in Leisure Knoll with $138,750 per family, while 3-person families (28 | 3.4%) have the highest median income of $46,250 per family member.
| Income Bracket | # Families | Median Income |
| 2-Person Families | 798 (96.6%) | $79,359 |
| 3-Person Families | 28 (3.4%) | $138,750 |
| 4-Person Families | 0 (0.0%) | $0 |
| 5-Person Families | 0 (0.0%) | $0 |
| 6-Person Families | 0 (0.0%) | $0 |
| 7+ Person Families | 0 (0.0%) | $0 |
| Total | 826 (100.0%) | $80,909 |
Family Income by Number of Earners in Leisure Knoll
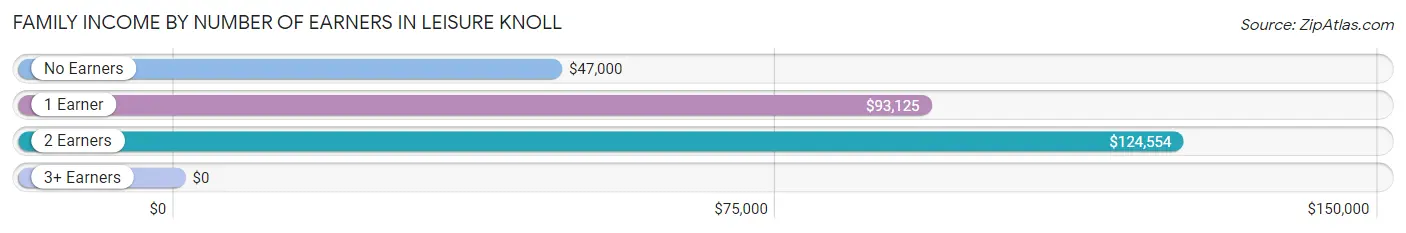
| Number of Earners | # Families | Median Income |
| No Earners | 326 (39.5%) | $47,000 |
| 1 Earner | 305 (36.9%) | $93,125 |
| 2 Earners | 191 (23.1%) | $124,554 |
| 3+ Earners | 4 (0.5%) | $0 |
| Total | 826 (100.0%) | $80,909 |
Household Income in Leisure Knoll
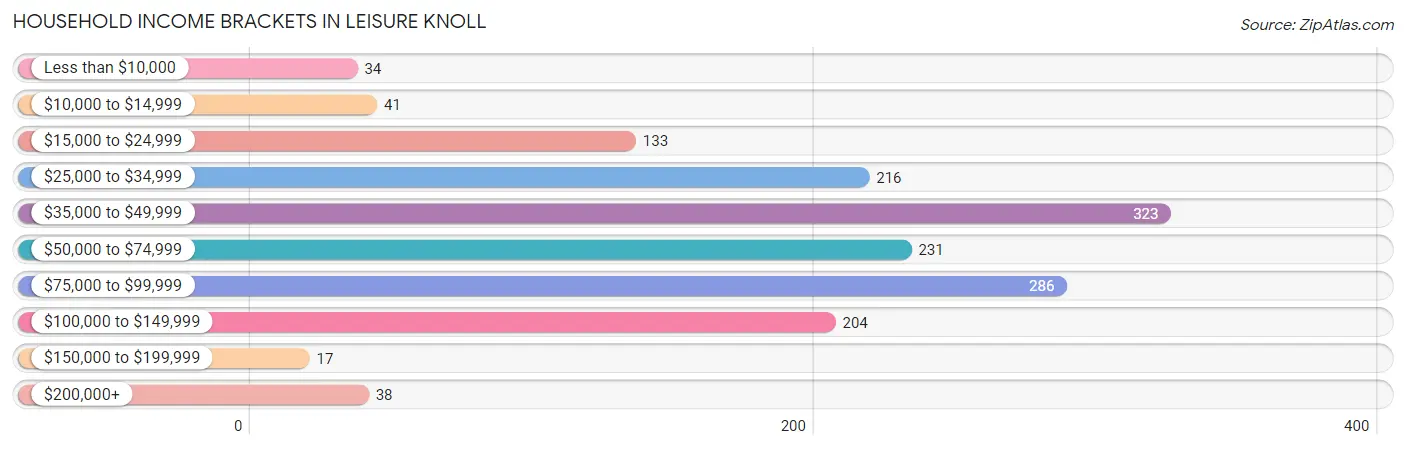
Household Income Brackets in Leisure Knoll
With 323 households falling in the category, the $35,000 to $49,999 income range is the most frequent in Leisure Knoll, accounting for 21.2% of all households. In contrast, only 17 households (1.1%) fall into the $150,000 to $199,999 income bracket, making it the least populous group.
| Income Bracket | # Households | % Households |
| Less than $10,000 | 34 | 2.2% |
| $10,000 to $14,999 | 41 | 2.7% |
| $15,000 to $24,999 | 133 | 8.7% |
| $25,000 to $34,999 | 216 | 14.2% |
| $35,000 to $49,999 | 323 | 21.2% |
| $50,000 to $74,999 | 231 | 15.2% |
| $75,000 to $99,999 | 286 | 18.8% |
| $100,000 to $149,999 | 204 | 13.4% |
| $150,000 to $199,999 | 17 | 1.1% |
| $200,000+ | 38 | 2.5% |
Household Income by Householder Age in Leisure Knoll
The median household income in Leisure Knoll is $52,279, with the highest median household income of $76,750 found in the 45 to 64 years age bracket for the primary householder. A total of 377 households (24.7%) fall into this category.
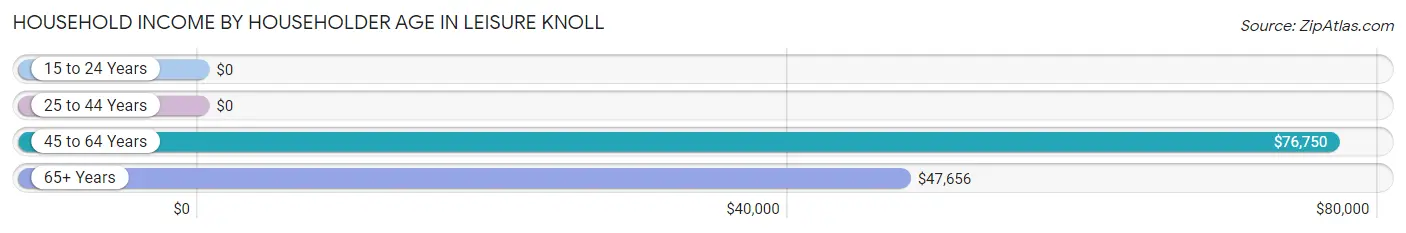
| Income Bracket | # Households | Median Income |
| 15 to 24 Years | 0 (0.0%) | $0 |
| 25 to 44 Years | 26 (1.7%) | $0 |
| 45 to 64 Years | 377 (24.7%) | $76,750 |
| 65+ Years | 1,120 (73.5%) | $47,656 |
| Total | 1,523 (100.0%) | $52,279 |
Poverty in Leisure Knoll
Income Below Poverty by Sex and Age in Leisure Knoll
With 5.2% poverty level for males and 2.2% for females among the residents of Leisure Knoll, 35 to 44 year old males and 75 year old and over females are the most vulnerable to poverty, with 26 males (100.0%) and 16 females (2.9%) in their respective age groups living below the poverty level.
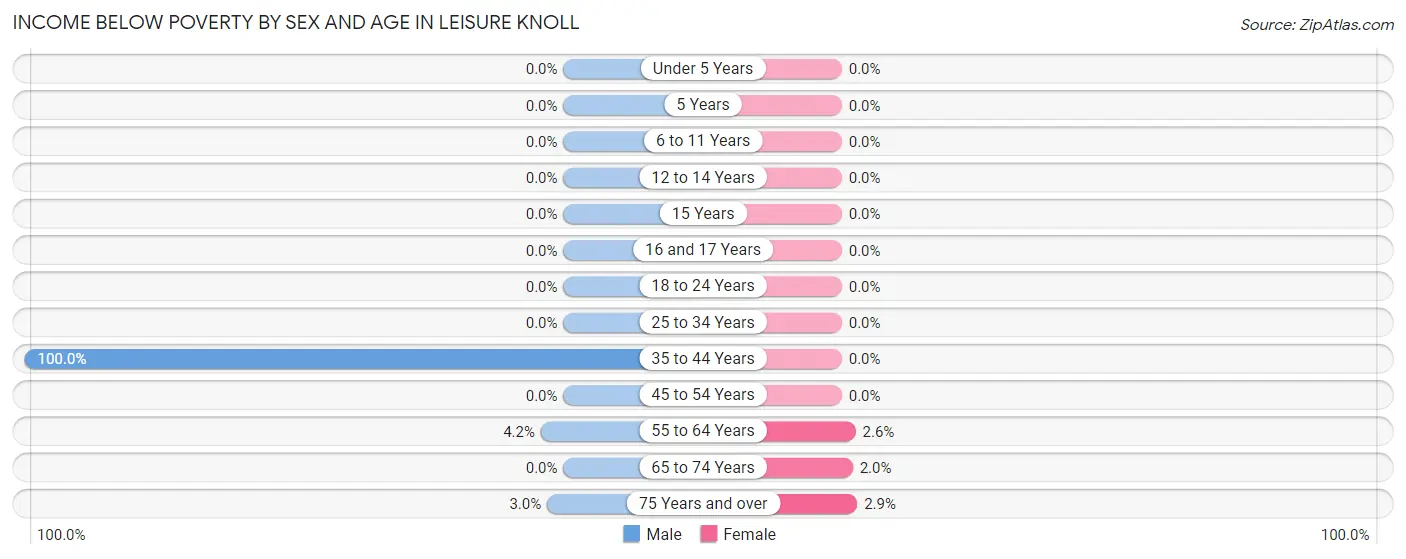
| Age Bracket | Male | Female |
| Under 5 Years | 0 (0.0%) | 0 (0.0%) |
| 5 Years | 0 (0.0%) | 0 (0.0%) |
| 6 to 11 Years | 0 (0.0%) | 0 (0.0%) |
| 12 to 14 Years | 0 (0.0%) | 0 (0.0%) |
| 15 Years | 0 (0.0%) | 0 (0.0%) |
| 16 and 17 Years | 0 (0.0%) | 0 (0.0%) |
| 18 to 24 Years | 0 (0.0%) | 0 (0.0%) |
| 25 to 34 Years | 0 (0.0%) | 0 (0.0%) |
| 35 to 44 Years | 26 (100.0%) | 0 (0.0%) |
| 45 to 54 Years | 0 (0.0%) | 0 (0.0%) |
| 55 to 64 Years | 10 (4.2%) | 8 (2.6%) |
| 65 to 74 Years | 0 (0.0%) | 12 (2.0%) |
| 75 Years and over | 9 (3.0%) | 16 (2.9%) |
| Total | 45 (5.2%) | 36 (2.2%) |
Income Above Poverty by Sex and Age in Leisure Knoll
According to the poverty statistics in Leisure Knoll, males aged 45 to 54 years and females aged 18 to 24 years are the age groups that are most secure financially, with 100.0% of males and 100.0% of females in these age groups living above the poverty line.
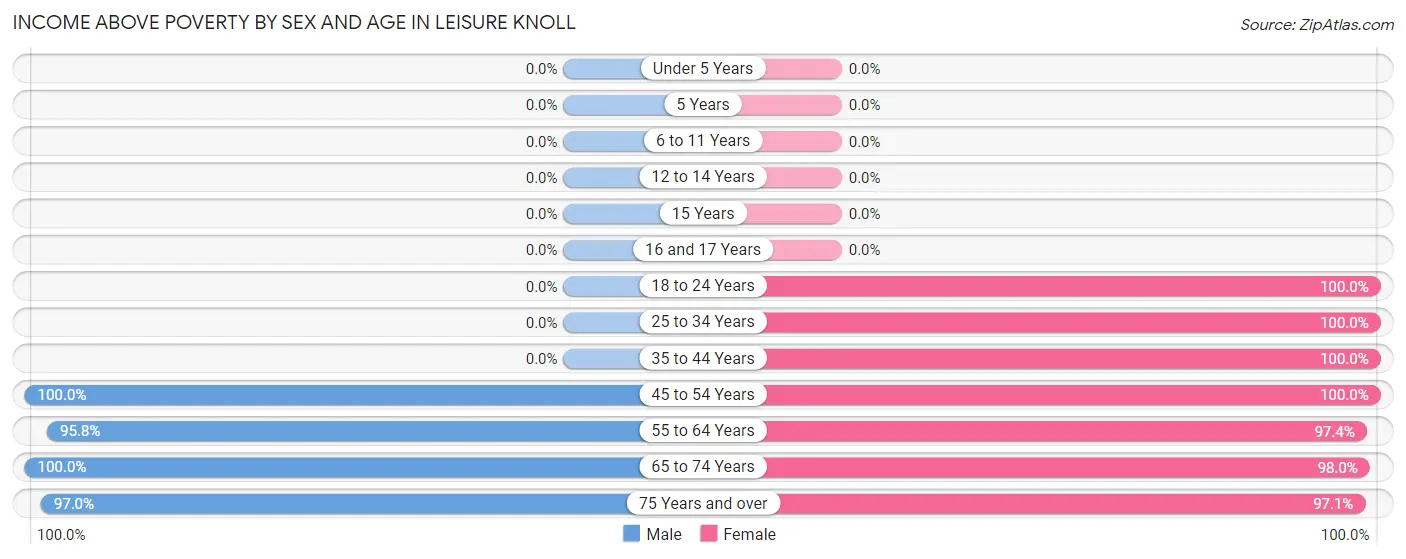
| Age Bracket | Male | Female |
| Under 5 Years | 0 (0.0%) | 0 (0.0%) |
| 5 Years | 0 (0.0%) | 0 (0.0%) |
| 6 to 11 Years | 0 (0.0%) | 0 (0.0%) |
| 12 to 14 Years | 0 (0.0%) | 0 (0.0%) |
| 15 Years | 0 (0.0%) | 0 (0.0%) |
| 16 and 17 Years | 0 (0.0%) | 0 (0.0%) |
| 18 to 24 Years | 0 (0.0%) | 15 (100.0%) |
| 25 to 34 Years | 0 (0.0%) | 21 (100.0%) |
| 35 to 44 Years | 0 (0.0%) | 43 (100.0%) |
| 45 to 54 Years | 17 (100.0%) | 78 (100.0%) |
| 55 to 64 Years | 229 (95.8%) | 303 (97.4%) |
| 65 to 74 Years | 290 (100.0%) | 582 (98.0%) |
| 75 Years and over | 289 (97.0%) | 543 (97.1%) |
| Total | 825 (94.8%) | 1,585 (97.8%) |
Income Below Poverty Among Married-Couple Families in Leisure Knoll
The poverty statistics for married-couple families in Leisure Knoll show that 0.6% or 4 of the total 655 families live below the poverty line. Families with no children have the highest poverty rate of 0.6%, comprising of 4 families. On the other hand, families with no children have the lowest poverty rate of 0.6%, which includes 4 families.
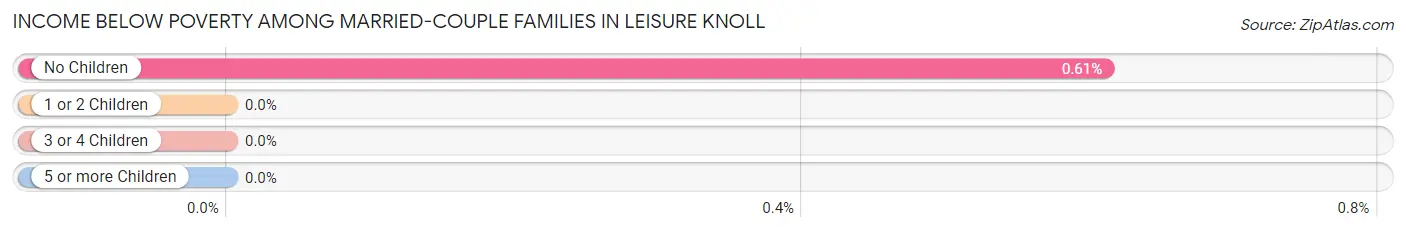
| Children | Above Poverty | Below Poverty |
| No Children | 651 (99.4%) | 4 (0.6%) |
| 1 or 2 Children | 0 (0.0%) | 0 (0.0%) |
| 3 or 4 Children | 0 (0.0%) | 0 (0.0%) |
| 5 or more Children | 0 (0.0%) | 0 (0.0%) |
| Total | 651 (99.4%) | 4 (0.6%) |
Income Below Poverty Among Single-Parent Households in Leisure Knoll
| Children | Single Father | Single Mother |
| No Children | 0 (0.0%) | 0 (0.0%) |
| 1 or 2 Children | 0 (0.0%) | 0 (0.0%) |
| 3 or 4 Children | 0 (0.0%) | 0 (0.0%) |
| 5 or more Children | 0 (0.0%) | 0 (0.0%) |
| Total | 0 (0.0%) | 0 (0.0%) |
Income Below Poverty Among Married-Couple vs Single-Parent Households in Leisure Knoll
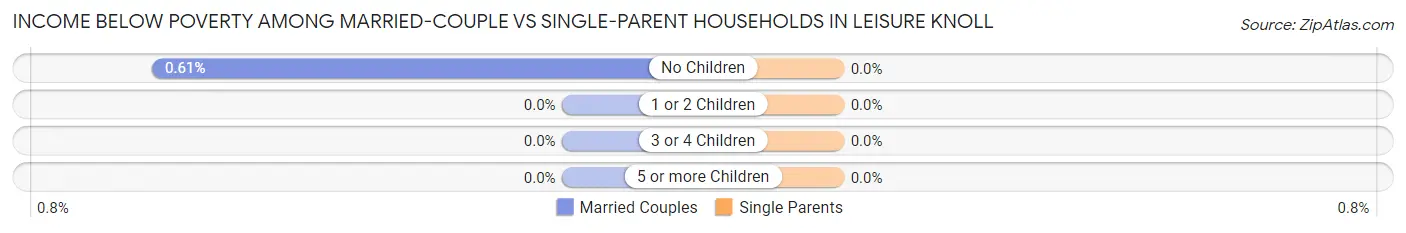
| Children | Married-Couple Families | Single-Parent Households |
| No Children | 4 (0.6%) | 0 (0.0%) |
| 1 or 2 Children | 0 (0.0%) | 0 (0.0%) |
| 3 or 4 Children | 0 (0.0%) | 0 (0.0%) |
| 5 or more Children | 0 (0.0%) | 0 (0.0%) |
| Total | 4 (0.6%) | 0 (0.0%) |
Race in Leisure Knoll
The most populous races in Leisure Knoll are White / Caucasian (2,254 | 86.0%), Black / African American (166 | 6.3%), and Asian (121 | 4.6%).
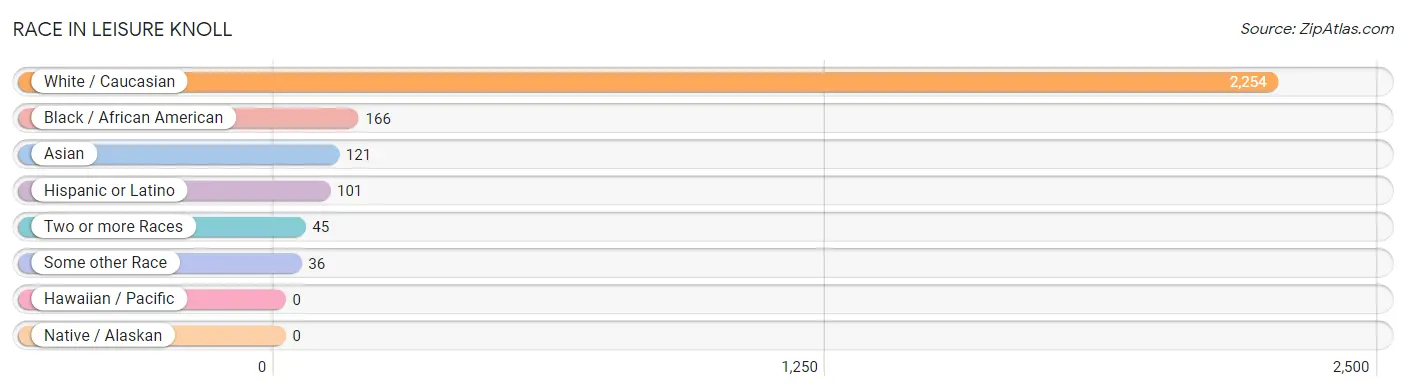
| Race | # Population | % Population |
| Asian | 121 | 4.6% |
| Black / African American | 166 | 6.3% |
| Hawaiian / Pacific | 0 | 0.0% |
| Hispanic or Latino | 101 | 3.8% |
| Native / Alaskan | 0 | 0.0% |
| White / Caucasian | 2,254 | 86.0% |
| Two or more Races | 45 | 1.7% |
| Some other Race | 36 | 1.4% |
| Total | 2,622 | 100.0% |
Ancestry in Leisure Knoll
The most populous ancestries reported in Leisure Knoll are Italian (735 | 28.0%), Irish (629 | 24.0%), German (312 | 11.9%), English (258 | 9.8%), and Polish (165 | 6.3%), together accounting for 80.0% of all Leisure Knoll residents.
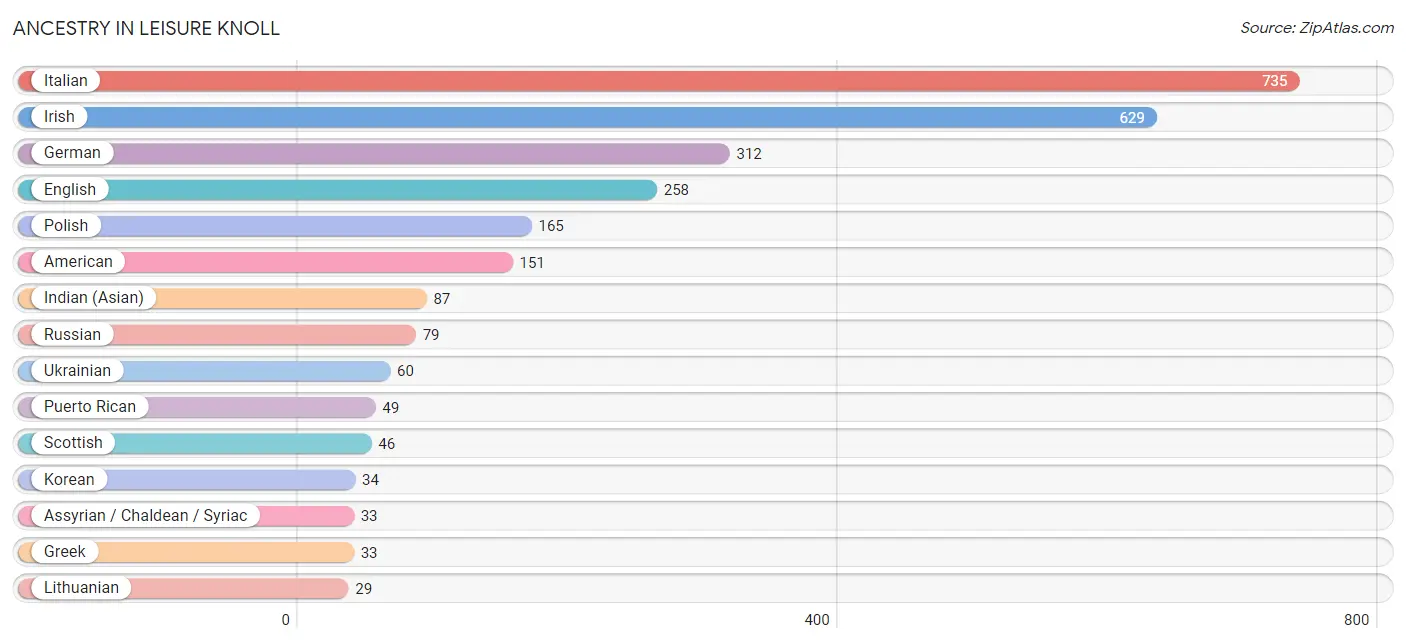
| Ancestry | # Population | % Population |
| American | 151 | 5.8% |
| Arab | 4 | 0.2% |
| Assyrian / Chaldean / Syriac | 33 | 1.3% |
| Austrian | 11 | 0.4% |
| Brazilian | 4 | 0.2% |
| Czech | 21 | 0.8% |
| Danish | 21 | 0.8% |
| Dutch | 15 | 0.6% |
| Ecuadorian | 12 | 0.5% |
| English | 258 | 9.8% |
| Estonian | 12 | 0.5% |
| French | 20 | 0.8% |
| German | 312 | 11.9% |
| Greek | 33 | 1.3% |
| Hungarian | 6 | 0.2% |
| Indian (Asian) | 87 | 3.3% |
| Irish | 629 | 24.0% |
| Italian | 735 | 28.0% |
| Korean | 34 | 1.3% |
| Lithuanian | 29 | 1.1% |
| Mexican | 19 | 0.7% |
| Polish | 165 | 6.3% |
| Portuguese | 10 | 0.4% |
| Puerto Rican | 49 | 1.9% |
| Russian | 79 | 3.0% |
| Scotch-Irish | 9 | 0.3% |
| Scottish | 46 | 1.8% |
| Slovak | 8 | 0.3% |
| South American | 12 | 0.5% |
| Spaniard | 21 | 0.8% |
| Ukrainian | 60 | 2.3% |
| Welsh | 4 | 0.2% | View All 32 Rows |
Immigrants in Leisure Knoll
The most numerous immigrant groups reported in Leisure Knoll came from Europe (230 | 8.8%), Eastern Europe (171 | 6.5%), Asia (121 | 4.6%), Russia (61 | 2.3%), and South Eastern Asia (61 | 2.3%), together accounting for 24.6% of all Leisure Knoll residents.
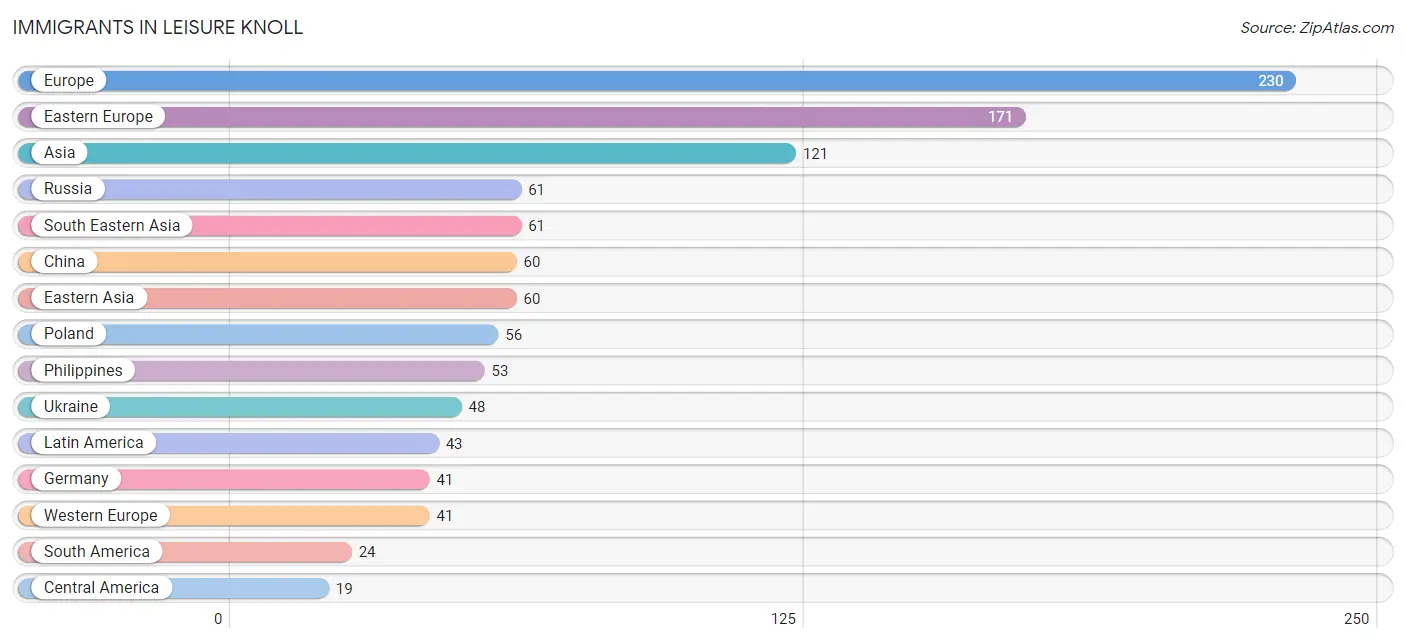
| Immigration Origin | # Population | % Population |
| Africa | 9 | 0.3% |
| Asia | 121 | 4.6% |
| Brazil | 8 | 0.3% |
| Central America | 19 | 0.7% |
| China | 60 | 2.3% |
| Eastern Asia | 60 | 2.3% |
| Eastern Europe | 171 | 6.5% |
| Ecuador | 12 | 0.5% |
| Europe | 230 | 8.8% |
| Germany | 41 | 1.6% |
| Ireland | 18 | 0.7% |
| Latin America | 43 | 1.6% |
| Mexico | 19 | 0.7% |
| Nigeria | 9 | 0.3% |
| Northern Europe | 18 | 0.7% |
| Philippines | 53 | 2.0% |
| Poland | 56 | 2.1% |
| Russia | 61 | 2.3% |
| South America | 24 | 0.9% |
| South Eastern Asia | 61 | 2.3% |
| Ukraine | 48 | 1.8% |
| Venezuela | 4 | 0.2% |
| Western Africa | 9 | 0.3% |
| Western Europe | 41 | 1.6% | View All 24 Rows |
Sex and Age in Leisure Knoll
Sex and Age in Leisure Knoll
The most populous age groups in Leisure Knoll are 60 to 64 Years (192 | 20.8%) for men and 70 to 74 Years (330 | 19.5%) for women.
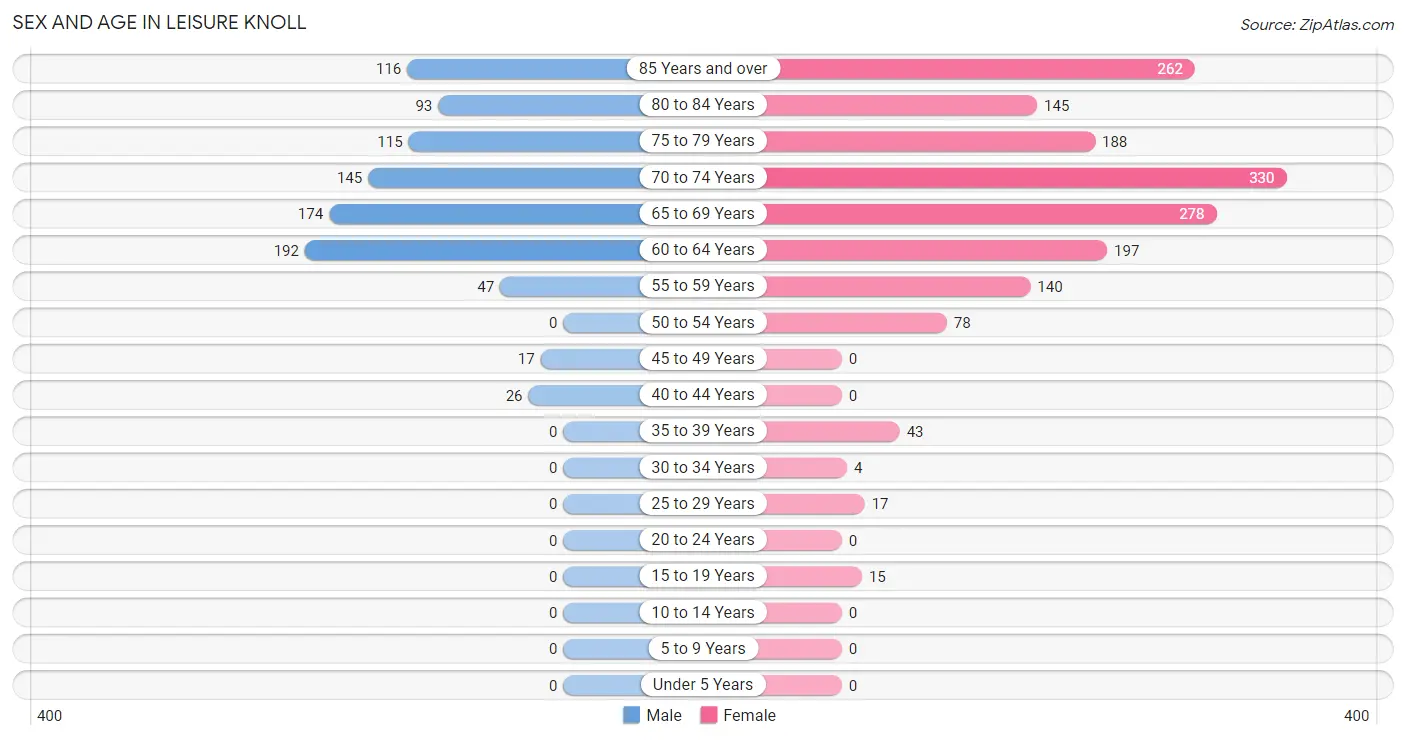
| Age Bracket | Male | Female |
| Under 5 Years | 0 (0.0%) | 0 (0.0%) |
| 5 to 9 Years | 0 (0.0%) | 0 (0.0%) |
| 10 to 14 Years | 0 (0.0%) | 0 (0.0%) |
| 15 to 19 Years | 0 (0.0%) | 15 (0.9%) |
| 20 to 24 Years | 0 (0.0%) | 0 (0.0%) |
| 25 to 29 Years | 0 (0.0%) | 17 (1.0%) |
| 30 to 34 Years | 0 (0.0%) | 4 (0.2%) |
| 35 to 39 Years | 0 (0.0%) | 43 (2.5%) |
| 40 to 44 Years | 26 (2.8%) | 0 (0.0%) |
| 45 to 49 Years | 17 (1.8%) | 0 (0.0%) |
| 50 to 54 Years | 0 (0.0%) | 78 (4.6%) |
| 55 to 59 Years | 47 (5.1%) | 140 (8.3%) |
| 60 to 64 Years | 192 (20.8%) | 197 (11.6%) |
| 65 to 69 Years | 174 (18.8%) | 278 (16.4%) |
| 70 to 74 Years | 145 (15.7%) | 330 (19.5%) |
| 75 to 79 Years | 115 (12.4%) | 188 (11.1%) |
| 80 to 84 Years | 93 (10.1%) | 145 (8.5%) |
| 85 Years and over | 116 (12.5%) | 262 (15.4%) |
| Total | 925 (100.0%) | 1,697 (100.0%) |
Families and Households in Leisure Knoll
Median Family Size in Leisure Knoll
The median family size in Leisure Knoll is 2.12 persons per family, with single male/father families (29 | 3.5%) accounting for the largest median family size of 2.24 persons per family. On the other hand, single female/mother families (142 | 17.2%) represent the smallest median family size with 2.05 persons per family.
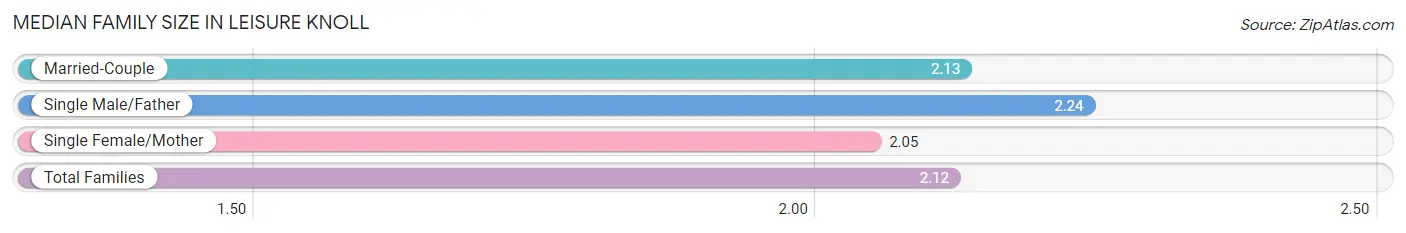
| Family Type | # Families | Family Size |
| Married-Couple | 655 (79.3%) | 2.13 |
| Single Male/Father | 29 (3.5%) | 2.24 |
| Single Female/Mother | 142 (17.2%) | 2.05 |
| Total Families | 826 (100.0%) | 2.12 |
Median Household Size in Leisure Knoll
The median household size in Leisure Knoll is 1.64 persons per household, with single male/father households (29 | 1.9%) accounting for the largest median household size of 2.24 persons per household. non-family households (697 | 45.8%) represent the smallest median household size with 1.03 persons per household.
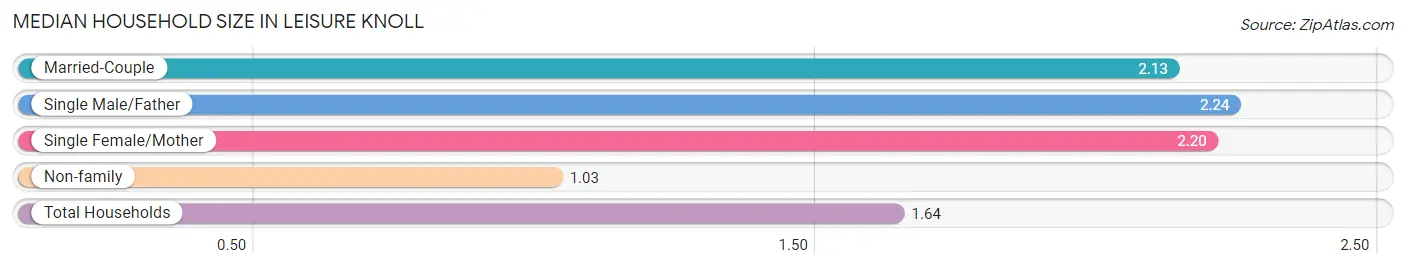
| Household Type | # Households | Household Size |
| Married-Couple | 655 (43.0%) | 2.13 |
| Single Male/Father | 29 (1.9%) | 2.24 |
| Single Female/Mother | 142 (9.3%) | 2.20 |
| Non-family | 697 (45.8%) | 1.03 |
| Total Households | 1,523 (100.0%) | 1.64 |
Household Size by Marriage Status in Leisure Knoll
Out of a total of 1,523 households in Leisure Knoll, 826 (54.2%) are family households, while 697 (45.8%) are nonfamily households. The most numerous type of family households are 2-person households, comprising 790, and the most common type of nonfamily households are 1-person households, comprising 674.
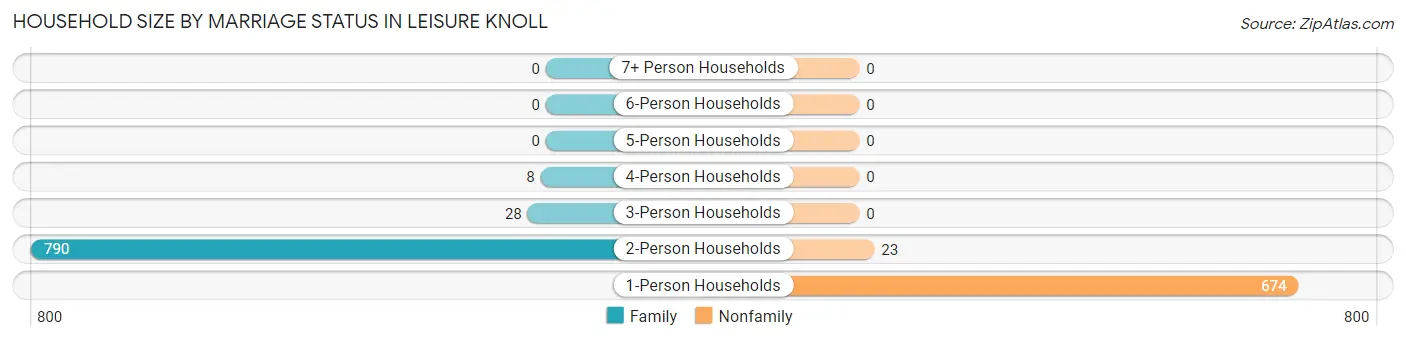
| Household Size | Family Households | Nonfamily Households |
| 1-Person Households | - | 674 (44.3%) |
| 2-Person Households | 790 (51.9%) | 23 (1.5%) |
| 3-Person Households | 28 (1.8%) | 0 (0.0%) |
| 4-Person Households | 8 (0.5%) | 0 (0.0%) |
| 5-Person Households | 0 (0.0%) | 0 (0.0%) |
| 6-Person Households | 0 (0.0%) | 0 (0.0%) |
| 7+ Person Households | 0 (0.0%) | 0 (0.0%) |
| Total | 826 (54.2%) | 697 (45.8%) |
Female Fertility in Leisure Knoll
Fertility by Age in Leisure Knoll
| Age Bracket | Women with Births | Births / 1,000 Women |
| 15 to 19 years | 0 (0.0%) | 0.0 |
| 20 to 34 years | 0 (0.0%) | 0.0 |
| 35 to 50 years | 0 (0.0%) | 0.0 |
| Total | 0 (0.0%) | 0.0 |
Fertility by Age by Marriage Status in Leisure Knoll
| Age Bracket | Married | Unmarried |
| 15 to 19 years | 0 (0.0%) | 0 (0.0%) |
| 20 to 34 years | 0 (0.0%) | 0 (0.0%) |
| 35 to 50 years | 0 (0.0%) | 0 (0.0%) |
| Total | 0 (0.0%) | 0 (0.0%) |
Fertility by Education in Leisure Knoll
| Educational Attainment | Women with Births | Births / 1,000 Women |
| Less than High School | 0 (0.0%) | 0.0 |
| High School Diploma | 0 (0.0%) | 0.0 |
| College or Associate's Degree | 0 (0.0%) | 0.0 |
| Bachelor's Degree | 0 (0.0%) | 0.0 |
| Graduate Degree | 0 (0.0%) | 0.0 |
| Total | 0 (0.0%) | 0.0 |
Fertility by Education by Marriage Status in Leisure Knoll
| Educational Attainment | Married | Unmarried |
| Less than High School | 0 (0.0%) | 0 (0.0%) |
| High School Diploma | 0 (0.0%) | 0 (0.0%) |
| College or Associate's Degree | 0 (0.0%) | 0 (0.0%) |
| Bachelor's Degree | 0 (0.0%) | 0 (0.0%) |
| Graduate Degree | 0 (0.0%) | 0 (0.0%) |
| Total | 0 (0.0%) | 0 (0.0%) |
Employment Characteristics in Leisure Knoll
Employment by Class of Employer in Leisure Knoll
Among the 784 employed individuals in Leisure Knoll, private company employees (490 | 62.5%), not-for-profit organizations (88 | 11.2%), and local government employees (70 | 8.9%) make up the most common classes of employment.
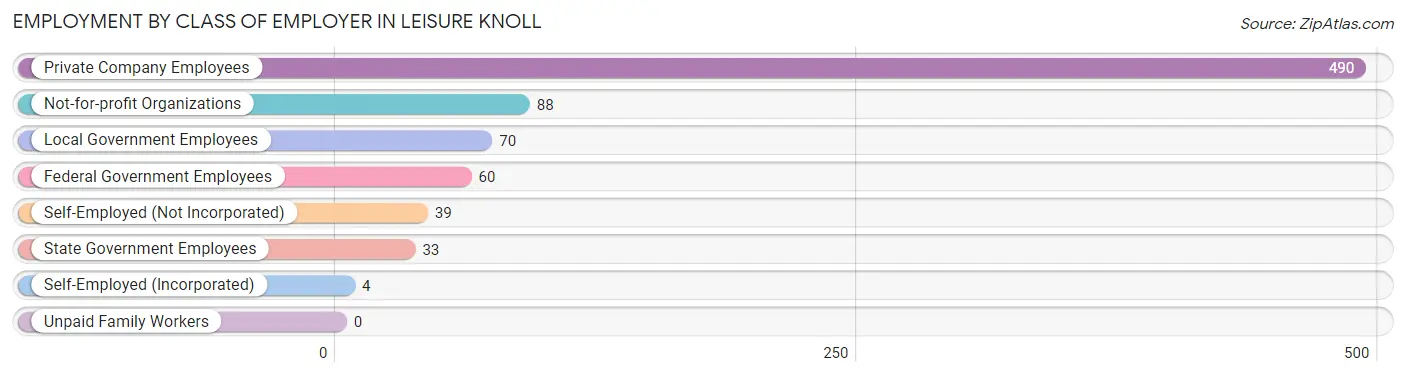
| Employer Class | # Employees | % Employees |
| Private Company Employees | 490 | 62.5% |
| Self-Employed (Incorporated) | 4 | 0.5% |
| Self-Employed (Not Incorporated) | 39 | 5.0% |
| Not-for-profit Organizations | 88 | 11.2% |
| Local Government Employees | 70 | 8.9% |
| State Government Employees | 33 | 4.2% |
| Federal Government Employees | 60 | 7.6% |
| Unpaid Family Workers | 0 | 0.0% |
| Total | 784 | 100.0% |
Employment Status by Age in Leisure Knoll
According to the labor force statistics for Leisure Knoll, out of the total population over 16 years of age (2,622), 31.3% or 821 individuals are in the labor force, with 4.4% or 36 of them unemployed. The age group with the highest labor force participation rate is 16 to 19 years, with 100.0% or 15 individuals in the labor force. Within the labor force, the 16 to 19 years age range has the highest percentage of unemployed individuals, with 100.0% or 15 of them being unemployed.
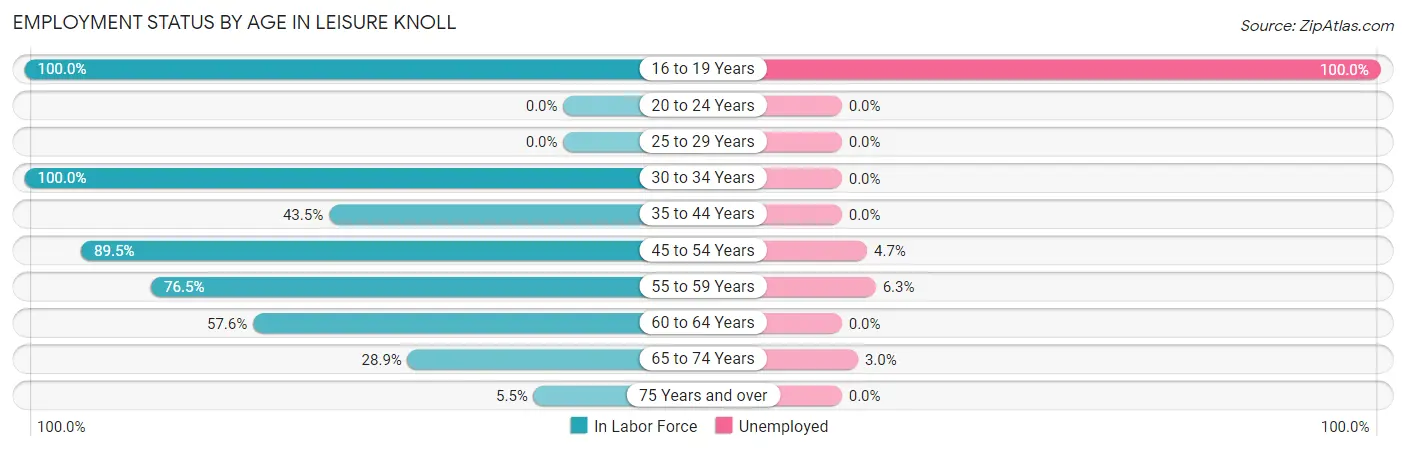
| Age Bracket | In Labor Force | Unemployed |
| 16 to 19 Years | 15 (100.0%) | 15 (100.0%) |
| 20 to 24 Years | 0 (0.0%) | 0 (0.0%) |
| 25 to 29 Years | 0 (0.0%) | 0 (0.0%) |
| 30 to 34 Years | 4 (100.0%) | 0 (0.0%) |
| 35 to 44 Years | 30 (43.5%) | 0 (0.0%) |
| 45 to 54 Years | 85 (89.5%) | 4 (4.7%) |
| 55 to 59 Years | 143 (76.5%) | 9 (6.3%) |
| 60 to 64 Years | 224 (57.6%) | 0 (0.0%) |
| 65 to 74 Years | 268 (28.9%) | 8 (3.0%) |
| 75 Years and over | 51 (5.5%) | 0 (0.0%) |
| Total | 821 (31.3%) | 36 (4.4%) |
Employment Status by Educational Attainment in Leisure Knoll
According to labor force statistics for Leisure Knoll, 63.9% of individuals (486) out of the total population between 25 and 64 years of age (761) are in the labor force, with 2.7% or 13 of them being unemployed. The group with the highest labor force participation rate are those with the educational attainment of bachelor's degree or higher, with 84.4% or 211 individuals in the labor force. Within the labor force, individuals with less than high school education have the highest percentage of unemployment, with 50.0% or 9 of them being unemployed.
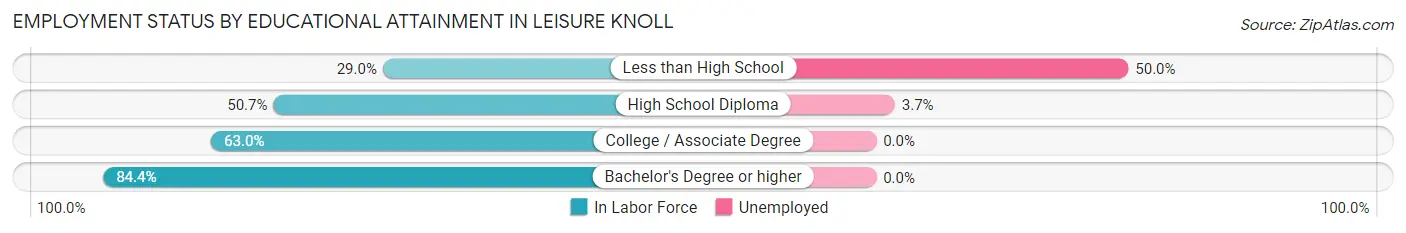
| Educational Attainment | In Labor Force | Unemployed |
| Less than High School | 18 (29.0%) | 31 (50.0%) |
| High School Diploma | 107 (50.7%) | 8 (3.7%) |
| College / Associate Degree | 150 (63.0%) | 0 (0.0%) |
| Bachelor's Degree or higher | 211 (84.4%) | 0 (0.0%) |
| Total | 486 (63.9%) | 21 (2.7%) |
Employment Occupations by Sex in Leisure Knoll
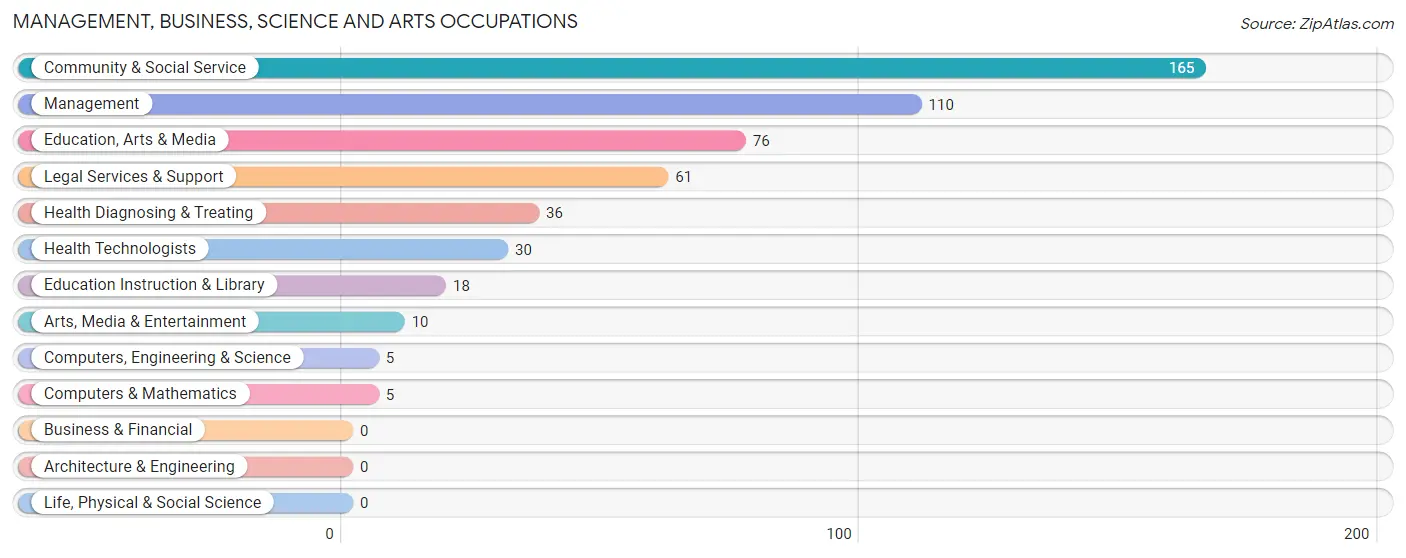
Management, Business, Science and Arts Occupations
The most common Management, Business, Science and Arts occupations in Leisure Knoll are Community & Social Service (165 | 21.0%), Management (110 | 14.0%), Education, Arts & Media (76 | 9.7%), Legal Services & Support (61 | 7.8%), and Health Diagnosing & Treating (36 | 4.6%).
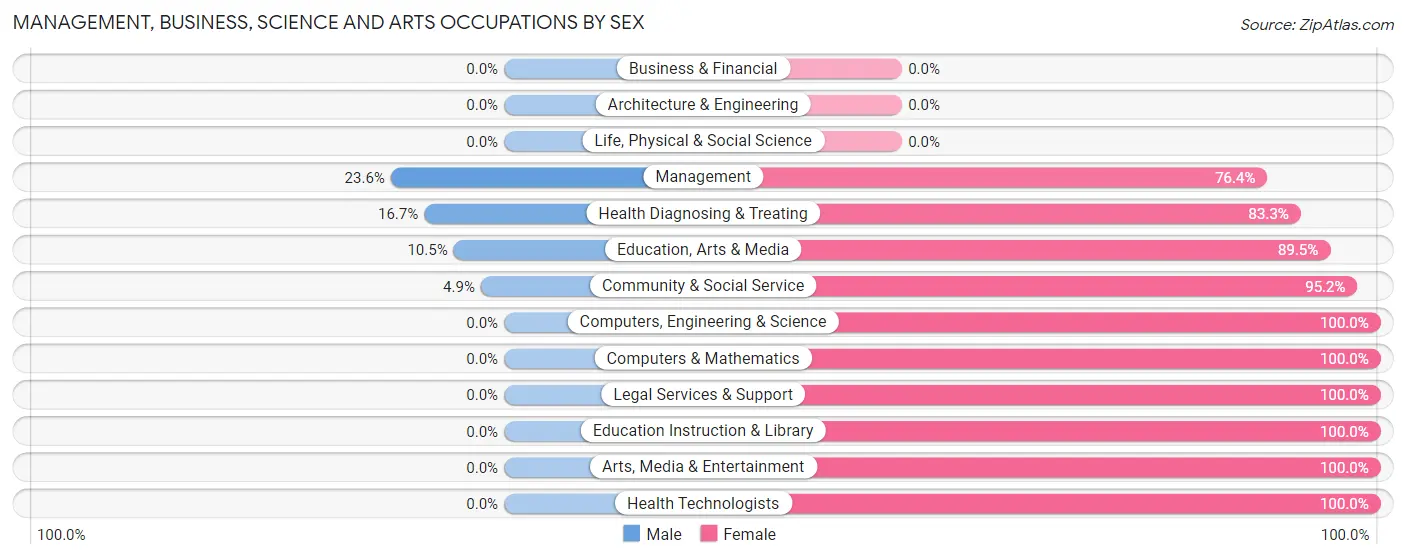
Management, Business, Science and Arts Occupations by Sex
Within the Management, Business, Science and Arts occupations in Leisure Knoll, the most male-oriented occupations are Management (23.6%), Health Diagnosing & Treating (16.7%), and Education, Arts & Media (10.5%), while the most female-oriented occupations are Computers, Engineering & Science (100.0%), Computers & Mathematics (100.0%), and Legal Services & Support (100.0%).
| Occupation | Male | Female |
| Management | 26 (23.6%) | 84 (76.4%) |
| Business & Financial | 0 (0.0%) | 0 (0.0%) |
| Computers, Engineering & Science | 0 (0.0%) | 5 (100.0%) |
| Computers & Mathematics | 0 (0.0%) | 5 (100.0%) |
| Architecture & Engineering | 0 (0.0%) | 0 (0.0%) |
| Life, Physical & Social Science | 0 (0.0%) | 0 (0.0%) |
| Community & Social Service | 8 (4.9%) | 157 (95.2%) |
| Education, Arts & Media | 8 (10.5%) | 68 (89.5%) |
| Legal Services & Support | 0 (0.0%) | 61 (100.0%) |
| Education Instruction & Library | 0 (0.0%) | 18 (100.0%) |
| Arts, Media & Entertainment | 0 (0.0%) | 10 (100.0%) |
| Health Diagnosing & Treating | 6 (16.7%) | 30 (83.3%) |
| Health Technologists | 0 (0.0%) | 30 (100.0%) |
| Total (Category) | 40 (12.7%) | 276 (87.3%) |
| Total (Overall) | 270 (34.4%) | 514 (65.6%) |
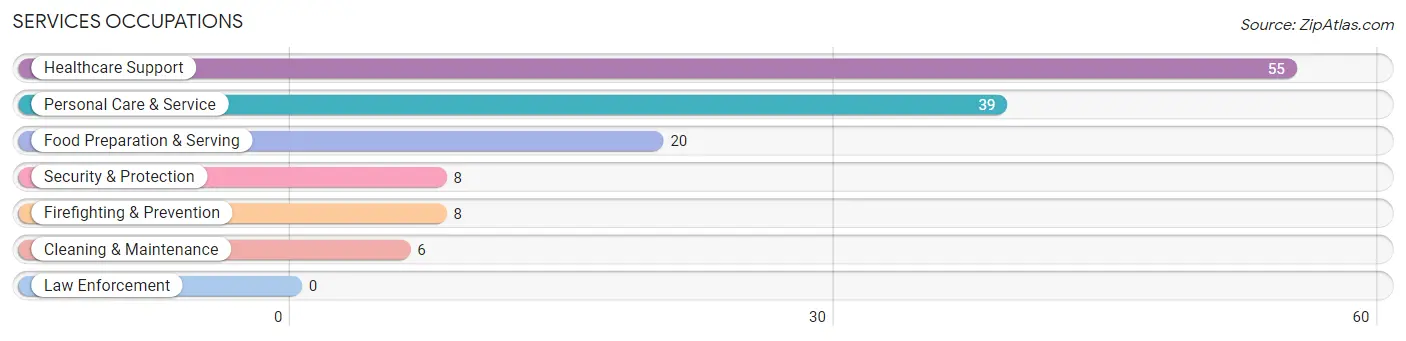
Services Occupations
The most common Services occupations in Leisure Knoll are Healthcare Support (55 | 7.0%), Personal Care & Service (39 | 5.0%), Food Preparation & Serving (20 | 2.5%), Security & Protection (8 | 1.0%), and Firefighting & Prevention (8 | 1.0%).
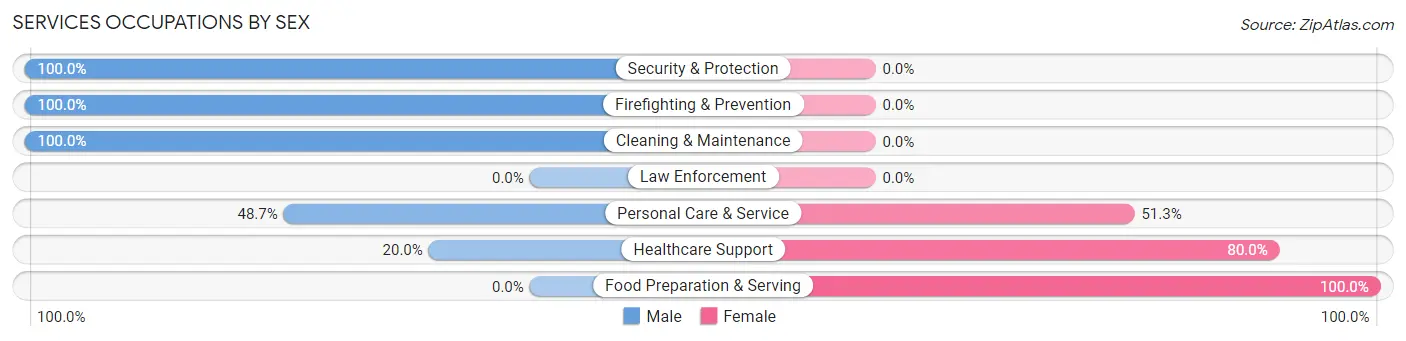
Services Occupations by Sex
Within the Services occupations in Leisure Knoll, the most male-oriented occupations are Security & Protection (100.0%), Firefighting & Prevention (100.0%), and Cleaning & Maintenance (100.0%), while the most female-oriented occupations are Food Preparation & Serving (100.0%), Healthcare Support (80.0%), and Personal Care & Service (51.3%).
| Occupation | Male | Female |
| Healthcare Support | 11 (20.0%) | 44 (80.0%) |
| Security & Protection | 8 (100.0%) | 0 (0.0%) |
| Firefighting & Prevention | 8 (100.0%) | 0 (0.0%) |
| Law Enforcement | 0 (0.0%) | 0 (0.0%) |
| Food Preparation & Serving | 0 (0.0%) | 20 (100.0%) |
| Cleaning & Maintenance | 6 (100.0%) | 0 (0.0%) |
| Personal Care & Service | 19 (48.7%) | 20 (51.3%) |
| Total (Category) | 44 (34.4%) | 84 (65.6%) |
| Total (Overall) | 270 (34.4%) | 514 (65.6%) |
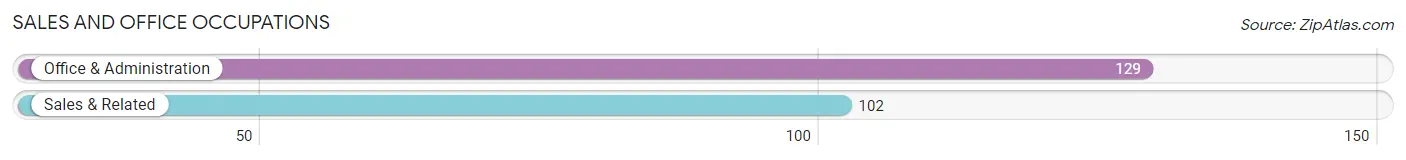
Sales and Office Occupations
The most common Sales and Office occupations in Leisure Knoll are Office & Administration (129 | 16.5%), and Sales & Related (102 | 13.0%).
Sales and Office Occupations by Sex
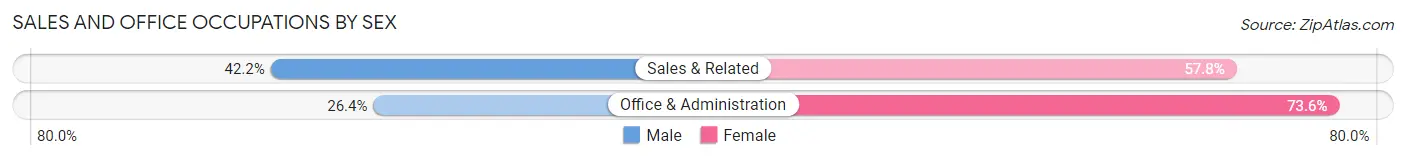
| Occupation | Male | Female |
| Sales & Related | 43 (42.2%) | 59 (57.8%) |
| Office & Administration | 34 (26.4%) | 95 (73.6%) |
| Total (Category) | 77 (33.3%) | 154 (66.7%) |
| Total (Overall) | 270 (34.4%) | 514 (65.6%) |
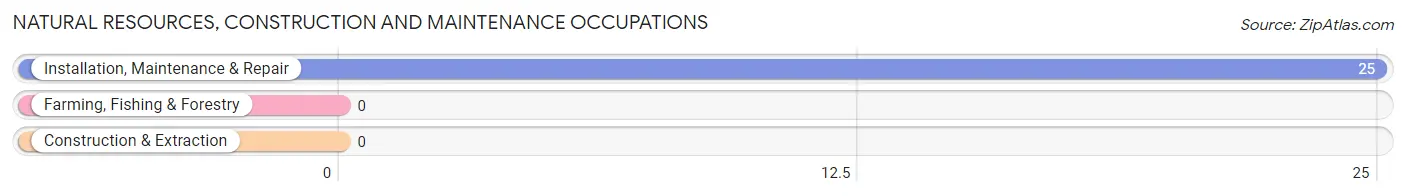
Natural Resources, Construction and Maintenance Occupations
The most common Natural Resources, Construction and Maintenance occupations in Leisure Knoll are , and Installation, Maintenance & Repair (25 | 3.2%).
Natural Resources, Construction and Maintenance Occupations by Sex

| Occupation | Male | Female |
| Farming, Fishing & Forestry | 0 (0.0%) | 0 (0.0%) |
| Construction & Extraction | 0 (0.0%) | 0 (0.0%) |
| Installation, Maintenance & Repair | 25 (100.0%) | 0 (0.0%) |
| Total (Category) | 25 (100.0%) | 0 (0.0%) |
| Total (Overall) | 270 (34.4%) | 514 (65.6%) |
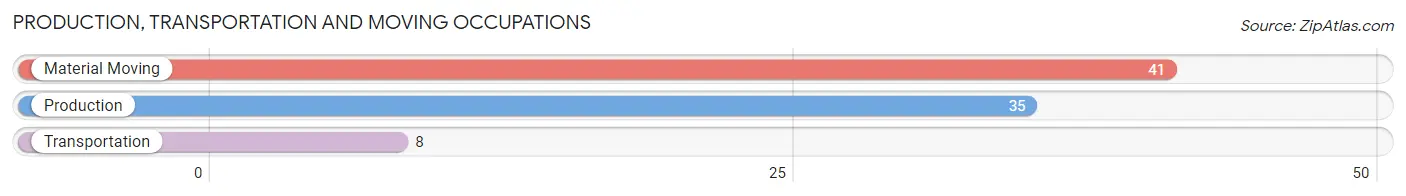
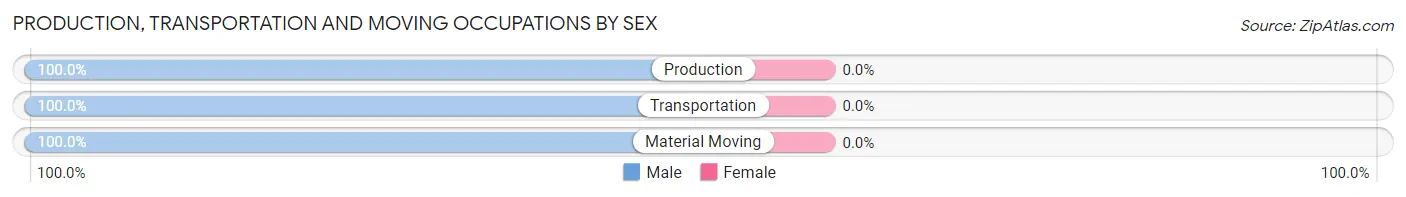
Production, Transportation and Moving Occupations
The most common Production, Transportation and Moving occupations in Leisure Knoll are Material Moving (41 | 5.2%), Production (35 | 4.5%), and Transportation (8 | 1.0%).
Production, Transportation and Moving Occupations by Sex
| Occupation | Male | Female |
| Production | 35 (100.0%) | 0 (0.0%) |
| Transportation | 8 (100.0%) | 0 (0.0%) |
| Material Moving | 41 (100.0%) | 0 (0.0%) |
| Total (Category) | 84 (100.0%) | 0 (0.0%) |
| Total (Overall) | 270 (34.4%) | 514 (65.6%) |
Employment Industries by Sex in Leisure Knoll
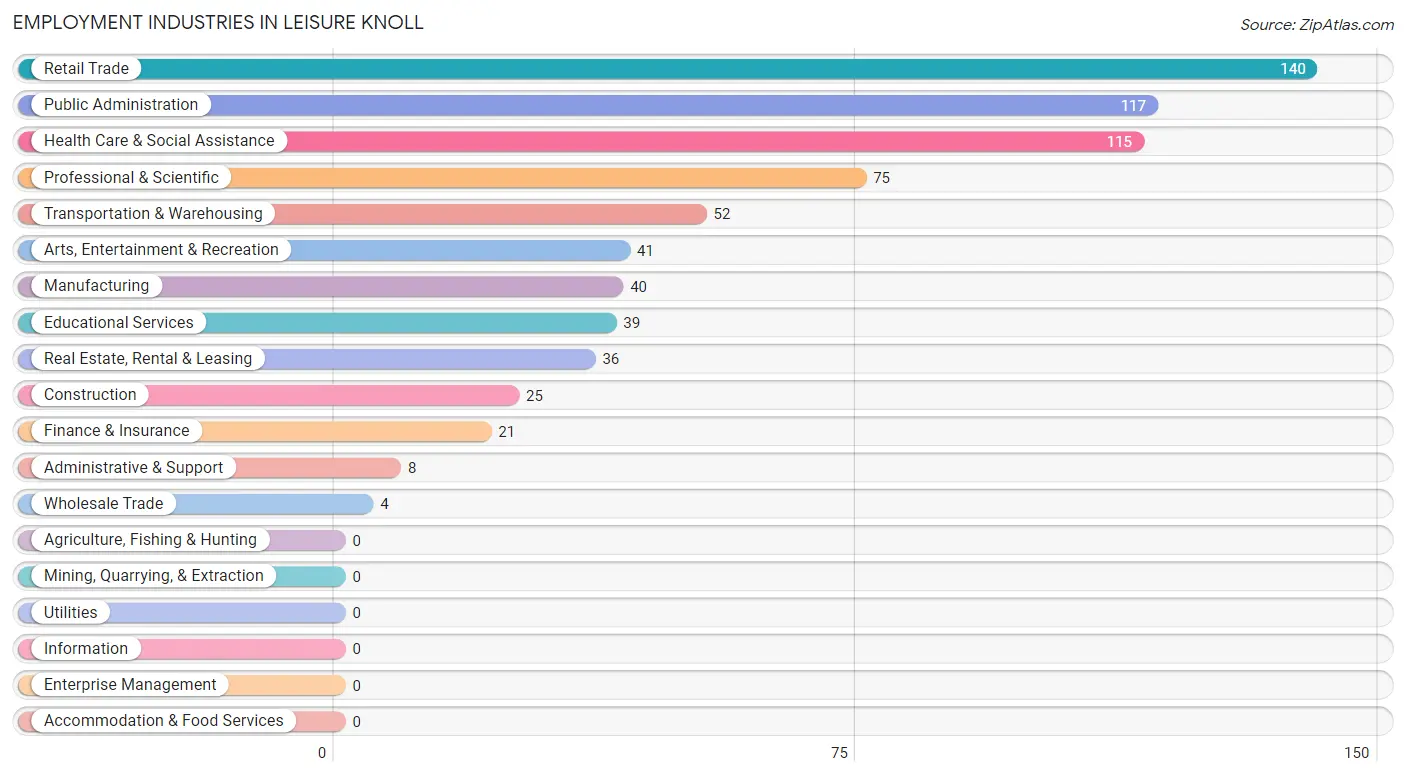
Employment Industries in Leisure Knoll
The major employment industries in Leisure Knoll include Retail Trade (140 | 17.9%), Public Administration (117 | 14.9%), Health Care & Social Assistance (115 | 14.7%), Professional & Scientific (75 | 9.6%), and Transportation & Warehousing (52 | 6.6%).
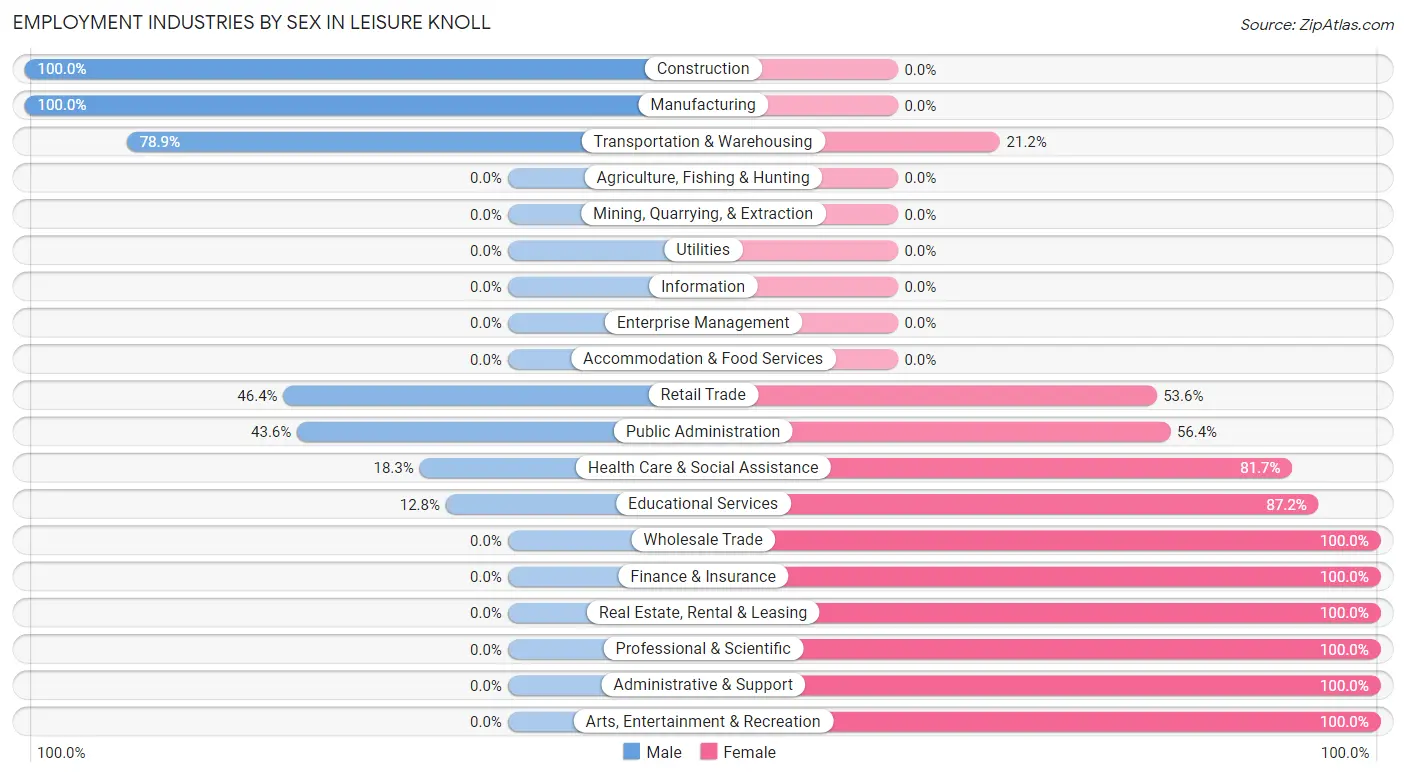
Employment Industries by Sex in Leisure Knoll
The Leisure Knoll industries that see more men than women are Construction (100.0%), Manufacturing (100.0%), and Transportation & Warehousing (78.8%), whereas the industries that tend to have a higher number of women are Wholesale Trade (100.0%), Finance & Insurance (100.0%), and Real Estate, Rental & Leasing (100.0%).
| Industry | Male | Female |
| Agriculture, Fishing & Hunting | 0 (0.0%) | 0 (0.0%) |
| Mining, Quarrying, & Extraction | 0 (0.0%) | 0 (0.0%) |
| Construction | 25 (100.0%) | 0 (0.0%) |
| Manufacturing | 40 (100.0%) | 0 (0.0%) |
| Wholesale Trade | 0 (0.0%) | 4 (100.0%) |
| Retail Trade | 65 (46.4%) | 75 (53.6%) |
| Transportation & Warehousing | 41 (78.8%) | 11 (21.1%) |
| Utilities | 0 (0.0%) | 0 (0.0%) |
| Information | 0 (0.0%) | 0 (0.0%) |
| Finance & Insurance | 0 (0.0%) | 21 (100.0%) |
| Real Estate, Rental & Leasing | 0 (0.0%) | 36 (100.0%) |
| Professional & Scientific | 0 (0.0%) | 75 (100.0%) |
| Enterprise Management | 0 (0.0%) | 0 (0.0%) |
| Administrative & Support | 0 (0.0%) | 8 (100.0%) |
| Educational Services | 5 (12.8%) | 34 (87.2%) |
| Health Care & Social Assistance | 21 (18.3%) | 94 (81.7%) |
| Arts, Entertainment & Recreation | 0 (0.0%) | 41 (100.0%) |
| Accommodation & Food Services | 0 (0.0%) | 0 (0.0%) |
| Public Administration | 51 (43.6%) | 66 (56.4%) |
| Total | 270 (34.4%) | 514 (65.6%) |
Education in Leisure Knoll
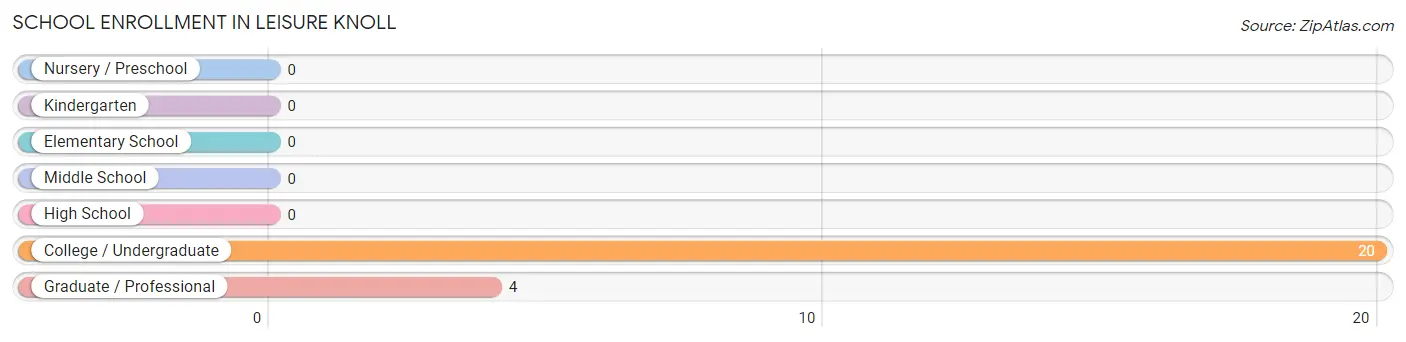
School Enrollment in Leisure Knoll
The most common levels of schooling among the 24 students in Leisure Knoll are college / undergraduate (20 | 83.3%), and graduate / professional (4 | 16.7%).
| School Level | # Students | % Students |
| Nursery / Preschool | 0 | 0.0% |
| Kindergarten | 0 | 0.0% |
| Elementary School | 0 | 0.0% |
| Middle School | 0 | 0.0% |
| High School | 0 | 0.0% |
| College / Undergraduate | 20 | 83.3% |
| Graduate / Professional | 4 | 16.7% |
| Total | 24 | 100.0% |
School Enrollment by Age by Funding Source in Leisure Knoll
Out of a total of 24 students who are enrolled in schools in Leisure Knoll, 4 (16.7%) attend a private institution, while the remaining 20 (83.3%) are enrolled in public schools. The age group of 35 years and over has the highest likelihood of being enrolled in private schools, with 4 (16.7% in the age bracket) enrolled. Conversely, the age group of 35 years and over has the lowest likelihood of being enrolled in a private school, with 20 (83.3% in the age bracket) attending a public institution.
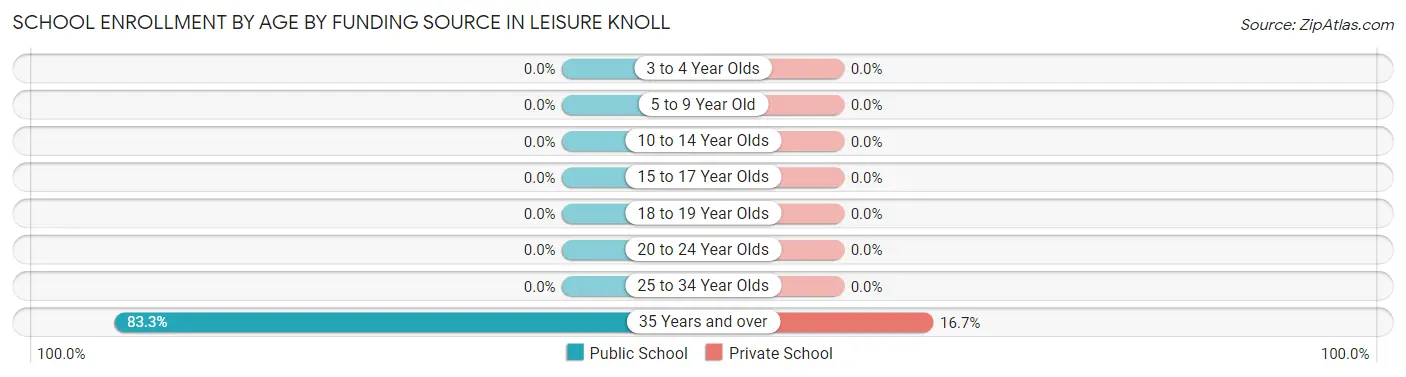
| Age Bracket | Public School | Private School |
| 3 to 4 Year Olds | 0 (0.0%) | 0 (0.0%) |
| 5 to 9 Year Old | 0 (0.0%) | 0 (0.0%) |
| 10 to 14 Year Olds | 0 (0.0%) | 0 (0.0%) |
| 15 to 17 Year Olds | 0 (0.0%) | 0 (0.0%) |
| 18 to 19 Year Olds | 0 (0.0%) | 0 (0.0%) |
| 20 to 24 Year Olds | 0 (0.0%) | 0 (0.0%) |
| 25 to 34 Year Olds | 0 (0.0%) | 0 (0.0%) |
| 35 Years and over | 20 (83.3%) | 4 (16.7%) |
| Total | 20 (83.3%) | 4 (16.7%) |
Educational Attainment by Field of Study in Leisure Knoll
Business (197 | 33.2%), psychology (62 | 10.5%), multidisciplinary studies (61 | 10.3%), education (56 | 9.4%), and social sciences (46 | 7.8%) are the most common fields of study among 593 individuals in Leisure Knoll who have obtained a bachelor's degree or higher.
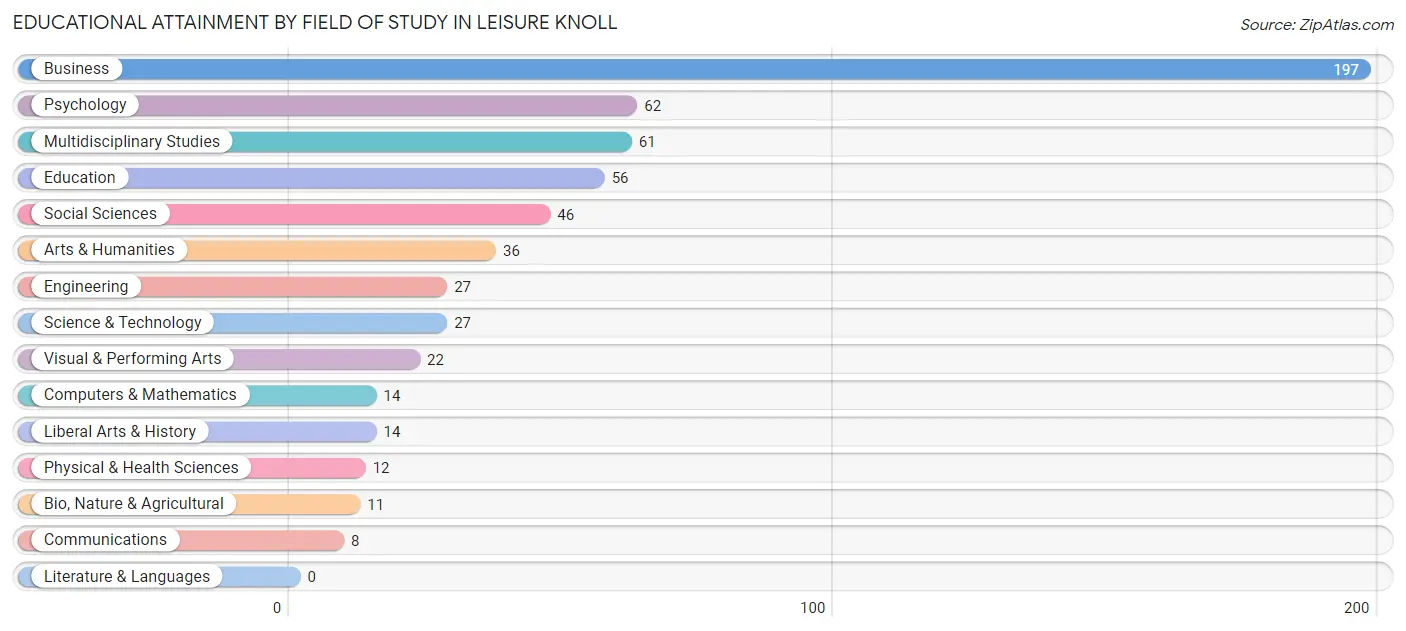
| Field of Study | # Graduates | % Graduates |
| Computers & Mathematics | 14 | 2.4% |
| Bio, Nature & Agricultural | 11 | 1.8% |
| Physical & Health Sciences | 12 | 2.0% |
| Psychology | 62 | 10.5% |
| Social Sciences | 46 | 7.8% |
| Engineering | 27 | 4.5% |
| Multidisciplinary Studies | 61 | 10.3% |
| Science & Technology | 27 | 4.5% |
| Business | 197 | 33.2% |
| Education | 56 | 9.4% |
| Literature & Languages | 0 | 0.0% |
| Liberal Arts & History | 14 | 2.4% |
| Visual & Performing Arts | 22 | 3.7% |
| Communications | 8 | 1.3% |
| Arts & Humanities | 36 | 6.1% |
| Total | 593 | 100.0% |
Transportation & Commute in Leisure Knoll
Vehicle Availability by Sex in Leisure Knoll
The most prevalent vehicle ownership categories in Leisure Knoll are males with 2 vehicles (210, accounting for 77.8%) and females with 2 vehicles (234, making up 40.9%).
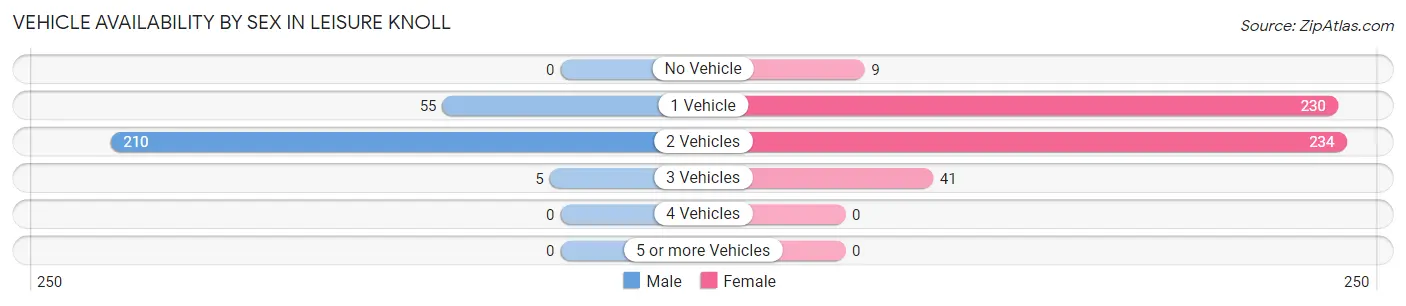
| Vehicles Available | Male | Female |
| No Vehicle | 0 (0.0%) | 9 (1.8%) |
| 1 Vehicle | 55 (20.4%) | 230 (44.8%) |
| 2 Vehicles | 210 (77.8%) | 234 (45.5%) |
| 3 Vehicles | 5 (1.8%) | 41 (8.0%) |
| 4 Vehicles | 0 (0.0%) | 0 (0.0%) |
| 5 or more Vehicles | 0 (0.0%) | 0 (0.0%) |
| Total | 270 (100.0%) | 514 (100.0%) |
Commute Time in Leisure Knoll
The most frequently occuring commute durations in Leisure Knoll are 15 to 19 minutes (147 commuters, 21.5%), 20 to 24 minutes (124 commuters, 18.1%), and 30 to 34 minutes (100 commuters, 14.6%).
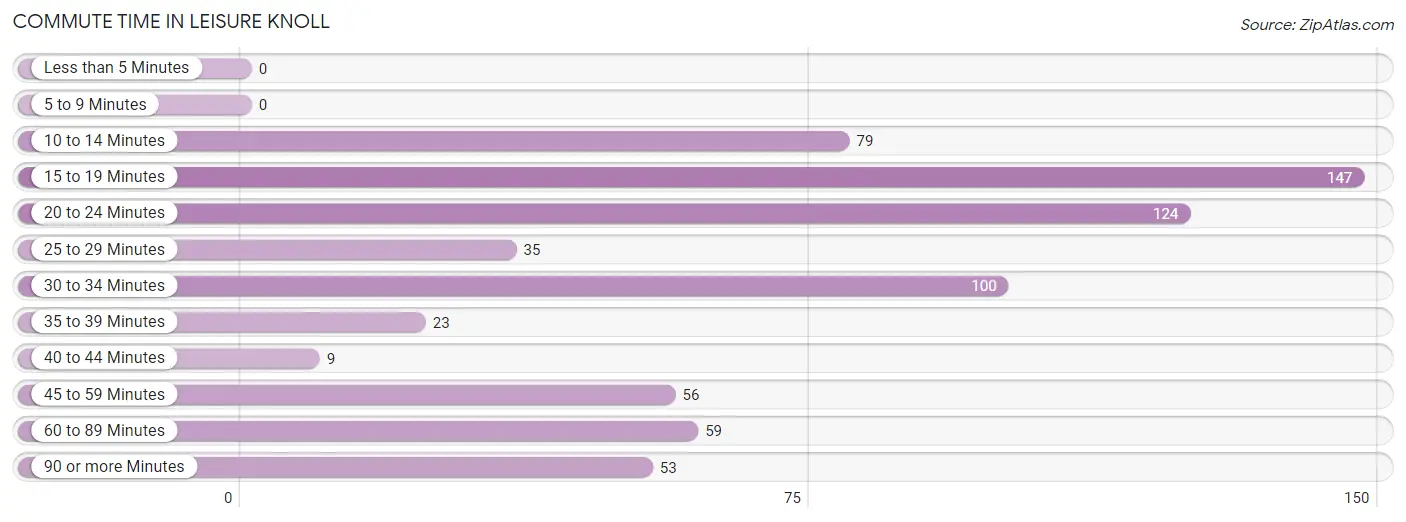
| Commute Time | # Commuters | % Commuters |
| Less than 5 Minutes | 0 | 0.0% |
| 5 to 9 Minutes | 0 | 0.0% |
| 10 to 14 Minutes | 79 | 11.5% |
| 15 to 19 Minutes | 147 | 21.5% |
| 20 to 24 Minutes | 124 | 18.1% |
| 25 to 29 Minutes | 35 | 5.1% |
| 30 to 34 Minutes | 100 | 14.6% |
| 35 to 39 Minutes | 23 | 3.4% |
| 40 to 44 Minutes | 9 | 1.3% |
| 45 to 59 Minutes | 56 | 8.2% |
| 60 to 89 Minutes | 59 | 8.6% |
| 90 or more Minutes | 53 | 7.7% |
Commute Time by Sex in Leisure Knoll
The most common commute times in Leisure Knoll are 10 to 14 minutes (49 commuters, 18.1%) for males and 15 to 19 minutes (98 commuters, 23.6%) for females.
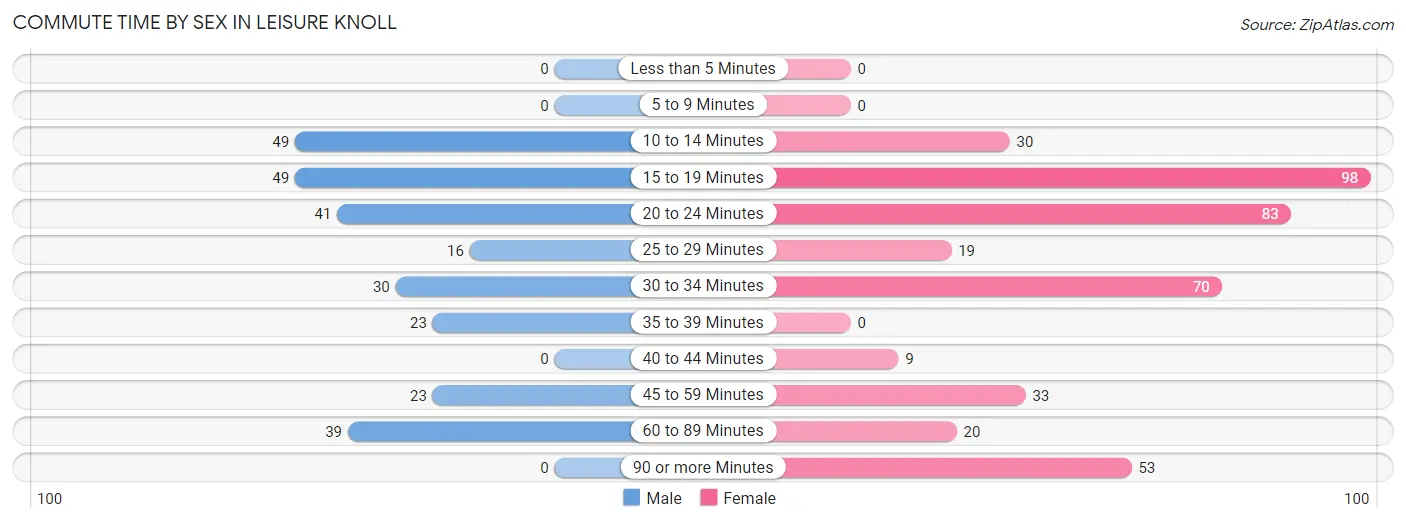
| Commute Time | Male | Female |
| Less than 5 Minutes | 0 (0.0%) | 0 (0.0%) |
| 5 to 9 Minutes | 0 (0.0%) | 0 (0.0%) |
| 10 to 14 Minutes | 49 (18.1%) | 30 (7.2%) |
| 15 to 19 Minutes | 49 (18.1%) | 98 (23.6%) |
| 20 to 24 Minutes | 41 (15.2%) | 83 (20.0%) |
| 25 to 29 Minutes | 16 (5.9%) | 19 (4.6%) |
| 30 to 34 Minutes | 30 (11.1%) | 70 (16.9%) |
| 35 to 39 Minutes | 23 (8.5%) | 0 (0.0%) |
| 40 to 44 Minutes | 0 (0.0%) | 9 (2.2%) |
| 45 to 59 Minutes | 23 (8.5%) | 33 (8.0%) |
| 60 to 89 Minutes | 39 (14.4%) | 20 (4.8%) |
| 90 or more Minutes | 0 (0.0%) | 53 (12.8%) |
Time of Departure to Work by Sex in Leisure Knoll
The most frequent times of departure to work in Leisure Knoll are 7:30 AM to 7:59 AM (78, 28.9%) for males and 8:00 AM to 8:29 AM (114, 27.5%) for females.
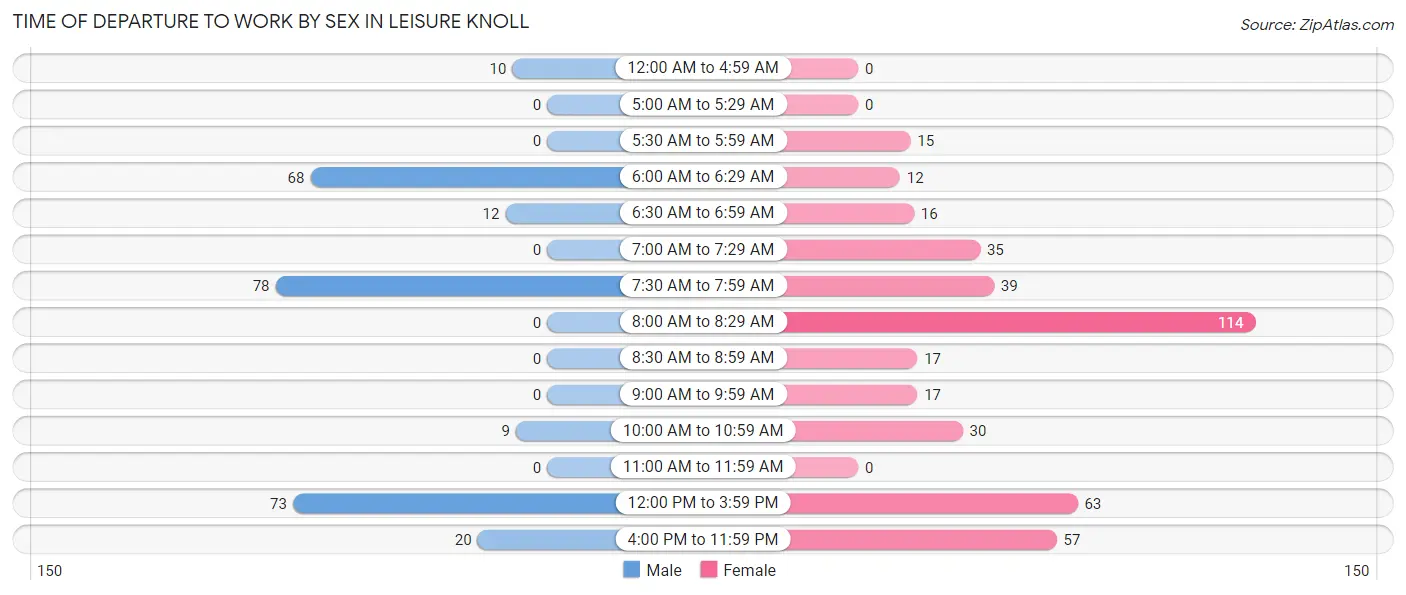
| Time of Departure | Male | Female |
| 12:00 AM to 4:59 AM | 10 (3.7%) | 0 (0.0%) |
| 5:00 AM to 5:29 AM | 0 (0.0%) | 0 (0.0%) |
| 5:30 AM to 5:59 AM | 0 (0.0%) | 15 (3.6%) |
| 6:00 AM to 6:29 AM | 68 (25.2%) | 12 (2.9%) |
| 6:30 AM to 6:59 AM | 12 (4.4%) | 16 (3.9%) |
| 7:00 AM to 7:29 AM | 0 (0.0%) | 35 (8.4%) |
| 7:30 AM to 7:59 AM | 78 (28.9%) | 39 (9.4%) |
| 8:00 AM to 8:29 AM | 0 (0.0%) | 114 (27.5%) |
| 8:30 AM to 8:59 AM | 0 (0.0%) | 17 (4.1%) |
| 9:00 AM to 9:59 AM | 0 (0.0%) | 17 (4.1%) |
| 10:00 AM to 10:59 AM | 9 (3.3%) | 30 (7.2%) |
| 11:00 AM to 11:59 AM | 0 (0.0%) | 0 (0.0%) |
| 12:00 PM to 3:59 PM | 73 (27.0%) | 63 (15.2%) |
| 4:00 PM to 11:59 PM | 20 (7.4%) | 57 (13.7%) |
| Total | 270 (100.0%) | 415 (100.0%) |
Housing Occupancy in Leisure Knoll
Occupancy by Ownership in Leisure Knoll
Of the total 1,523 dwellings in Leisure Knoll, owner-occupied units account for 1,418 (93.1%), while renter-occupied units make up 105 (6.9%).
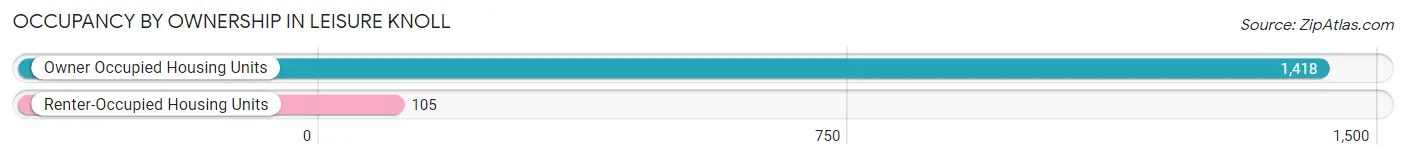
| Occupancy | # Housing Units | % Housing Units |
| Owner Occupied Housing Units | 1,418 | 93.1% |
| Renter-Occupied Housing Units | 105 | 6.9% |
| Total Occupied Housing Units | 1,523 | 100.0% |
Occupancy by Household Size in Leisure Knoll
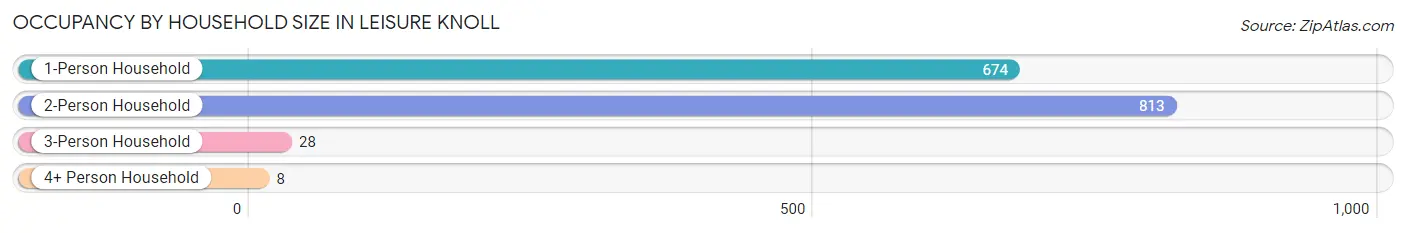
| Household Size | # Housing Units | % Housing Units |
| 1-Person Household | 674 | 44.3% |
| 2-Person Household | 813 | 53.4% |
| 3-Person Household | 28 | 1.8% |
| 4+ Person Household | 8 | 0.5% |
| Total Housing Units | 1,523 | 100.0% |
Occupancy by Ownership by Household Size in Leisure Knoll
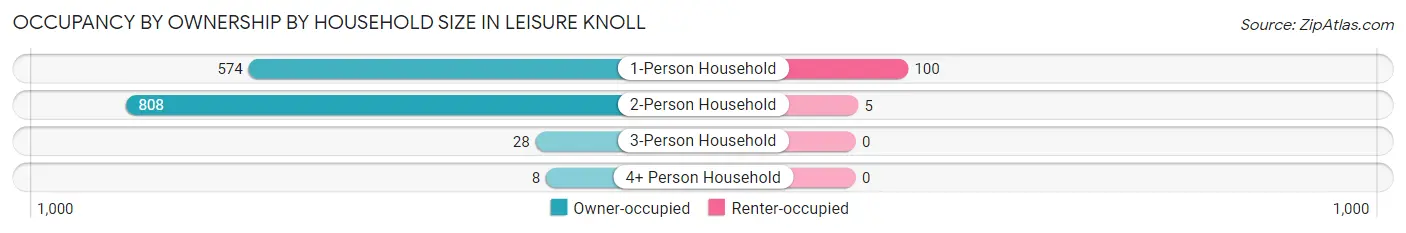
| Household Size | Owner-occupied | Renter-occupied |
| 1-Person Household | 574 (85.2%) | 100 (14.8%) |
| 2-Person Household | 808 (99.4%) | 5 (0.6%) |
| 3-Person Household | 28 (100.0%) | 0 (0.0%) |
| 4+ Person Household | 8 (100.0%) | 0 (0.0%) |
| Total Housing Units | 1,418 (93.1%) | 105 (6.9%) |
Occupancy by Educational Attainment in Leisure Knoll
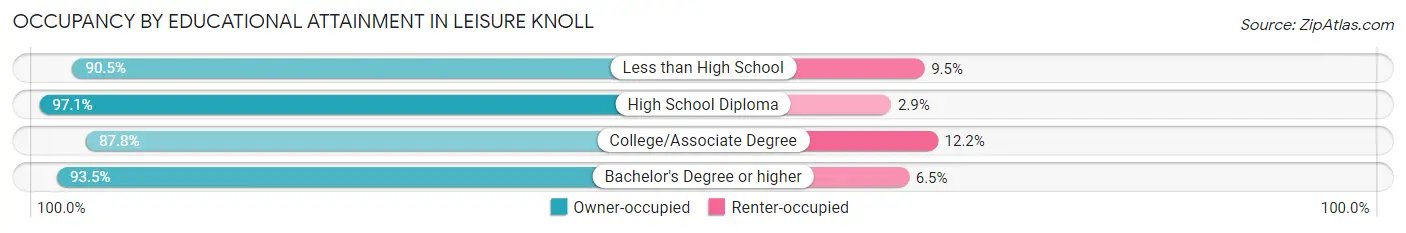
| Household Size | Owner-occupied | Renter-occupied |
| Less than High School | 76 (90.5%) | 8 (9.5%) |
| High School Diploma | 627 (97.1%) | 19 (2.9%) |
| College/Associate Degree | 411 (87.8%) | 57 (12.2%) |
| Bachelor's Degree or higher | 304 (93.5%) | 21 (6.5%) |
Occupancy by Age of Householder in Leisure Knoll
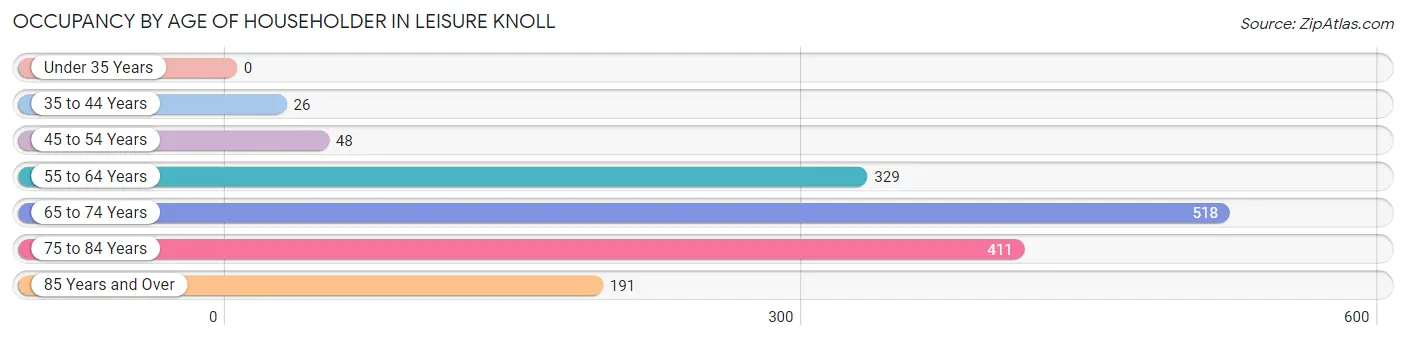
| Age Bracket | # Households | % Households |
| Under 35 Years | 0 | 0.0% |
| 35 to 44 Years | 26 | 1.7% |
| 45 to 54 Years | 48 | 3.2% |
| 55 to 64 Years | 329 | 21.6% |
| 65 to 74 Years | 518 | 34.0% |
| 75 to 84 Years | 411 | 27.0% |
| 85 Years and Over | 191 | 12.5% |
| Total | 1,523 | 100.0% |
Housing Finances in Leisure Knoll
Median Income by Occupancy in Leisure Knoll
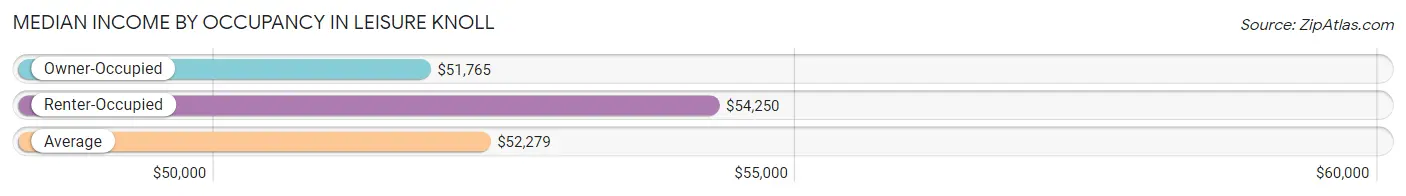
| Occupancy Type | # Households | Median Income |
| Owner-Occupied | 1,418 (93.1%) | $51,765 |
| Renter-Occupied | 105 (6.9%) | $54,250 |
| Average | 1,523 (100.0%) | $52,279 |
Occupancy by Householder Income Bracket in Leisure Knoll
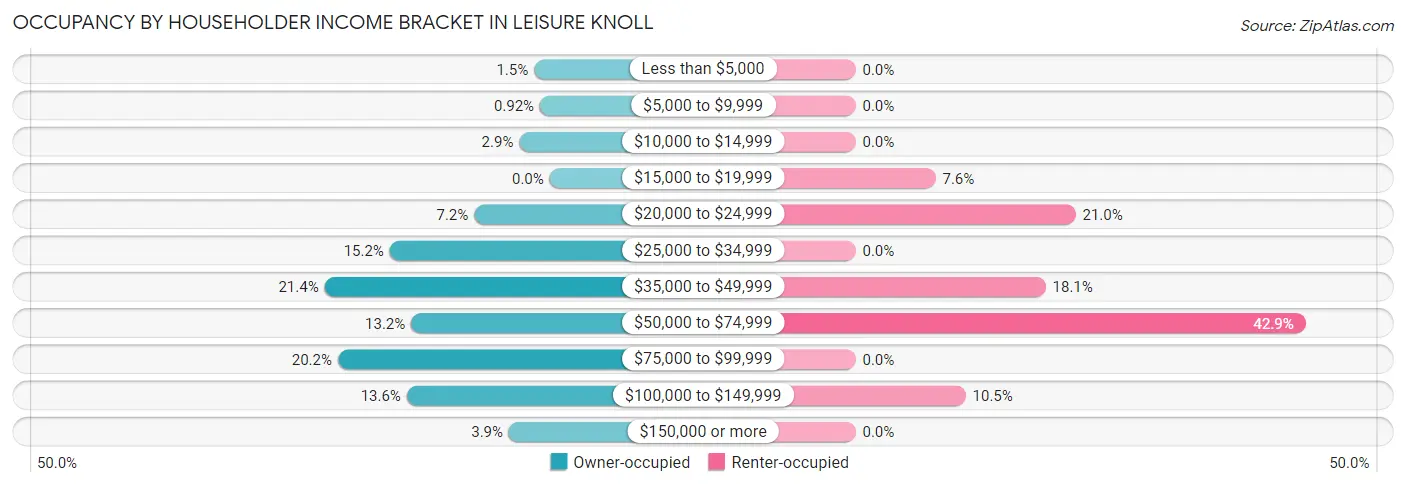
| Income Bracket | Owner-occupied | Renter-occupied |
| Less than $5,000 | 21 (1.5%) | 0 (0.0%) |
| $5,000 to $9,999 | 13 (0.9%) | 0 (0.0%) |
| $10,000 to $14,999 | 41 (2.9%) | 0 (0.0%) |
| $15,000 to $19,999 | 0 (0.0%) | 8 (7.6%) |
| $20,000 to $24,999 | 102 (7.2%) | 22 (20.9%) |
| $25,000 to $34,999 | 216 (15.2%) | 0 (0.0%) |
| $35,000 to $49,999 | 304 (21.4%) | 19 (18.1%) |
| $50,000 to $74,999 | 187 (13.2%) | 45 (42.9%) |
| $75,000 to $99,999 | 286 (20.2%) | 0 (0.0%) |
| $100,000 to $149,999 | 193 (13.6%) | 11 (10.5%) |
| $150,000 or more | 55 (3.9%) | 0 (0.0%) |
| Total | 1,418 (100.0%) | 105 (100.0%) |
Monthly Housing Cost Tiers in Leisure Knoll
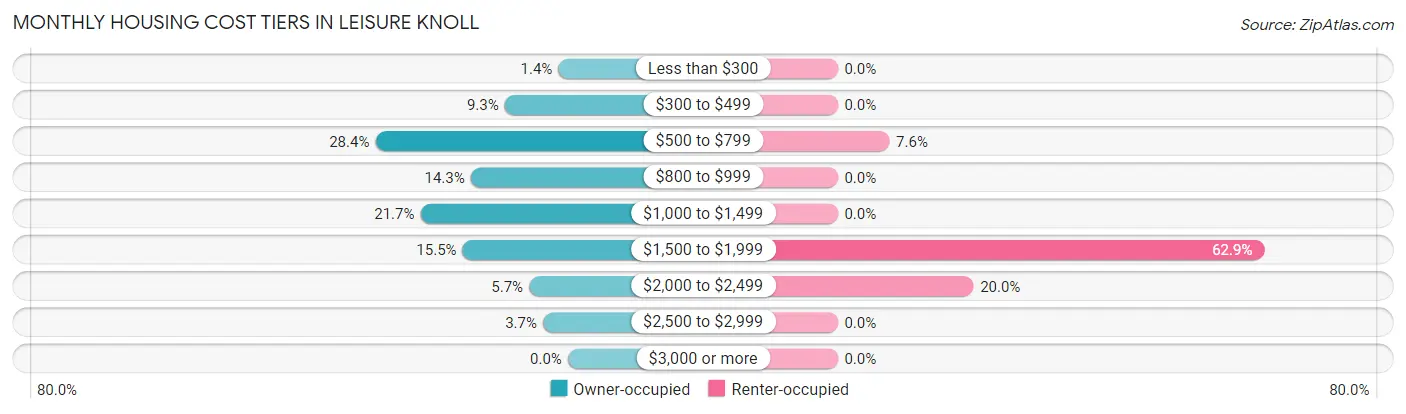
| Monthly Cost | Owner-occupied | Renter-occupied |
| Less than $300 | 20 (1.4%) | 0 (0.0%) |
| $300 to $499 | 132 (9.3%) | 0 (0.0%) |
| $500 to $799 | 402 (28.3%) | 8 (7.6%) |
| $800 to $999 | 203 (14.3%) | 0 (0.0%) |
| $1,000 to $1,499 | 308 (21.7%) | 0 (0.0%) |
| $1,500 to $1,999 | 220 (15.5%) | 66 (62.9%) |
| $2,000 to $2,499 | 81 (5.7%) | 21 (20.0%) |
| $2,500 to $2,999 | 52 (3.7%) | 0 (0.0%) |
| $3,000 or more | 0 (0.0%) | 0 (0.0%) |
| Total | 1,418 (100.0%) | 105 (100.0%) |
Physical Housing Characteristics in Leisure Knoll
Housing Structures in Leisure Knoll
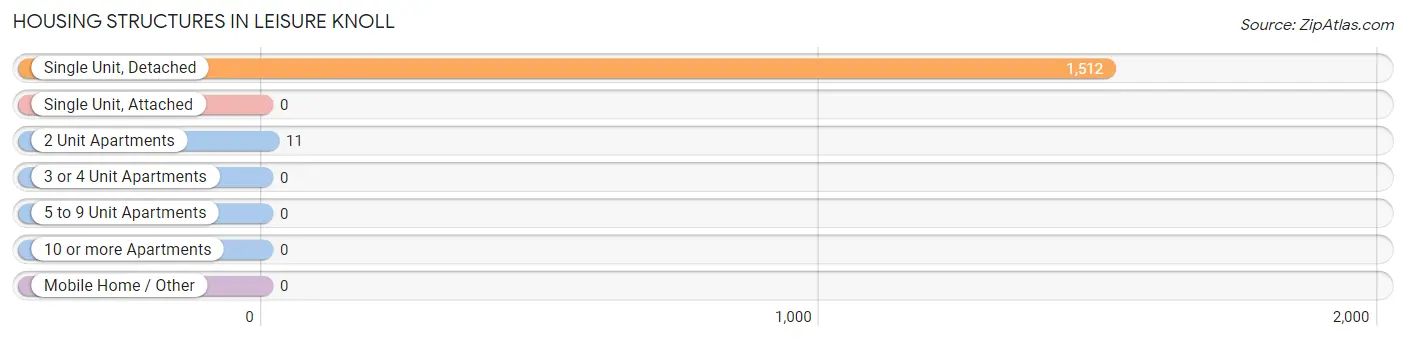
| Structure Type | # Housing Units | % Housing Units |
| Single Unit, Detached | 1,512 | 99.3% |
| Single Unit, Attached | 0 | 0.0% |
| 2 Unit Apartments | 11 | 0.7% |
| 3 or 4 Unit Apartments | 0 | 0.0% |
| 5 to 9 Unit Apartments | 0 | 0.0% |
| 10 or more Apartments | 0 | 0.0% |
| Mobile Home / Other | 0 | 0.0% |
| Total | 1,523 | 100.0% |
Housing Structures by Occupancy in Leisure Knoll
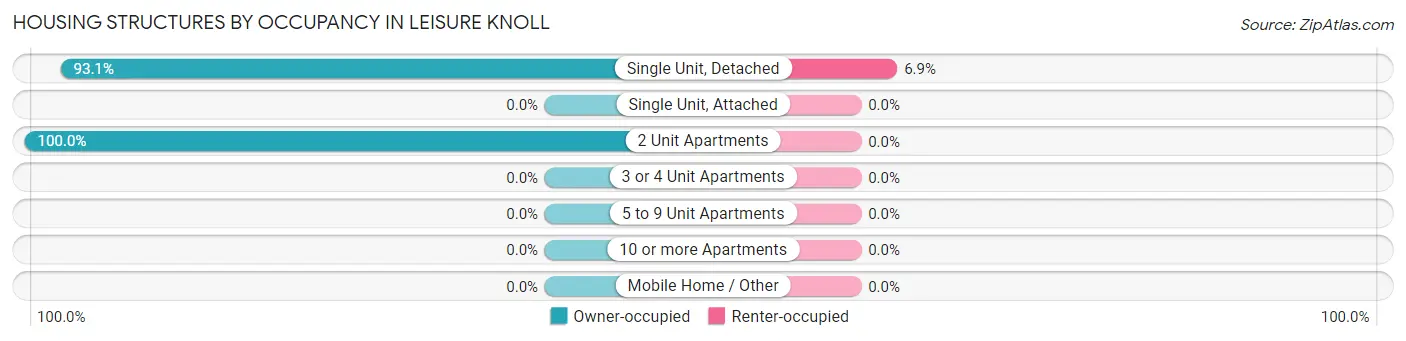
| Structure Type | Owner-occupied | Renter-occupied |
| Single Unit, Detached | 1,407 (93.1%) | 105 (6.9%) |
| Single Unit, Attached | 0 (0.0%) | 0 (0.0%) |
| 2 Unit Apartments | 11 (100.0%) | 0 (0.0%) |
| 3 or 4 Unit Apartments | 0 (0.0%) | 0 (0.0%) |
| 5 to 9 Unit Apartments | 0 (0.0%) | 0 (0.0%) |
| 10 or more Apartments | 0 (0.0%) | 0 (0.0%) |
| Mobile Home / Other | 0 (0.0%) | 0 (0.0%) |
| Total | 1,418 (93.1%) | 105 (6.9%) |
Housing Structures by Number of Rooms in Leisure Knoll
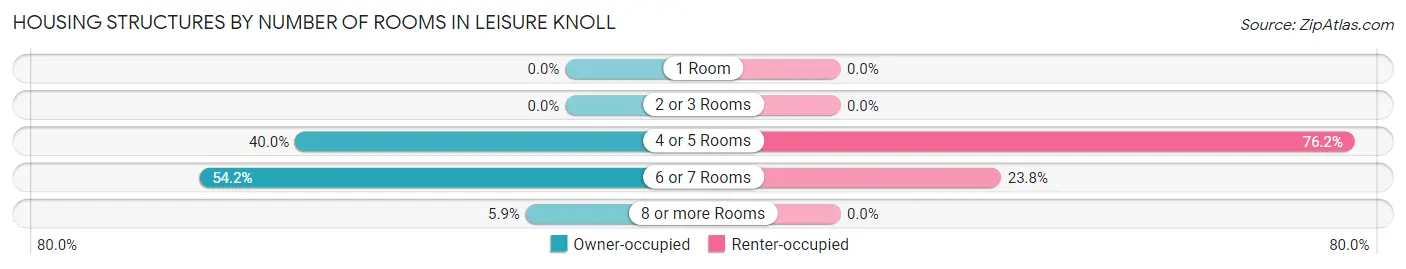
| Number of Rooms | Owner-occupied | Renter-occupied |
| 1 Room | 0 (0.0%) | 0 (0.0%) |
| 2 or 3 Rooms | 0 (0.0%) | 0 (0.0%) |
| 4 or 5 Rooms | 567 (40.0%) | 80 (76.2%) |
| 6 or 7 Rooms | 768 (54.2%) | 25 (23.8%) |
| 8 or more Rooms | 83 (5.9%) | 0 (0.0%) |
| Total | 1,418 (100.0%) | 105 (100.0%) |
Housing Structure by Heating Type in Leisure Knoll
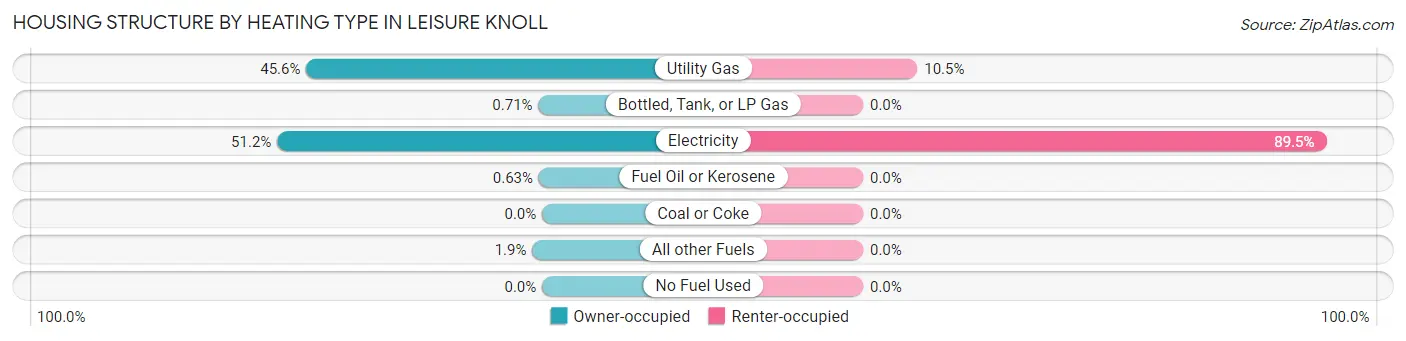
| Heating Type | Owner-occupied | Renter-occupied |
| Utility Gas | 646 (45.6%) | 11 (10.5%) |
| Bottled, Tank, or LP Gas | 10 (0.7%) | 0 (0.0%) |
| Electricity | 726 (51.2%) | 94 (89.5%) |
| Fuel Oil or Kerosene | 9 (0.6%) | 0 (0.0%) |
| Coal or Coke | 0 (0.0%) | 0 (0.0%) |
| All other Fuels | 27 (1.9%) | 0 (0.0%) |
| No Fuel Used | 0 (0.0%) | 0 (0.0%) |
| Total | 1,418 (100.0%) | 105 (100.0%) |
Household Vehicle Usage in Leisure Knoll
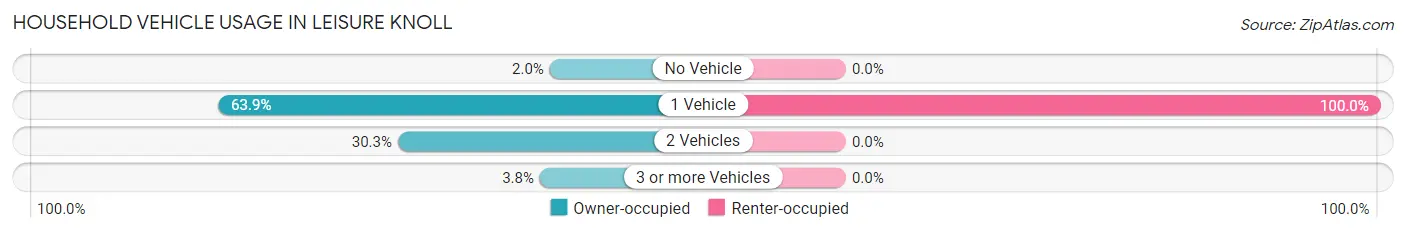
| Vehicles per Household | Owner-occupied | Renter-occupied |
| No Vehicle | 28 (2.0%) | 0 (0.0%) |
| 1 Vehicle | 906 (63.9%) | 105 (100.0%) |
| 2 Vehicles | 430 (30.3%) | 0 (0.0%) |
| 3 or more Vehicles | 54 (3.8%) | 0 (0.0%) |
| Total | 1,418 (100.0%) | 105 (100.0%) |
Real Estate & Mortgages in Leisure Knoll
Real Estate and Mortgage Overview in Leisure Knoll
| Characteristic | Without Mortgage | With Mortgage |
| Housing Units | 765 | 653 |
| Median Property Value | $239,000 | $247,200 |
| Median Household Income | $40,234 | $38 |
| Monthly Housing Costs | $708 | $0 |
| Real Estate Taxes | $3,891 | $15 |
Property Value by Mortgage Status in Leisure Knoll
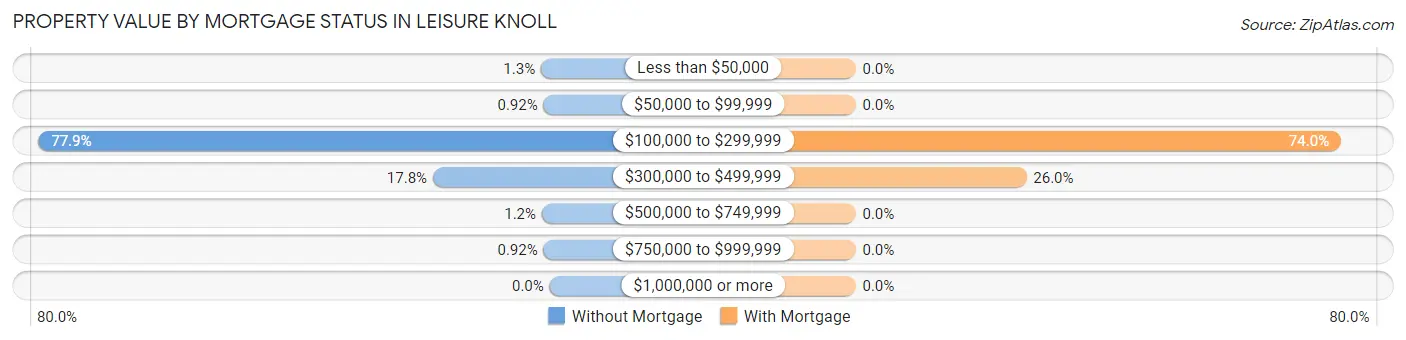
| Property Value | Without Mortgage | With Mortgage |
| Less than $50,000 | 10 (1.3%) | 0 (0.0%) |
| $50,000 to $99,999 | 7 (0.9%) | 0 (0.0%) |
| $100,000 to $299,999 | 596 (77.9%) | 483 (74.0%) |
| $300,000 to $499,999 | 136 (17.8%) | 170 (26.0%) |
| $500,000 to $749,999 | 9 (1.2%) | 0 (0.0%) |
| $750,000 to $999,999 | 7 (0.9%) | 0 (0.0%) |
| $1,000,000 or more | 0 (0.0%) | 0 (0.0%) |
| Total | 765 (100.0%) | 653 (100.0%) |
Household Income by Mortgage Status in Leisure Knoll
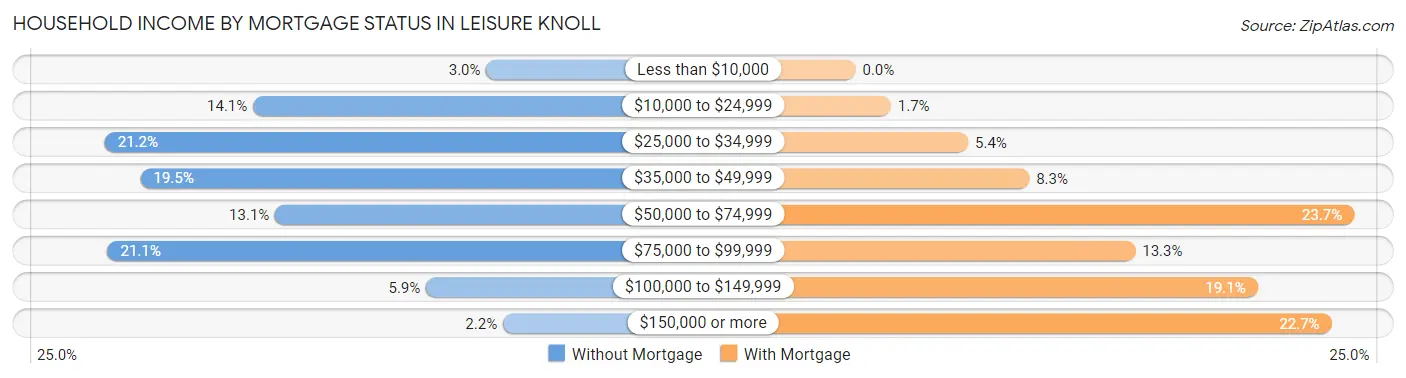
| Household Income | Without Mortgage | With Mortgage |
| Less than $10,000 | 23 (3.0%) | 0 (0.0%) |
| $10,000 to $24,999 | 108 (14.1%) | 11 (1.7%) |
| $25,000 to $34,999 | 162 (21.2%) | 35 (5.4%) |
| $35,000 to $49,999 | 149 (19.5%) | 54 (8.3%) |
| $50,000 to $74,999 | 100 (13.1%) | 155 (23.7%) |
| $75,000 to $99,999 | 161 (21.0%) | 87 (13.3%) |
| $100,000 to $149,999 | 45 (5.9%) | 125 (19.1%) |
| $150,000 or more | 17 (2.2%) | 148 (22.7%) |
| Total | 765 (100.0%) | 653 (100.0%) |
Property Value to Household Income Ratio in Leisure Knoll
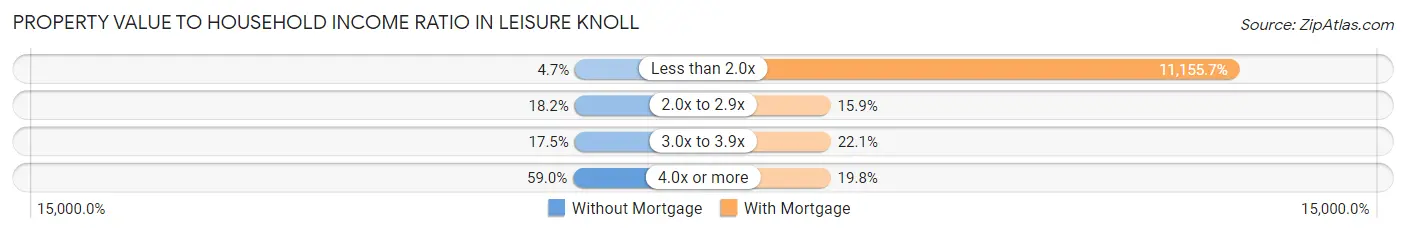
| Value-to-Income Ratio | Without Mortgage | With Mortgage |
| Less than 2.0x | 36 (4.7%) | 72,847 (11,155.7%) |
| 2.0x to 2.9x | 139 (18.2%) | 104 (15.9%) |
| 3.0x to 3.9x | 134 (17.5%) | 144 (22.1%) |
| 4.0x or more | 451 (59.0%) | 129 (19.8%) |
| Total | 765 (100.0%) | 653 (100.0%) |
Real Estate Taxes by Mortgage Status in Leisure Knoll
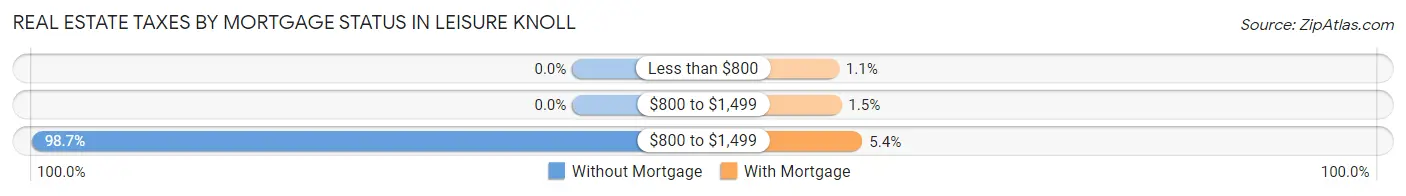
| Property Taxes | Without Mortgage | With Mortgage |
| Less than $800 | 0 (0.0%) | 7 (1.1%) |
| $800 to $1,499 | 0 (0.0%) | 10 (1.5%) |
| $800 to $1,499 | 755 (98.7%) | 35 (5.4%) |
| Total | 765 (100.0%) | 653 (100.0%) |
Health & Disability in Leisure Knoll
Health Insurance Coverage by Age in Leisure Knoll
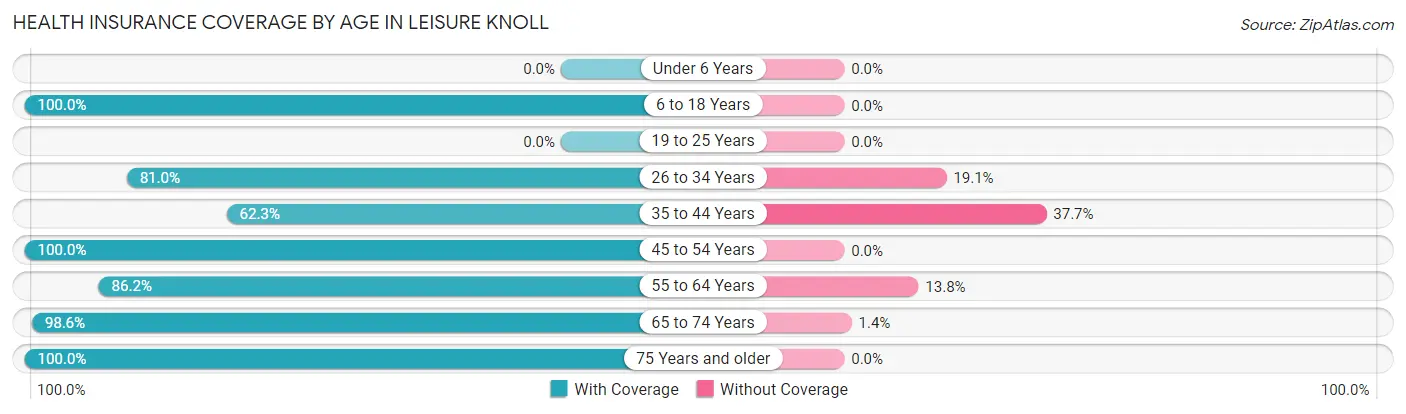
| Age Bracket | With Coverage | Without Coverage |
| Under 6 Years | 0 (0.0%) | 0 (0.0%) |
| 6 to 18 Years | 15 (100.0%) | 0 (0.0%) |
| 19 to 25 Years | 0 (0.0%) | 0 (0.0%) |
| 26 to 34 Years | 17 (80.9%) | 4 (19.1%) |
| 35 to 44 Years | 43 (62.3%) | 26 (37.7%) |
| 45 to 54 Years | 95 (100.0%) | 0 (0.0%) |
| 55 to 64 Years | 474 (86.2%) | 76 (13.8%) |
| 65 to 74 Years | 872 (98.6%) | 12 (1.4%) |
| 75 Years and older | 857 (100.0%) | 0 (0.0%) |
| Total | 2,373 (95.3%) | 118 (4.7%) |
Health Insurance Coverage by Citizenship Status in Leisure Knoll
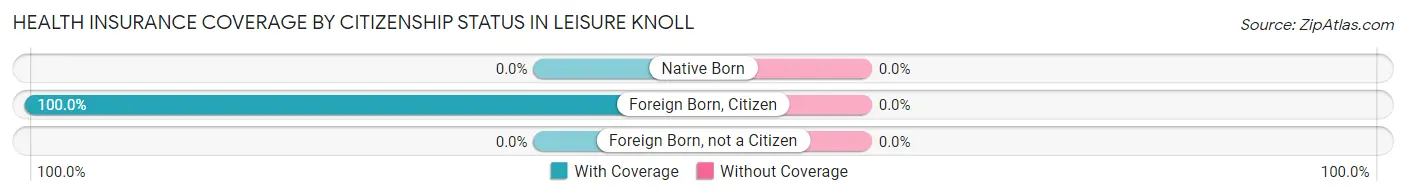
| Citizenship Status | With Coverage | Without Coverage |
| Native Born | 0 (0.0%) | 0 (0.0%) |
| Foreign Born, Citizen | 15 (100.0%) | 0 (0.0%) |
| Foreign Born, not a Citizen | 0 (0.0%) | 0 (0.0%) |
Health Insurance Coverage by Household Income in Leisure Knoll
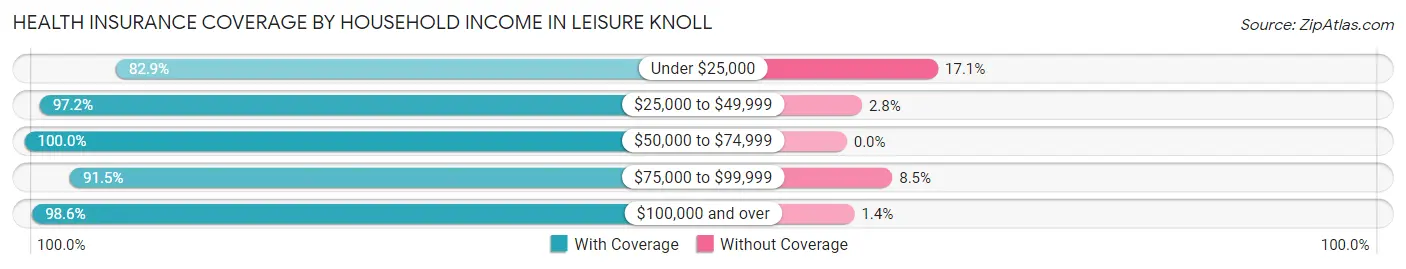
| Household Income | With Coverage | Without Coverage |
| Under $25,000 | 189 (82.9%) | 39 (17.1%) |
| $25,000 to $49,999 | 752 (97.2%) | 22 (2.8%) |
| $50,000 to $74,999 | 360 (100.0%) | 0 (0.0%) |
| $75,000 to $99,999 | 526 (91.5%) | 49 (8.5%) |
| $100,000 and over | 546 (98.6%) | 8 (1.4%) |
Public vs Private Health Insurance Coverage by Age in Leisure Knoll
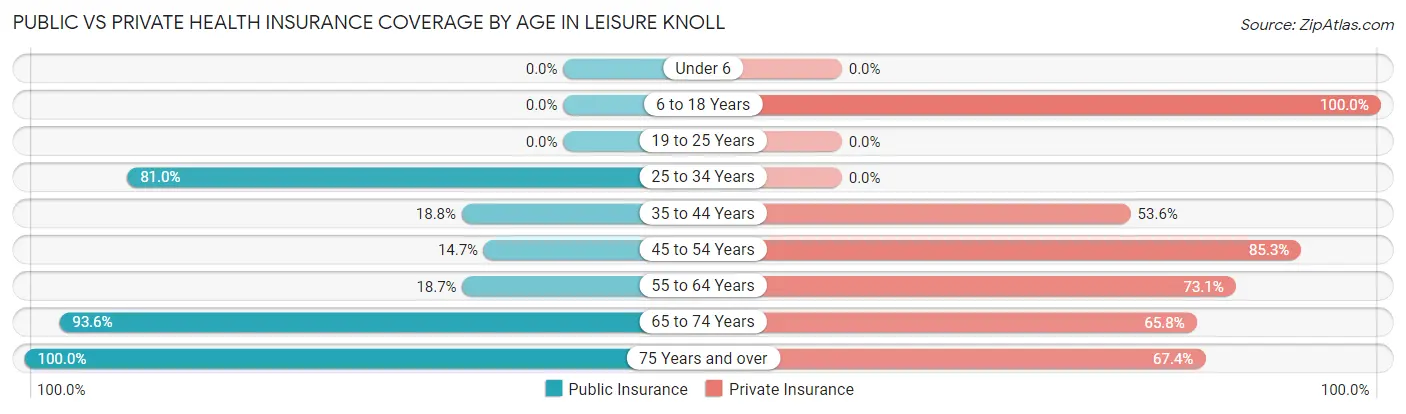
| Age Bracket | Public Insurance | Private Insurance |
| Under 6 | 0 (0.0%) | 0 (0.0%) |
| 6 to 18 Years | 0 (0.0%) | 15 (100.0%) |
| 19 to 25 Years | 0 (0.0%) | 0 (0.0%) |
| 25 to 34 Years | 17 (80.9%) | 0 (0.0%) |
| 35 to 44 Years | 13 (18.8%) | 37 (53.6%) |
| 45 to 54 Years | 14 (14.7%) | 81 (85.3%) |
| 55 to 64 Years | 103 (18.7%) | 402 (73.1%) |
| 65 to 74 Years | 827 (93.5%) | 582 (65.8%) |
| 75 Years and over | 857 (100.0%) | 578 (67.4%) |
| Total | 1,831 (73.5%) | 1,695 (68.0%) |
Disability Status by Sex by Age in Leisure Knoll
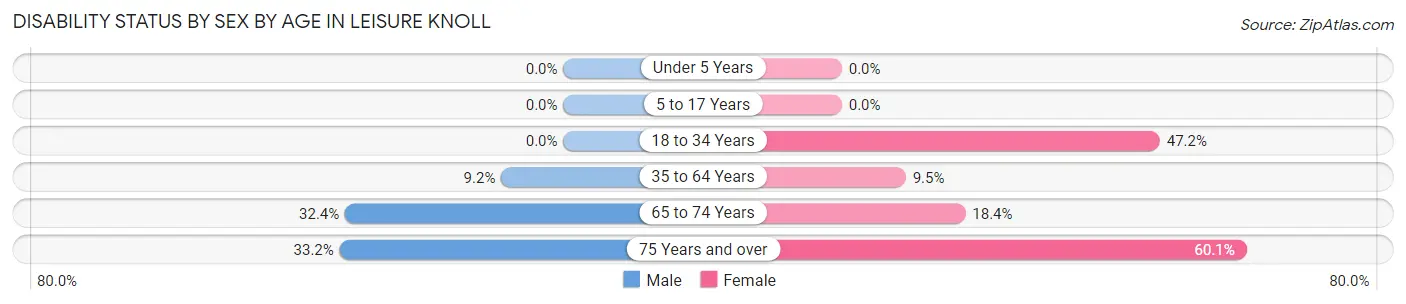
| Age Bracket | Male | Female |
| Under 5 Years | 0 (0.0%) | 0 (0.0%) |
| 5 to 17 Years | 0 (0.0%) | 0 (0.0%) |
| 18 to 34 Years | 0 (0.0%) | 17 (47.2%) |
| 35 to 64 Years | 26 (9.2%) | 41 (9.5%) |
| 65 to 74 Years | 94 (32.4%) | 109 (18.3%) |
| 75 Years and over | 99 (33.2%) | 336 (60.1%) |
Disability Class by Sex by Age in Leisure Knoll
Disability Class: Hearing Difficulty
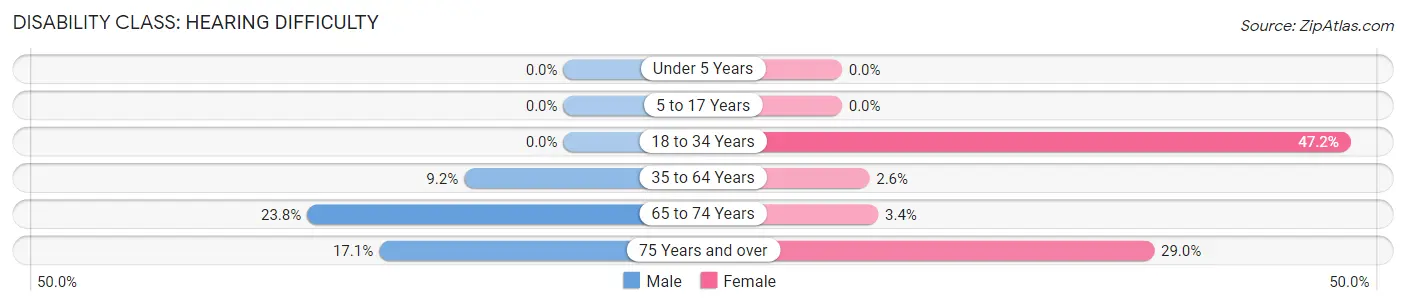
| Age Bracket | Male | Female |
| Under 5 Years | 0 (0.0%) | 0 (0.0%) |
| 5 to 17 Years | 0 (0.0%) | 0 (0.0%) |
| 18 to 34 Years | 0 (0.0%) | 17 (47.2%) |
| 35 to 64 Years | 26 (9.2%) | 11 (2.5%) |
| 65 to 74 Years | 69 (23.8%) | 20 (3.4%) |
| 75 Years and over | 51 (17.1%) | 162 (29.0%) |
Disability Class: Vision Difficulty
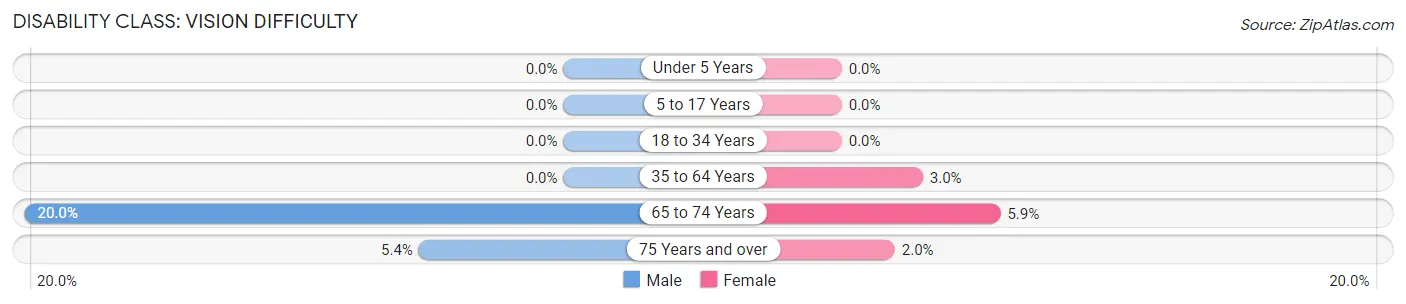
| Age Bracket | Male | Female |
| Under 5 Years | 0 (0.0%) | 0 (0.0%) |
| 5 to 17 Years | 0 (0.0%) | 0 (0.0%) |
| 18 to 34 Years | 0 (0.0%) | 0 (0.0%) |
| 35 to 64 Years | 0 (0.0%) | 13 (3.0%) |
| 65 to 74 Years | 58 (20.0%) | 35 (5.9%) |
| 75 Years and over | 16 (5.4%) | 11 (2.0%) |
Disability Class: Cognitive Difficulty
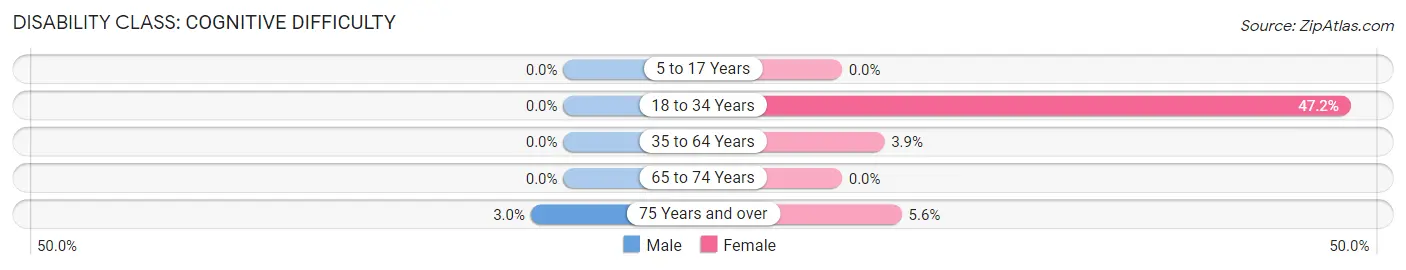
| Age Bracket | Male | Female |
| 5 to 17 Years | 0 (0.0%) | 0 (0.0%) |
| 18 to 34 Years | 0 (0.0%) | 17 (47.2%) |
| 35 to 64 Years | 0 (0.0%) | 17 (3.9%) |
| 65 to 74 Years | 0 (0.0%) | 0 (0.0%) |
| 75 Years and over | 9 (3.0%) | 31 (5.6%) |
Disability Class: Ambulatory Difficulty
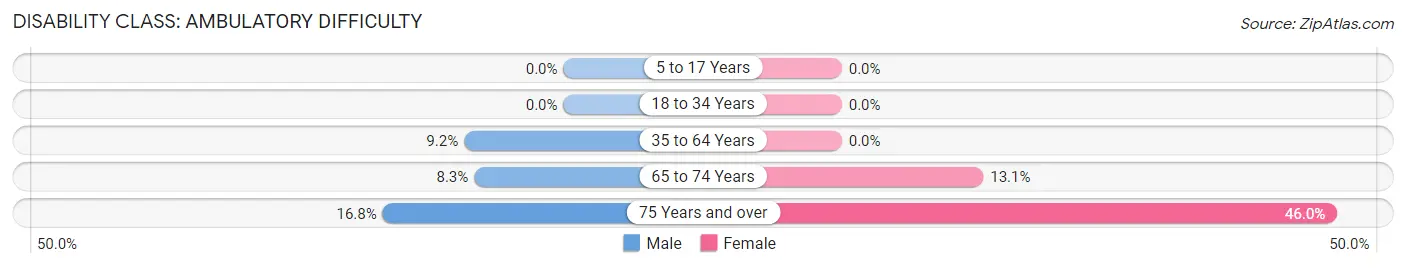
| Age Bracket | Male | Female |
| 5 to 17 Years | 0 (0.0%) | 0 (0.0%) |
| 18 to 34 Years | 0 (0.0%) | 0 (0.0%) |
| 35 to 64 Years | 26 (9.2%) | 0 (0.0%) |
| 65 to 74 Years | 24 (8.3%) | 78 (13.1%) |
| 75 Years and over | 50 (16.8%) | 257 (46.0%) |
Disability Class: Self-Care Difficulty
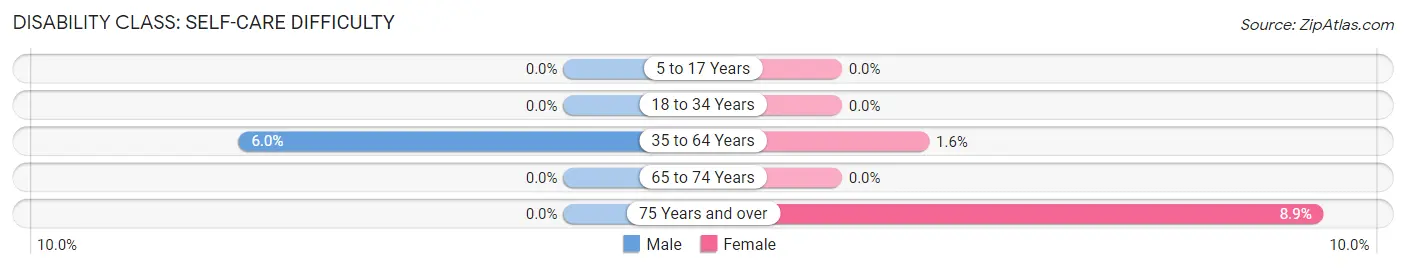
| Age Bracket | Male | Female |
| 5 to 17 Years | 0 (0.0%) | 0 (0.0%) |
| 18 to 34 Years | 0 (0.0%) | 0 (0.0%) |
| 35 to 64 Years | 17 (6.0%) | 7 (1.6%) |
| 65 to 74 Years | 0 (0.0%) | 0 (0.0%) |
| 75 Years and over | 0 (0.0%) | 50 (8.9%) |
Technology Access in Leisure Knoll
Computing Device Access in Leisure Knoll
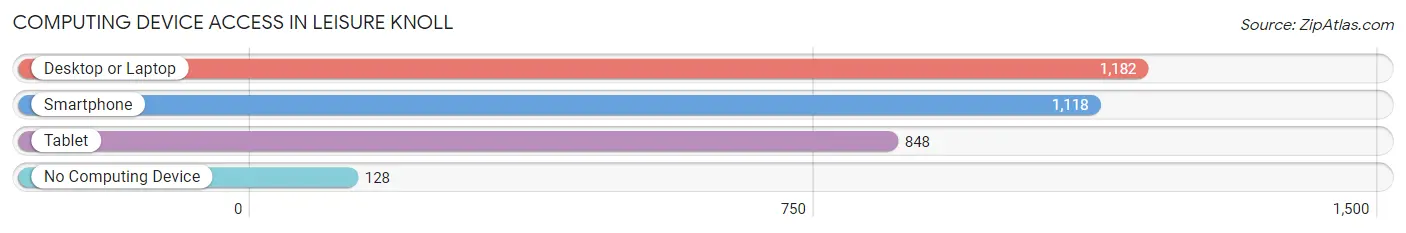
| Device Type | # Households | % Households |
| Desktop or Laptop | 1,182 | 77.6% |
| Smartphone | 1,118 | 73.4% |
| Tablet | 848 | 55.7% |
| No Computing Device | 128 | 8.4% |
| Total | 1,523 | 100.0% |
Internet Access in Leisure Knoll
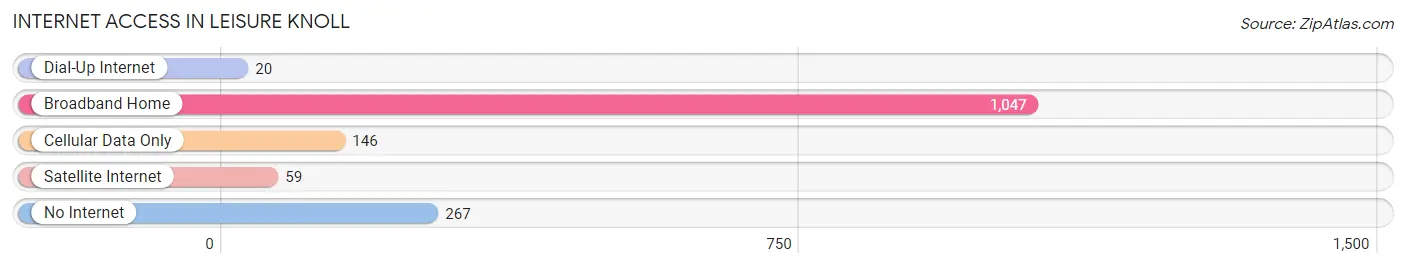
| Internet Type | # Households | % Households |
| Dial-Up Internet | 20 | 1.3% |
| Broadband Home | 1,047 | 68.8% |
| Cellular Data Only | 146 | 9.6% |
| Satellite Internet | 59 | 3.9% |
| No Internet | 267 | 17.5% |
| Total | 1,523 | 100.0% |
Leisure Knoll Summary
Leisure Knoll is a census-designated place (CDP) located in Ocean County, New Jersey, United States. As of the 2010 United States Census, the CDP's population was 4,845.
Geography
Leisure Knoll is located at (39.945, -74.25). According to the United States Census Bureau, the CDP had a total area of 1.945 square miles (5.039 km2), including 1.944 square miles (5.036 km2) of land and 0.001 square miles (0.003 km2) of water (0.05%).
Demographics
As of the 2010 United States Census, there were 4,845 people, 2,039 households, and 1,521.8 families residing in the CDP. The population density was 2,500.2 per square mile (965.7/km2). There were 2,097 housing units at an average density of 1,077.7 per square mile (416.9/km2). The racial makeup of the CDP was 97.45% (4,735) White, 0.45% (21) Black or African American, 0.08% (4) Native American, 0.90% (44) Asian, 0.00% (0) Pacific Islander, 0.25% (12) from other races, and 0.87% (42) from two or more races. Hispanic or Latino of any race were 2.45% (119) of the population.
Economy
Leisure Knoll is home to a variety of businesses, including retail stores, restaurants, and professional services. The largest employer in the area is the Ocean County Mall, which is located just outside of the CDP. Other major employers include the Ocean County Library, the Ocean County Board of Education, and the Ocean County Health Department.
History
Leisure Knoll was originally part of Dover Township, which was established in 1767. The area was first settled in the late 1700s by a group of Quakers from Pennsylvania. The area was known as Quaker Hill until the early 1900s, when it was renamed Leisure Knoll. The name was chosen to reflect the area's rural character and its proximity to the Jersey Shore.
In the early 1900s, the area began to develop as a summer resort destination. The first hotel, the Leisure Knoll Hotel, was built in 1910. The hotel was a popular destination for vacationers from New York City and Philadelphia.
In the 1950s, Leisure Knoll began to transition from a summer resort to a year-round community. The area experienced a population boom in the 1960s and 1970s, as more people moved to the area to take advantage of its proximity to the Jersey Shore.
Today, Leisure Knoll is a vibrant community with a variety of businesses and amenities. The area is home to a variety of parks and recreational facilities, including the Ocean County Park, which offers a variety of outdoor activities. The area is also home to a variety of restaurants, retail stores, and professional services.
Common Questions
What is Per Capita Income in Leisure Knoll?
Per Capita income in Leisure Knoll is $40,267.
What is the Median Family Income in Leisure Knoll?
Median Family Income in Leisure Knoll is $80,909.
What is the Median Household income in Leisure Knoll?
Median Household Income in Leisure Knoll is $52,279.
What is Income or Wage Gap in Leisure Knoll?
Income or Wage Gap in Leisure Knoll is 15.8%.
Women in Leisure Knoll earn 84.2 cents for every dollar earned by a man.
What is Inequality or Gini Index in Leisure Knoll?
Inequality or Gini Index in Leisure Knoll is 0.36.
What is the Total Population of Leisure Knoll?
Total Population of Leisure Knoll is 2,622.
What is the Total Male Population of Leisure Knoll?
Total Male Population of Leisure Knoll is 925.
What is the Total Female Population of Leisure Knoll?
Total Female Population of Leisure Knoll is 1,697.
What is the Ratio of Males per 100 Females in Leisure Knoll?
There are 54.51 Males per 100 Females in Leisure Knoll.
What is the Ratio of Females per 100 Males in Leisure Knoll?
There are 183.46 Females per 100 Males in Leisure Knoll.
What is the Median Population Age in Leisure Knoll?
Median Population Age in Leisure Knoll is 70.7 Years.
What is the Average Family Size in Leisure Knoll
Average Family Size in Leisure Knoll is 2.1 People.
What is the Average Household Size in Leisure Knoll
Average Household Size in Leisure Knoll is 1.6 People.
How Large is the Labor Force in Leisure Knoll?
There are 821 People in the Labor Forcein in Leisure Knoll.
What is the Percentage of People in the Labor Force in Leisure Knoll?
31.3% of People are in the Labor Force in Leisure Knoll.
What is the Unemployment Rate in Leisure Knoll?
Unemployment Rate in Leisure Knoll is 4.4%.