Clayton borough, NJ Map & Demographics
Clayton borough Overview
$37,530
PER CAPITA INCOME
$107,929
AVG FAMILY INCOME
$91,711
AVG HOUSEHOLD INCOME
32.4%
WAGE / INCOME GAP [ % ]
67.6¢/ $1
WAGE / INCOME GAP [ $ ]
0.38
INEQUALITY / GINI INDEX
8,801
TOTAL POPULATION
4,236
MALE POPULATION
4,565
FEMALE POPULATION
92.79
MALES / 100 FEMALES
107.77
FEMALES / 100 MALES
39.9
MEDIAN AGE
3.2
AVG FAMILY SIZE
2.8
AVG HOUSEHOLD SIZE
4,495
LABOR FORCE [ PEOPLE ]
63.8%
PERCENT IN LABOR FORCE
8.2%
UNEMPLOYMENT RATE
Income in Clayton borough
Income Overview in Clayton borough
Per Capita Income in Clayton borough is $37,530, while median incomes of families and households are $107,929 and $91,711 respectively.
| Characteristic | Number | Measure |
| Per Capita Income | 8,801 | $37,530 |
| Median Family Income | 2,322 | $107,929 |
| Mean Family Income | 2,322 | $118,100 |
| Median Household Income | 3,188 | $91,711 |
| Mean Household Income | 3,188 | $102,399 |
| Income Deficit | 2,322 | $0 |
| Wage / Income Gap (%) | 8,801 | 32.40% |
| Wage / Income Gap ($) | 8,801 | 67.60¢ per $1 |
| Gini / Inequality Index | 8,801 | 0.38 |
Earnings by Sex in Clayton borough
Average Earnings in Clayton borough are $40,581, $53,667 for men and $36,279 for women, a difference of 32.4%.
| Sex | Number | Average Earnings |
| Male | 2,234 (50.4%) | $53,667 |
| Female | 2,200 (49.6%) | $36,279 |
| Total | 4,434 (100.0%) | $40,581 |
Earnings by Sex by Income Bracket in Clayton borough
The most common earnings brackets in Clayton borough are $75,000 to $99,999 for men (455 | 20.4%) and $35,000 to $39,999 for women (330 | 15.0%).
| Income | Male | Female |
| $2,499 or less | 52 (2.3%) | 69 (3.1%) |
| $2,500 to $4,999 | 64 (2.9%) | 33 (1.5%) |
| $5,000 to $7,499 | 65 (2.9%) | 168 (7.6%) |
| $7,500 to $9,999 | 47 (2.1%) | 50 (2.3%) |
| $10,000 to $12,499 | 35 (1.6%) | 81 (3.7%) |
| $12,500 to $14,999 | 49 (2.2%) | 46 (2.1%) |
| $15,000 to $17,499 | 46 (2.1%) | 129 (5.9%) |
| $17,500 to $19,999 | 0 (0.0%) | 93 (4.2%) |
| $20,000 to $22,499 | 58 (2.6%) | 71 (3.2%) |
| $22,500 to $24,999 | 61 (2.7%) | 64 (2.9%) |
| $25,000 to $29,999 | 110 (4.9%) | 129 (5.9%) |
| $30,000 to $34,999 | 119 (5.3%) | 55 (2.5%) |
| $35,000 to $39,999 | 157 (7.0%) | 330 (15.0%) |
| $40,000 to $44,999 | 92 (4.1%) | 99 (4.5%) |
| $45,000 to $49,999 | 24 (1.1%) | 45 (2.1%) |
| $50,000 to $54,999 | 194 (8.7%) | 50 (2.3%) |
| $55,000 to $64,999 | 87 (3.9%) | 268 (12.2%) |
| $65,000 to $74,999 | 183 (8.2%) | 133 (6.0%) |
| $75,000 to $99,999 | 455 (20.4%) | 136 (6.2%) |
| $100,000+ | 336 (15.0%) | 151 (6.9%) |
| Total | 2,234 (100.0%) | 2,200 (100.0%) |
Earnings by Sex by Educational Attainment in Clayton borough
Average earnings in Clayton borough are $60,313 for men and $37,403 for women, a difference of 38.0%. Men with an educational attainment of graduate degree enjoy the highest average annual earnings of $90,197, while those with high school diploma education earn the least with $53,220. Women with an educational attainment of graduate degree earn the most with the average annual earnings of $110,536, while those with less than high school education have the smallest earnings of $11,875.
| Educational Attainment | Male Income | Female Income |
| Less than High School | $85,513 | $11,875 |
| High School Diploma | $53,220 | $36,152 |
| College or Associate's Degree | $53,469 | $36,565 |
| Bachelor's Degree | $70,270 | $72,975 |
| Graduate Degree | $90,197 | $110,536 |
| Total | $60,313 | $37,403 |
Family Income in Clayton borough
Family Income Brackets in Clayton borough
According to the Clayton borough family income data, there are 801 families falling into the $100,000 to $149,999 income range, which is the most common income bracket and makes up 34.5% of all families. Conversely, the less than $10,000 income bracket is the least frequent group with only 14 families (0.6%) belonging to this category.
| Income Bracket | # Families | % Families |
| Less than $10,000 | 14 | 0.6% |
| $10,000 to $14,999 | 30 | 1.3% |
| $15,000 to $24,999 | 26 | 1.1% |
| $25,000 to $34,999 | 28 | 1.2% |
| $35,000 to $49,999 | 158 | 6.8% |
| $50,000 to $74,999 | 448 | 19.3% |
| $75,000 to $99,999 | 367 | 15.8% |
| $100,000 to $149,999 | 801 | 34.5% |
| $150,000 to $199,999 | 158 | 6.8% |
| $200,000+ | 290 | 12.5% |
Family Income by Famaliy Size in Clayton borough
6-person families (115 | 5.0%) account for the highest median family income in Clayton borough with $194,886 per family, while 3-person families (447 | 19.3%) have the highest median income of $43,837 per family member.
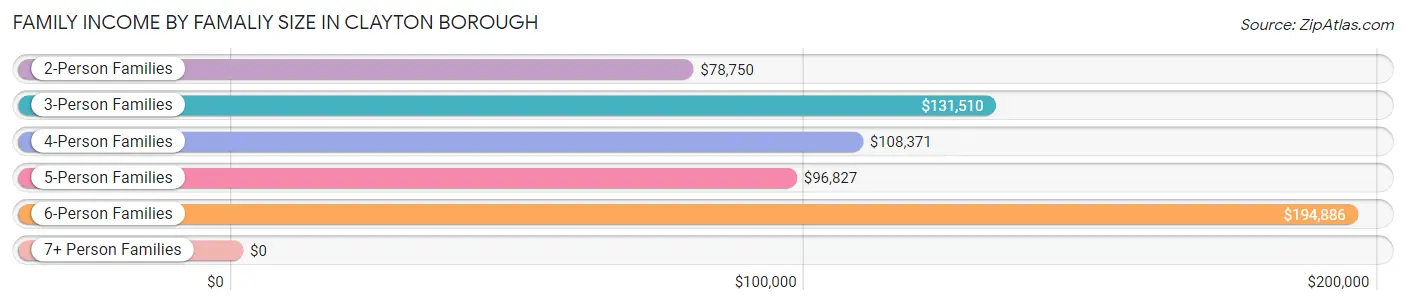
| Income Bracket | # Families | Median Income |
| 2-Person Families | 1,089 (46.9%) | $78,750 |
| 3-Person Families | 447 (19.3%) | $131,510 |
| 4-Person Families | 385 (16.6%) | $108,371 |
| 5-Person Families | 274 (11.8%) | $96,827 |
| 6-Person Families | 115 (5.0%) | $194,886 |
| 7+ Person Families | 12 (0.5%) | $0 |
| Total | 2,322 (100.0%) | $107,929 |
Family Income by Number of Earners in Clayton borough
The median family income in Clayton borough is $107,929, with families comprising 3+ earners (380) having the highest median family income of $138,654, while families with no earners (514) have the lowest median family income of $93,750, accounting for 16.4% and 22.1% of families, respectively.
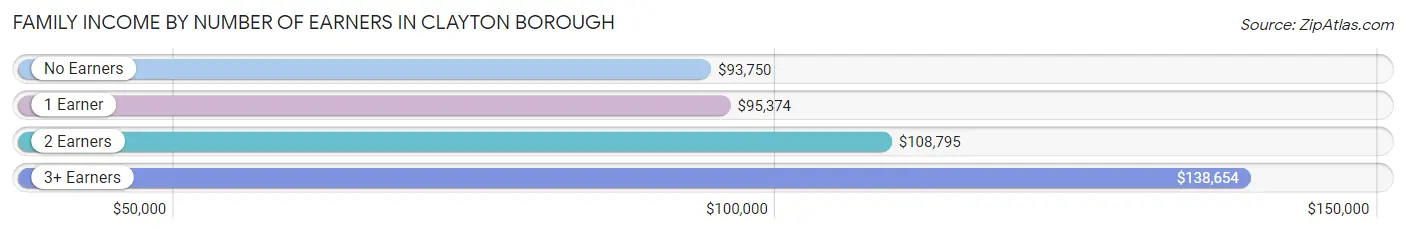
| Number of Earners | # Families | Median Income |
| No Earners | 514 (22.1%) | $93,750 |
| 1 Earner | 632 (27.2%) | $95,374 |
| 2 Earners | 796 (34.3%) | $108,795 |
| 3+ Earners | 380 (16.4%) | $138,654 |
| Total | 2,322 (100.0%) | $107,929 |
Household Income in Clayton borough
Household Income Brackets in Clayton borough
With 995 households falling in the category, the $100,000 to $149,999 income range is the most frequent in Clayton borough, accounting for 31.2% of all households. In contrast, only 70 households (2.2%) fall into the $25,000 to $34,999 income bracket, making it the least populous group.
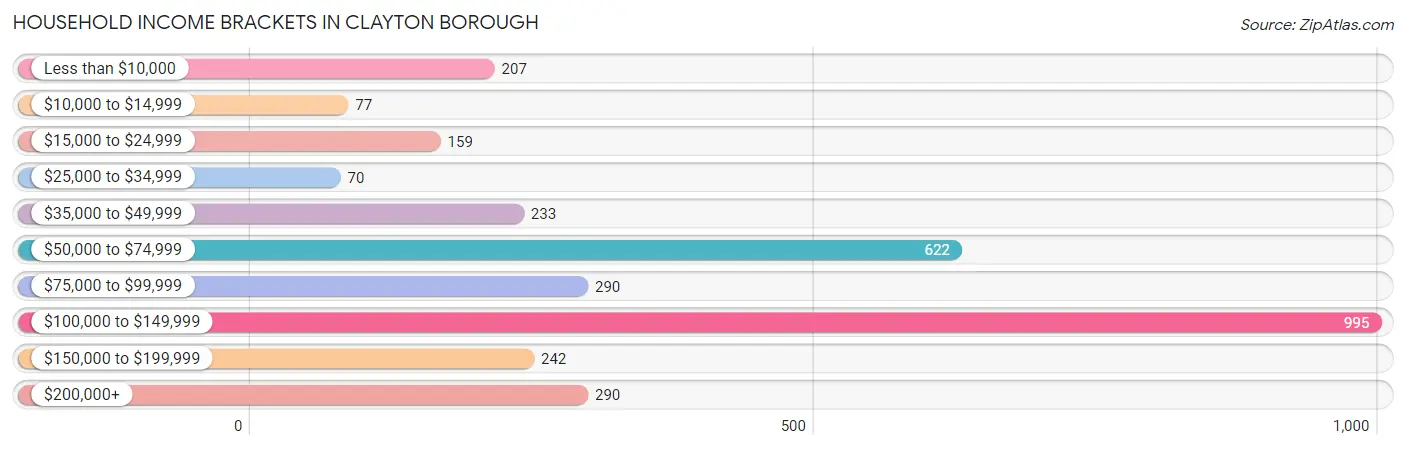
| Income Bracket | # Households | % Households |
| Less than $10,000 | 207 | 6.5% |
| $10,000 to $14,999 | 77 | 2.4% |
| $15,000 to $24,999 | 159 | 5.0% |
| $25,000 to $34,999 | 70 | 2.2% |
| $35,000 to $49,999 | 233 | 7.3% |
| $50,000 to $74,999 | 622 | 19.5% |
| $75,000 to $99,999 | 290 | 9.1% |
| $100,000 to $149,999 | 995 | 31.2% |
| $150,000 to $199,999 | 242 | 7.6% |
| $200,000+ | 290 | 9.1% |
Household Income by Householder Age in Clayton borough
The median household income in Clayton borough is $91,711, with the highest median household income of $115,960 found in the 45 to 64 years age bracket for the primary householder. A total of 1,163 households (36.5%) fall into this category. Meanwhile, the 15 to 24 years age bracket for the primary householder has the lowest median household income of $0, with 73 households (2.3%) in this group.
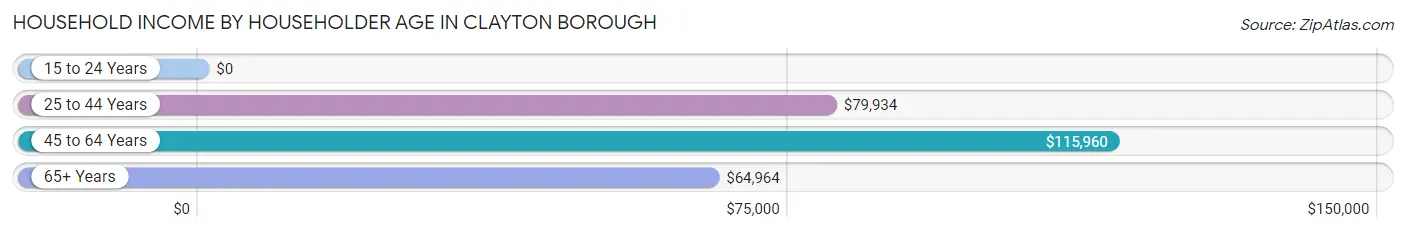
| Income Bracket | # Households | Median Income |
| 15 to 24 Years | 73 (2.3%) | $0 |
| 25 to 44 Years | 889 (27.9%) | $79,934 |
| 45 to 64 Years | 1,163 (36.5%) | $115,960 |
| 65+ Years | 1,063 (33.3%) | $64,964 |
| Total | 3,188 (100.0%) | $91,711 |
Poverty in Clayton borough
Income Below Poverty by Sex and Age in Clayton borough
With 5.2% poverty level for males and 11.2% for females among the residents of Clayton borough, under 5 year old males and 6 to 11 year old females are the most vulnerable to poverty, with 21 males (17.8%) and 62 females (14.9%) in their respective age groups living below the poverty level.
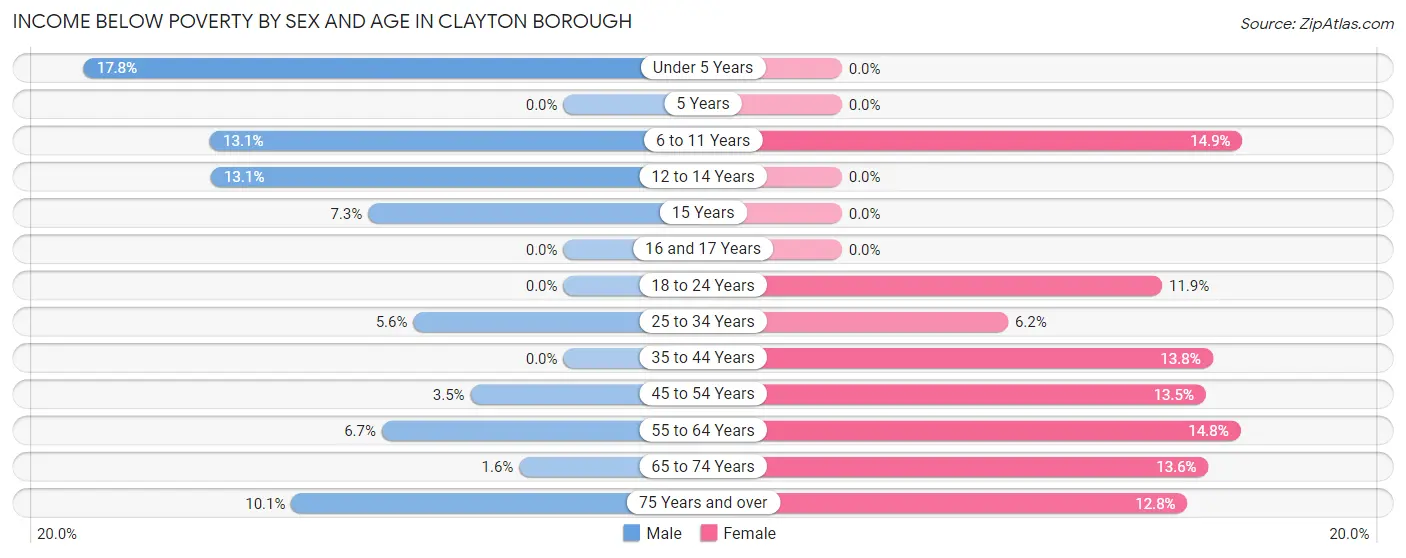
| Age Bracket | Male | Female |
| Under 5 Years | 21 (17.8%) | 0 (0.0%) |
| 5 Years | 0 (0.0%) | 0 (0.0%) |
| 6 to 11 Years | 32 (13.1%) | 62 (14.9%) |
| 12 to 14 Years | 28 (13.1%) | 0 (0.0%) |
| 15 Years | 10 (7.2%) | 0 (0.0%) |
| 16 and 17 Years | 0 (0.0%) | 0 (0.0%) |
| 18 to 24 Years | 0 (0.0%) | 46 (11.9%) |
| 25 to 34 Years | 39 (5.6%) | 33 (6.2%) |
| 35 to 44 Years | 0 (0.0%) | 75 (13.8%) |
| 45 to 54 Years | 13 (3.5%) | 80 (13.5%) |
| 55 to 64 Years | 39 (6.7%) | 86 (14.8%) |
| 65 to 74 Years | 9 (1.6%) | 98 (13.6%) |
| 75 Years and over | 29 (10.1%) | 29 (12.8%) |
| Total | 220 (5.2%) | 509 (11.2%) |
Income Above Poverty by Sex and Age in Clayton borough
According to the poverty statistics in Clayton borough, males aged 5 years and females aged under 5 years are the age groups that are most secure financially, with 100.0% of males and 100.0% of females in these age groups living above the poverty line.
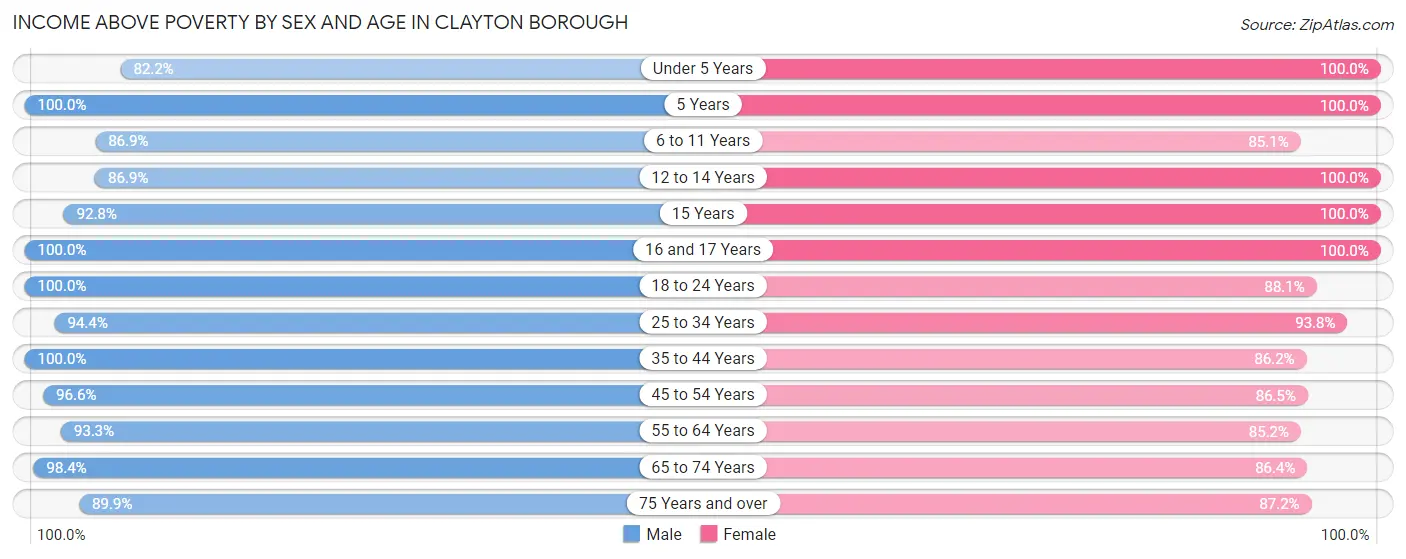
| Age Bracket | Male | Female |
| Under 5 Years | 97 (82.2%) | 171 (100.0%) |
| 5 Years | 204 (100.0%) | 77 (100.0%) |
| 6 to 11 Years | 212 (86.9%) | 355 (85.1%) |
| 12 to 14 Years | 186 (86.9%) | 154 (100.0%) |
| 15 Years | 128 (92.7%) | 19 (100.0%) |
| 16 and 17 Years | 43 (100.0%) | 141 (100.0%) |
| 18 to 24 Years | 301 (100.0%) | 341 (88.1%) |
| 25 to 34 Years | 661 (94.4%) | 502 (93.8%) |
| 35 to 44 Years | 473 (100.0%) | 470 (86.2%) |
| 45 to 54 Years | 364 (96.6%) | 512 (86.5%) |
| 55 to 64 Years | 540 (93.3%) | 495 (85.2%) |
| 65 to 74 Years | 539 (98.4%) | 622 (86.4%) |
| 75 Years and over | 258 (89.9%) | 197 (87.2%) |
| Total | 4,006 (94.8%) | 4,056 (88.8%) |
Income Below Poverty Among Married-Couple Families in Clayton borough
The poverty statistics for married-couple families in Clayton borough show that 1.3% or 21 of the total 1,602 families live below the poverty line. Families with 3 or 4 children have the highest poverty rate of 4.7%, comprising of 8 families. On the other hand, families with 1 or 2 children have the lowest poverty rate of 0.0%, which includes 0 families.
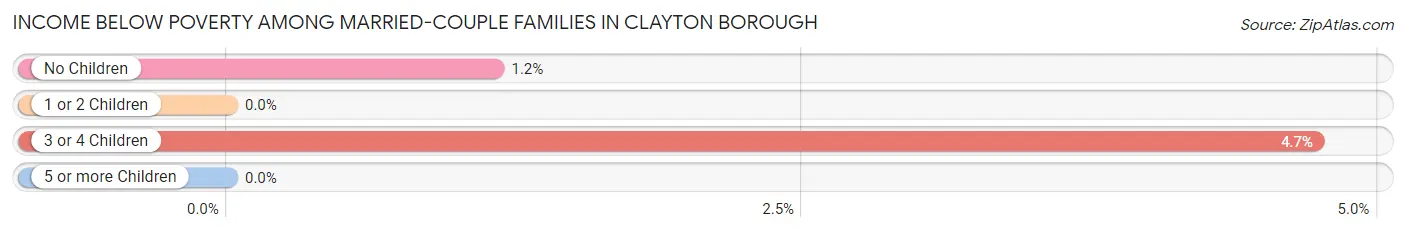
| Children | Above Poverty | Below Poverty |
| No Children | 1,104 (98.8%) | 13 (1.2%) |
| 1 or 2 Children | 316 (100.0%) | 0 (0.0%) |
| 3 or 4 Children | 161 (95.3%) | 8 (4.7%) |
| 5 or more Children | 0 (0.0%) | 0 (0.0%) |
| Total | 1,581 (98.7%) | 21 (1.3%) |
Income Below Poverty Among Single-Parent Households in Clayton borough
According to the poverty data in Clayton borough, 3.1% or 9 single-father households and 7.2% or 31 single-mother households are living below the poverty line. Among single-father households, those with no children have the highest poverty rate, with 9 households (13.9%) experiencing poverty. Likewise, among single-mother households, those with 3 or 4 children have the highest poverty rate, with 31 households (100.0%) falling below the poverty line.
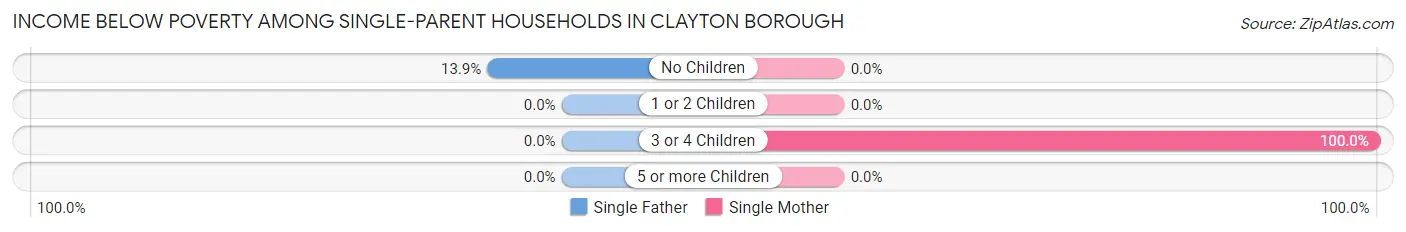
| Children | Single Father | Single Mother |
| No Children | 9 (13.9%) | 0 (0.0%) |
| 1 or 2 Children | 0 (0.0%) | 0 (0.0%) |
| 3 or 4 Children | 0 (0.0%) | 31 (100.0%) |
| 5 or more Children | 0 (0.0%) | 0 (0.0%) |
| Total | 9 (3.1%) | 31 (7.2%) |
Income Below Poverty Among Married-Couple vs Single-Parent Households in Clayton borough
The poverty data for Clayton borough shows that 21 of the married-couple family households (1.3%) and 40 of the single-parent households (5.6%) are living below the poverty level. Within the married-couple family households, those with 3 or 4 children have the highest poverty rate, with 8 households (4.7%) falling below the poverty line. Among the single-parent households, those with 3 or 4 children have the highest poverty rate, with 31 household (28.4%) living below poverty.
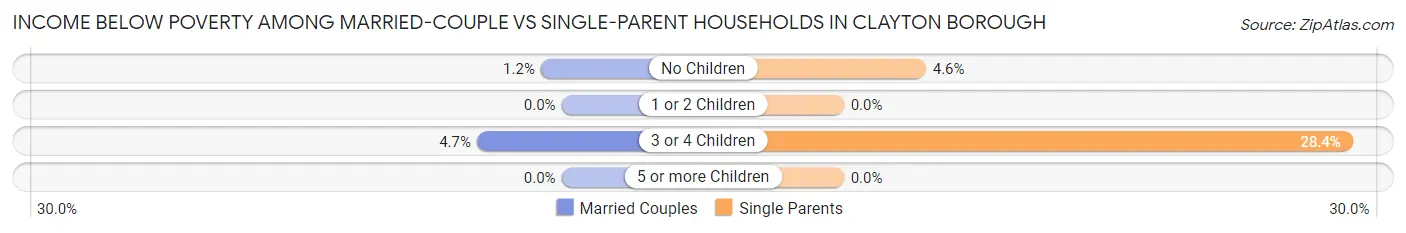
| Children | Married-Couple Families | Single-Parent Households |
| No Children | 13 (1.2%) | 9 (4.6%) |
| 1 or 2 Children | 0 (0.0%) | 0 (0.0%) |
| 3 or 4 Children | 8 (4.7%) | 31 (28.4%) |
| 5 or more Children | 0 (0.0%) | 0 (0.0%) |
| Total | 21 (1.3%) | 40 (5.6%) |
Race in Clayton borough
The most populous races in Clayton borough are White / Caucasian (5,992 | 68.1%), Black / African American (1,828 | 20.8%), and Hispanic or Latino (963 | 10.9%).
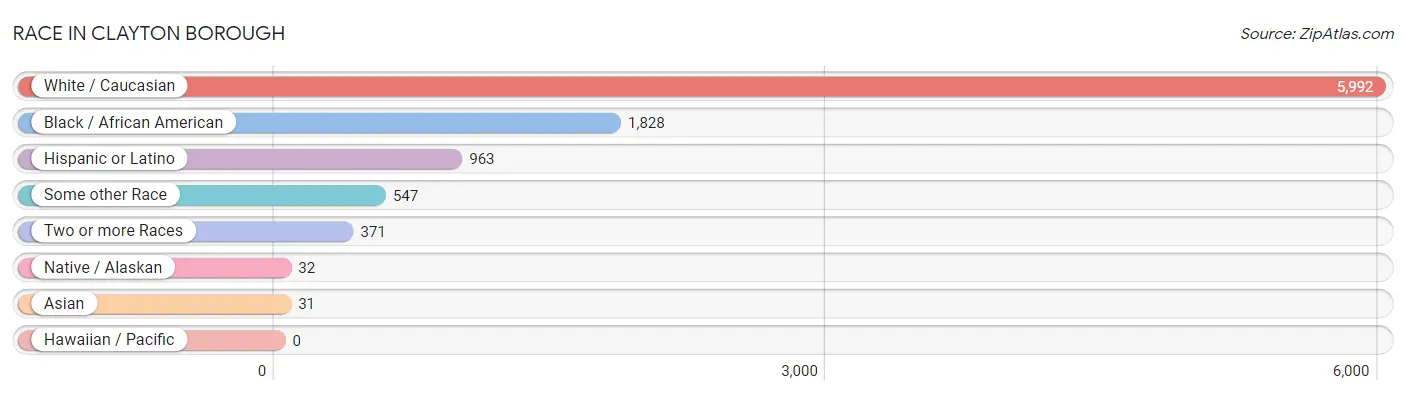
| Race | # Population | % Population |
| Asian | 31 | 0.4% |
| Black / African American | 1,828 | 20.8% |
| Hawaiian / Pacific | 0 | 0.0% |
| Hispanic or Latino | 963 | 10.9% |
| Native / Alaskan | 32 | 0.4% |
| White / Caucasian | 5,992 | 68.1% |
| Two or more Races | 371 | 4.2% |
| Some other Race | 547 | 6.2% |
| Total | 8,801 | 100.0% |
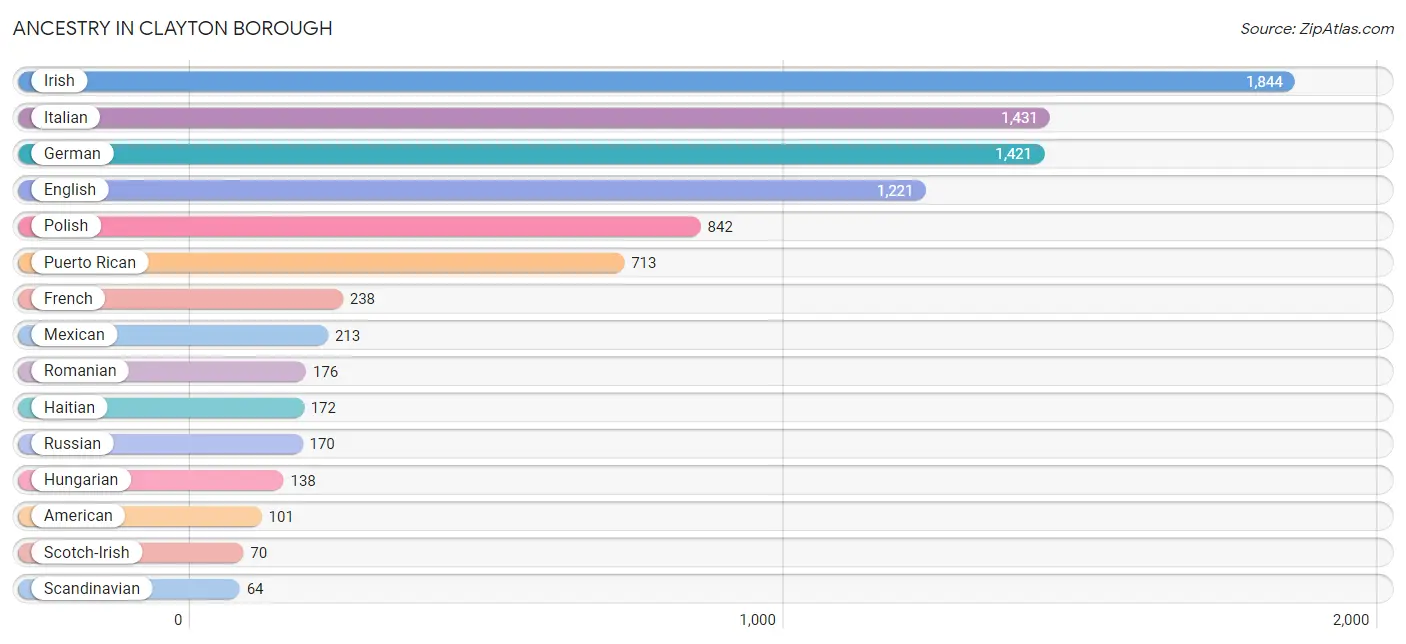
Ancestry in Clayton borough
The most populous ancestries reported in Clayton borough are Irish (1,844 | 20.9%), Italian (1,431 | 16.3%), German (1,421 | 16.2%), English (1,221 | 13.9%), and Polish (842 | 9.6%), together accounting for 76.8% of all Clayton borough residents.
| Ancestry | # Population | % Population |
| African | 30 | 0.3% |
| American | 101 | 1.1% |
| Armenian | 40 | 0.4% |
| Austrian | 18 | 0.2% |
| Bhutanese | 13 | 0.2% |
| Burmese | 12 | 0.1% |
| Central American | 21 | 0.2% |
| Central American Indian | 21 | 0.2% |
| Danish | 24 | 0.3% |
| Dominican | 16 | 0.2% |
| Eastern European | 46 | 0.5% |
| English | 1,221 | 13.9% |
| French | 238 | 2.7% |
| German | 1,421 | 16.2% |
| Greek | 27 | 0.3% |
| Guatemalan | 21 | 0.2% |
| Haitian | 172 | 1.9% |
| Hungarian | 138 | 1.6% |
| Indian (Asian) | 18 | 0.2% |
| Iranian | 19 | 0.2% |
| Irish | 1,844 | 20.9% |
| Italian | 1,431 | 16.3% |
| Korean | 18 | 0.2% |
| Lithuanian | 22 | 0.3% |
| Mexican | 213 | 2.4% |
| Mexican American Indian | 11 | 0.1% |
| Pennsylvania German | 9 | 0.1% |
| Polish | 842 | 9.6% |
| Portuguese | 17 | 0.2% |
| Puerto Rican | 713 | 8.1% |
| Romanian | 176 | 2.0% |
| Russian | 170 | 1.9% |
| Scandinavian | 64 | 0.7% |
| Scotch-Irish | 70 | 0.8% |
| Scottish | 27 | 0.3% |
| Slavic | 28 | 0.3% |
| Subsaharan African | 30 | 0.3% |
| Swedish | 19 | 0.2% |
| Turkish | 19 | 0.2% |
| Ukrainian | 21 | 0.2% |
| Welsh | 15 | 0.2% | View All 41 Rows |
Immigrants in Clayton borough
The most numerous immigrant groups reported in Clayton borough came from Latin America (227 | 2.6%), Caribbean (125 | 1.4%), Haiti (109 | 1.2%), Central America (102 | 1.2%), and Mexico (97 | 1.1%), together accounting for 7.5% of all Clayton borough residents.

| Immigration Origin | # Population | % Population |
| Asia | 13 | 0.2% |
| Caribbean | 125 | 1.4% |
| Central America | 102 | 1.2% |
| Dominican Republic | 16 | 0.2% |
| Eastern Asia | 13 | 0.2% |
| Europe | 25 | 0.3% |
| Germany | 6 | 0.1% |
| Guatemala | 5 | 0.1% |
| Haiti | 109 | 1.2% |
| Japan | 13 | 0.2% |
| Latin America | 227 | 2.6% |
| Mexico | 97 | 1.1% |
| Netherlands | 19 | 0.2% |
| Western Europe | 25 | 0.3% | View All 14 Rows |
Sex and Age in Clayton borough
Sex and Age in Clayton borough
The most populous age groups in Clayton borough are 5 to 9 Years (418 | 9.9%) for men and 5 to 9 Years (446 | 9.8%) for women.
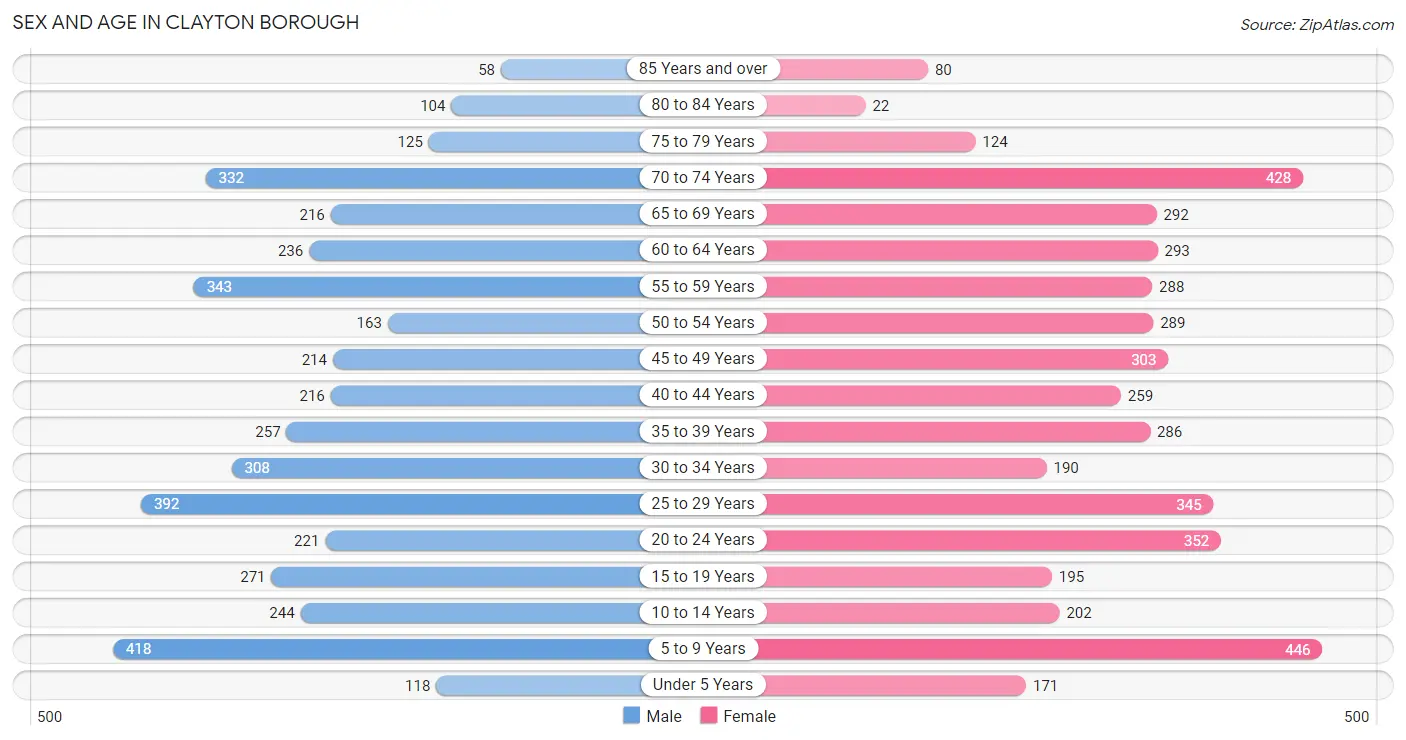
| Age Bracket | Male | Female |
| Under 5 Years | 118 (2.8%) | 171 (3.7%) |
| 5 to 9 Years | 418 (9.9%) | 446 (9.8%) |
| 10 to 14 Years | 244 (5.8%) | 202 (4.4%) |
| 15 to 19 Years | 271 (6.4%) | 195 (4.3%) |
| 20 to 24 Years | 221 (5.2%) | 352 (7.7%) |
| 25 to 29 Years | 392 (9.2%) | 345 (7.6%) |
| 30 to 34 Years | 308 (7.3%) | 190 (4.2%) |
| 35 to 39 Years | 257 (6.1%) | 286 (6.3%) |
| 40 to 44 Years | 216 (5.1%) | 259 (5.7%) |
| 45 to 49 Years | 214 (5.1%) | 303 (6.6%) |
| 50 to 54 Years | 163 (3.8%) | 289 (6.3%) |
| 55 to 59 Years | 343 (8.1%) | 288 (6.3%) |
| 60 to 64 Years | 236 (5.6%) | 293 (6.4%) |
| 65 to 69 Years | 216 (5.1%) | 292 (6.4%) |
| 70 to 74 Years | 332 (7.8%) | 428 (9.4%) |
| 75 to 79 Years | 125 (2.9%) | 124 (2.7%) |
| 80 to 84 Years | 104 (2.5%) | 22 (0.5%) |
| 85 Years and over | 58 (1.4%) | 80 (1.8%) |
| Total | 4,236 (100.0%) | 4,565 (100.0%) |
Families and Households in Clayton borough
Median Family Size in Clayton borough
The median family size in Clayton borough is 3.16 persons per family, with single male/father families (288 | 12.4%) accounting for the largest median family size of 3.2 persons per family. On the other hand, single female/mother families (432 | 18.6%) represent the smallest median family size with 3.07 persons per family.
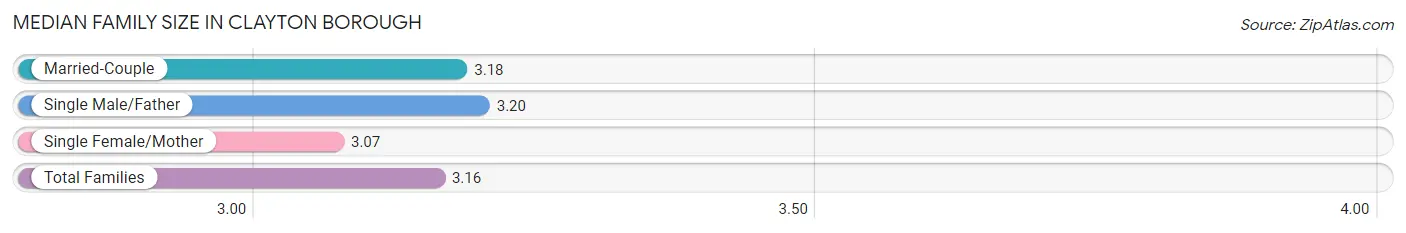
| Family Type | # Families | Family Size |
| Married-Couple | 1,602 (69.0%) | 3.18 |
| Single Male/Father | 288 (12.4%) | 3.20 |
| Single Female/Mother | 432 (18.6%) | 3.07 |
| Total Families | 2,322 (100.0%) | 3.16 |
Median Household Size in Clayton borough
The median household size in Clayton borough is 2.76 persons per household, with single male/father households (288 | 9.0%) accounting for the largest median household size of 4.01 persons per household. non-family households (866 | 27.2%) represent the smallest median household size with 1.24 persons per household.
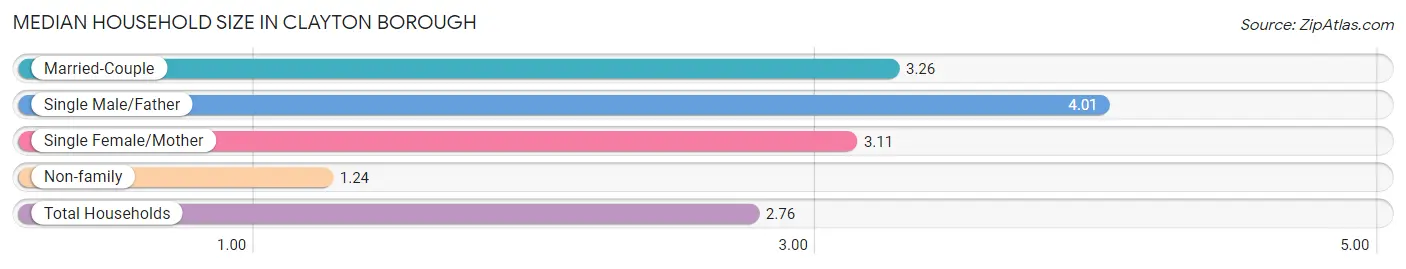
| Household Type | # Households | Household Size |
| Married-Couple | 1,602 (50.2%) | 3.26 |
| Single Male/Father | 288 (9.0%) | 4.01 |
| Single Female/Mother | 432 (13.6%) | 3.11 |
| Non-family | 866 (27.2%) | 1.24 |
| Total Households | 3,188 (100.0%) | 2.76 |
Household Size by Marriage Status in Clayton borough
Out of a total of 3,188 households in Clayton borough, 2,322 (72.8%) are family households, while 866 (27.2%) are nonfamily households. The most numerous type of family households are 2-person households, comprising 1,011, and the most common type of nonfamily households are 1-person households, comprising 663.
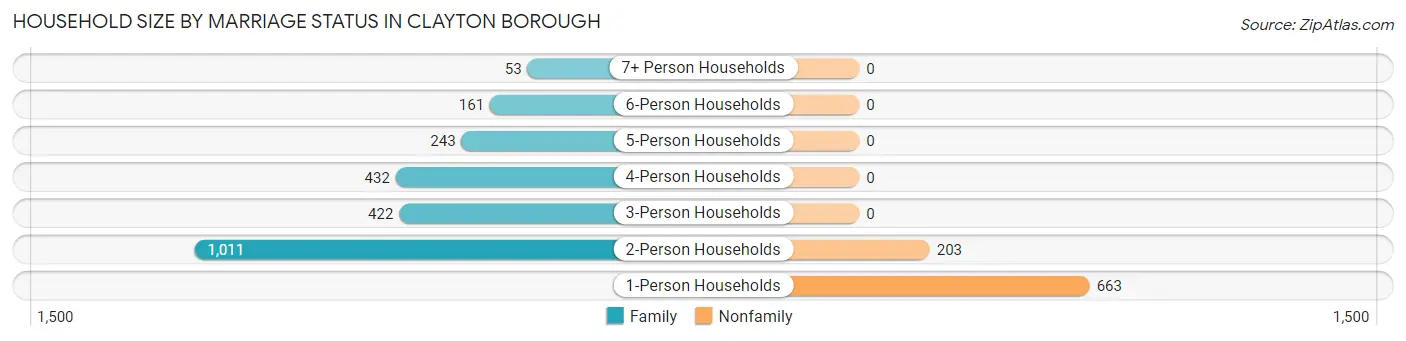
| Household Size | Family Households | Nonfamily Households |
| 1-Person Households | - | 663 (20.8%) |
| 2-Person Households | 1,011 (31.7%) | 203 (6.4%) |
| 3-Person Households | 422 (13.2%) | 0 (0.0%) |
| 4-Person Households | 432 (13.6%) | 0 (0.0%) |
| 5-Person Households | 243 (7.6%) | 0 (0.0%) |
| 6-Person Households | 161 (5.1%) | 0 (0.0%) |
| 7+ Person Households | 53 (1.7%) | 0 (0.0%) |
| Total | 2,322 (72.8%) | 866 (27.2%) |
Female Fertility in Clayton borough
Fertility by Age in Clayton borough
Average fertility rate in Clayton borough is 16.0 births per 1,000 women. Women in the age bracket of 20 to 34 years have the highest fertility rate with 34.0 births per 1,000 women. Women in the age bracket of 20 to 34 years acount for 100.0% of all women with births.
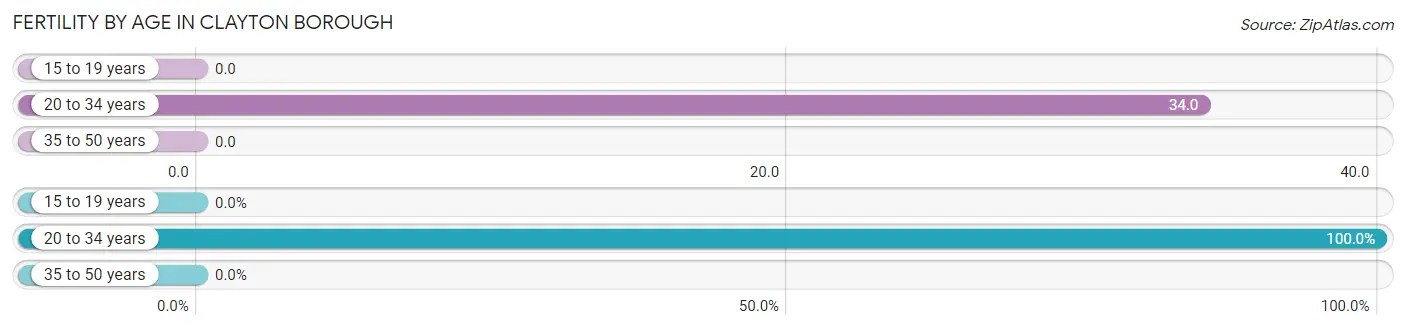
| Age Bracket | Women with Births | Births / 1,000 Women |
| 15 to 19 years | 0 (0.0%) | 0.0 |
| 20 to 34 years | 30 (100.0%) | 34.0 |
| 35 to 50 years | 0 (0.0%) | 0.0 |
| Total | 30 (100.0%) | 16.0 |
Fertility by Age by Marriage Status in Clayton borough
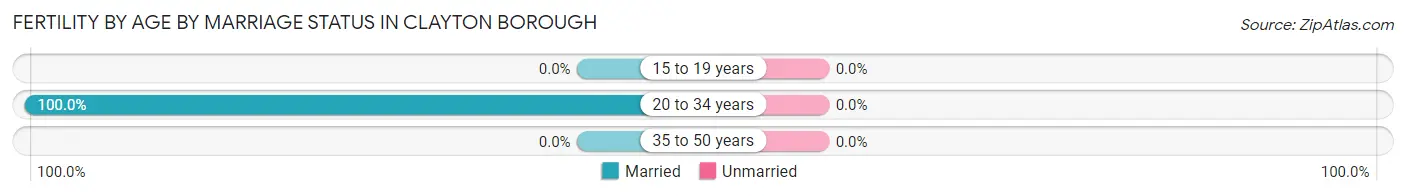
| Age Bracket | Married | Unmarried |
| 15 to 19 years | 0 (0.0%) | 0 (0.0%) |
| 20 to 34 years | 30 (100.0%) | 0 (0.0%) |
| 35 to 50 years | 0 (0.0%) | 0 (0.0%) |
| Total | 30 (100.0%) | 0 (0.0%) |
Fertility by Education in Clayton borough
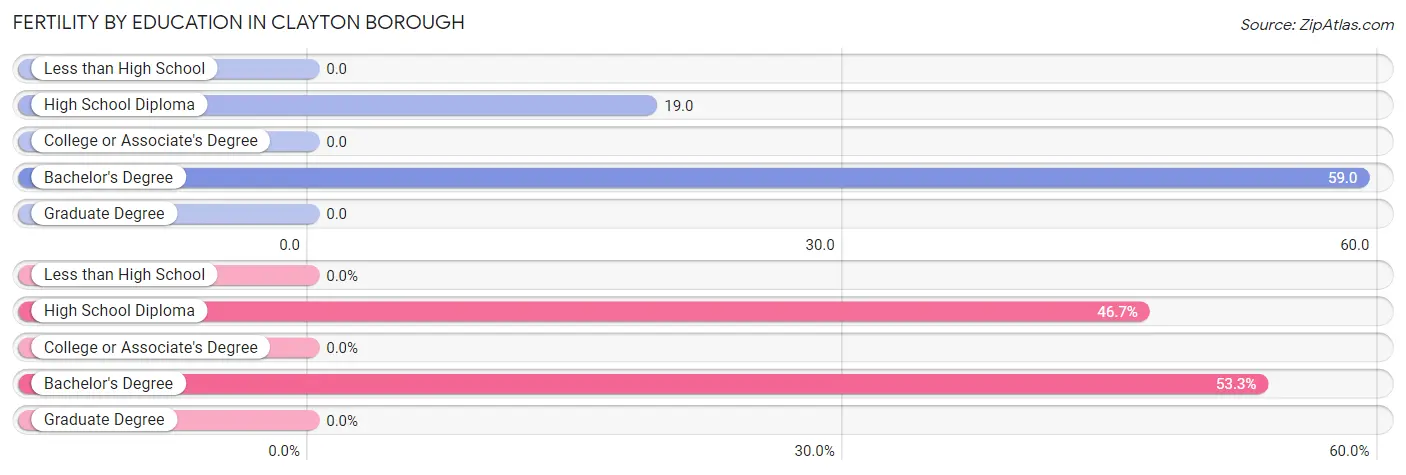
| Educational Attainment | Women with Births | Births / 1,000 Women |
| Less than High School | 0 (0.0%) | 0.0 |
| High School Diploma | 14 (46.7%) | 19.0 |
| College or Associate's Degree | 0 (0.0%) | 0.0 |
| Bachelor's Degree | 16 (53.3%) | 59.0 |
| Graduate Degree | 0 (0.0%) | 0.0 |
| Total | 30 (100.0%) | 16.0 |
Fertility by Education by Marriage Status in Clayton borough
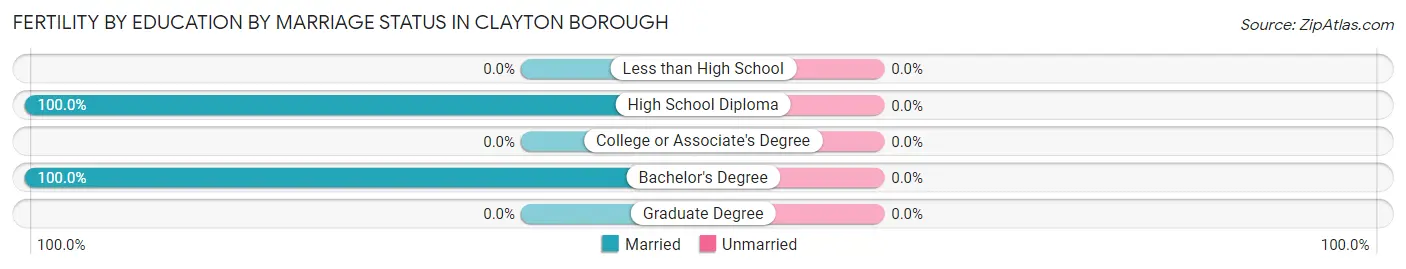
| Educational Attainment | Married | Unmarried |
| Less than High School | 0 (0.0%) | 0 (0.0%) |
| High School Diploma | 14 (100.0%) | 0 (0.0%) |
| College or Associate's Degree | 0 (0.0%) | 0 (0.0%) |
| Bachelor's Degree | 16 (100.0%) | 0 (0.0%) |
| Graduate Degree | 0 (0.0%) | 0 (0.0%) |
| Total | 30 (100.0%) | 0 (0.0%) |
Employment Characteristics in Clayton borough
Employment by Class of Employer in Clayton borough
Among the 3,918 employed individuals in Clayton borough, private company employees (2,834 | 72.3%), local government employees (340 | 8.7%), and not-for-profit organizations (309 | 7.9%) make up the most common classes of employment.
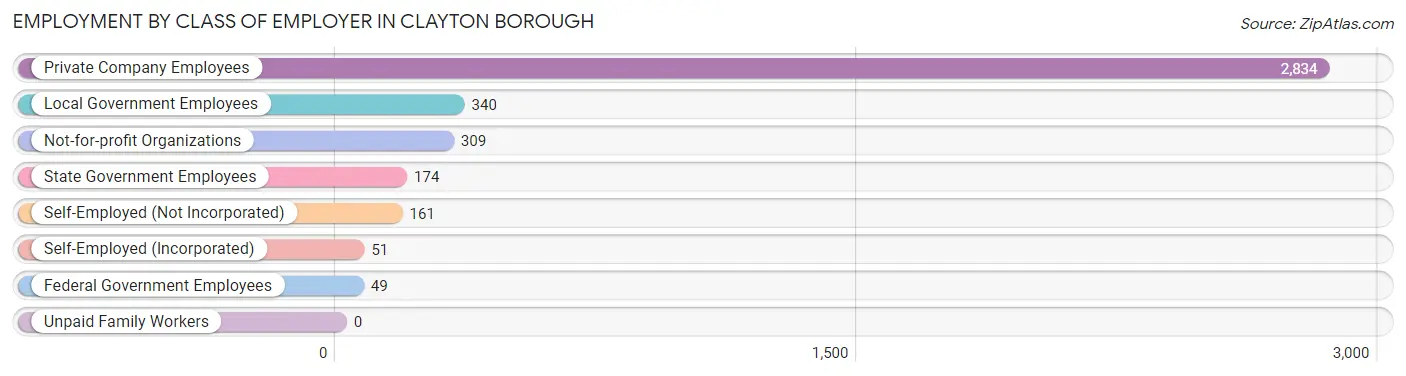
| Employer Class | # Employees | % Employees |
| Private Company Employees | 2,834 | 72.3% |
| Self-Employed (Incorporated) | 51 | 1.3% |
| Self-Employed (Not Incorporated) | 161 | 4.1% |
| Not-for-profit Organizations | 309 | 7.9% |
| Local Government Employees | 340 | 8.7% |
| State Government Employees | 174 | 4.4% |
| Federal Government Employees | 49 | 1.3% |
| Unpaid Family Workers | 0 | 0.0% |
| Total | 3,918 | 100.0% |
Employment Status by Age in Clayton borough
According to the labor force statistics for Clayton borough, out of the total population over 16 years of age (7,045), 63.8% or 4,495 individuals are in the labor force, with 8.2% or 369 of them unemployed. The age group with the highest labor force participation rate is 20 to 24 years, with 91.3% or 523 individuals in the labor force. Within the labor force, the 16 to 19 years age range has the highest percentage of unemployed individuals, with 51.6% or 79 of them being unemployed.
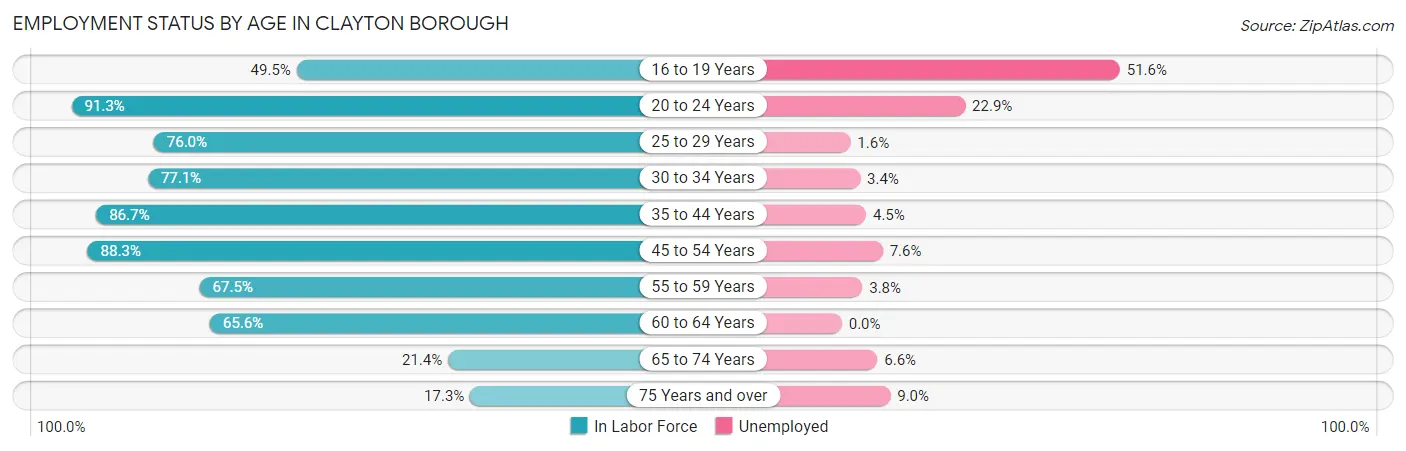
| Age Bracket | In Labor Force | Unemployed |
| 16 to 19 Years | 153 (49.5%) | 79 (51.6%) |
| 20 to 24 Years | 523 (91.3%) | 120 (22.9%) |
| 25 to 29 Years | 560 (76.0%) | 9 (1.6%) |
| 30 to 34 Years | 384 (77.1%) | 13 (3.4%) |
| 35 to 44 Years | 883 (86.7%) | 40 (4.5%) |
| 45 to 54 Years | 856 (88.3%) | 65 (7.6%) |
| 55 to 59 Years | 426 (67.5%) | 16 (3.8%) |
| 60 to 64 Years | 347 (65.6%) | 0 (0.0%) |
| 65 to 74 Years | 271 (21.4%) | 18 (6.6%) |
| 75 Years and over | 89 (17.3%) | 8 (9.0%) |
| Total | 4,495 (63.8%) | 369 (8.2%) |
Employment Status by Educational Attainment in Clayton borough
According to labor force statistics for Clayton borough, 78.9% of individuals (3,457) out of the total population between 25 and 64 years of age (4,382) are in the labor force, with 4.1% or 142 of them being unemployed. The group with the highest labor force participation rate are those with the educational attainment of bachelor's degree or higher, with 93.8% or 949 individuals in the labor force. Within the labor force, individuals with high school diploma education have the highest percentage of unemployment, with 6.1% or 77 of them being unemployed.
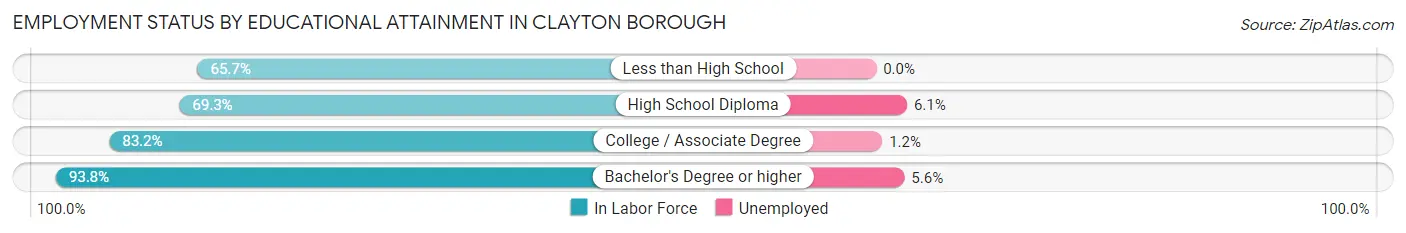
| Educational Attainment | In Labor Force | Unemployed |
| Less than High School | 159 (65.7%) | 0 (0.0%) |
| High School Diploma | 1,267 (69.3%) | 112 (6.1%) |
| College / Associate Degree | 1,082 (83.2%) | 16 (1.2%) |
| Bachelor's Degree or higher | 949 (93.8%) | 57 (5.6%) |
| Total | 3,457 (78.9%) | 180 (4.1%) |
Employment Occupations by Sex in Clayton borough
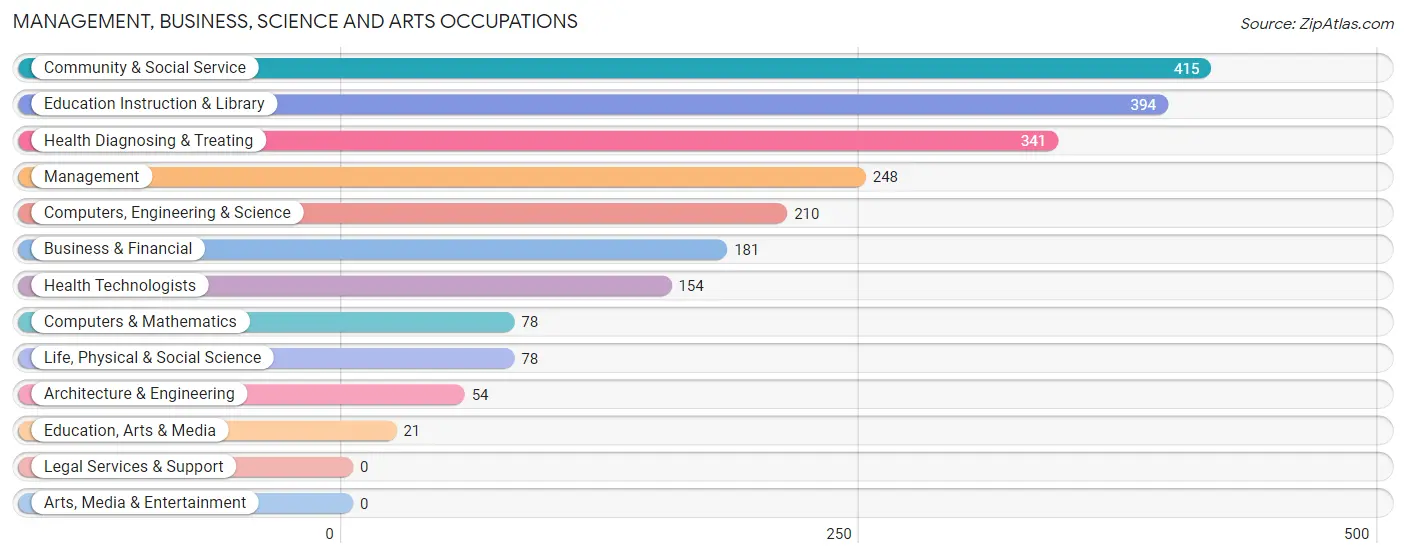
Management, Business, Science and Arts Occupations
The most common Management, Business, Science and Arts occupations in Clayton borough are Community & Social Service (415 | 10.1%), Education Instruction & Library (394 | 9.6%), Health Diagnosing & Treating (341 | 8.3%), Management (248 | 6.0%), and Computers, Engineering & Science (210 | 5.1%).
Management, Business, Science and Arts Occupations by Sex
Within the Management, Business, Science and Arts occupations in Clayton borough, the most male-oriented occupations are Computers & Mathematics (100.0%), Architecture & Engineering (100.0%), and Computers, Engineering & Science (95.2%), while the most female-oriented occupations are Health Diagnosing & Treating (74.5%), Health Technologists (71.4%), and Education Instruction & Library (59.9%).
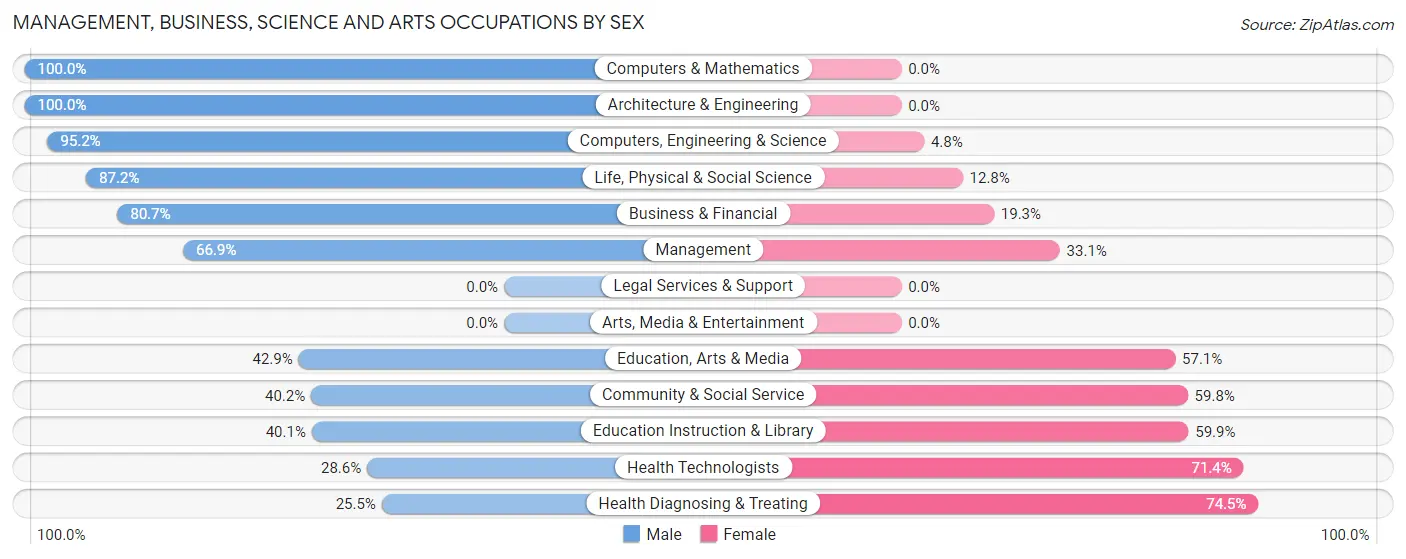
| Occupation | Male | Female |
| Management | 166 (66.9%) | 82 (33.1%) |
| Business & Financial | 146 (80.7%) | 35 (19.3%) |
| Computers, Engineering & Science | 200 (95.2%) | 10 (4.8%) |
| Computers & Mathematics | 78 (100.0%) | 0 (0.0%) |
| Architecture & Engineering | 54 (100.0%) | 0 (0.0%) |
| Life, Physical & Social Science | 68 (87.2%) | 10 (12.8%) |
| Community & Social Service | 167 (40.2%) | 248 (59.8%) |
| Education, Arts & Media | 9 (42.9%) | 12 (57.1%) |
| Legal Services & Support | 0 (0.0%) | 0 (0.0%) |
| Education Instruction & Library | 158 (40.1%) | 236 (59.9%) |
| Arts, Media & Entertainment | 0 (0.0%) | 0 (0.0%) |
| Health Diagnosing & Treating | 87 (25.5%) | 254 (74.5%) |
| Health Technologists | 44 (28.6%) | 110 (71.4%) |
| Total (Category) | 766 (54.9%) | 629 (45.1%) |
| Total (Overall) | 2,114 (51.4%) | 1,997 (48.6%) |
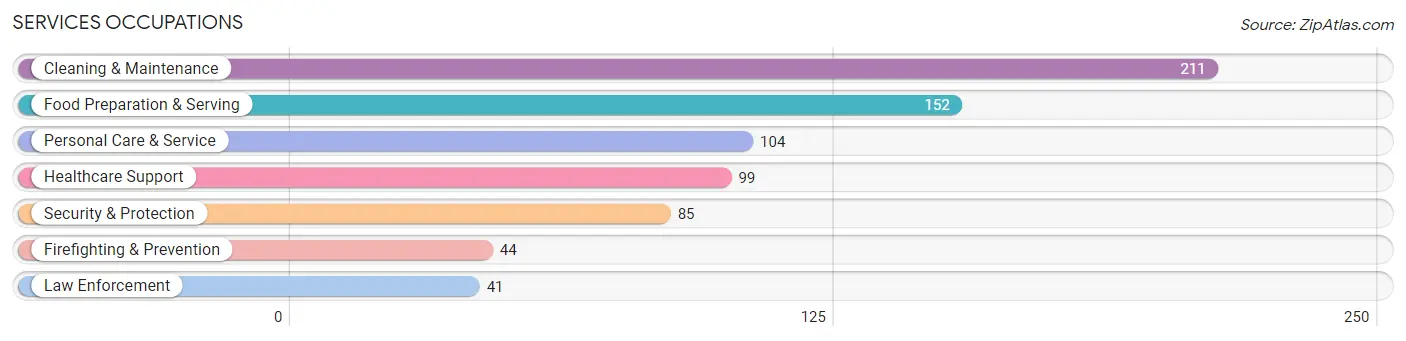
Services Occupations
The most common Services occupations in Clayton borough are Cleaning & Maintenance (211 | 5.1%), Food Preparation & Serving (152 | 3.7%), Personal Care & Service (104 | 2.5%), Healthcare Support (99 | 2.4%), and Security & Protection (85 | 2.1%).
Services Occupations by Sex
Within the Services occupations in Clayton borough, the most male-oriented occupations are Security & Protection (100.0%), Firefighting & Prevention (100.0%), and Law Enforcement (100.0%), while the most female-oriented occupations are Healthcare Support (90.9%), Personal Care & Service (62.5%), and Food Preparation & Serving (35.5%).
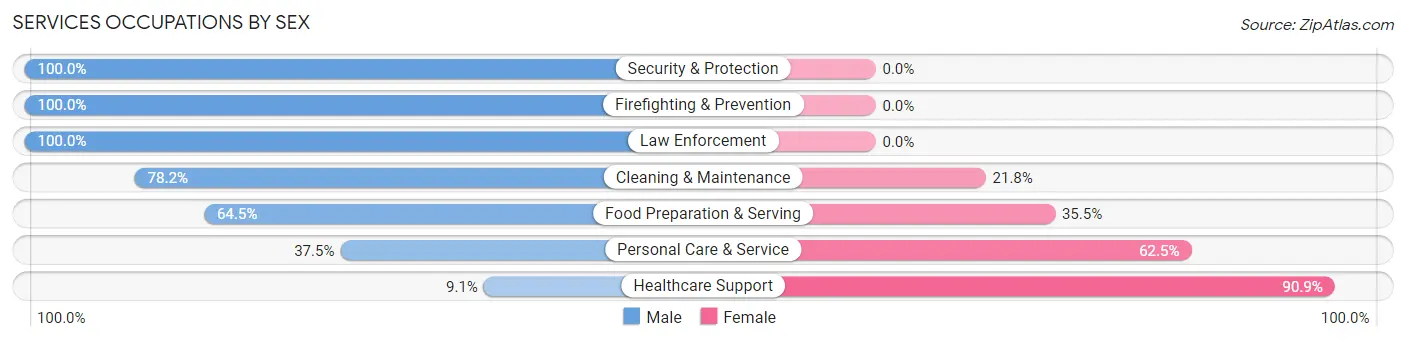
| Occupation | Male | Female |
| Healthcare Support | 9 (9.1%) | 90 (90.9%) |
| Security & Protection | 85 (100.0%) | 0 (0.0%) |
| Firefighting & Prevention | 44 (100.0%) | 0 (0.0%) |
| Law Enforcement | 41 (100.0%) | 0 (0.0%) |
| Food Preparation & Serving | 98 (64.5%) | 54 (35.5%) |
| Cleaning & Maintenance | 165 (78.2%) | 46 (21.8%) |
| Personal Care & Service | 39 (37.5%) | 65 (62.5%) |
| Total (Category) | 396 (60.8%) | 255 (39.2%) |
| Total (Overall) | 2,114 (51.4%) | 1,997 (48.6%) |
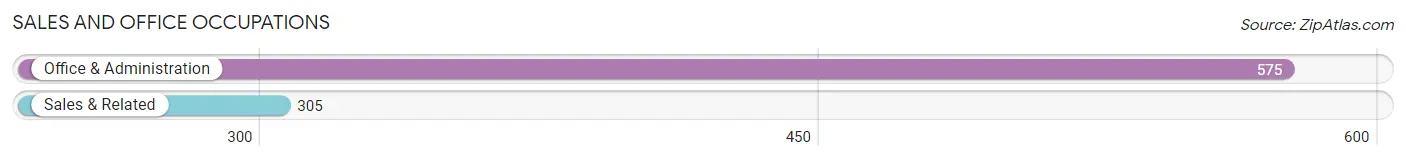
Sales and Office Occupations
The most common Sales and Office occupations in Clayton borough are Office & Administration (575 | 14.0%), and Sales & Related (305 | 7.4%).
Sales and Office Occupations by Sex
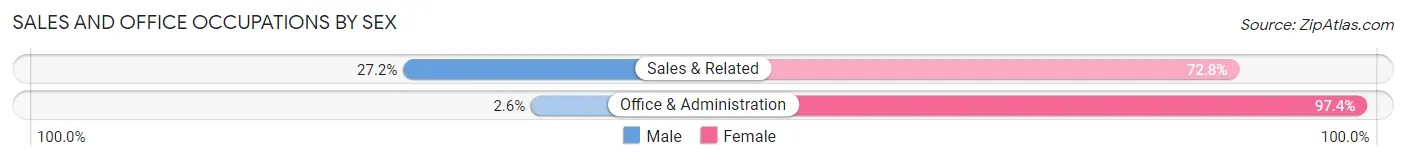
| Occupation | Male | Female |
| Sales & Related | 83 (27.2%) | 222 (72.8%) |
| Office & Administration | 15 (2.6%) | 560 (97.4%) |
| Total (Category) | 98 (11.1%) | 782 (88.9%) |
| Total (Overall) | 2,114 (51.4%) | 1,997 (48.6%) |
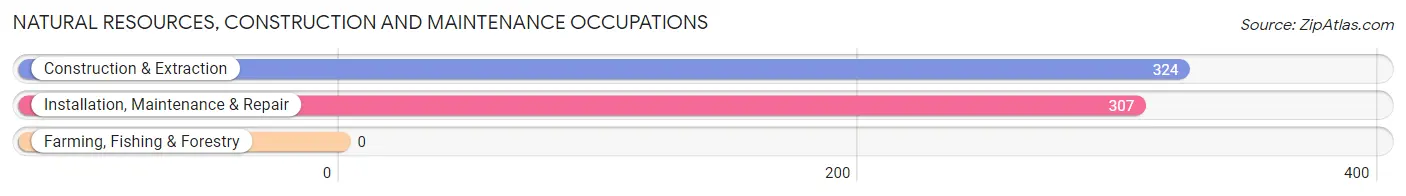
Natural Resources, Construction and Maintenance Occupations
The most common Natural Resources, Construction and Maintenance occupations in Clayton borough are Construction & Extraction (324 | 7.9%), and Installation, Maintenance & Repair (307 | 7.5%).
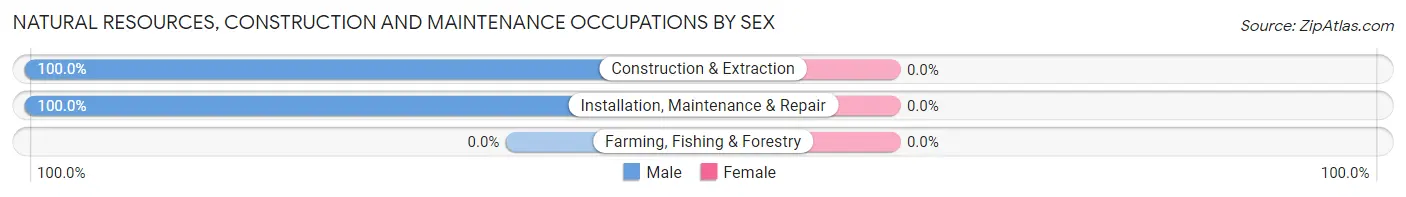
Natural Resources, Construction and Maintenance Occupations by Sex
| Occupation | Male | Female |
| Farming, Fishing & Forestry | 0 (0.0%) | 0 (0.0%) |
| Construction & Extraction | 324 (100.0%) | 0 (0.0%) |
| Installation, Maintenance & Repair | 307 (100.0%) | 0 (0.0%) |
| Total (Category) | 631 (100.0%) | 0 (0.0%) |
| Total (Overall) | 2,114 (51.4%) | 1,997 (48.6%) |
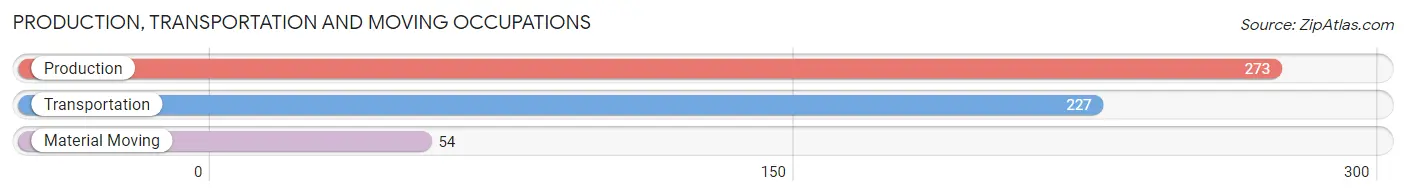
Production, Transportation and Moving Occupations
The most common Production, Transportation and Moving occupations in Clayton borough are Production (273 | 6.6%), Transportation (227 | 5.5%), and Material Moving (54 | 1.3%).
Production, Transportation and Moving Occupations by Sex
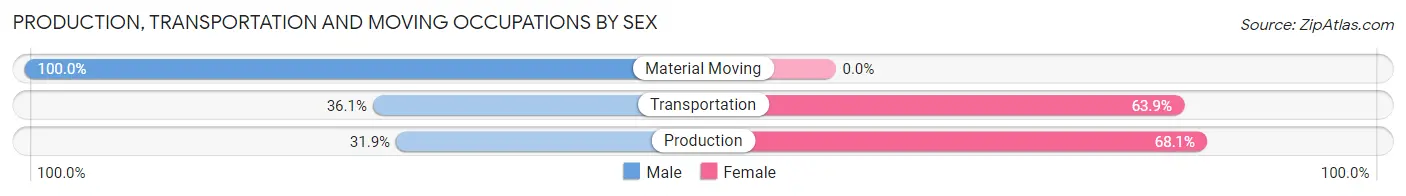
| Occupation | Male | Female |
| Production | 87 (31.9%) | 186 (68.1%) |
| Transportation | 82 (36.1%) | 145 (63.9%) |
| Material Moving | 54 (100.0%) | 0 (0.0%) |
| Total (Category) | 223 (40.3%) | 331 (59.8%) |
| Total (Overall) | 2,114 (51.4%) | 1,997 (48.6%) |
Employment Industries by Sex in Clayton borough
Employment Industries in Clayton borough
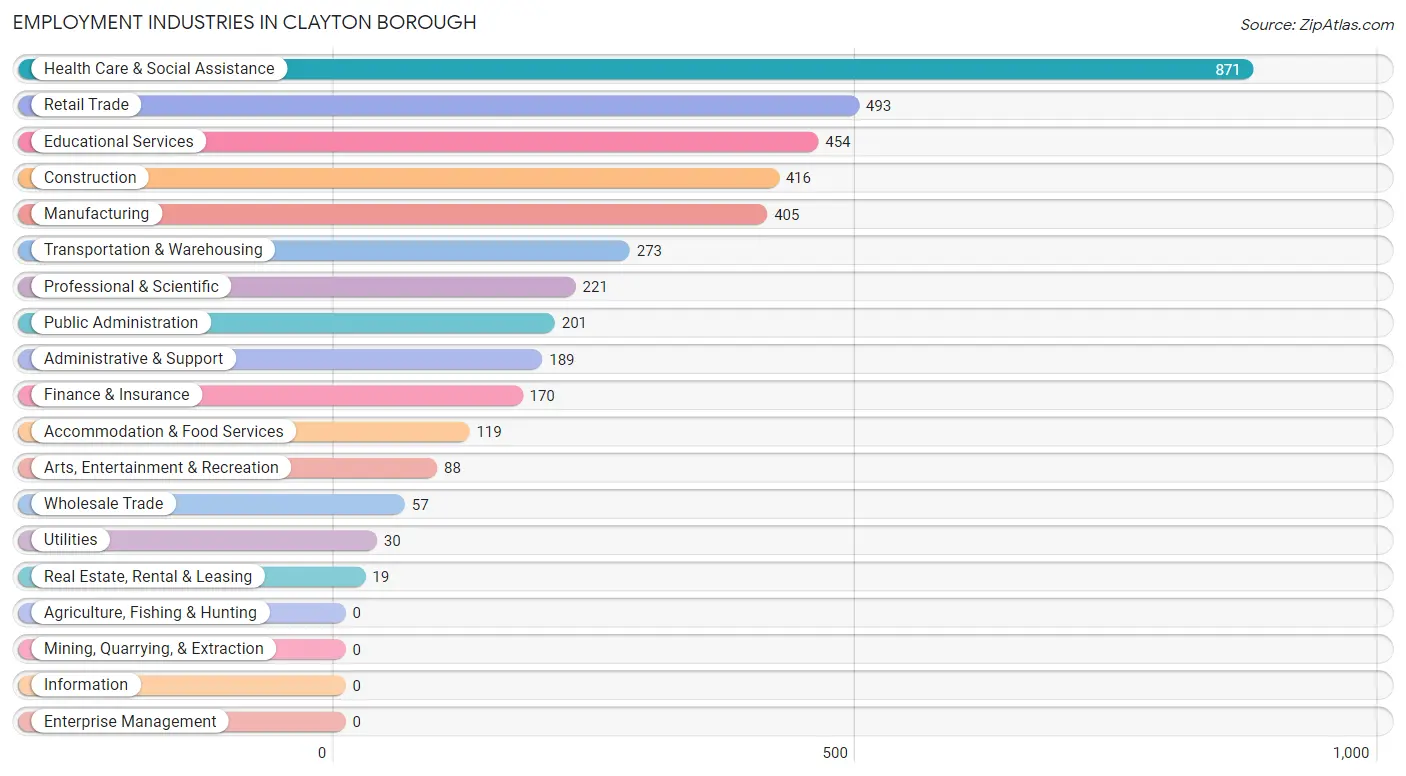
The major employment industries in Clayton borough include Health Care & Social Assistance (871 | 21.2%), Retail Trade (493 | 12.0%), Educational Services (454 | 11.0%), Construction (416 | 10.1%), and Manufacturing (405 | 9.9%).
Employment Industries by Sex in Clayton borough
The Clayton borough industries that see more men than women are Utilities (100.0%), Construction (93.3%), and Arts, Entertainment & Recreation (63.6%), whereas the industries that tend to have a higher number of women are Public Administration (72.6%), Health Care & Social Assistance (69.5%), and Accommodation & Food Services (65.5%).
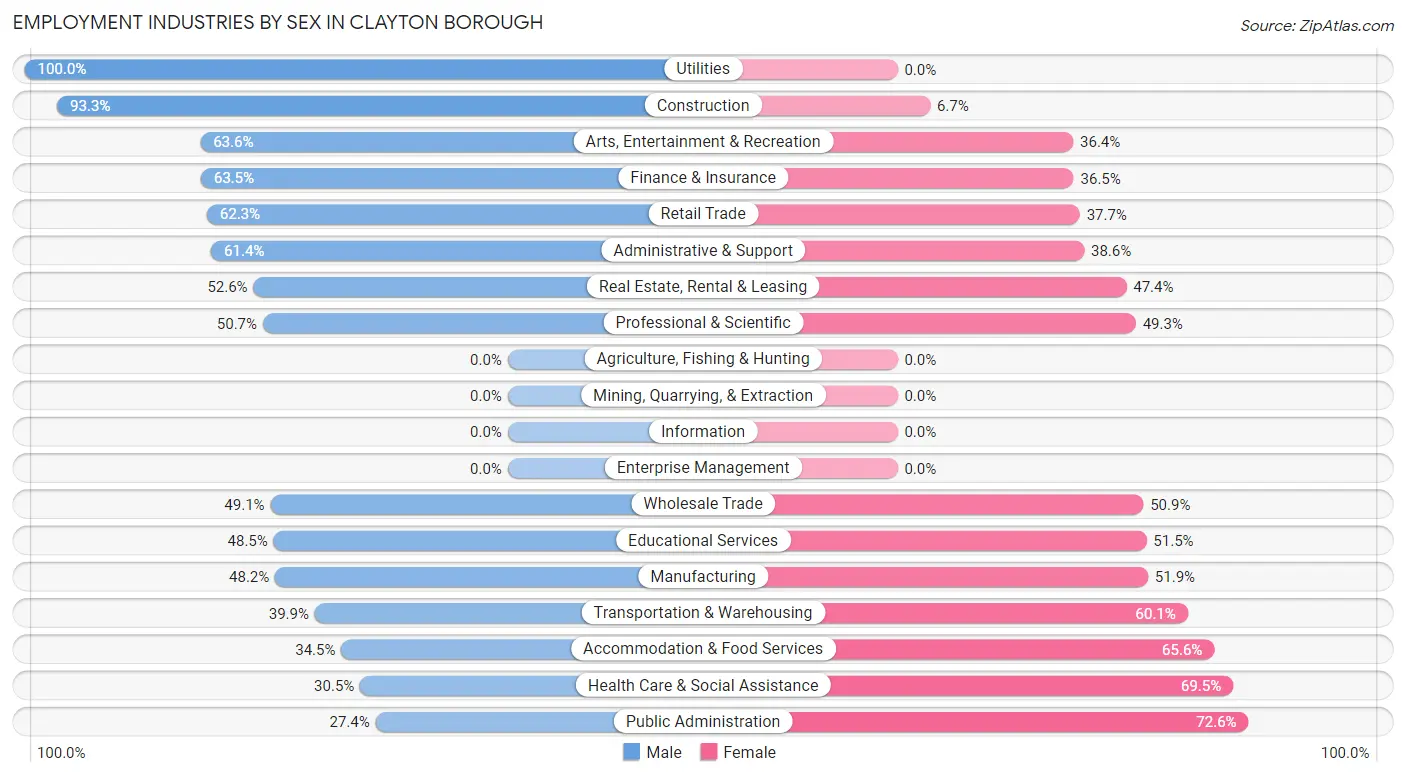
| Industry | Male | Female |
| Agriculture, Fishing & Hunting | 0 (0.0%) | 0 (0.0%) |
| Mining, Quarrying, & Extraction | 0 (0.0%) | 0 (0.0%) |
| Construction | 388 (93.3%) | 28 (6.7%) |
| Manufacturing | 195 (48.1%) | 210 (51.8%) |
| Wholesale Trade | 28 (49.1%) | 29 (50.9%) |
| Retail Trade | 307 (62.3%) | 186 (37.7%) |
| Transportation & Warehousing | 109 (39.9%) | 164 (60.1%) |
| Utilities | 30 (100.0%) | 0 (0.0%) |
| Information | 0 (0.0%) | 0 (0.0%) |
| Finance & Insurance | 108 (63.5%) | 62 (36.5%) |
| Real Estate, Rental & Leasing | 10 (52.6%) | 9 (47.4%) |
| Professional & Scientific | 112 (50.7%) | 109 (49.3%) |
| Enterprise Management | 0 (0.0%) | 0 (0.0%) |
| Administrative & Support | 116 (61.4%) | 73 (38.6%) |
| Educational Services | 220 (48.5%) | 234 (51.5%) |
| Health Care & Social Assistance | 266 (30.5%) | 605 (69.5%) |
| Arts, Entertainment & Recreation | 56 (63.6%) | 32 (36.4%) |
| Accommodation & Food Services | 41 (34.4%) | 78 (65.5%) |
| Public Administration | 55 (27.4%) | 146 (72.6%) |
| Total | 2,114 (51.4%) | 1,997 (48.6%) |
Education in Clayton borough
School Enrollment in Clayton borough
The most common levels of schooling among the 2,445 students in Clayton borough are college / undergraduate (639 | 26.1%), elementary school (530 | 21.7%), and high school (460 | 18.8%).
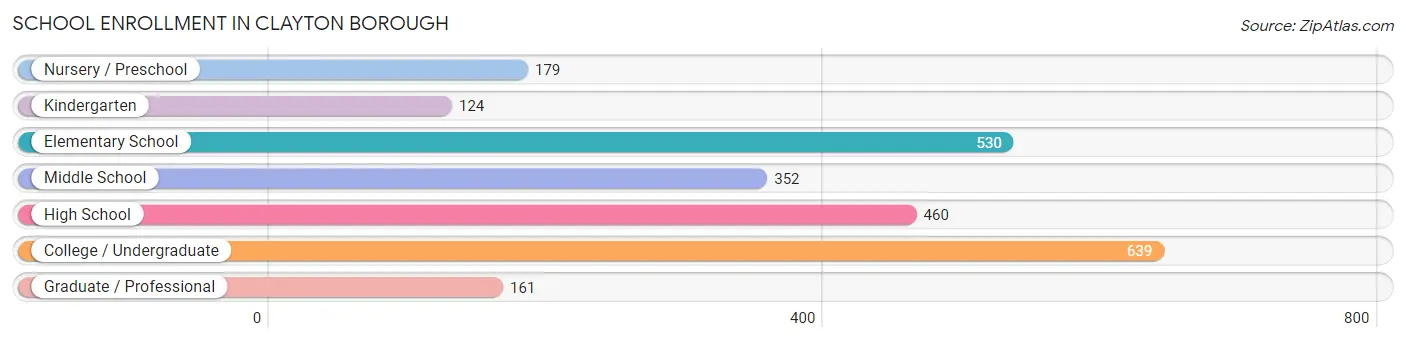
| School Level | # Students | % Students |
| Nursery / Preschool | 179 | 7.3% |
| Kindergarten | 124 | 5.1% |
| Elementary School | 530 | 21.7% |
| Middle School | 352 | 14.4% |
| High School | 460 | 18.8% |
| College / Undergraduate | 639 | 26.1% |
| Graduate / Professional | 161 | 6.6% |
| Total | 2,445 | 100.0% |
School Enrollment by Age by Funding Source in Clayton borough
Out of a total of 2,445 students who are enrolled in schools in Clayton borough, 345 (14.1%) attend a private institution, while the remaining 2,100 (85.9%) are enrolled in public schools. The age group of 20 to 24 year olds has the highest likelihood of being enrolled in private schools, with 116 (37.5% in the age bracket) enrolled. Conversely, the age group of 3 to 4 year olds has the lowest likelihood of being enrolled in a private school, with 102 (100.0% in the age bracket) attending a public institution.
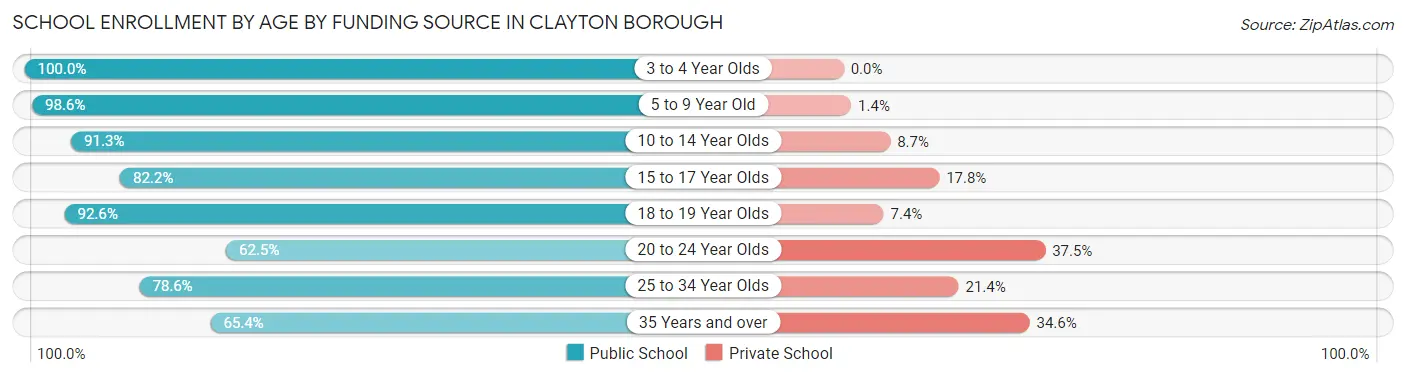
| Age Bracket | Public School | Private School |
| 3 to 4 Year Olds | 102 (100.0%) | 0 (0.0%) |
| 5 to 9 Year Old | 709 (98.6%) | 10 (1.4%) |
| 10 to 14 Year Olds | 390 (91.3%) | 37 (8.7%) |
| 15 to 17 Year Olds | 268 (82.2%) | 58 (17.8%) |
| 18 to 19 Year Olds | 112 (92.6%) | 9 (7.4%) |
| 20 to 24 Year Olds | 193 (62.5%) | 116 (37.5%) |
| 25 to 34 Year Olds | 224 (78.6%) | 61 (21.4%) |
| 35 Years and over | 102 (65.4%) | 54 (34.6%) |
| Total | 2,100 (85.9%) | 345 (14.1%) |
Educational Attainment by Field of Study in Clayton borough
Business (247 | 18.3%), science & technology (205 | 15.2%), education (170 | 12.6%), social sciences (113 | 8.4%), and visual & performing arts (92 | 6.8%) are the most common fields of study among 1,351 individuals in Clayton borough who have obtained a bachelor's degree or higher.
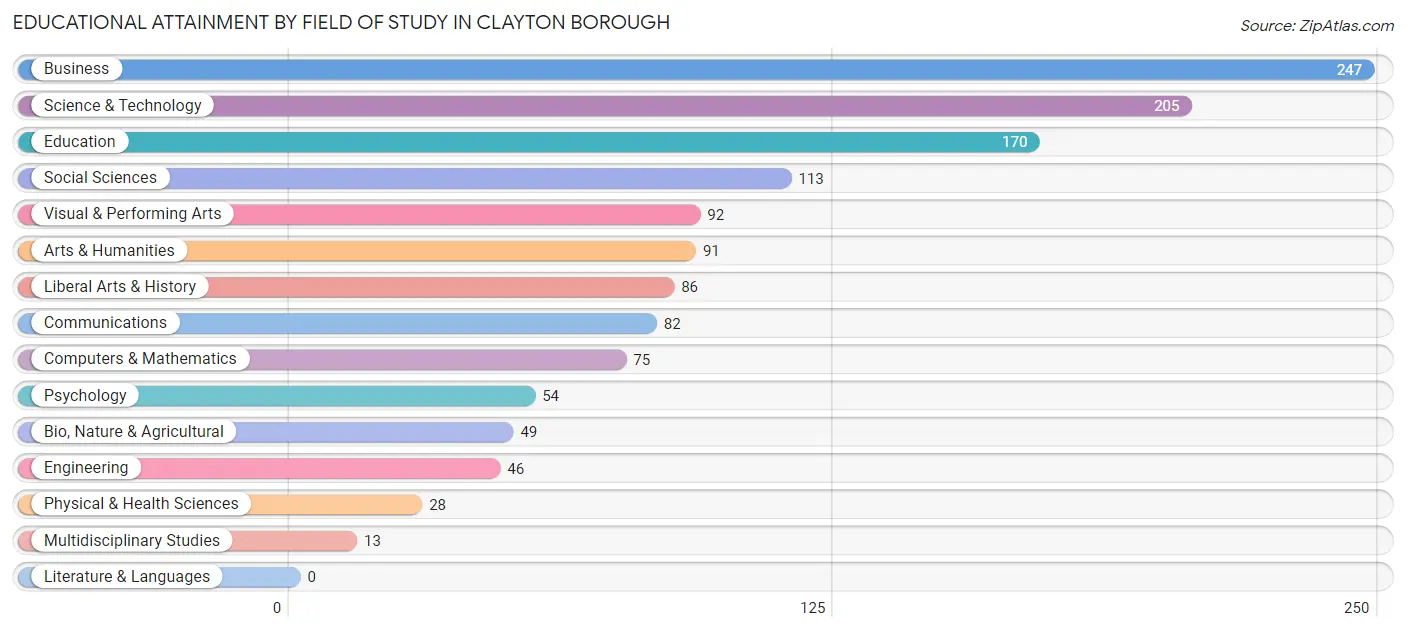
| Field of Study | # Graduates | % Graduates |
| Computers & Mathematics | 75 | 5.6% |
| Bio, Nature & Agricultural | 49 | 3.6% |
| Physical & Health Sciences | 28 | 2.1% |
| Psychology | 54 | 4.0% |
| Social Sciences | 113 | 8.4% |
| Engineering | 46 | 3.4% |
| Multidisciplinary Studies | 13 | 1.0% |
| Science & Technology | 205 | 15.2% |
| Business | 247 | 18.3% |
| Education | 170 | 12.6% |
| Literature & Languages | 0 | 0.0% |
| Liberal Arts & History | 86 | 6.4% |
| Visual & Performing Arts | 92 | 6.8% |
| Communications | 82 | 6.1% |
| Arts & Humanities | 91 | 6.7% |
| Total | 1,351 | 100.0% |
Transportation & Commute in Clayton borough
Vehicle Availability by Sex in Clayton borough
The most prevalent vehicle ownership categories in Clayton borough are males with 2 vehicles (781, accounting for 37.8%) and females with 2 vehicles (651, making up 42.1%).
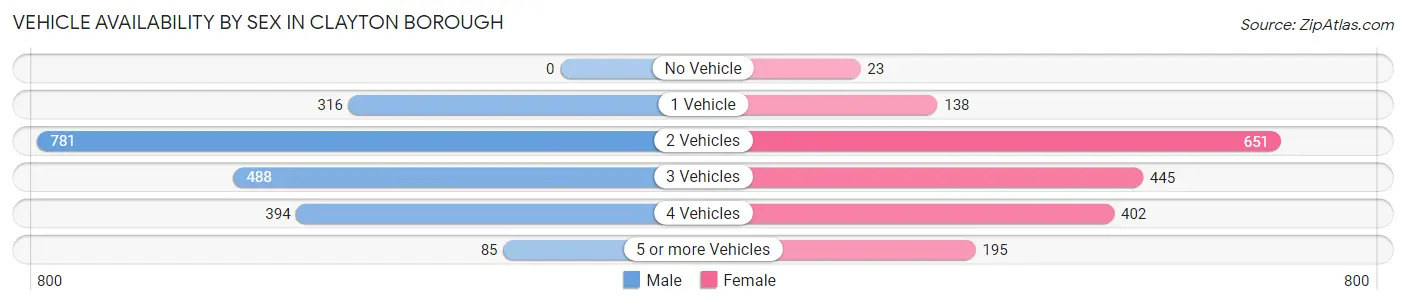
| Vehicles Available | Male | Female |
| No Vehicle | 0 (0.0%) | 23 (1.2%) |
| 1 Vehicle | 316 (15.3%) | 138 (7.4%) |
| 2 Vehicles | 781 (37.8%) | 651 (35.1%) |
| 3 Vehicles | 488 (23.6%) | 445 (24.0%) |
| 4 Vehicles | 394 (19.1%) | 402 (21.7%) |
| 5 or more Vehicles | 85 (4.1%) | 195 (10.5%) |
| Total | 2,064 (100.0%) | 1,854 (100.0%) |
Commute Time in Clayton borough
The most frequently occuring commute durations in Clayton borough are 20 to 24 minutes (565 commuters, 15.5%), 45 to 59 minutes (524 commuters, 14.4%), and 5 to 9 minutes (392 commuters, 10.8%).
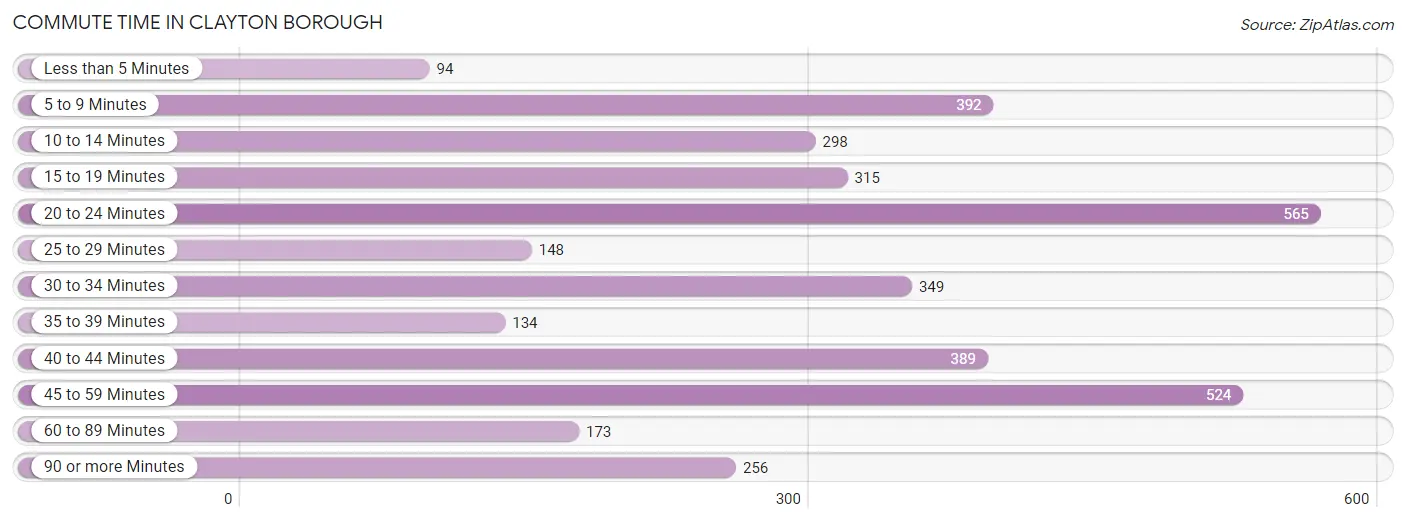
| Commute Time | # Commuters | % Commuters |
| Less than 5 Minutes | 94 | 2.6% |
| 5 to 9 Minutes | 392 | 10.8% |
| 10 to 14 Minutes | 298 | 8.2% |
| 15 to 19 Minutes | 315 | 8.7% |
| 20 to 24 Minutes | 565 | 15.5% |
| 25 to 29 Minutes | 148 | 4.1% |
| 30 to 34 Minutes | 349 | 9.6% |
| 35 to 39 Minutes | 134 | 3.7% |
| 40 to 44 Minutes | 389 | 10.7% |
| 45 to 59 Minutes | 524 | 14.4% |
| 60 to 89 Minutes | 173 | 4.8% |
| 90 or more Minutes | 256 | 7.0% |
Commute Time by Sex in Clayton borough
The most common commute times in Clayton borough are 45 to 59 minutes (418 commuters, 22.3%) for males and 5 to 9 minutes (294 commuters, 16.7%) for females.
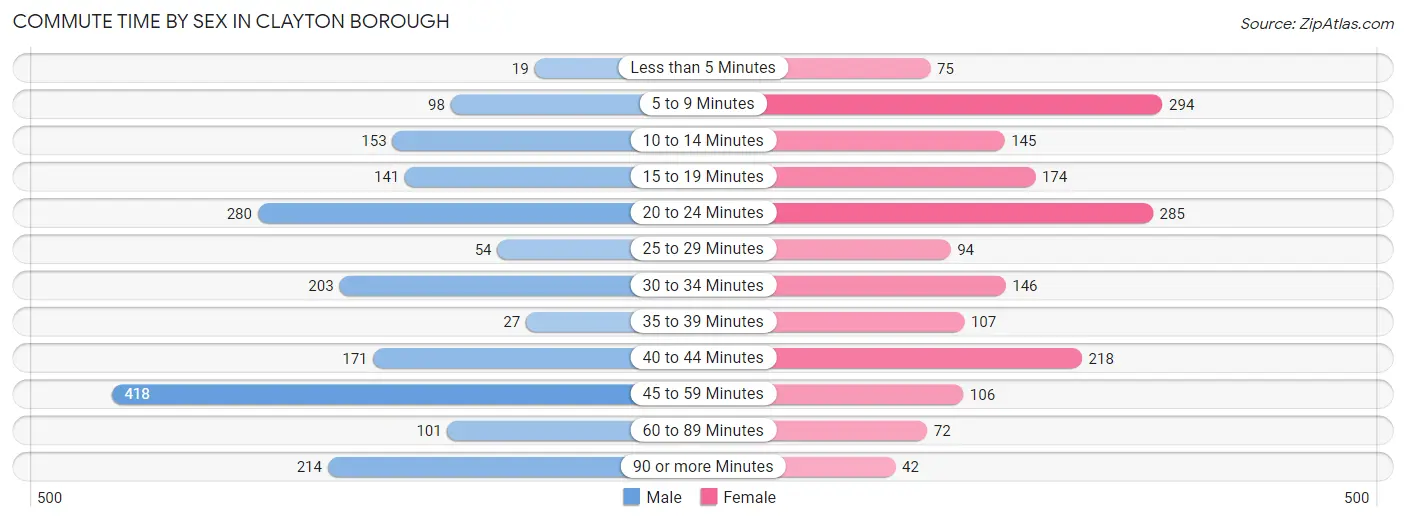
| Commute Time | Male | Female |
| Less than 5 Minutes | 19 (1.0%) | 75 (4.3%) |
| 5 to 9 Minutes | 98 (5.2%) | 294 (16.7%) |
| 10 to 14 Minutes | 153 (8.1%) | 145 (8.3%) |
| 15 to 19 Minutes | 141 (7.5%) | 174 (9.9%) |
| 20 to 24 Minutes | 280 (14.9%) | 285 (16.2%) |
| 25 to 29 Minutes | 54 (2.9%) | 94 (5.3%) |
| 30 to 34 Minutes | 203 (10.8%) | 146 (8.3%) |
| 35 to 39 Minutes | 27 (1.4%) | 107 (6.1%) |
| 40 to 44 Minutes | 171 (9.1%) | 218 (12.4%) |
| 45 to 59 Minutes | 418 (22.3%) | 106 (6.0%) |
| 60 to 89 Minutes | 101 (5.4%) | 72 (4.1%) |
| 90 or more Minutes | 214 (11.4%) | 42 (2.4%) |
Time of Departure to Work by Sex in Clayton borough
The most frequent times of departure to work in Clayton borough are 7:00 AM to 7:29 AM (331, 17.6%) for males and 6:30 AM to 6:59 AM (321, 18.3%) for females.
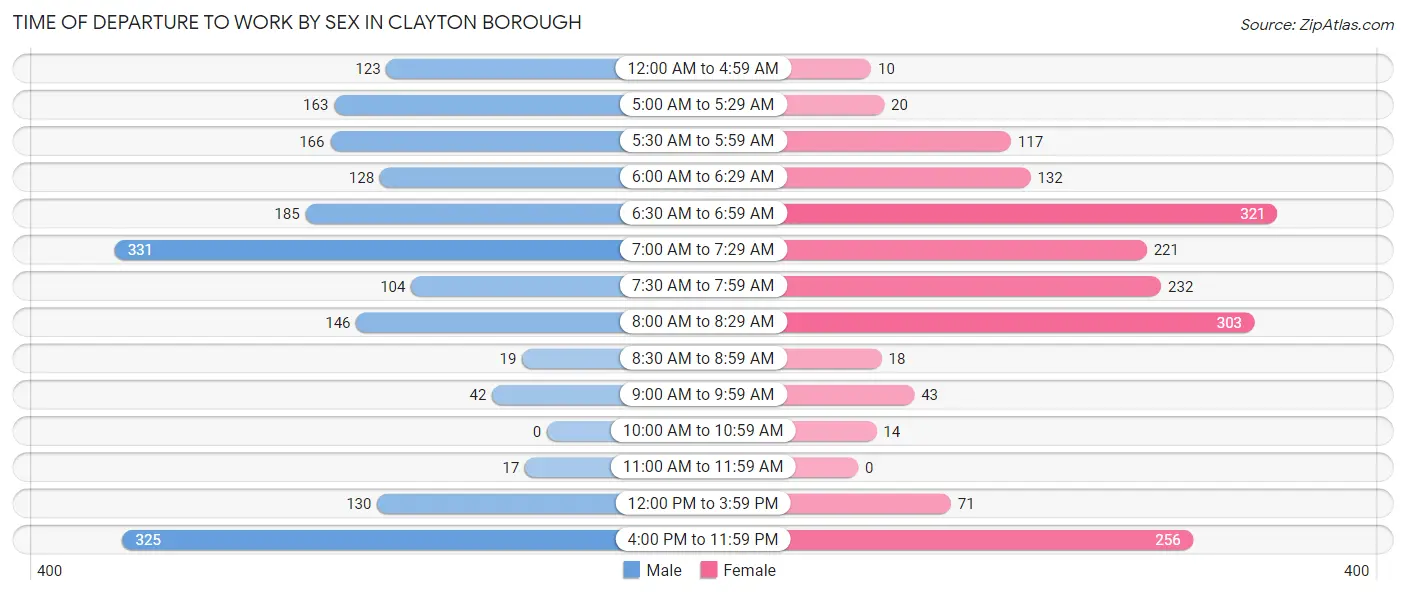
| Time of Departure | Male | Female |
| 12:00 AM to 4:59 AM | 123 (6.6%) | 10 (0.6%) |
| 5:00 AM to 5:29 AM | 163 (8.7%) | 20 (1.1%) |
| 5:30 AM to 5:59 AM | 166 (8.8%) | 117 (6.7%) |
| 6:00 AM to 6:29 AM | 128 (6.8%) | 132 (7.5%) |
| 6:30 AM to 6:59 AM | 185 (9.9%) | 321 (18.3%) |
| 7:00 AM to 7:29 AM | 331 (17.6%) | 221 (12.6%) |
| 7:30 AM to 7:59 AM | 104 (5.5%) | 232 (13.2%) |
| 8:00 AM to 8:29 AM | 146 (7.8%) | 303 (17.2%) |
| 8:30 AM to 8:59 AM | 19 (1.0%) | 18 (1.0%) |
| 9:00 AM to 9:59 AM | 42 (2.2%) | 43 (2.5%) |
| 10:00 AM to 10:59 AM | 0 (0.0%) | 14 (0.8%) |
| 11:00 AM to 11:59 AM | 17 (0.9%) | 0 (0.0%) |
| 12:00 PM to 3:59 PM | 130 (6.9%) | 71 (4.0%) |
| 4:00 PM to 11:59 PM | 325 (17.3%) | 256 (14.6%) |
| Total | 1,879 (100.0%) | 1,758 (100.0%) |
Housing Occupancy in Clayton borough
Occupancy by Ownership in Clayton borough
Of the total 3,188 dwellings in Clayton borough, owner-occupied units account for 2,344 (73.5%), while renter-occupied units make up 844 (26.5%).
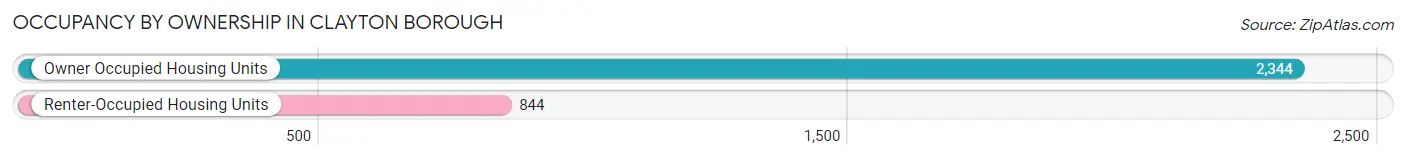
| Occupancy | # Housing Units | % Housing Units |
| Owner Occupied Housing Units | 2,344 | 73.5% |
| Renter-Occupied Housing Units | 844 | 26.5% |
| Total Occupied Housing Units | 3,188 | 100.0% |
Occupancy by Household Size in Clayton borough
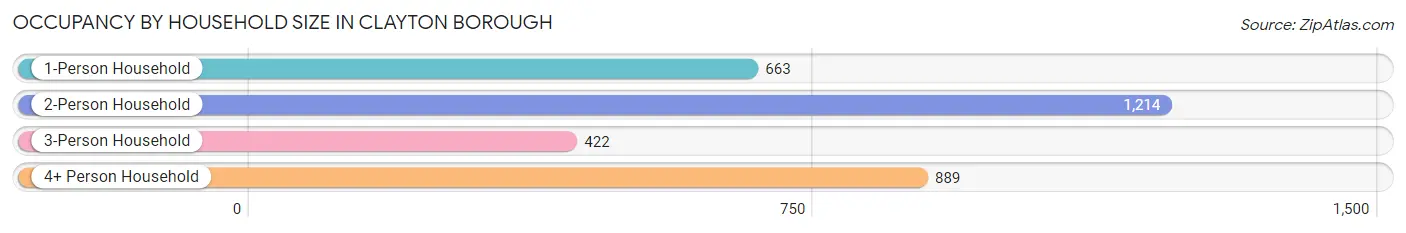
| Household Size | # Housing Units | % Housing Units |
| 1-Person Household | 663 | 20.8% |
| 2-Person Household | 1,214 | 38.1% |
| 3-Person Household | 422 | 13.2% |
| 4+ Person Household | 889 | 27.9% |
| Total Housing Units | 3,188 | 100.0% |
Occupancy by Ownership by Household Size in Clayton borough
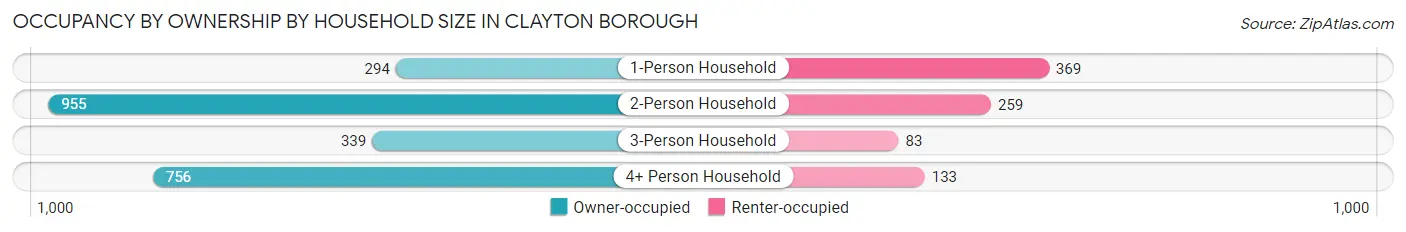
| Household Size | Owner-occupied | Renter-occupied |
| 1-Person Household | 294 (44.3%) | 369 (55.7%) |
| 2-Person Household | 955 (78.7%) | 259 (21.3%) |
| 3-Person Household | 339 (80.3%) | 83 (19.7%) |
| 4+ Person Household | 756 (85.0%) | 133 (15.0%) |
| Total Housing Units | 2,344 (73.5%) | 844 (26.5%) |
Occupancy by Educational Attainment in Clayton borough
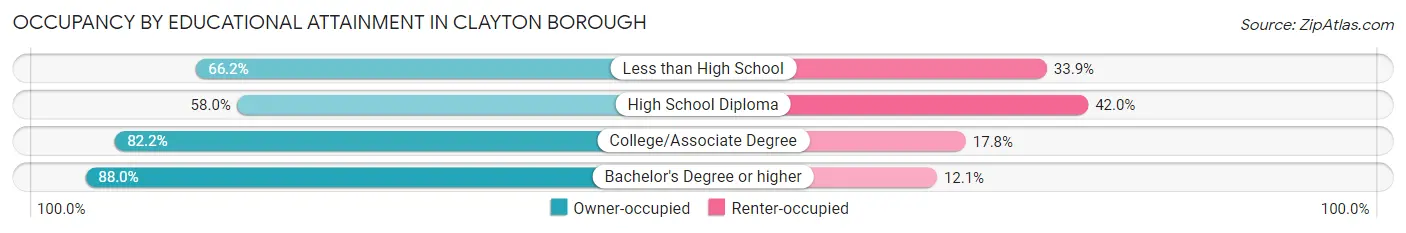
| Household Size | Owner-occupied | Renter-occupied |
| Less than High School | 213 (66.1%) | 109 (33.9%) |
| High School Diploma | 652 (58.0%) | 473 (42.0%) |
| College/Associate Degree | 749 (82.2%) | 162 (17.8%) |
| Bachelor's Degree or higher | 730 (87.9%) | 100 (12.0%) |
Occupancy by Age of Householder in Clayton borough
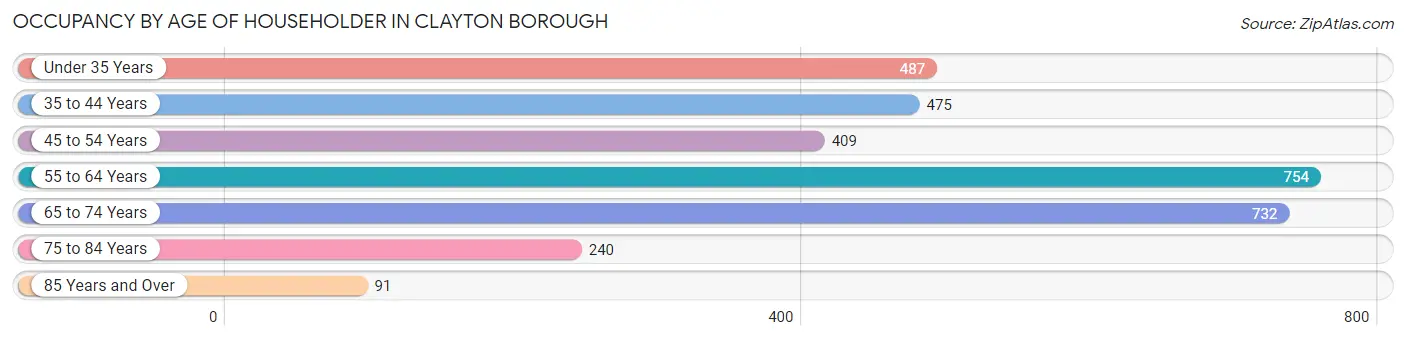
| Age Bracket | # Households | % Households |
| Under 35 Years | 487 | 15.3% |
| 35 to 44 Years | 475 | 14.9% |
| 45 to 54 Years | 409 | 12.8% |
| 55 to 64 Years | 754 | 23.6% |
| 65 to 74 Years | 732 | 23.0% |
| 75 to 84 Years | 240 | 7.5% |
| 85 Years and Over | 91 | 2.9% |
| Total | 3,188 | 100.0% |
Housing Finances in Clayton borough
Median Income by Occupancy in Clayton borough
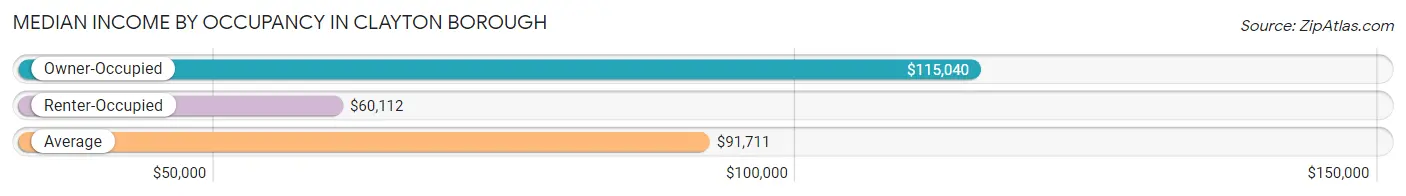
| Occupancy Type | # Households | Median Income |
| Owner-Occupied | 2,344 (73.5%) | $115,040 |
| Renter-Occupied | 844 (26.5%) | $60,112 |
| Average | 3,188 (100.0%) | $91,711 |
Occupancy by Householder Income Bracket in Clayton borough
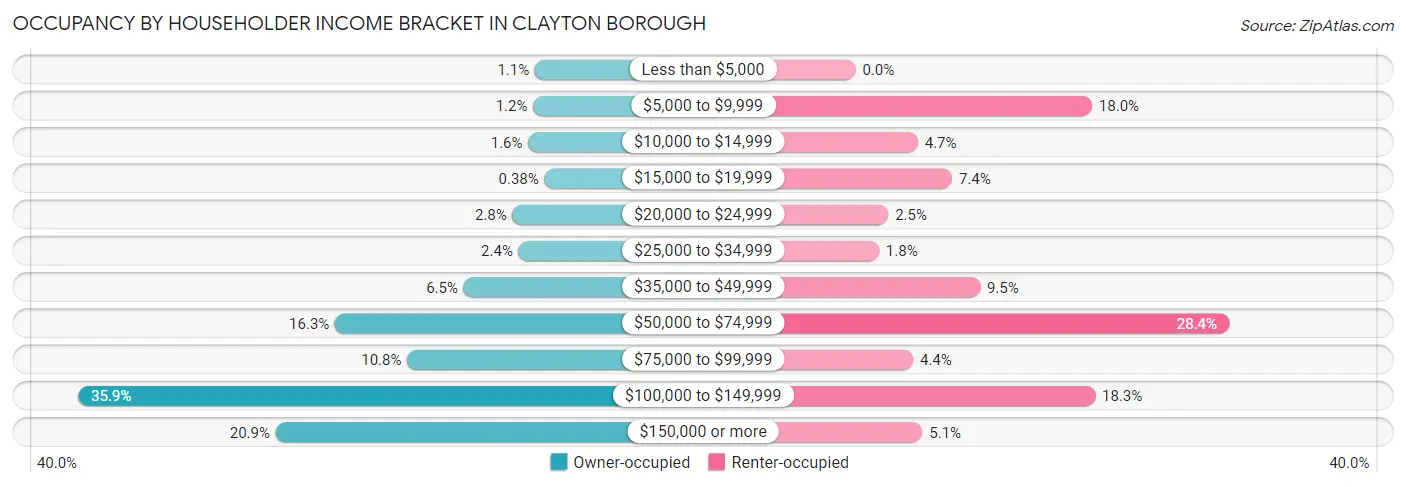
| Income Bracket | Owner-occupied | Renter-occupied |
| Less than $5,000 | 26 (1.1%) | 0 (0.0%) |
| $5,000 to $9,999 | 29 (1.2%) | 152 (18.0%) |
| $10,000 to $14,999 | 38 (1.6%) | 40 (4.7%) |
| $15,000 to $19,999 | 9 (0.4%) | 62 (7.3%) |
| $20,000 to $24,999 | 66 (2.8%) | 21 (2.5%) |
| $25,000 to $34,999 | 55 (2.4%) | 15 (1.8%) |
| $35,000 to $49,999 | 153 (6.5%) | 80 (9.5%) |
| $50,000 to $74,999 | 383 (16.3%) | 240 (28.4%) |
| $75,000 to $99,999 | 254 (10.8%) | 37 (4.4%) |
| $100,000 to $149,999 | 842 (35.9%) | 154 (18.2%) |
| $150,000 or more | 489 (20.9%) | 43 (5.1%) |
| Total | 2,344 (100.0%) | 844 (100.0%) |
Monthly Housing Cost Tiers in Clayton borough
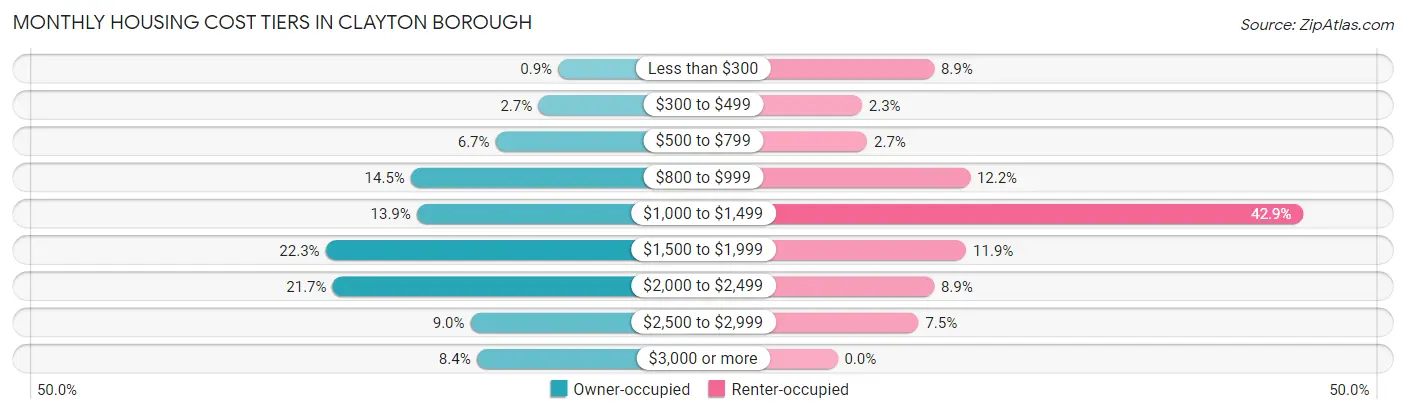
| Monthly Cost | Owner-occupied | Renter-occupied |
| Less than $300 | 21 (0.9%) | 75 (8.9%) |
| $300 to $499 | 64 (2.7%) | 19 (2.2%) |
| $500 to $799 | 156 (6.7%) | 23 (2.7%) |
| $800 to $999 | 339 (14.5%) | 103 (12.2%) |
| $1,000 to $1,499 | 326 (13.9%) | 362 (42.9%) |
| $1,500 to $1,999 | 523 (22.3%) | 100 (11.8%) |
| $2,000 to $2,499 | 508 (21.7%) | 75 (8.9%) |
| $2,500 to $2,999 | 210 (9.0%) | 63 (7.5%) |
| $3,000 or more | 197 (8.4%) | 0 (0.0%) |
| Total | 2,344 (100.0%) | 844 (100.0%) |
Physical Housing Characteristics in Clayton borough
Housing Structures in Clayton borough
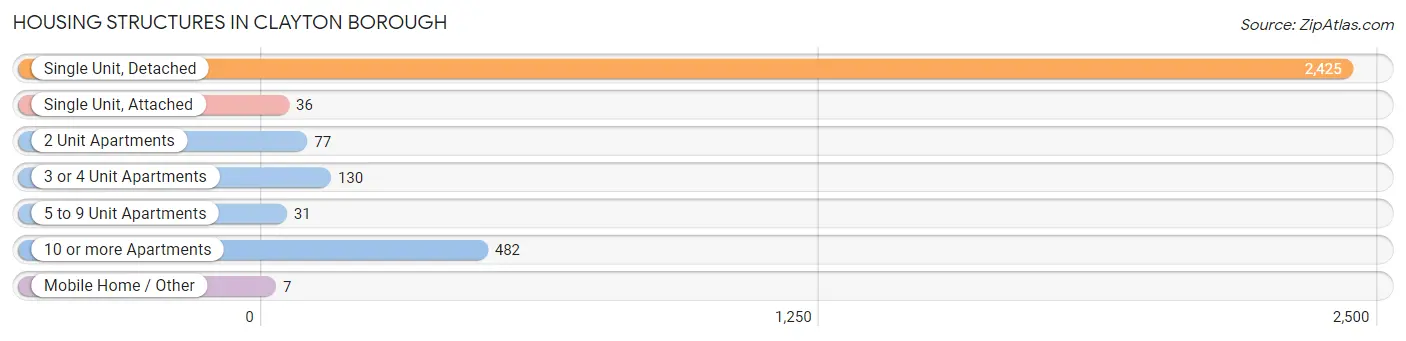
| Structure Type | # Housing Units | % Housing Units |
| Single Unit, Detached | 2,425 | 76.1% |
| Single Unit, Attached | 36 | 1.1% |
| 2 Unit Apartments | 77 | 2.4% |
| 3 or 4 Unit Apartments | 130 | 4.1% |
| 5 to 9 Unit Apartments | 31 | 1.0% |
| 10 or more Apartments | 482 | 15.1% |
| Mobile Home / Other | 7 | 0.2% |
| Total | 3,188 | 100.0% |
Housing Structures by Occupancy in Clayton borough
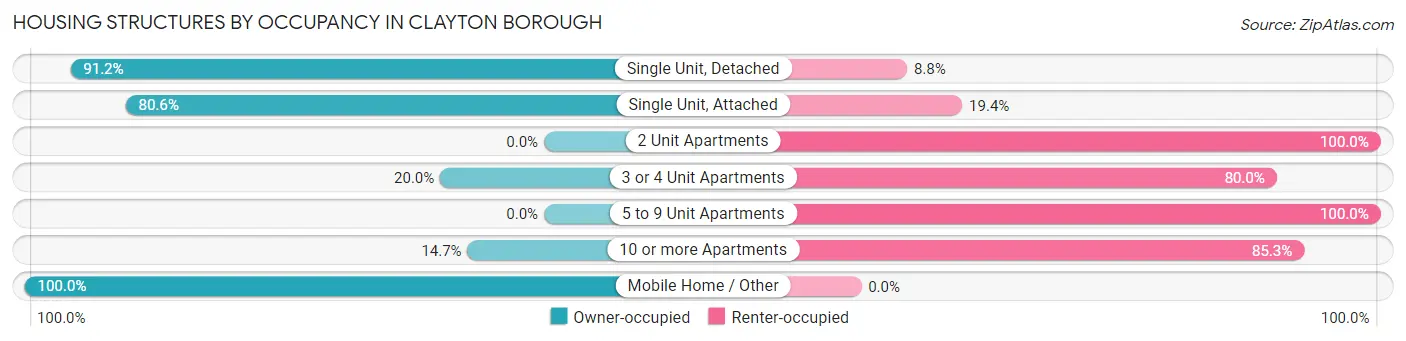
| Structure Type | Owner-occupied | Renter-occupied |
| Single Unit, Detached | 2,211 (91.2%) | 214 (8.8%) |
| Single Unit, Attached | 29 (80.6%) | 7 (19.4%) |
| 2 Unit Apartments | 0 (0.0%) | 77 (100.0%) |
| 3 or 4 Unit Apartments | 26 (20.0%) | 104 (80.0%) |
| 5 to 9 Unit Apartments | 0 (0.0%) | 31 (100.0%) |
| 10 or more Apartments | 71 (14.7%) | 411 (85.3%) |
| Mobile Home / Other | 7 (100.0%) | 0 (0.0%) |
| Total | 2,344 (73.5%) | 844 (26.5%) |
Housing Structures by Number of Rooms in Clayton borough
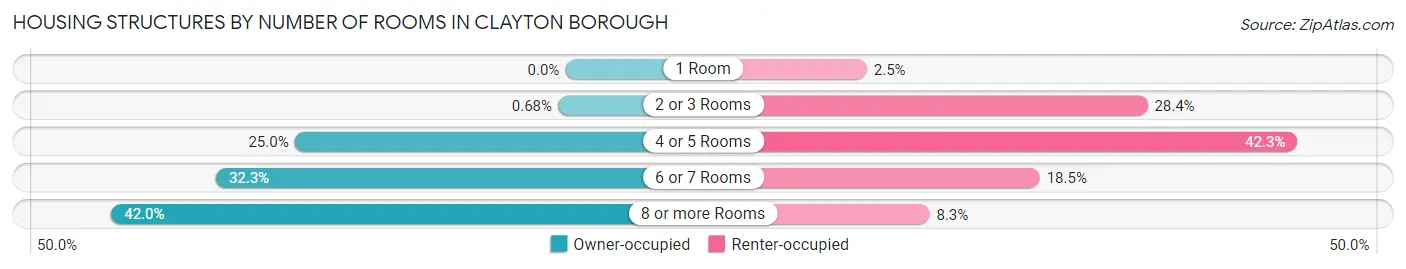
| Number of Rooms | Owner-occupied | Renter-occupied |
| 1 Room | 0 (0.0%) | 21 (2.5%) |
| 2 or 3 Rooms | 16 (0.7%) | 240 (28.4%) |
| 4 or 5 Rooms | 587 (25.0%) | 357 (42.3%) |
| 6 or 7 Rooms | 757 (32.3%) | 156 (18.5%) |
| 8 or more Rooms | 984 (42.0%) | 70 (8.3%) |
| Total | 2,344 (100.0%) | 844 (100.0%) |
Housing Structure by Heating Type in Clayton borough
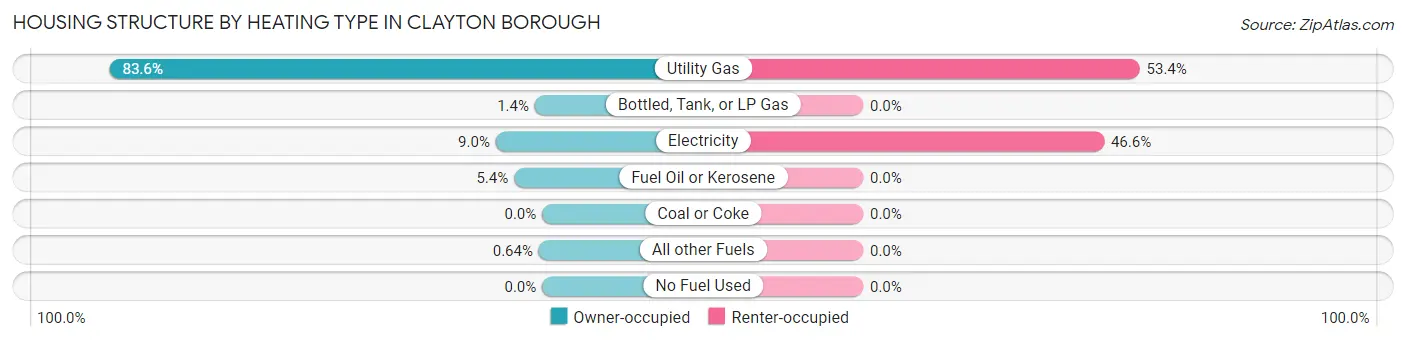
| Heating Type | Owner-occupied | Renter-occupied |
| Utility Gas | 1,959 (83.6%) | 451 (53.4%) |
| Bottled, Tank, or LP Gas | 33 (1.4%) | 0 (0.0%) |
| Electricity | 210 (9.0%) | 393 (46.6%) |
| Fuel Oil or Kerosene | 127 (5.4%) | 0 (0.0%) |
| Coal or Coke | 0 (0.0%) | 0 (0.0%) |
| All other Fuels | 15 (0.6%) | 0 (0.0%) |
| No Fuel Used | 0 (0.0%) | 0 (0.0%) |
| Total | 2,344 (100.0%) | 844 (100.0%) |
Household Vehicle Usage in Clayton borough
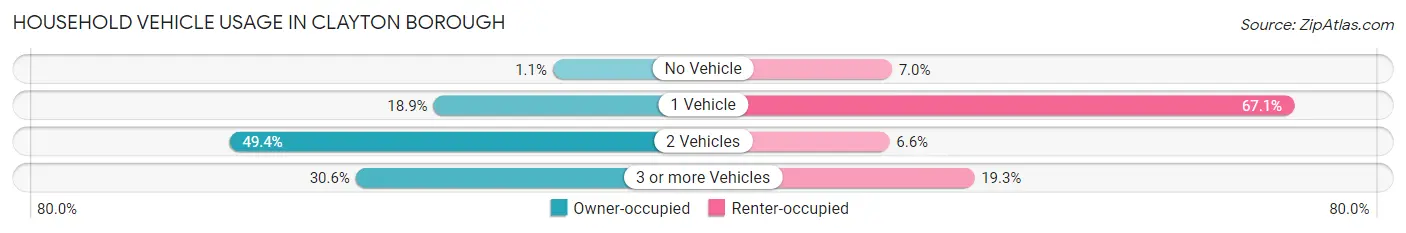
| Vehicles per Household | Owner-occupied | Renter-occupied |
| No Vehicle | 26 (1.1%) | 59 (7.0%) |
| 1 Vehicle | 444 (18.9%) | 566 (67.1%) |
| 2 Vehicles | 1,158 (49.4%) | 56 (6.6%) |
| 3 or more Vehicles | 716 (30.5%) | 163 (19.3%) |
| Total | 2,344 (100.0%) | 844 (100.0%) |
Real Estate & Mortgages in Clayton borough
Real Estate and Mortgage Overview in Clayton borough
| Characteristic | Without Mortgage | With Mortgage |
| Housing Units | 510 | 1,834 |
| Median Property Value | $192,200 | $251,900 |
| Median Household Income | $62,750 | $422 |
| Monthly Housing Costs | $922 | $197 |
| Real Estate Taxes | $5,874 | $47 |
Property Value by Mortgage Status in Clayton borough
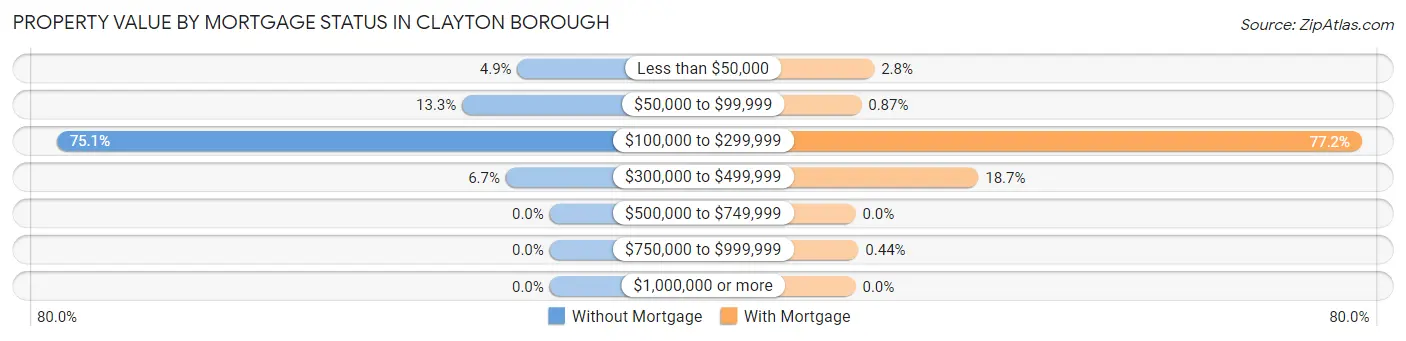
| Property Value | Without Mortgage | With Mortgage |
| Less than $50,000 | 25 (4.9%) | 52 (2.8%) |
| $50,000 to $99,999 | 68 (13.3%) | 16 (0.9%) |
| $100,000 to $299,999 | 383 (75.1%) | 1,415 (77.1%) |
| $300,000 to $499,999 | 34 (6.7%) | 343 (18.7%) |
| $500,000 to $749,999 | 0 (0.0%) | 0 (0.0%) |
| $750,000 to $999,999 | 0 (0.0%) | 8 (0.4%) |
| $1,000,000 or more | 0 (0.0%) | 0 (0.0%) |
| Total | 510 (100.0%) | 1,834 (100.0%) |
Household Income by Mortgage Status in Clayton borough
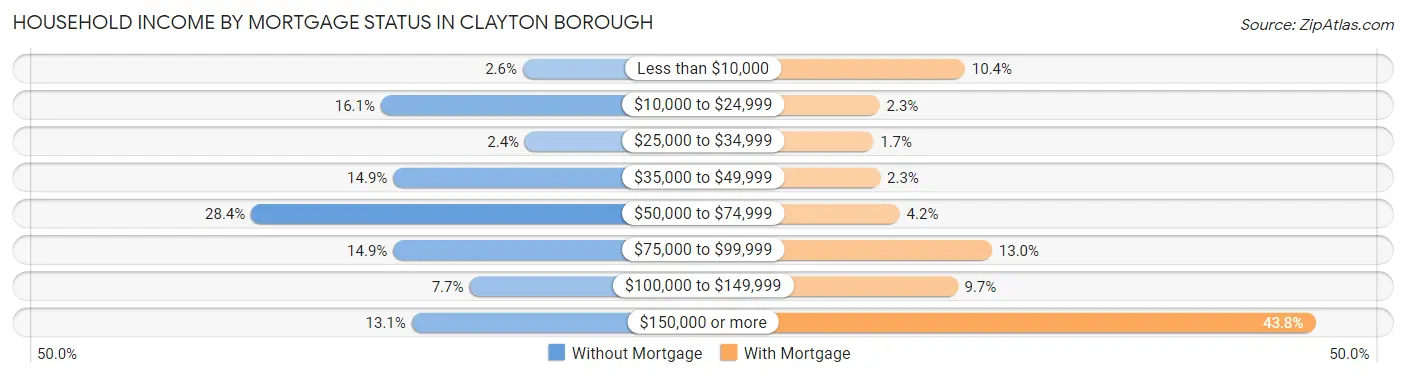
| Household Income | Without Mortgage | With Mortgage |
| Less than $10,000 | 13 (2.5%) | 191 (10.4%) |
| $10,000 to $24,999 | 82 (16.1%) | 42 (2.3%) |
| $25,000 to $34,999 | 12 (2.4%) | 31 (1.7%) |
| $35,000 to $49,999 | 76 (14.9%) | 43 (2.3%) |
| $50,000 to $74,999 | 145 (28.4%) | 77 (4.2%) |
| $75,000 to $99,999 | 76 (14.9%) | 238 (13.0%) |
| $100,000 to $149,999 | 39 (7.6%) | 178 (9.7%) |
| $150,000 or more | 67 (13.1%) | 803 (43.8%) |
| Total | 510 (100.0%) | 1,834 (100.0%) |
Property Value to Household Income Ratio in Clayton borough
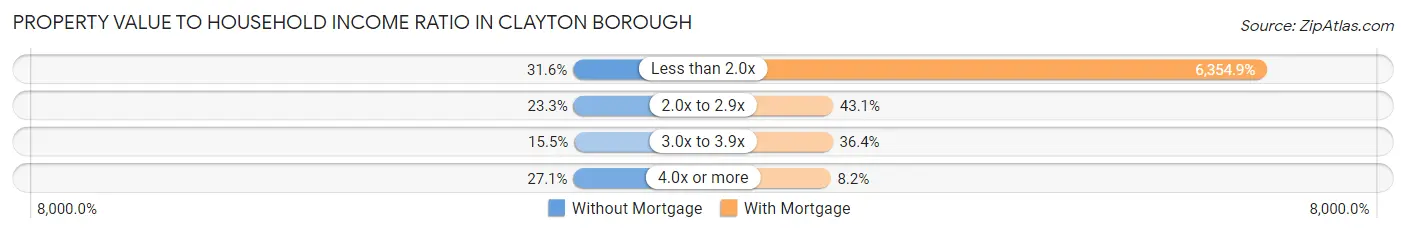
| Value-to-Income Ratio | Without Mortgage | With Mortgage |
| Less than 2.0x | 161 (31.6%) | 116,549 (6,354.9%) |
| 2.0x to 2.9x | 119 (23.3%) | 790 (43.1%) |
| 3.0x to 3.9x | 79 (15.5%) | 667 (36.4%) |
| 4.0x or more | 138 (27.1%) | 150 (8.2%) |
| Total | 510 (100.0%) | 1,834 (100.0%) |
Real Estate Taxes by Mortgage Status in Clayton borough
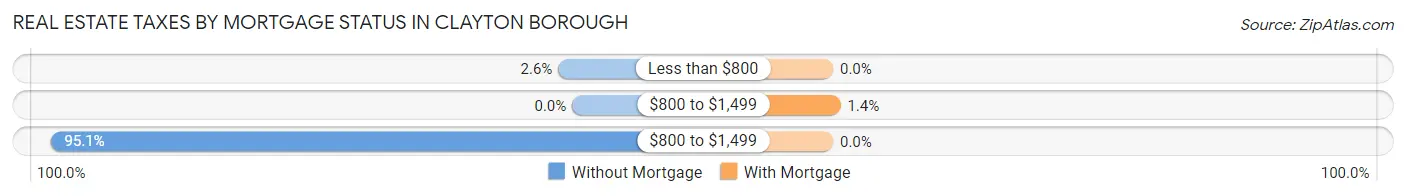
| Property Taxes | Without Mortgage | With Mortgage |
| Less than $800 | 13 (2.5%) | 0 (0.0%) |
| $800 to $1,499 | 0 (0.0%) | 25 (1.4%) |
| $800 to $1,499 | 485 (95.1%) | 0 (0.0%) |
| Total | 510 (100.0%) | 1,834 (100.0%) |
Health & Disability in Clayton borough
Health Insurance Coverage by Age in Clayton borough
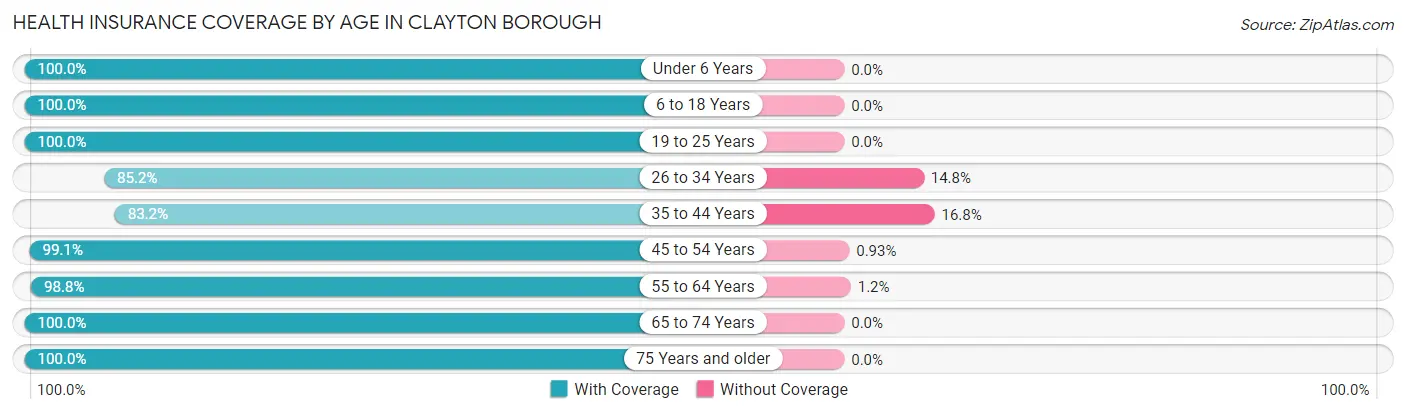
| Age Bracket | With Coverage | Without Coverage |
| Under 6 Years | 570 (100.0%) | 0 (0.0%) |
| 6 to 18 Years | 1,396 (100.0%) | 0 (0.0%) |
| 19 to 25 Years | 697 (100.0%) | 0 (0.0%) |
| 26 to 34 Years | 1,022 (85.2%) | 178 (14.8%) |
| 35 to 44 Years | 835 (83.2%) | 169 (16.8%) |
| 45 to 54 Years | 960 (99.1%) | 9 (0.9%) |
| 55 to 64 Years | 1,146 (98.8%) | 14 (1.2%) |
| 65 to 74 Years | 1,268 (100.0%) | 0 (0.0%) |
| 75 Years and older | 513 (100.0%) | 0 (0.0%) |
| Total | 8,407 (95.8%) | 370 (4.2%) |
Health Insurance Coverage by Citizenship Status in Clayton borough
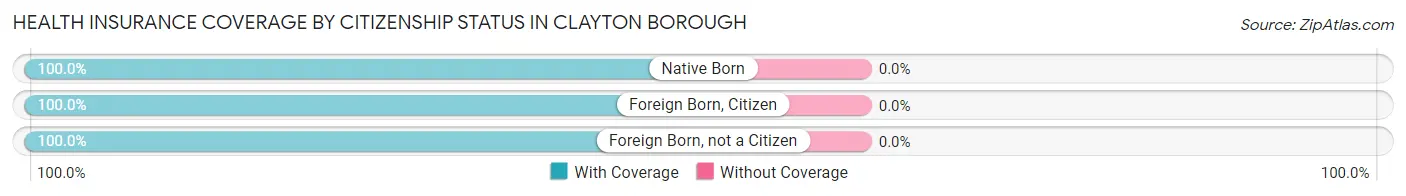
| Citizenship Status | With Coverage | Without Coverage |
| Native Born | 570 (100.0%) | 0 (0.0%) |
| Foreign Born, Citizen | 1,396 (100.0%) | 0 (0.0%) |
| Foreign Born, not a Citizen | 697 (100.0%) | 0 (0.0%) |
Health Insurance Coverage by Household Income in Clayton borough
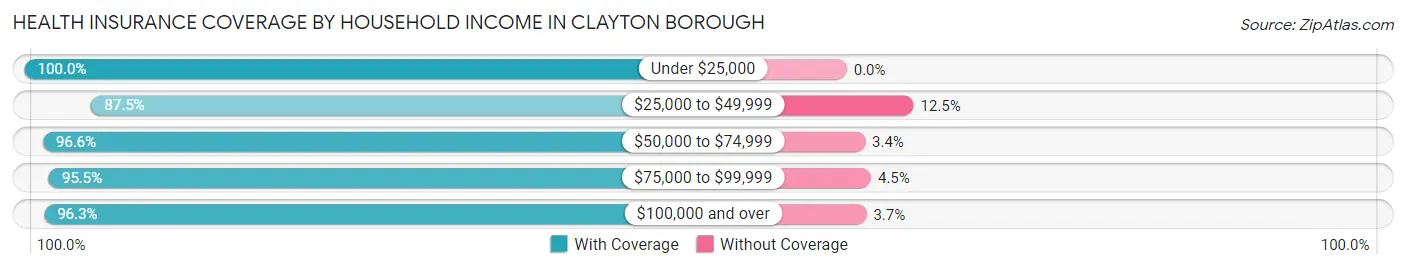
| Household Income | With Coverage | Without Coverage |
| Under $25,000 | 556 (100.0%) | 0 (0.0%) |
| $25,000 to $49,999 | 636 (87.5%) | 91 (12.5%) |
| $50,000 to $74,999 | 1,381 (96.6%) | 49 (3.4%) |
| $75,000 to $99,999 | 778 (95.5%) | 37 (4.5%) |
| $100,000 and over | 5,055 (96.3%) | 193 (3.7%) |
Public vs Private Health Insurance Coverage by Age in Clayton borough
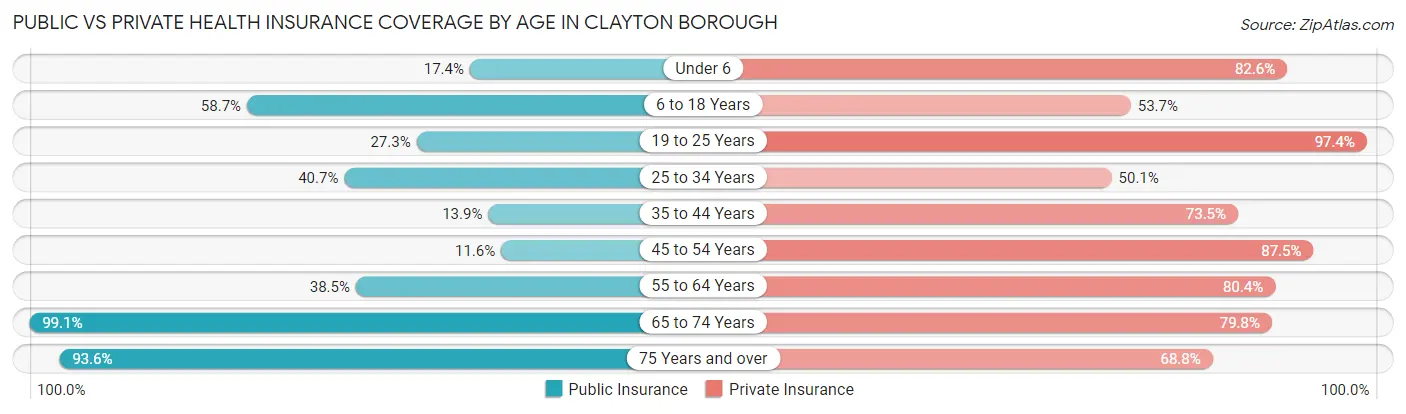
| Age Bracket | Public Insurance | Private Insurance |
| Under 6 | 99 (17.4%) | 471 (82.6%) |
| 6 to 18 Years | 820 (58.7%) | 749 (53.6%) |
| 19 to 25 Years | 190 (27.3%) | 679 (97.4%) |
| 25 to 34 Years | 488 (40.7%) | 601 (50.1%) |
| 35 to 44 Years | 140 (13.9%) | 738 (73.5%) |
| 45 to 54 Years | 112 (11.6%) | 848 (87.5%) |
| 55 to 64 Years | 447 (38.5%) | 933 (80.4%) |
| 65 to 74 Years | 1,257 (99.1%) | 1,012 (79.8%) |
| 75 Years and over | 480 (93.6%) | 353 (68.8%) |
| Total | 4,033 (46.0%) | 6,384 (72.7%) |
Disability Status by Sex by Age in Clayton borough
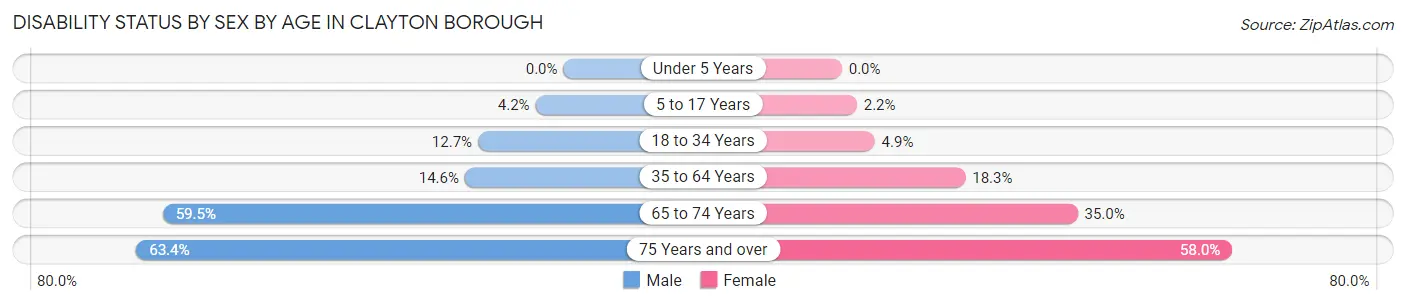
| Age Bracket | Male | Female |
| Under 5 Years | 0 (0.0%) | 0 (0.0%) |
| 5 to 17 Years | 35 (4.2%) | 18 (2.2%) |
| 18 to 34 Years | 127 (12.7%) | 45 (4.9%) |
| 35 to 64 Years | 207 (14.6%) | 315 (18.3%) |
| 65 to 74 Years | 326 (59.5%) | 252 (35.0%) |
| 75 Years and over | 182 (63.4%) | 131 (58.0%) |
Disability Class by Sex by Age in Clayton borough
Disability Class: Hearing Difficulty
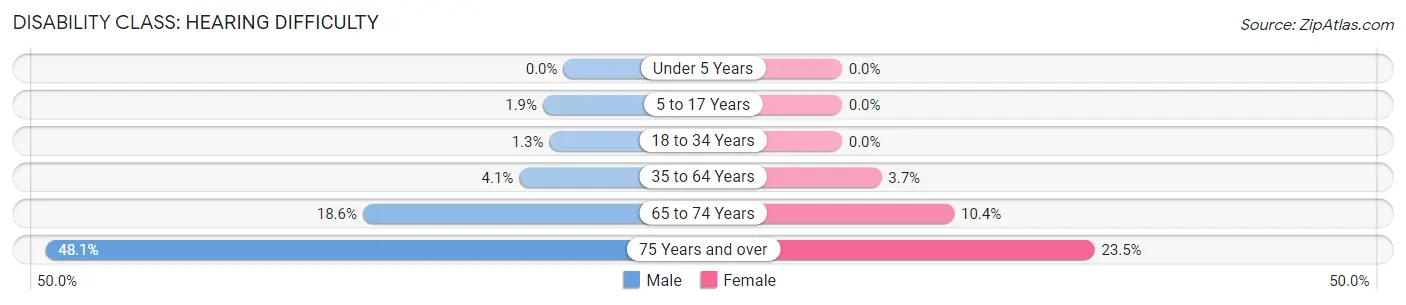
| Age Bracket | Male | Female |
| Under 5 Years | 0 (0.0%) | 0 (0.0%) |
| 5 to 17 Years | 16 (1.9%) | 0 (0.0%) |
| 18 to 34 Years | 13 (1.3%) | 0 (0.0%) |
| 35 to 64 Years | 58 (4.1%) | 63 (3.7%) |
| 65 to 74 Years | 102 (18.6%) | 75 (10.4%) |
| 75 Years and over | 138 (48.1%) | 53 (23.4%) |
Disability Class: Vision Difficulty
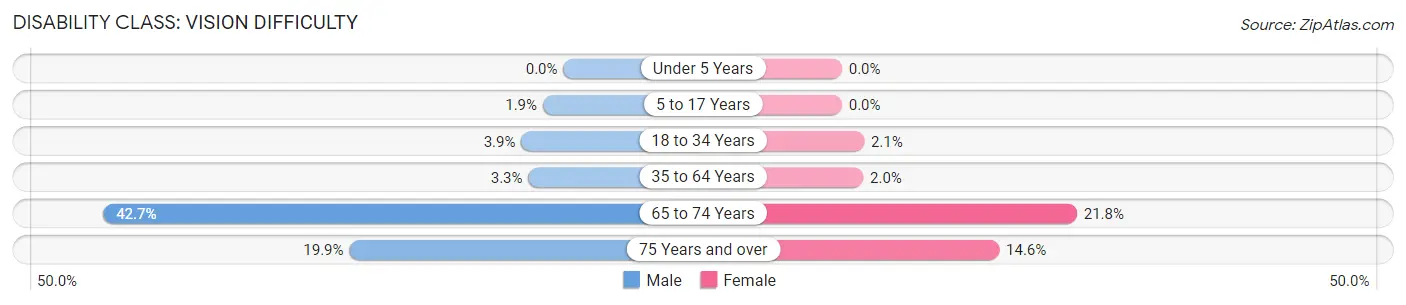
| Age Bracket | Male | Female |
| Under 5 Years | 0 (0.0%) | 0 (0.0%) |
| 5 to 17 Years | 16 (1.9%) | 0 (0.0%) |
| 18 to 34 Years | 39 (3.9%) | 19 (2.1%) |
| 35 to 64 Years | 46 (3.3%) | 34 (2.0%) |
| 65 to 74 Years | 234 (42.7%) | 157 (21.8%) |
| 75 Years and over | 57 (19.9%) | 33 (14.6%) |
Disability Class: Cognitive Difficulty
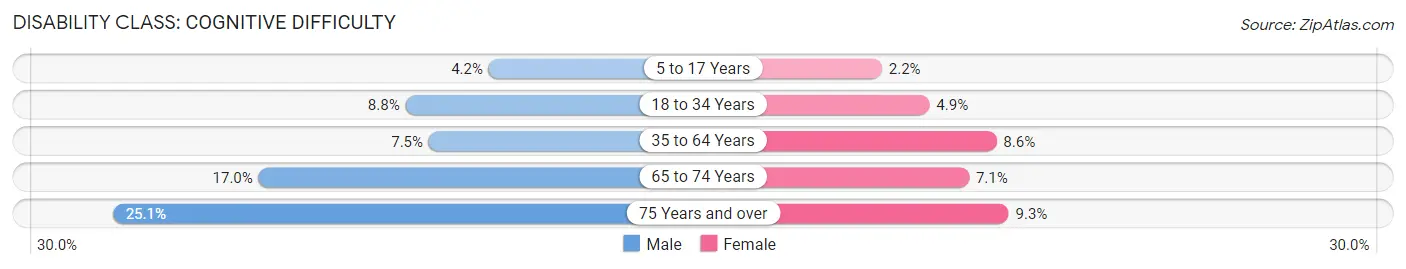
| Age Bracket | Male | Female |
| 5 to 17 Years | 35 (4.2%) | 18 (2.2%) |
| 18 to 34 Years | 88 (8.8%) | 45 (4.9%) |
| 35 to 64 Years | 106 (7.5%) | 148 (8.6%) |
| 65 to 74 Years | 93 (17.0%) | 51 (7.1%) |
| 75 Years and over | 72 (25.1%) | 21 (9.3%) |
Disability Class: Ambulatory Difficulty
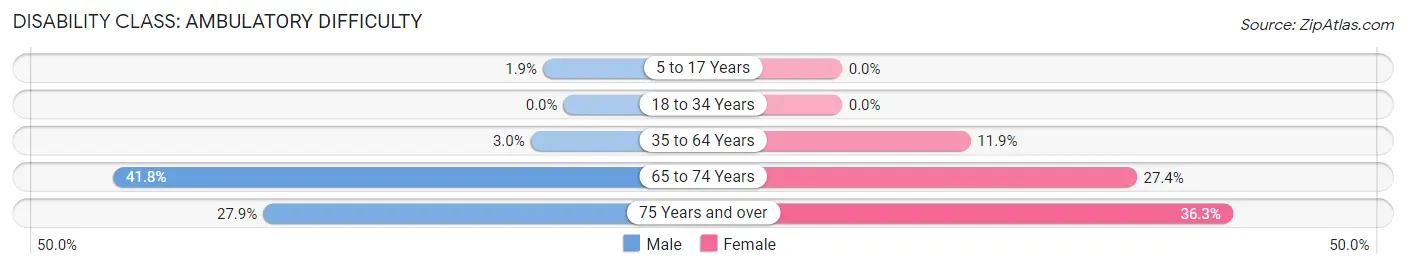
| Age Bracket | Male | Female |
| 5 to 17 Years | 16 (1.9%) | 0 (0.0%) |
| 18 to 34 Years | 0 (0.0%) | 0 (0.0%) |
| 35 to 64 Years | 43 (3.0%) | 205 (11.9%) |
| 65 to 74 Years | 229 (41.8%) | 197 (27.4%) |
| 75 Years and over | 80 (27.9%) | 82 (36.3%) |
Disability Class: Self-Care Difficulty
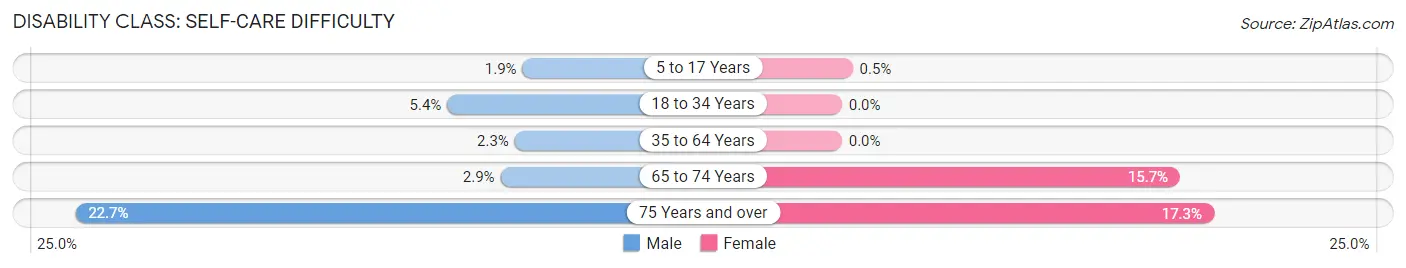
| Age Bracket | Male | Female |
| 5 to 17 Years | 16 (1.9%) | 4 (0.5%) |
| 18 to 34 Years | 54 (5.4%) | 0 (0.0%) |
| 35 to 64 Years | 32 (2.3%) | 0 (0.0%) |
| 65 to 74 Years | 16 (2.9%) | 113 (15.7%) |
| 75 Years and over | 65 (22.7%) | 39 (17.3%) |
Technology Access in Clayton borough
Computing Device Access in Clayton borough
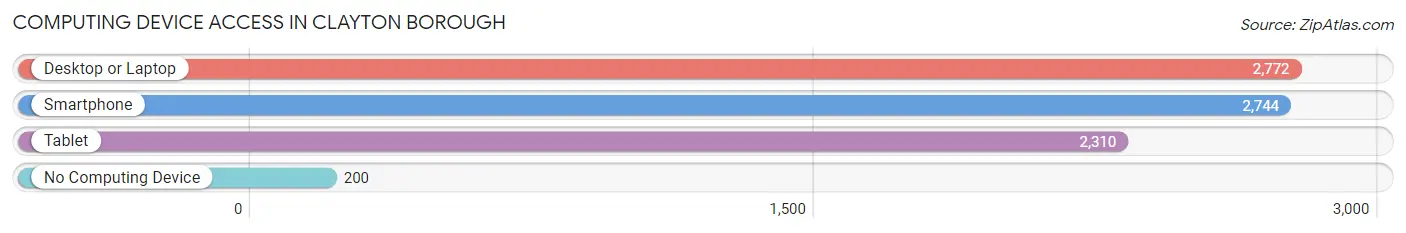
| Device Type | # Households | % Households |
| Desktop or Laptop | 2,772 | 87.0% |
| Smartphone | 2,744 | 86.1% |
| Tablet | 2,310 | 72.5% |
| No Computing Device | 200 | 6.3% |
| Total | 3,188 | 100.0% |
Internet Access in Clayton borough
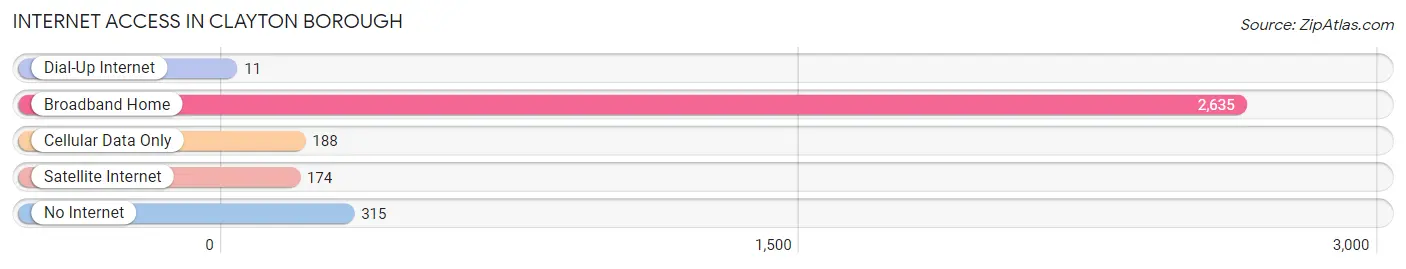
| Internet Type | # Households | % Households |
| Dial-Up Internet | 11 | 0.4% |
| Broadband Home | 2,635 | 82.7% |
| Cellular Data Only | 188 | 5.9% |
| Satellite Internet | 174 | 5.5% |
| No Internet | 315 | 9.9% |
| Total | 3,188 | 100.0% |
Clayton borough Summary
Clayton Borough is a small borough located in Gloucester County, New Jersey. It is situated in the Delaware Valley region of the state, and is part of the Philadelphia metropolitan area. The borough was incorporated in 1858 and is home to a population of 8,625 people, according to the 2010 United States Census.
History
Clayton Borough was originally part of Clayton Township, which was established in 1844. The township was named after John M. Clayton, a prominent lawyer and politician from Delaware. In 1858, the borough was incorporated from a portion of the township. The borough was named after the Clayton family, who had a large presence in the area.
The borough was primarily a farming community until the early 20th century, when it began to experience rapid growth due to its proximity to Philadelphia. The borough was home to several factories, including a glass factory, a paper mill, and a brickyard. The borough also had a thriving business district, which included several stores, restaurants, and a movie theater.
Geography
Clayton Borough is located in the Delaware Valley region of New Jersey. It is situated in the southwestern corner of Gloucester County, and is bordered by the boroughs of Glassboro and Pitman to the north, and the townships of Franklin and Monroe to the east and south, respectively. The borough is located approximately 15 miles southeast of Philadelphia.
The borough has a total area of 1.3 square miles, all of which is land. The borough is located in the Atlantic Coastal Plain, and is characterized by flat terrain. The borough is home to several parks, including Clayton Park, which features a playground, basketball courts, and a walking path.
Economy
Clayton Borough has a diverse economy, with a mix of manufacturing, retail, and service-based businesses. The borough is home to several factories, including a glass factory, a paper mill, and a brickyard. The borough also has a thriving business district, which includes several stores, restaurants, and a movie theater.
The borough is also home to several educational institutions, including Gloucester County College and Rowan University. The borough is also home to several healthcare facilities, including Kennedy University Hospital and Inspira Health Network.
Demographics
According to the 2010 United States Census, Clayton Borough had a population of 8,625 people. The racial makeup of the borough was 79.2% White, 11.7% African American, 0.3% Native American, 2.2% Asian, 0.1% Pacific Islander, 4.2% from other races, and 2.5% from two or more races. Hispanic or Latino of any race were 8.7% of the population.
The median household income in Clayton Borough was $60,945, and the median family income was $71,917. The per capita income was $27,945. About 6.2% of families and 8.3% of the population were below the poverty line, including 10.2% of those under age 18 and 6.2% of those age 65 or over.
Common Questions
What is Per Capita Income in Clayton borough?
Per Capita income in Clayton borough is $37,530.
What is the Median Family Income in Clayton borough?
Median Family Income in Clayton borough is $107,929.
What is the Median Household income in Clayton borough?
Median Household Income in Clayton borough is $91,711.
What is Income or Wage Gap in Clayton borough?
Income or Wage Gap in Clayton borough is 32.4%.
Women in Clayton borough earn 67.6 cents for every dollar earned by a man.
What is Inequality or Gini Index in Clayton borough?
Inequality or Gini Index in Clayton borough is 0.38.
What is the Total Population of Clayton borough?
Total Population of Clayton borough is 8,801.
What is the Total Male Population of Clayton borough?
Total Male Population of Clayton borough is 4,236.
What is the Total Female Population of Clayton borough?
Total Female Population of Clayton borough is 4,565.
What is the Ratio of Males per 100 Females in Clayton borough?
There are 92.79 Males per 100 Females in Clayton borough.
What is the Ratio of Females per 100 Males in Clayton borough?
There are 107.77 Females per 100 Males in Clayton borough.
What is the Median Population Age in Clayton borough?
Median Population Age in Clayton borough is 39.9 Years.
What is the Average Family Size in Clayton borough
Average Family Size in Clayton borough is 3.2 People.
What is the Average Household Size in Clayton borough
Average Household Size in Clayton borough is 2.8 People.
How Large is the Labor Force in Clayton borough?
There are 4,495 People in the Labor Forcein in Clayton borough.
What is the Percentage of People in the Labor Force in Clayton borough?
63.8% of People are in the Labor Force in Clayton borough.
What is the Unemployment Rate in Clayton borough?
Unemployment Rate in Clayton borough is 8.2%.