Little Ferry borough, NJ Map & Demographics
Little Ferry borough Overview
$42,435
PER CAPITA INCOME
$89,495
AVG FAMILY INCOME
$72,722
AVG HOUSEHOLD INCOME
25.7%
WAGE / INCOME GAP [ % ]
74.3¢/ $1
WAGE / INCOME GAP [ $ ]
0.46
INEQUALITY / GINI INDEX
10,954
TOTAL POPULATION
5,446
MALE POPULATION
5,508
FEMALE POPULATION
98.87
MALES / 100 FEMALES
101.14
FEMALES / 100 MALES
44.3
MEDIAN AGE
3.1
AVG FAMILY SIZE
2.5
AVG HOUSEHOLD SIZE
6,678
LABOR FORCE [ PEOPLE ]
70.3%
PERCENT IN LABOR FORCE
8.3%
UNEMPLOYMENT RATE
Income in Little Ferry borough
Income Overview in Little Ferry borough
Per Capita Income in Little Ferry borough is $42,435, while median incomes of families and households are $89,495 and $72,722 respectively.
| Characteristic | Number | Measure |
| Per Capita Income | 10,954 | $42,435 |
| Median Family Income | 2,930 | $89,495 |
| Mean Family Income | 2,930 | $119,336 |
| Median Household Income | 4,334 | $72,722 |
| Mean Household Income | 4,334 | $107,026 |
| Income Deficit | 2,930 | $0 |
| Wage / Income Gap (%) | 10,954 | 25.68% |
| Wage / Income Gap ($) | 10,954 | 74.32¢ per $1 |
| Gini / Inequality Index | 10,954 | 0.46 |
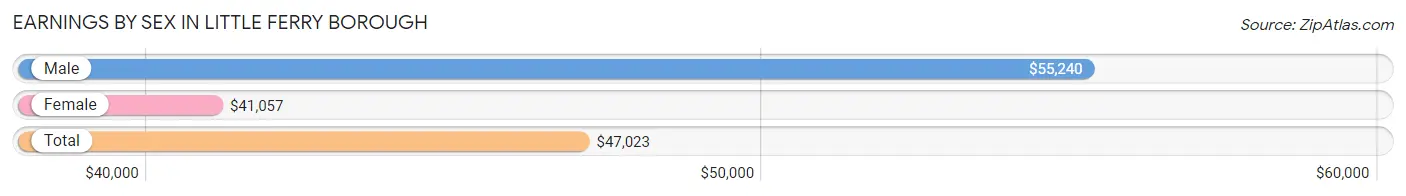
Earnings by Sex in Little Ferry borough
Average Earnings in Little Ferry borough are $47,023, $55,240 for men and $41,057 for women, a difference of 25.7%.
| Sex | Number | Average Earnings |
| Male | 3,395 (50.5%) | $55,240 |
| Female | 3,322 (49.5%) | $41,057 |
| Total | 6,717 (100.0%) | $47,023 |
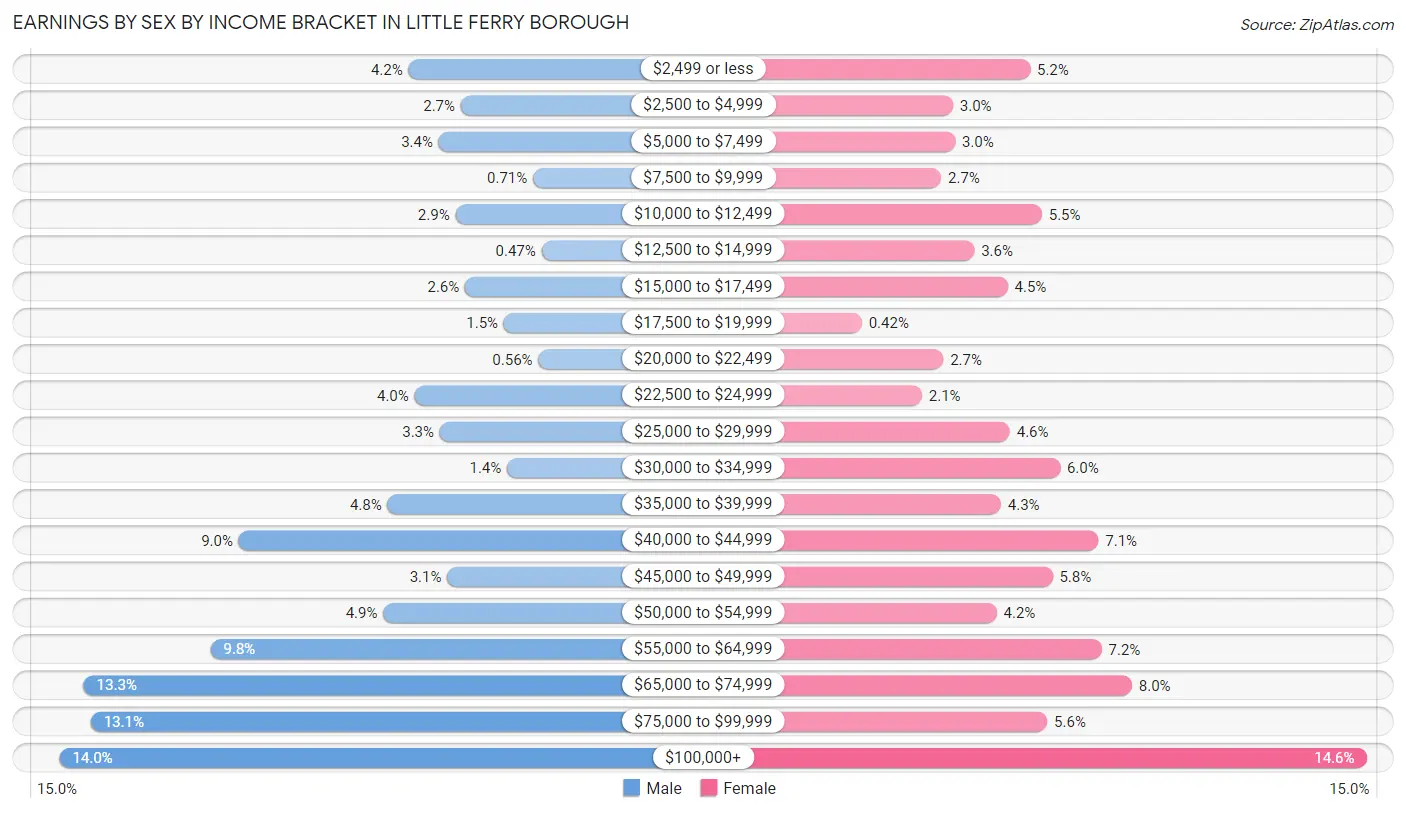
Earnings by Sex by Income Bracket in Little Ferry borough
The most common earnings brackets in Little Ferry borough are $100,000+ for men (476 | 14.0%) and $100,000+ for women (485 | 14.6%).
| Income | Male | Female |
| $2,499 or less | 143 (4.2%) | 171 (5.1%) |
| $2,500 to $4,999 | 93 (2.7%) | 99 (3.0%) |
| $5,000 to $7,499 | 114 (3.4%) | 101 (3.0%) |
| $7,500 to $9,999 | 24 (0.7%) | 88 (2.6%) |
| $10,000 to $12,499 | 98 (2.9%) | 182 (5.5%) |
| $12,500 to $14,999 | 16 (0.5%) | 119 (3.6%) |
| $15,000 to $17,499 | 89 (2.6%) | 150 (4.5%) |
| $17,500 to $19,999 | 52 (1.5%) | 14 (0.4%) |
| $20,000 to $22,499 | 19 (0.6%) | 90 (2.7%) |
| $22,500 to $24,999 | 137 (4.0%) | 70 (2.1%) |
| $25,000 to $29,999 | 113 (3.3%) | 152 (4.6%) |
| $30,000 to $34,999 | 49 (1.4%) | 199 (6.0%) |
| $35,000 to $39,999 | 163 (4.8%) | 144 (4.3%) |
| $40,000 to $44,999 | 305 (9.0%) | 235 (7.1%) |
| $45,000 to $49,999 | 106 (3.1%) | 192 (5.8%) |
| $50,000 to $54,999 | 167 (4.9%) | 140 (4.2%) |
| $55,000 to $64,999 | 332 (9.8%) | 238 (7.2%) |
| $65,000 to $74,999 | 453 (13.3%) | 266 (8.0%) |
| $75,000 to $99,999 | 446 (13.1%) | 187 (5.6%) |
| $100,000+ | 476 (14.0%) | 485 (14.6%) |
| Total | 3,395 (100.0%) | 3,322 (100.0%) |
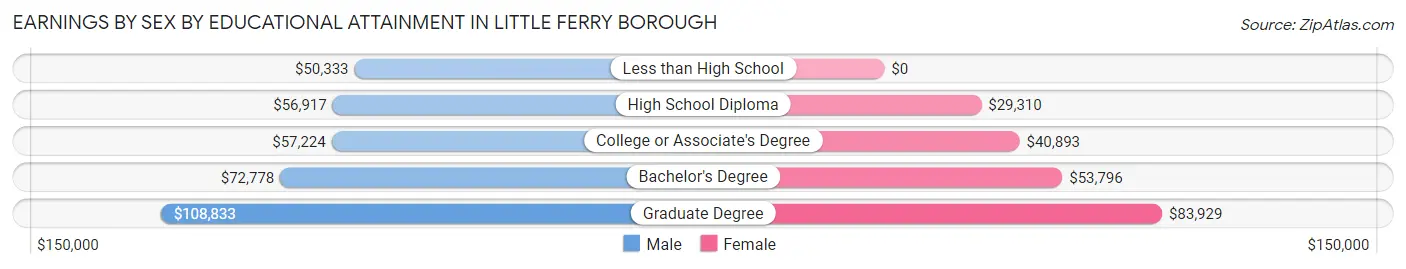
Earnings by Sex by Educational Attainment in Little Ferry borough
Average earnings in Little Ferry borough are $59,719 for men and $44,512 for women, a difference of 25.5%. Men with an educational attainment of graduate degree enjoy the highest average annual earnings of $108,833, while those with less than high school education earn the least with $50,333. Women with an educational attainment of graduate degree earn the most with the average annual earnings of $83,929, while those with high school diploma education have the smallest earnings of $29,310.
| Educational Attainment | Male Income | Female Income |
| Less than High School | $50,333 | $0 |
| High School Diploma | $56,917 | $29,310 |
| College or Associate's Degree | $57,224 | $40,893 |
| Bachelor's Degree | $72,778 | $53,796 |
| Graduate Degree | $108,833 | $83,929 |
| Total | $59,719 | $44,512 |
Family Income in Little Ferry borough
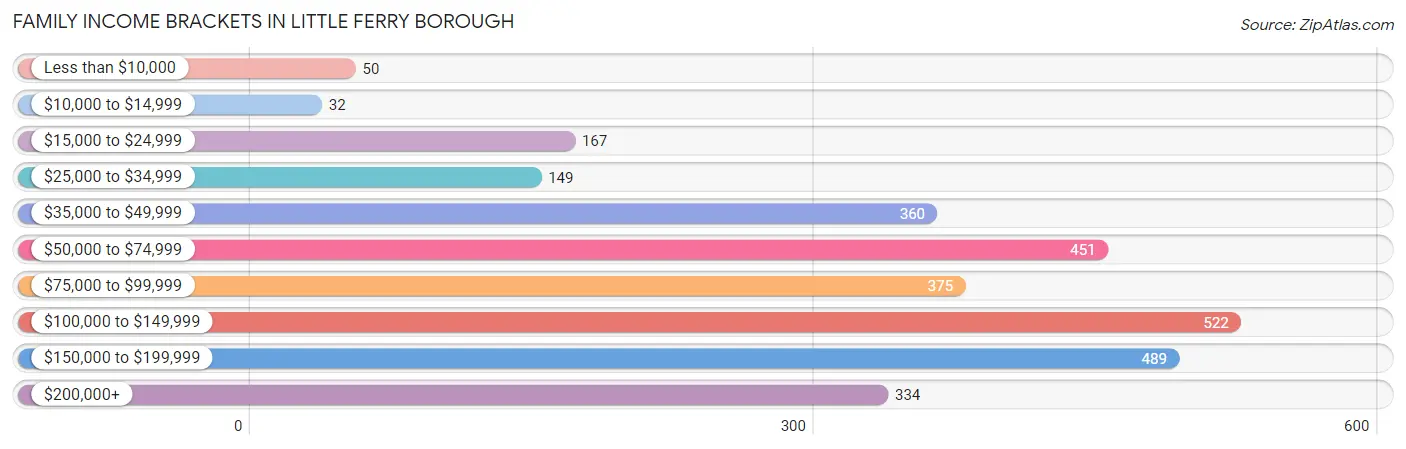
Family Income Brackets in Little Ferry borough
According to the Little Ferry borough family income data, there are 522 families falling into the $100,000 to $149,999 income range, which is the most common income bracket and makes up 17.8% of all families. Conversely, the $10,000 to $14,999 income bracket is the least frequent group with only 32 families (1.1%) belonging to this category.
| Income Bracket | # Families | % Families |
| Less than $10,000 | 50 | 1.7% |
| $10,000 to $14,999 | 32 | 1.1% |
| $15,000 to $24,999 | 167 | 5.7% |
| $25,000 to $34,999 | 149 | 5.1% |
| $35,000 to $49,999 | 360 | 12.3% |
| $50,000 to $74,999 | 451 | 15.4% |
| $75,000 to $99,999 | 375 | 12.8% |
| $100,000 to $149,999 | 522 | 17.8% |
| $150,000 to $199,999 | 489 | 16.7% |
| $200,000+ | 334 | 11.4% |
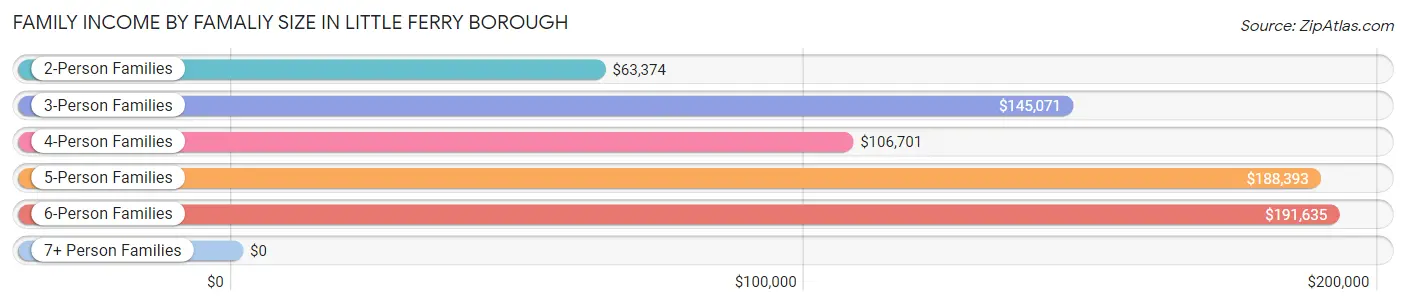
Family Income by Famaliy Size in Little Ferry borough
6-person families (108 | 3.7%) account for the highest median family income in Little Ferry borough with $191,635 per family, while 3-person families (538 | 18.4%) have the highest median income of $48,357 per family member.
| Income Bracket | # Families | Median Income |
| 2-Person Families | 1,361 (46.5%) | $63,374 |
| 3-Person Families | 538 (18.4%) | $145,071 |
| 4-Person Families | 575 (19.6%) | $106,701 |
| 5-Person Families | 325 (11.1%) | $188,393 |
| 6-Person Families | 108 (3.7%) | $191,635 |
| 7+ Person Families | 23 (0.8%) | $0 |
| Total | 2,930 (100.0%) | $89,495 |
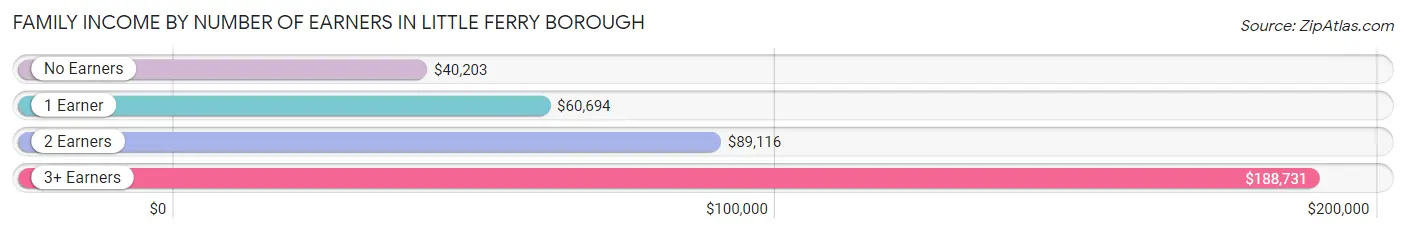
Family Income by Number of Earners in Little Ferry borough
The median family income in Little Ferry borough is $89,495, with families comprising 3+ earners (669) having the highest median family income of $188,731, while families with no earners (151) have the lowest median family income of $40,203, accounting for 22.8% and 5.1% of families, respectively.
| Number of Earners | # Families | Median Income |
| No Earners | 151 (5.1%) | $40,203 |
| 1 Earner | 762 (26.0%) | $60,694 |
| 2 Earners | 1,348 (46.0%) | $89,116 |
| 3+ Earners | 669 (22.8%) | $188,731 |
| Total | 2,930 (100.0%) | $89,495 |
Household Income in Little Ferry borough
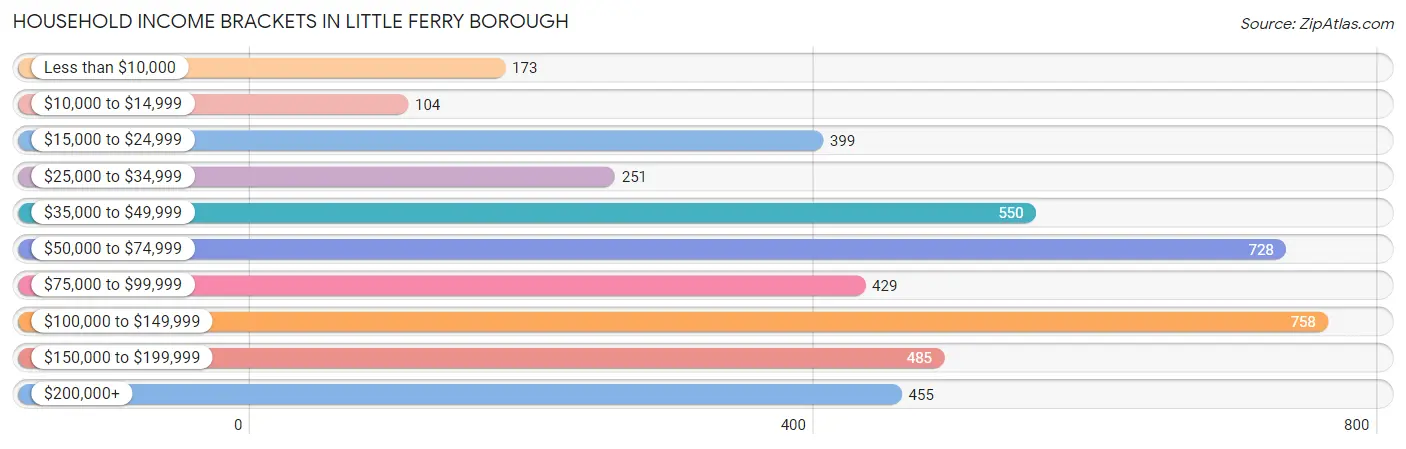
Household Income Brackets in Little Ferry borough
With 758 households falling in the category, the $100,000 to $149,999 income range is the most frequent in Little Ferry borough, accounting for 17.5% of all households. In contrast, only 104 households (2.4%) fall into the $10,000 to $14,999 income bracket, making it the least populous group.
| Income Bracket | # Households | % Households |
| Less than $10,000 | 173 | 4.0% |
| $10,000 to $14,999 | 104 | 2.4% |
| $15,000 to $24,999 | 399 | 9.2% |
| $25,000 to $34,999 | 251 | 5.8% |
| $35,000 to $49,999 | 550 | 12.7% |
| $50,000 to $74,999 | 728 | 16.8% |
| $75,000 to $99,999 | 429 | 9.9% |
| $100,000 to $149,999 | 758 | 17.5% |
| $150,000 to $199,999 | 485 | 11.2% |
| $200,000+ | 455 | 10.5% |
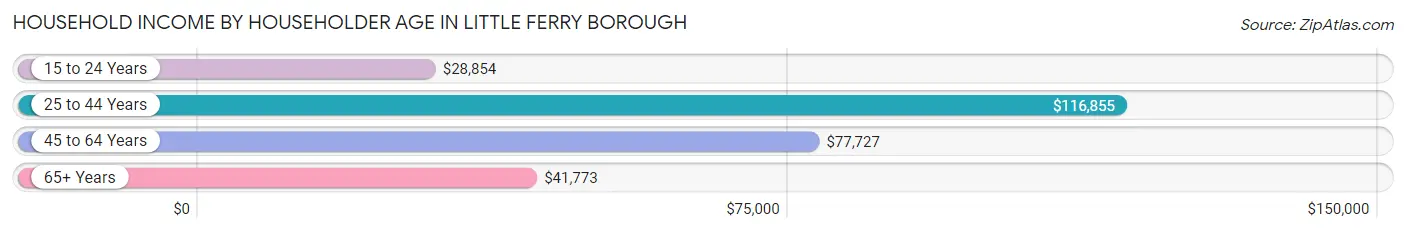
Household Income by Householder Age in Little Ferry borough
The median household income in Little Ferry borough is $72,722, with the highest median household income of $116,855 found in the 25 to 44 years age bracket for the primary householder. A total of 1,342 households (31.0%) fall into this category. Meanwhile, the 15 to 24 years age bracket for the primary householder has the lowest median household income of $28,854, with 31 households (0.7%) in this group.
| Income Bracket | # Households | Median Income |
| 15 to 24 Years | 31 (0.7%) | $28,854 |
| 25 to 44 Years | 1,342 (31.0%) | $116,855 |
| 45 to 64 Years | 1,902 (43.9%) | $77,727 |
| 65+ Years | 1,059 (24.4%) | $41,773 |
| Total | 4,334 (100.0%) | $72,722 |
Poverty in Little Ferry borough
Income Below Poverty by Sex and Age in Little Ferry borough
With 9.4% poverty level for males and 8.6% for females among the residents of Little Ferry borough, 5 year old males and 75 year old and over females are the most vulnerable to poverty, with 31 males (53.4%) and 88 females (20.1%) in their respective age groups living below the poverty level.
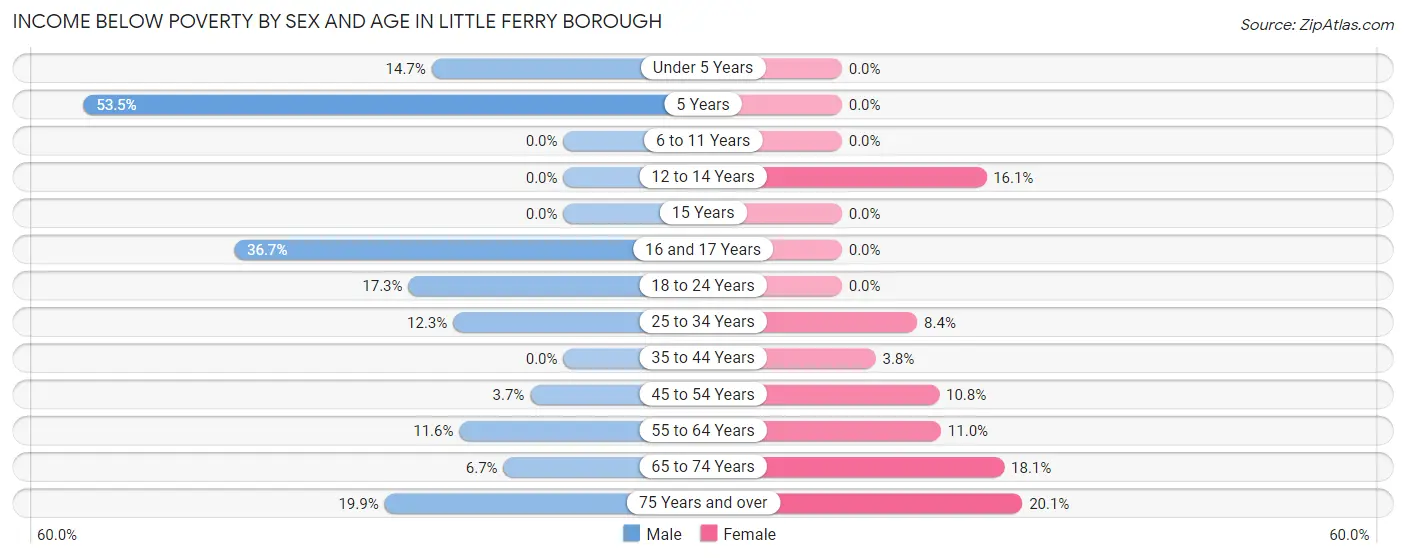
| Age Bracket | Male | Female |
| Under 5 Years | 44 (14.7%) | 0 (0.0%) |
| 5 Years | 31 (53.4%) | 0 (0.0%) |
| 6 to 11 Years | 0 (0.0%) | 0 (0.0%) |
| 12 to 14 Years | 0 (0.0%) | 23 (16.1%) |
| 15 Years | 0 (0.0%) | 0 (0.0%) |
| 16 and 17 Years | 33 (36.7%) | 0 (0.0%) |
| 18 to 24 Years | 111 (17.3%) | 0 (0.0%) |
| 25 to 34 Years | 78 (12.3%) | 50 (8.4%) |
| 35 to 44 Years | 0 (0.0%) | 31 (3.8%) |
| 45 to 54 Years | 32 (3.7%) | 76 (10.8%) |
| 55 to 64 Years | 83 (11.6%) | 127 (11.0%) |
| 65 to 74 Years | 50 (6.7%) | 77 (18.1%) |
| 75 Years and over | 49 (19.9%) | 88 (20.1%) |
| Total | 511 (9.4%) | 472 (8.6%) |
Income Above Poverty by Sex and Age in Little Ferry borough
According to the poverty statistics in Little Ferry borough, males aged 6 to 11 years and females aged under 5 years are the age groups that are most secure financially, with 100.0% of males and 100.0% of females in these age groups living above the poverty line.
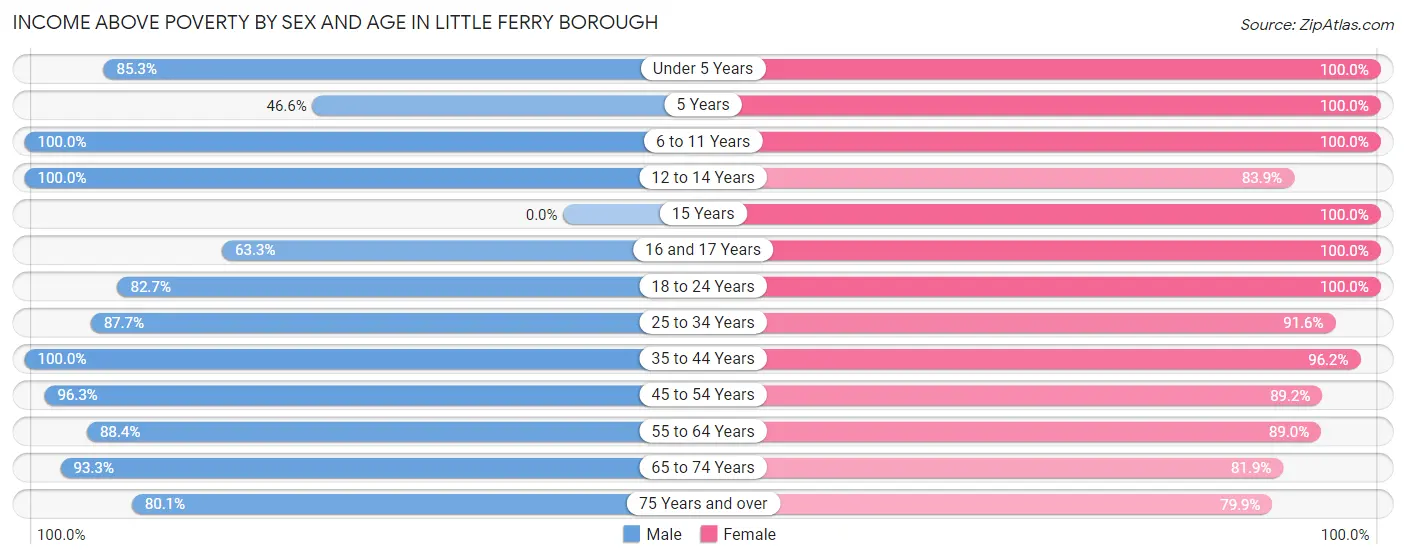
| Age Bracket | Male | Female |
| Under 5 Years | 256 (85.3%) | 218 (100.0%) |
| 5 Years | 27 (46.6%) | 37 (100.0%) |
| 6 to 11 Years | 205 (100.0%) | 331 (100.0%) |
| 12 to 14 Years | 138 (100.0%) | 120 (83.9%) |
| 15 Years | 0 (0.0%) | 24 (100.0%) |
| 16 and 17 Years | 57 (63.3%) | 159 (100.0%) |
| 18 to 24 Years | 532 (82.7%) | 460 (100.0%) |
| 25 to 34 Years | 557 (87.7%) | 546 (91.6%) |
| 35 to 44 Years | 797 (100.0%) | 793 (96.2%) |
| 45 to 54 Years | 836 (96.3%) | 626 (89.2%) |
| 55 to 64 Years | 633 (88.4%) | 1,023 (89.0%) |
| 65 to 74 Years | 700 (93.3%) | 349 (81.9%) |
| 75 Years and over | 197 (80.1%) | 350 (79.9%) |
| Total | 4,935 (90.6%) | 5,036 (91.4%) |
Income Below Poverty Among Married-Couple Families in Little Ferry borough
The poverty statistics for married-couple families in Little Ferry borough show that 6.9% or 158 of the total 2,294 families live below the poverty line. Families with no children have the highest poverty rate of 8.0%, comprising of 116 families. On the other hand, families with 3 or 4 children have the lowest poverty rate of 0.0%, which includes 0 families.
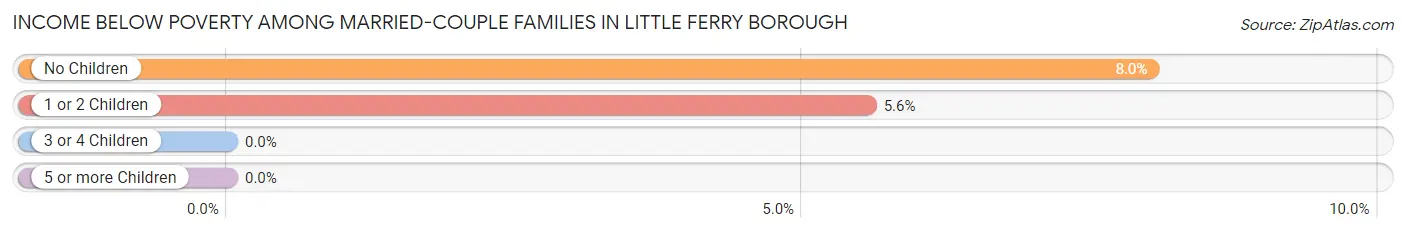
| Children | Above Poverty | Below Poverty |
| No Children | 1,331 (92.0%) | 116 (8.0%) |
| 1 or 2 Children | 714 (94.4%) | 42 (5.6%) |
| 3 or 4 Children | 91 (100.0%) | 0 (0.0%) |
| 5 or more Children | 0 (0.0%) | 0 (0.0%) |
| Total | 2,136 (93.1%) | 158 (6.9%) |
Income Below Poverty Among Single-Parent Households in Little Ferry borough
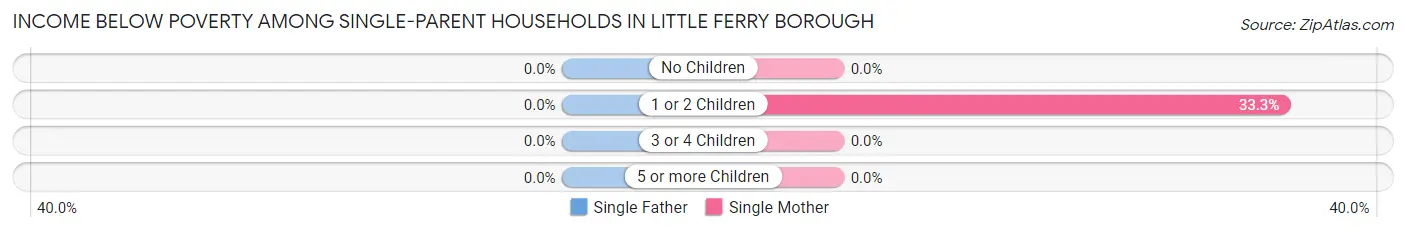
| Children | Single Father | Single Mother |
| No Children | 0 (0.0%) | 0 (0.0%) |
| 1 or 2 Children | 0 (0.0%) | 50 (33.3%) |
| 3 or 4 Children | 0 (0.0%) | 0 (0.0%) |
| 5 or more Children | 0 (0.0%) | 0 (0.0%) |
| Total | 0 (0.0%) | 50 (9.3%) |
Income Below Poverty Among Married-Couple vs Single-Parent Households in Little Ferry borough
The poverty data for Little Ferry borough shows that 158 of the married-couple family households (6.9%) and 50 of the single-parent households (7.9%) are living below the poverty level. Within the married-couple family households, those with no children have the highest poverty rate, with 116 households (8.0%) falling below the poverty line. Among the single-parent households, those with 1 or 2 children have the highest poverty rate, with 50 household (22.8%) living below poverty.
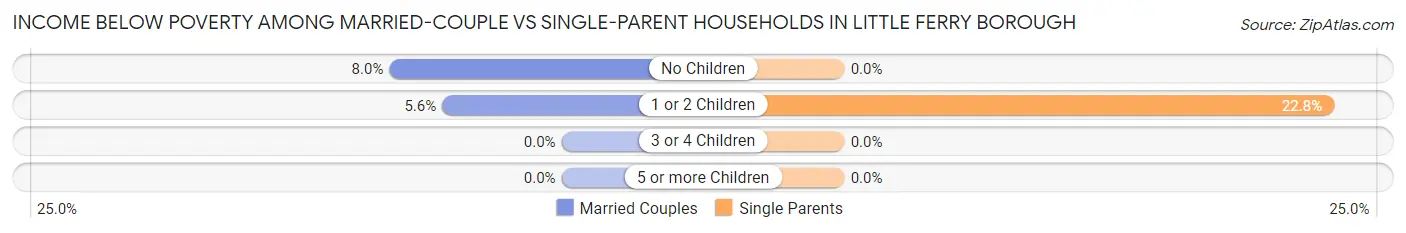
| Children | Married-Couple Families | Single-Parent Households |
| No Children | 116 (8.0%) | 0 (0.0%) |
| 1 or 2 Children | 42 (5.6%) | 50 (22.8%) |
| 3 or 4 Children | 0 (0.0%) | 0 (0.0%) |
| 5 or more Children | 0 (0.0%) | 0 (0.0%) |
| Total | 158 (6.9%) | 50 (7.9%) |
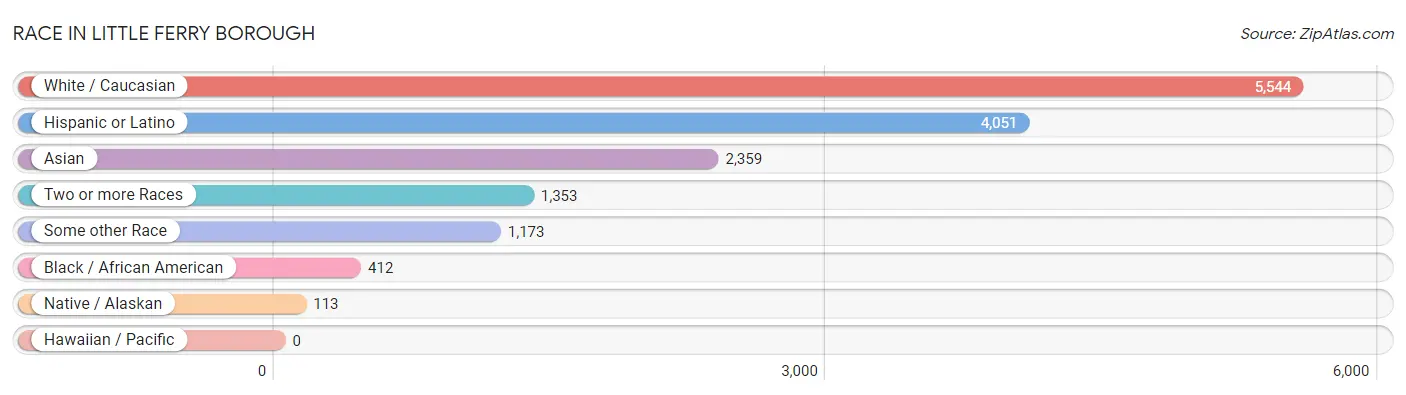
Race in Little Ferry borough
The most populous races in Little Ferry borough are White / Caucasian (5,544 | 50.6%), Hispanic or Latino (4,051 | 37.0%), and Asian (2,359 | 21.5%).
| Race | # Population | % Population |
| Asian | 2,359 | 21.5% |
| Black / African American | 412 | 3.8% |
| Hawaiian / Pacific | 0 | 0.0% |
| Hispanic or Latino | 4,051 | 37.0% |
| Native / Alaskan | 113 | 1.0% |
| White / Caucasian | 5,544 | 50.6% |
| Two or more Races | 1,353 | 12.3% |
| Some other Race | 1,173 | 10.7% |
| Total | 10,954 | 100.0% |
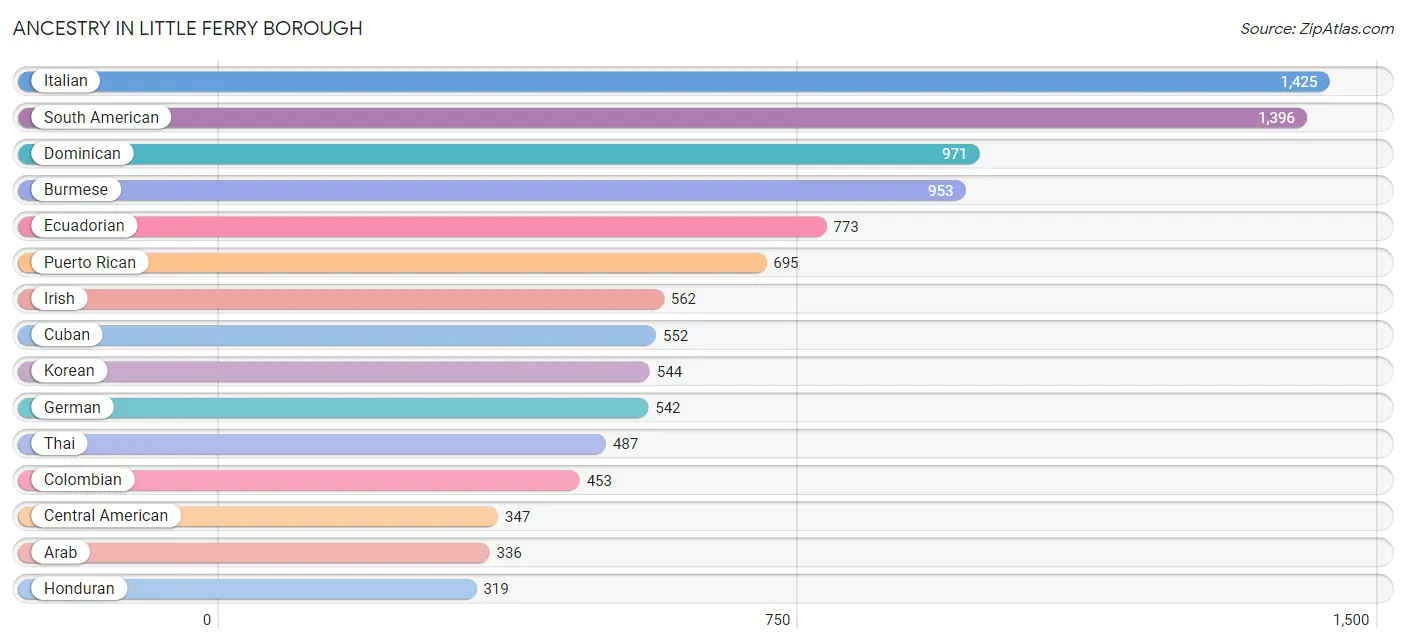
Ancestry in Little Ferry borough
The most populous ancestries reported in Little Ferry borough are Italian (1,425 | 13.0%), South American (1,396 | 12.7%), Dominican (971 | 8.9%), Burmese (953 | 8.7%), and Ecuadorian (773 | 7.1%), together accounting for 50.4% of all Little Ferry borough residents.
| Ancestry | # Population | % Population |
| Albanian | 212 | 1.9% |
| American | 116 | 1.1% |
| Arab | 336 | 3.1% |
| Argentinean | 83 | 0.8% |
| Austrian | 142 | 1.3% |
| Bhutanese | 282 | 2.6% |
| Brazilian | 21 | 0.2% |
| British | 9 | 0.1% |
| Burmese | 953 | 8.7% |
| Central American | 347 | 3.2% |
| Cherokee | 3 | 0.0% |
| Chilean | 10 | 0.1% |
| Colombian | 453 | 4.1% |
| Cuban | 552 | 5.0% |
| Czech | 24 | 0.2% |
| Czechoslovakian | 10 | 0.1% |
| Danish | 22 | 0.2% |
| Dominican | 971 | 8.9% |
| Dutch | 70 | 0.6% |
| Ecuadorian | 773 | 7.1% |
| Egyptian | 285 | 2.6% |
| English | 174 | 1.6% |
| European | 9 | 0.1% |
| Finnish | 12 | 0.1% |
| French | 135 | 1.2% |
| French Canadian | 27 | 0.3% |
| German | 542 | 5.0% |
| Greek | 112 | 1.0% |
| Honduran | 319 | 2.9% |
| Hungarian | 14 | 0.1% |
| Indian (Asian) | 102 | 0.9% |
| Irish | 562 | 5.1% |
| Italian | 1,425 | 13.0% |
| Jordanian | 25 | 0.2% |
| Korean | 544 | 5.0% |
| Mexican | 22 | 0.2% |
| Nigerian | 1 | 0.0% |
| Palestinian | 26 | 0.2% |
| Peruvian | 77 | 0.7% |
| Polish | 255 | 2.3% |
| Portuguese | 94 | 0.9% |
| Puerto Rican | 695 | 6.3% |
| Russian | 48 | 0.4% |
| Salvadoran | 28 | 0.3% |
| Scotch-Irish | 41 | 0.4% |
| Scottish | 14 | 0.1% |
| South American | 1,396 | 12.7% |
| South American Indian | 110 | 1.0% |
| Sri Lankan | 54 | 0.5% |
| Subsaharan African | 1 | 0.0% |
| Swedish | 9 | 0.1% |
| Swiss | 25 | 0.2% |
| Thai | 487 | 4.4% |
| Turkish | 168 | 1.5% | View All 54 Rows |
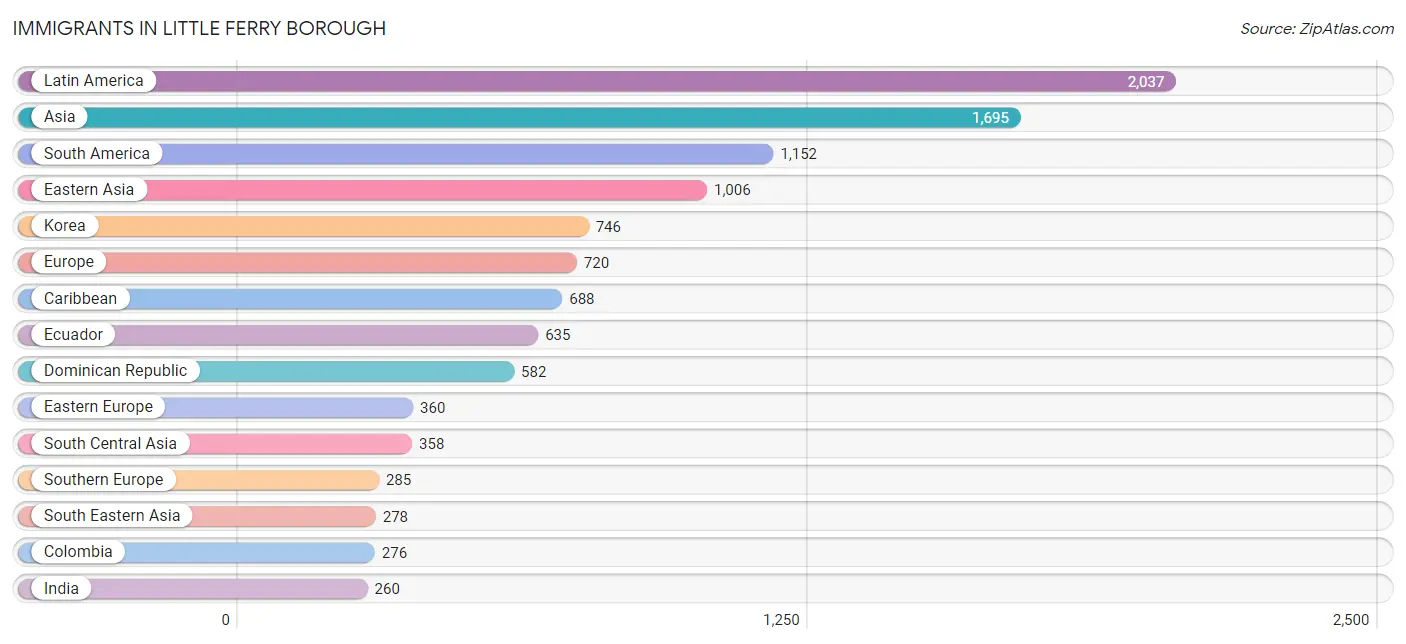
Immigrants in Little Ferry borough
The most numerous immigrant groups reported in Little Ferry borough came from Latin America (2,037 | 18.6%), Asia (1,695 | 15.5%), South America (1,152 | 10.5%), Eastern Asia (1,006 | 9.2%), and Korea (746 | 6.8%), together accounting for 60.6% of all Little Ferry borough residents.
| Immigration Origin | # Population | % Population |
| Africa | 166 | 1.5% |
| Albania | 165 | 1.5% |
| Argentina | 56 | 0.5% |
| Asia | 1,695 | 15.5% |
| Belarus | 95 | 0.9% |
| Brazil | 43 | 0.4% |
| Caribbean | 688 | 6.3% |
| Central America | 197 | 1.8% |
| Chile | 10 | 0.1% |
| China | 110 | 1.0% |
| Colombia | 276 | 2.5% |
| Cuba | 106 | 1.0% |
| Denmark | 22 | 0.2% |
| Dominican Republic | 582 | 5.3% |
| Eastern Asia | 1,006 | 9.2% |
| Eastern Europe | 360 | 3.3% |
| Ecuador | 635 | 5.8% |
| Egypt | 165 | 1.5% |
| El Salvador | 37 | 0.3% |
| Europe | 720 | 6.6% |
| France | 41 | 0.4% |
| Germany | 12 | 0.1% |
| Greece | 63 | 0.6% |
| Honduras | 160 | 1.5% |
| Hong Kong | 10 | 0.1% |
| Hungary | 10 | 0.1% |
| India | 260 | 2.4% |
| Italy | 222 | 2.0% |
| Japan | 150 | 1.4% |
| Jordan | 25 | 0.2% |
| Korea | 746 | 6.8% |
| Latin America | 2,037 | 18.6% |
| Nepal | 27 | 0.3% |
| Nigeria | 1 | 0.0% |
| Northern Africa | 165 | 1.5% |
| Northern Europe | 22 | 0.2% |
| Pakistan | 41 | 0.4% |
| Peru | 117 | 1.1% |
| Philippines | 228 | 2.1% |
| Poland | 76 | 0.7% |
| South America | 1,152 | 10.5% |
| South Central Asia | 358 | 3.3% |
| South Eastern Asia | 278 | 2.5% |
| Southern Europe | 285 | 2.6% |
| Turkey | 28 | 0.3% |
| Uruguay | 15 | 0.1% |
| Vietnam | 50 | 0.5% |
| Western Africa | 1 | 0.0% |
| Western Asia | 53 | 0.5% |
| Western Europe | 53 | 0.5% | View All 50 Rows |
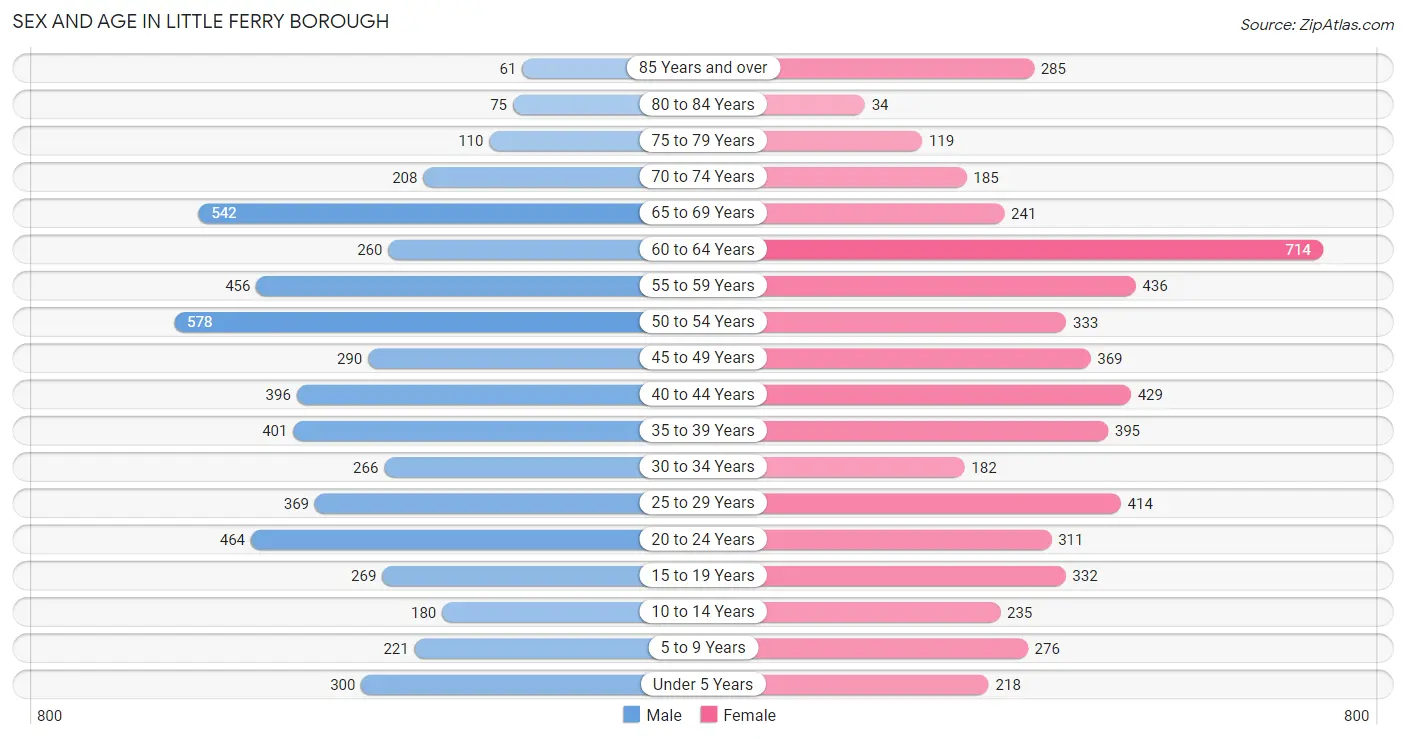
Sex and Age in Little Ferry borough
Sex and Age in Little Ferry borough
The most populous age groups in Little Ferry borough are 50 to 54 Years (578 | 10.6%) for men and 60 to 64 Years (714 | 13.0%) for women.
| Age Bracket | Male | Female |
| Under 5 Years | 300 (5.5%) | 218 (4.0%) |
| 5 to 9 Years | 221 (4.1%) | 276 (5.0%) |
| 10 to 14 Years | 180 (3.3%) | 235 (4.3%) |
| 15 to 19 Years | 269 (4.9%) | 332 (6.0%) |
| 20 to 24 Years | 464 (8.5%) | 311 (5.7%) |
| 25 to 29 Years | 369 (6.8%) | 414 (7.5%) |
| 30 to 34 Years | 266 (4.9%) | 182 (3.3%) |
| 35 to 39 Years | 401 (7.4%) | 395 (7.2%) |
| 40 to 44 Years | 396 (7.3%) | 429 (7.8%) |
| 45 to 49 Years | 290 (5.3%) | 369 (6.7%) |
| 50 to 54 Years | 578 (10.6%) | 333 (6.0%) |
| 55 to 59 Years | 456 (8.4%) | 436 (7.9%) |
| 60 to 64 Years | 260 (4.8%) | 714 (13.0%) |
| 65 to 69 Years | 542 (10.0%) | 241 (4.4%) |
| 70 to 74 Years | 208 (3.8%) | 185 (3.4%) |
| 75 to 79 Years | 110 (2.0%) | 119 (2.2%) |
| 80 to 84 Years | 75 (1.4%) | 34 (0.6%) |
| 85 Years and over | 61 (1.1%) | 285 (5.2%) |
| Total | 5,446 (100.0%) | 5,508 (100.0%) |
Families and Households in Little Ferry borough
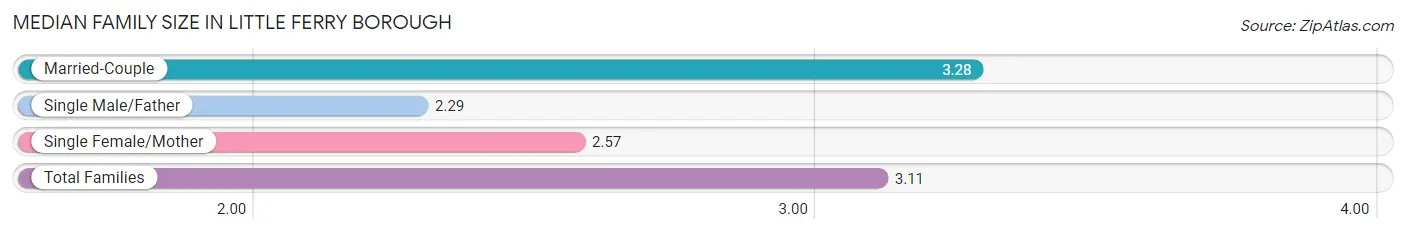
Median Family Size in Little Ferry borough
The median family size in Little Ferry borough is 3.11 persons per family, with married-couple families (2,294 | 78.3%) accounting for the largest median family size of 3.28 persons per family. On the other hand, single male/father families (98 | 3.3%) represent the smallest median family size with 2.29 persons per family.
| Family Type | # Families | Family Size |
| Married-Couple | 2,294 (78.3%) | 3.28 |
| Single Male/Father | 98 (3.3%) | 2.29 |
| Single Female/Mother | 538 (18.4%) | 2.57 |
| Total Families | 2,930 (100.0%) | 3.11 |
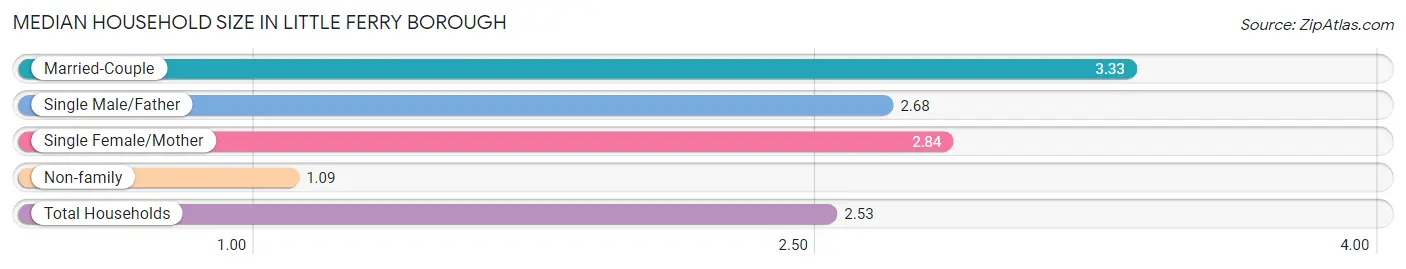
Median Household Size in Little Ferry borough
The median household size in Little Ferry borough is 2.53 persons per household, with married-couple households (2,294 | 52.9%) accounting for the largest median household size of 3.33 persons per household. non-family households (1,404 | 32.4%) represent the smallest median household size with 1.09 persons per household.
| Household Type | # Households | Household Size |
| Married-Couple | 2,294 (52.9%) | 3.33 |
| Single Male/Father | 98 (2.3%) | 2.68 |
| Single Female/Mother | 538 (12.4%) | 2.84 |
| Non-family | 1,404 (32.4%) | 1.09 |
| Total Households | 4,334 (100.0%) | 2.53 |
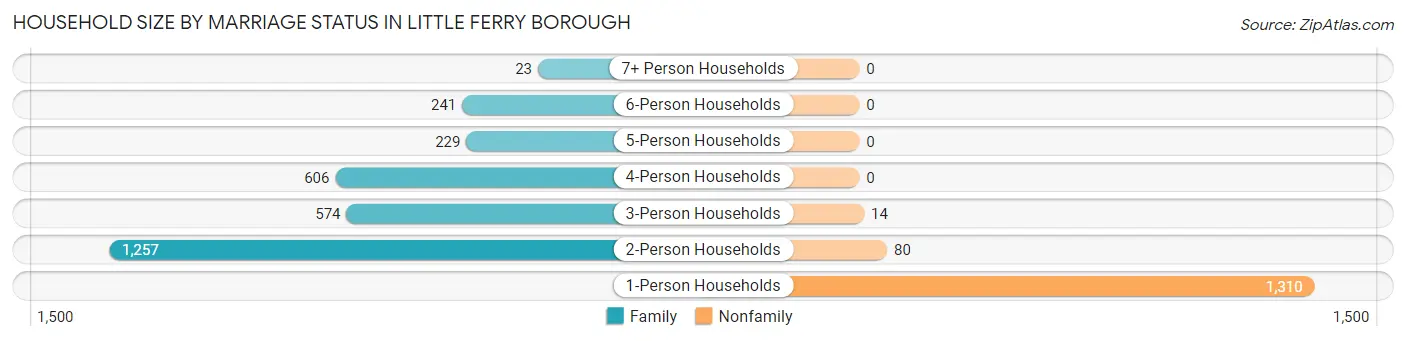
Household Size by Marriage Status in Little Ferry borough
Out of a total of 4,334 households in Little Ferry borough, 2,930 (67.6%) are family households, while 1,404 (32.4%) are nonfamily households. The most numerous type of family households are 2-person households, comprising 1,257, and the most common type of nonfamily households are 1-person households, comprising 1,310.
| Household Size | Family Households | Nonfamily Households |
| 1-Person Households | - | 1,310 (30.2%) |
| 2-Person Households | 1,257 (29.0%) | 80 (1.8%) |
| 3-Person Households | 574 (13.2%) | 14 (0.3%) |
| 4-Person Households | 606 (14.0%) | 0 (0.0%) |
| 5-Person Households | 229 (5.3%) | 0 (0.0%) |
| 6-Person Households | 241 (5.6%) | 0 (0.0%) |
| 7+ Person Households | 23 (0.5%) | 0 (0.0%) |
| Total | 2,930 (67.6%) | 1,404 (32.4%) |
Female Fertility in Little Ferry borough
Fertility by Age in Little Ferry borough
Average fertility rate in Little Ferry borough is 36.0 births per 1,000 women. Women in the age bracket of 20 to 34 years have the highest fertility rate with 74.0 births per 1,000 women. Women in the age bracket of 20 to 34 years acount for 75.3% of all women with births.
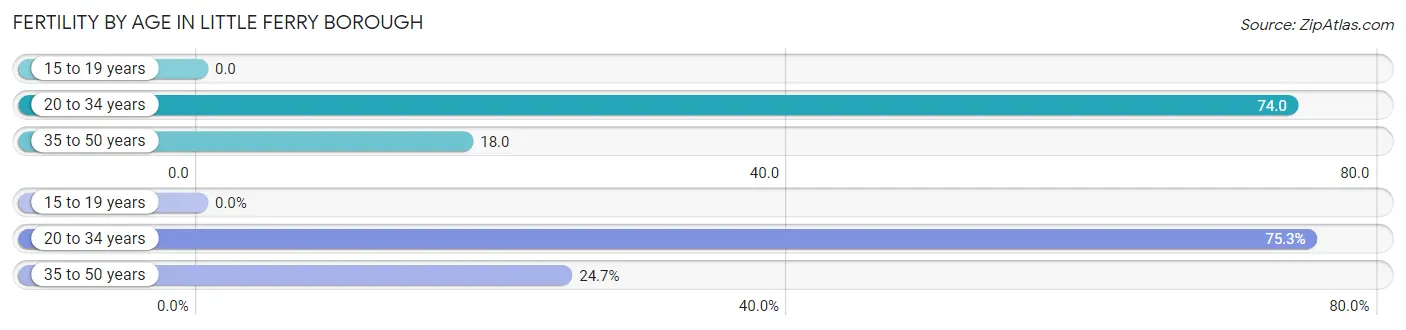
| Age Bracket | Women with Births | Births / 1,000 Women |
| 15 to 19 years | 0 (0.0%) | 0.0 |
| 20 to 34 years | 67 (75.3%) | 74.0 |
| 35 to 50 years | 22 (24.7%) | 18.0 |
| Total | 89 (100.0%) | 36.0 |
Fertility by Age by Marriage Status in Little Ferry borough
98.9% of women with births (89) in Little Ferry borough are married. The highest percentage of unmarried women with births falls into 35 to 50 years age bracket with 4.5% of them unmarried at the time of birth, while the lowest percentage of unmarried women with births belong to 20 to 34 years age bracket with 0.0% of them unmarried.
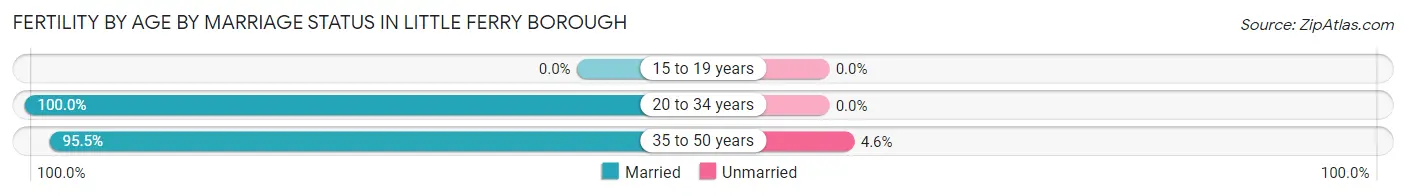
| Age Bracket | Married | Unmarried |
| 15 to 19 years | 0 (0.0%) | 0 (0.0%) |
| 20 to 34 years | 67 (100.0%) | 0 (0.0%) |
| 35 to 50 years | 21 (95.5%) | 1 (4.5%) |
| Total | 88 (98.9%) | 1 (1.1%) |
Fertility by Education in Little Ferry borough
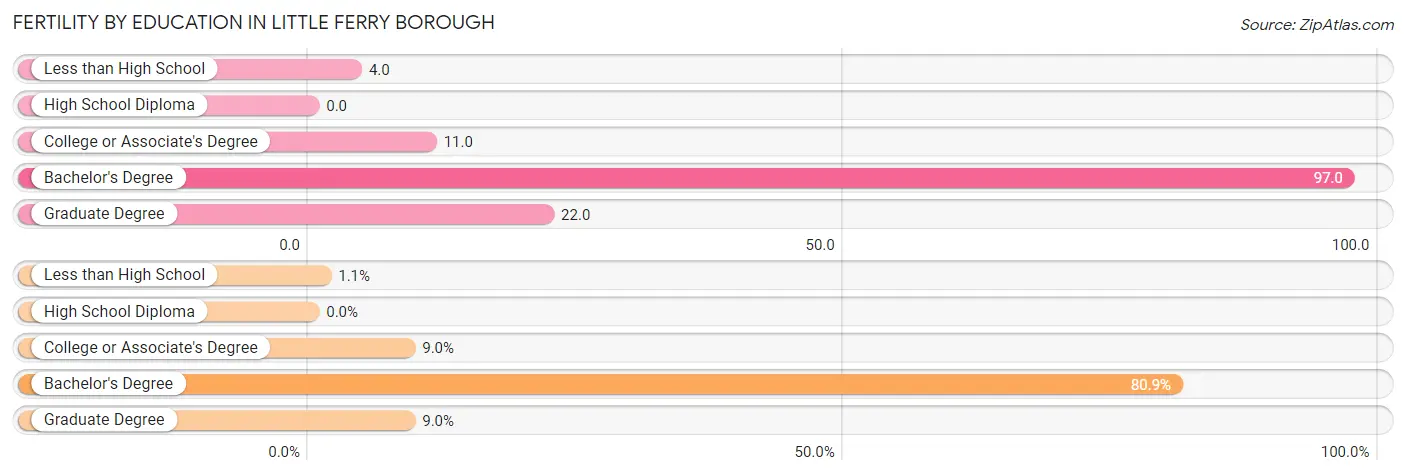
| Educational Attainment | Women with Births | Births / 1,000 Women |
| Less than High School | 1 (1.1%) | 4.0 |
| High School Diploma | 0 (0.0%) | 0.0 |
| College or Associate's Degree | 8 (9.0%) | 11.0 |
| Bachelor's Degree | 72 (80.9%) | 97.0 |
| Graduate Degree | 8 (9.0%) | 22.0 |
| Total | 89 (100.0%) | 36.0 |
Fertility by Education by Marriage Status in Little Ferry borough
1.1% of women with births in Little Ferry borough are unmarried. Women with the educational attainment of college or associate's degree are most likely to be married with 100.0% of them married at childbirth, while women with the educational attainment of less than high school are least likely to be married with 100.0% of them unmarried at childbirth.
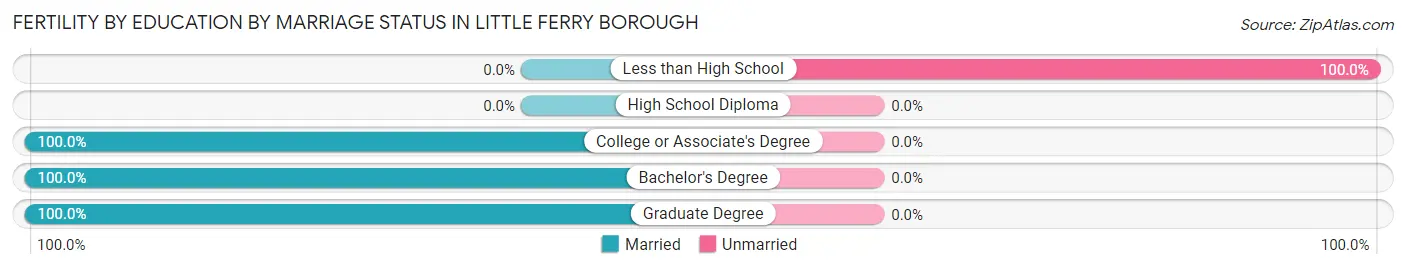
| Educational Attainment | Married | Unmarried |
| Less than High School | 0 (0.0%) | 1 (100.0%) |
| High School Diploma | 0 (0.0%) | 0 (0.0%) |
| College or Associate's Degree | 8 (100.0%) | 0 (0.0%) |
| Bachelor's Degree | 72 (100.0%) | 0 (0.0%) |
| Graduate Degree | 8 (100.0%) | 0 (0.0%) |
| Total | 88 (98.9%) | 1 (1.1%) |
Employment Characteristics in Little Ferry borough
Employment by Class of Employer in Little Ferry borough
Among the 5,803 employed individuals in Little Ferry borough, private company employees (4,582 | 79.0%), not-for-profit organizations (317 | 5.5%), and self-employed (not incorporated) (288 | 5.0%) make up the most common classes of employment.
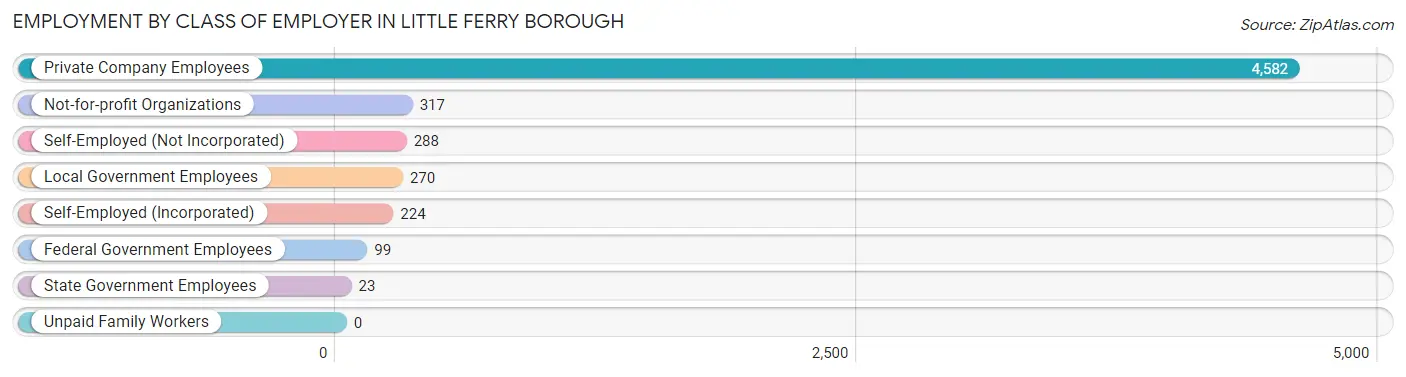
| Employer Class | # Employees | % Employees |
| Private Company Employees | 4,582 | 79.0% |
| Self-Employed (Incorporated) | 224 | 3.9% |
| Self-Employed (Not Incorporated) | 288 | 5.0% |
| Not-for-profit Organizations | 317 | 5.5% |
| Local Government Employees | 270 | 4.6% |
| State Government Employees | 23 | 0.4% |
| Federal Government Employees | 99 | 1.7% |
| Unpaid Family Workers | 0 | 0.0% |
| Total | 5,803 | 100.0% |
Employment Status by Age in Little Ferry borough
According to the labor force statistics for Little Ferry borough, out of the total population over 16 years of age (9,500), 70.3% or 6,678 individuals are in the labor force, with 8.3% or 554 of them unemployed. The age group with the highest labor force participation rate is 30 to 34 years, with 92.6% or 415 individuals in the labor force. Within the labor force, the 20 to 24 years age range has the highest percentage of unemployed individuals, with 37.9% or 203 of them being unemployed.
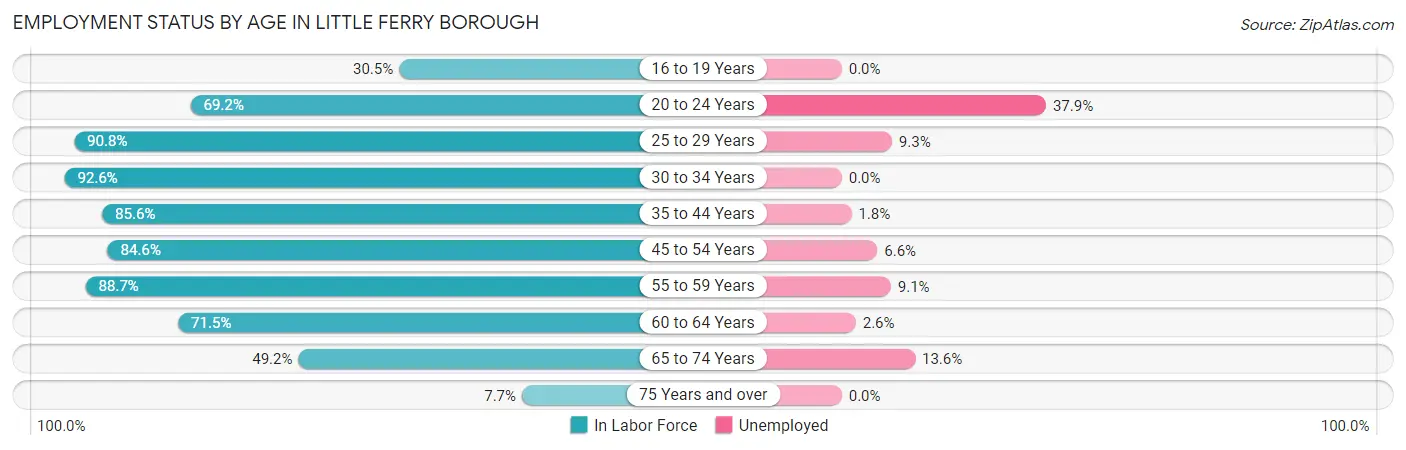
| Age Bracket | In Labor Force | Unemployed |
| 16 to 19 Years | 176 (30.5%) | 0 (0.0%) |
| 20 to 24 Years | 536 (69.2%) | 203 (37.9%) |
| 25 to 29 Years | 711 (90.8%) | 66 (9.3%) |
| 30 to 34 Years | 415 (92.6%) | 0 (0.0%) |
| 35 to 44 Years | 1,388 (85.6%) | 25 (1.8%) |
| 45 to 54 Years | 1,328 (84.6%) | 88 (6.6%) |
| 55 to 59 Years | 791 (88.7%) | 72 (9.1%) |
| 60 to 64 Years | 696 (71.5%) | 18 (2.6%) |
| 65 to 74 Years | 579 (49.2%) | 79 (13.6%) |
| 75 Years and over | 53 (7.7%) | 0 (0.0%) |
| Total | 6,678 (70.3%) | 554 (8.3%) |
Employment Status by Educational Attainment in Little Ferry borough
According to labor force statistics for Little Ferry borough, 84.8% of individuals (5,332) out of the total population between 25 and 64 years of age (6,288) are in the labor force, with 5.0% or 267 of them being unemployed. The group with the highest labor force participation rate are those with the educational attainment of less than high school, with 91.3% or 439 individuals in the labor force. Within the labor force, individuals with college / associate degree education have the highest percentage of unemployment, with 14.5% or 232 of them being unemployed.
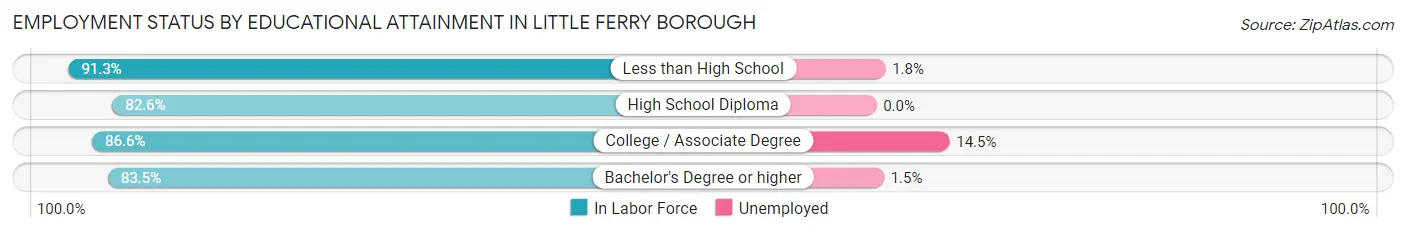
| Educational Attainment | In Labor Force | Unemployed |
| Less than High School | 439 (91.3%) | 9 (1.8%) |
| High School Diploma | 1,294 (82.6%) | 0 (0.0%) |
| College / Associate Degree | 1,600 (86.6%) | 268 (14.5%) |
| Bachelor's Degree or higher | 1,999 (83.5%) | 36 (1.5%) |
| Total | 5,332 (84.8%) | 314 (5.0%) |
Employment Occupations by Sex in Little Ferry borough
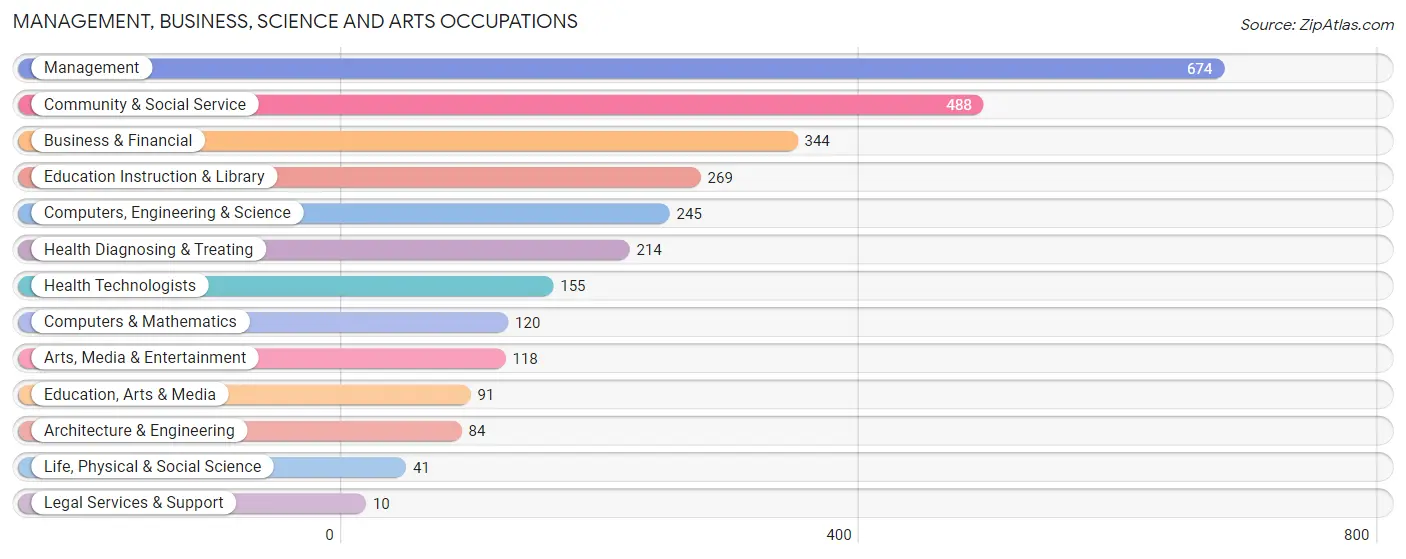
Management, Business, Science and Arts Occupations
The most common Management, Business, Science and Arts occupations in Little Ferry borough are Management (674 | 11.0%), Community & Social Service (488 | 8.0%), Business & Financial (344 | 5.6%), Education Instruction & Library (269 | 4.4%), and Computers, Engineering & Science (245 | 4.0%).
Management, Business, Science and Arts Occupations by Sex
Within the Management, Business, Science and Arts occupations in Little Ferry borough, the most male-oriented occupations are Computers & Mathematics (100.0%), Architecture & Engineering (100.0%), and Legal Services & Support (100.0%), while the most female-oriented occupations are Life, Physical & Social Science (100.0%), Education Instruction & Library (93.3%), and Health Diagnosing & Treating (84.6%).
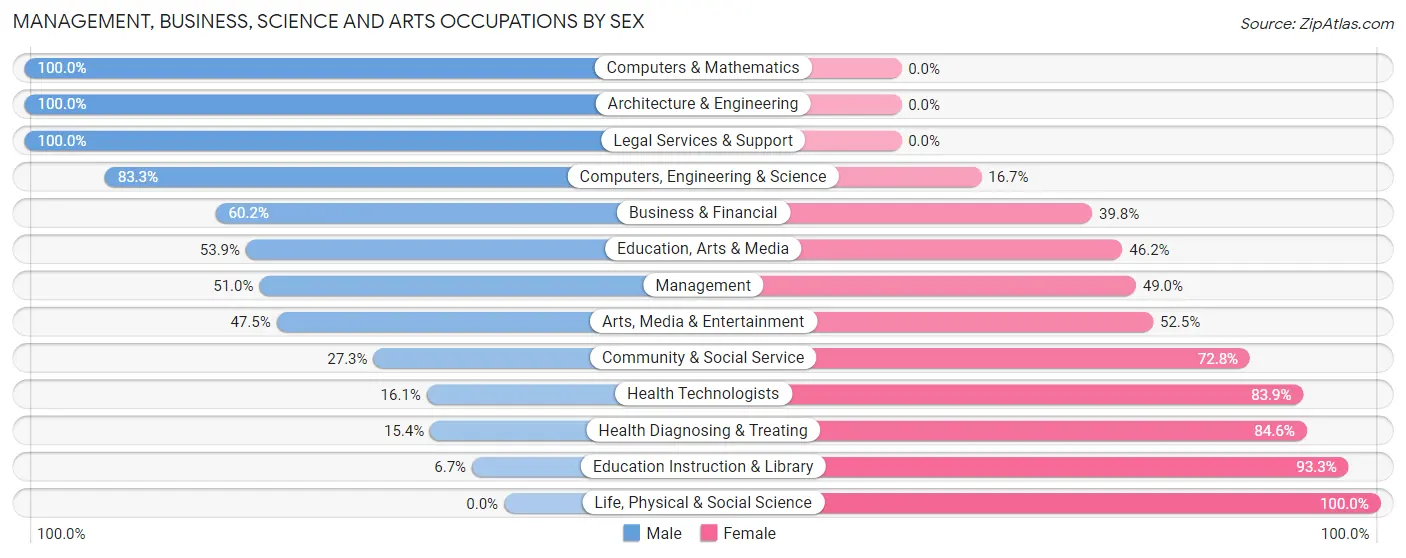
| Occupation | Male | Female |
| Management | 344 (51.0%) | 330 (49.0%) |
| Business & Financial | 207 (60.2%) | 137 (39.8%) |
| Computers, Engineering & Science | 204 (83.3%) | 41 (16.7%) |
| Computers & Mathematics | 120 (100.0%) | 0 (0.0%) |
| Architecture & Engineering | 84 (100.0%) | 0 (0.0%) |
| Life, Physical & Social Science | 0 (0.0%) | 41 (100.0%) |
| Community & Social Service | 133 (27.3%) | 355 (72.8%) |
| Education, Arts & Media | 49 (53.8%) | 42 (46.2%) |
| Legal Services & Support | 10 (100.0%) | 0 (0.0%) |
| Education Instruction & Library | 18 (6.7%) | 251 (93.3%) |
| Arts, Media & Entertainment | 56 (47.5%) | 62 (52.5%) |
| Health Diagnosing & Treating | 33 (15.4%) | 181 (84.6%) |
| Health Technologists | 25 (16.1%) | 130 (83.9%) |
| Total (Category) | 921 (46.9%) | 1,044 (53.1%) |
| Total (Overall) | 3,227 (52.7%) | 2,896 (47.3%) |
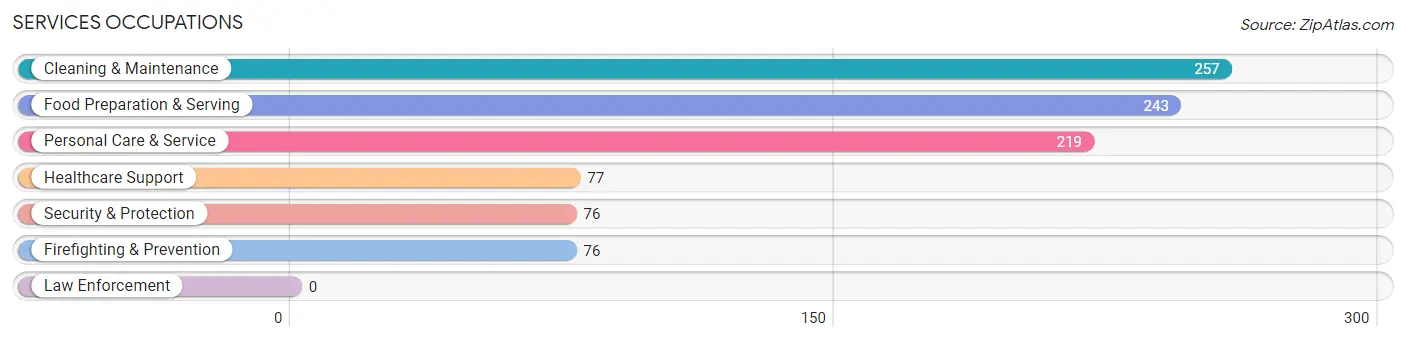
Services Occupations
The most common Services occupations in Little Ferry borough are Cleaning & Maintenance (257 | 4.2%), Food Preparation & Serving (243 | 4.0%), Personal Care & Service (219 | 3.6%), Healthcare Support (77 | 1.3%), and Security & Protection (76 | 1.2%).
Services Occupations by Sex
Within the Services occupations in Little Ferry borough, the most male-oriented occupations are Cleaning & Maintenance (61.5%), Security & Protection (39.5%), and Firefighting & Prevention (39.5%), while the most female-oriented occupations are Healthcare Support (100.0%), Personal Care & Service (66.2%), and Food Preparation & Serving (64.2%).
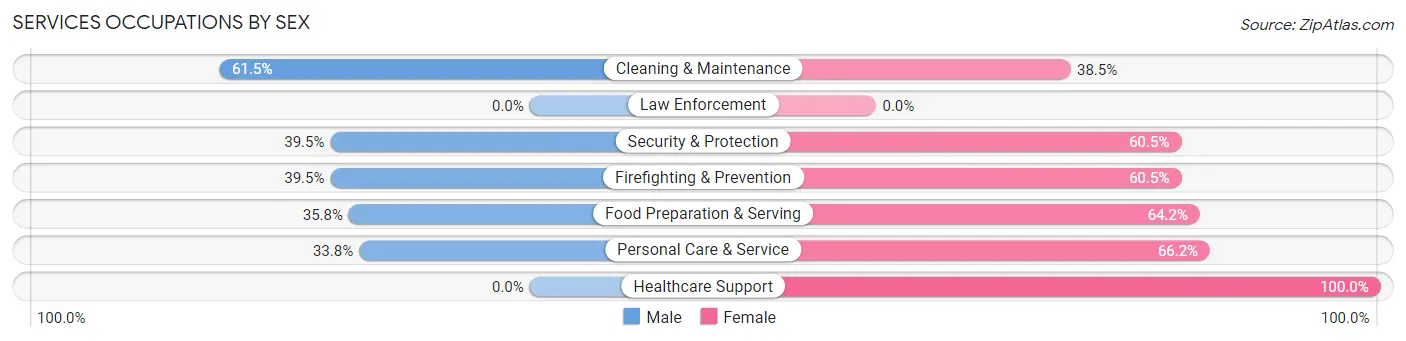
| Occupation | Male | Female |
| Healthcare Support | 0 (0.0%) | 77 (100.0%) |
| Security & Protection | 30 (39.5%) | 46 (60.5%) |
| Firefighting & Prevention | 30 (39.5%) | 46 (60.5%) |
| Law Enforcement | 0 (0.0%) | 0 (0.0%) |
| Food Preparation & Serving | 87 (35.8%) | 156 (64.2%) |
| Cleaning & Maintenance | 158 (61.5%) | 99 (38.5%) |
| Personal Care & Service | 74 (33.8%) | 145 (66.2%) |
| Total (Category) | 349 (40.0%) | 523 (60.0%) |
| Total (Overall) | 3,227 (52.7%) | 2,896 (47.3%) |
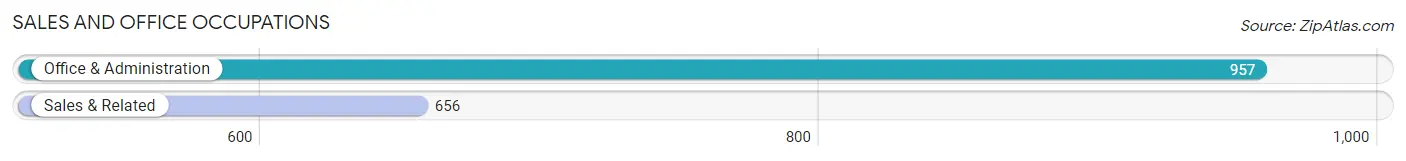
Sales and Office Occupations
The most common Sales and Office occupations in Little Ferry borough are Office & Administration (957 | 15.6%), and Sales & Related (656 | 10.7%).
Sales and Office Occupations by Sex
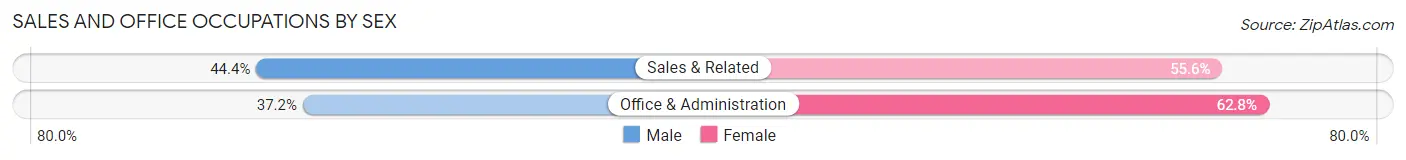
| Occupation | Male | Female |
| Sales & Related | 291 (44.4%) | 365 (55.6%) |
| Office & Administration | 356 (37.2%) | 601 (62.8%) |
| Total (Category) | 647 (40.1%) | 966 (59.9%) |
| Total (Overall) | 3,227 (52.7%) | 2,896 (47.3%) |
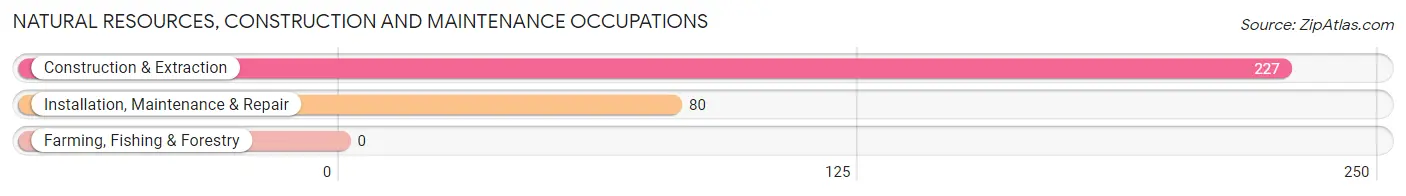
Natural Resources, Construction and Maintenance Occupations
The most common Natural Resources, Construction and Maintenance occupations in Little Ferry borough are Construction & Extraction (227 | 3.7%), and Installation, Maintenance & Repair (80 | 1.3%).
Natural Resources, Construction and Maintenance Occupations by Sex
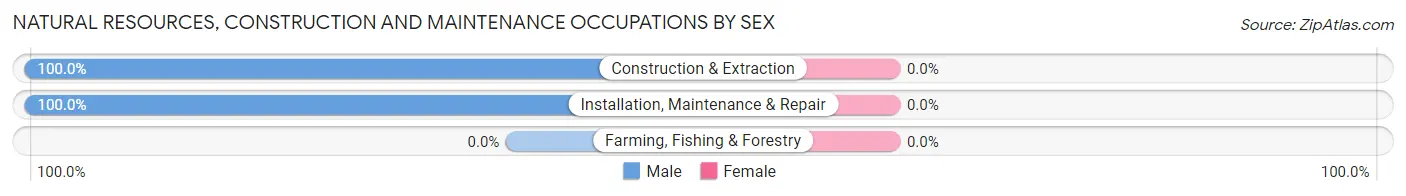
| Occupation | Male | Female |
| Farming, Fishing & Forestry | 0 (0.0%) | 0 (0.0%) |
| Construction & Extraction | 227 (100.0%) | 0 (0.0%) |
| Installation, Maintenance & Repair | 80 (100.0%) | 0 (0.0%) |
| Total (Category) | 307 (100.0%) | 0 (0.0%) |
| Total (Overall) | 3,227 (52.7%) | 2,896 (47.3%) |
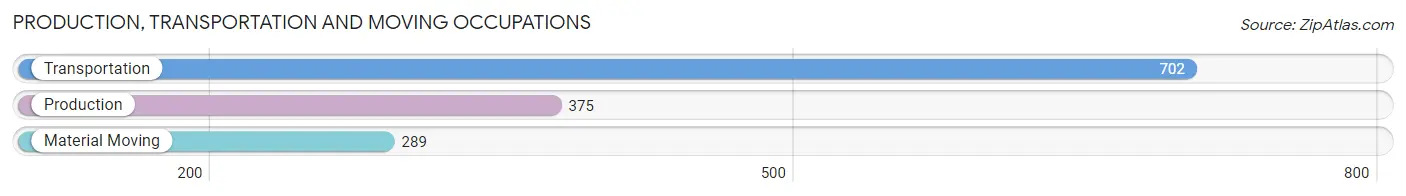
Production, Transportation and Moving Occupations
The most common Production, Transportation and Moving occupations in Little Ferry borough are Transportation (702 | 11.5%), Production (375 | 6.1%), and Material Moving (289 | 4.7%).
Production, Transportation and Moving Occupations by Sex
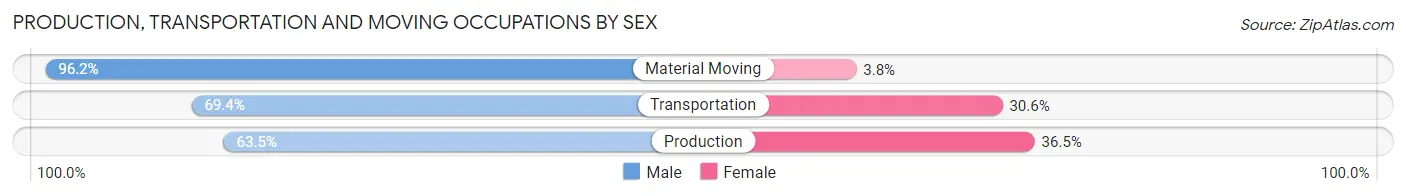
| Occupation | Male | Female |
| Production | 238 (63.5%) | 137 (36.5%) |
| Transportation | 487 (69.4%) | 215 (30.6%) |
| Material Moving | 278 (96.2%) | 11 (3.8%) |
| Total (Category) | 1,003 (73.4%) | 363 (26.6%) |
| Total (Overall) | 3,227 (52.7%) | 2,896 (47.3%) |
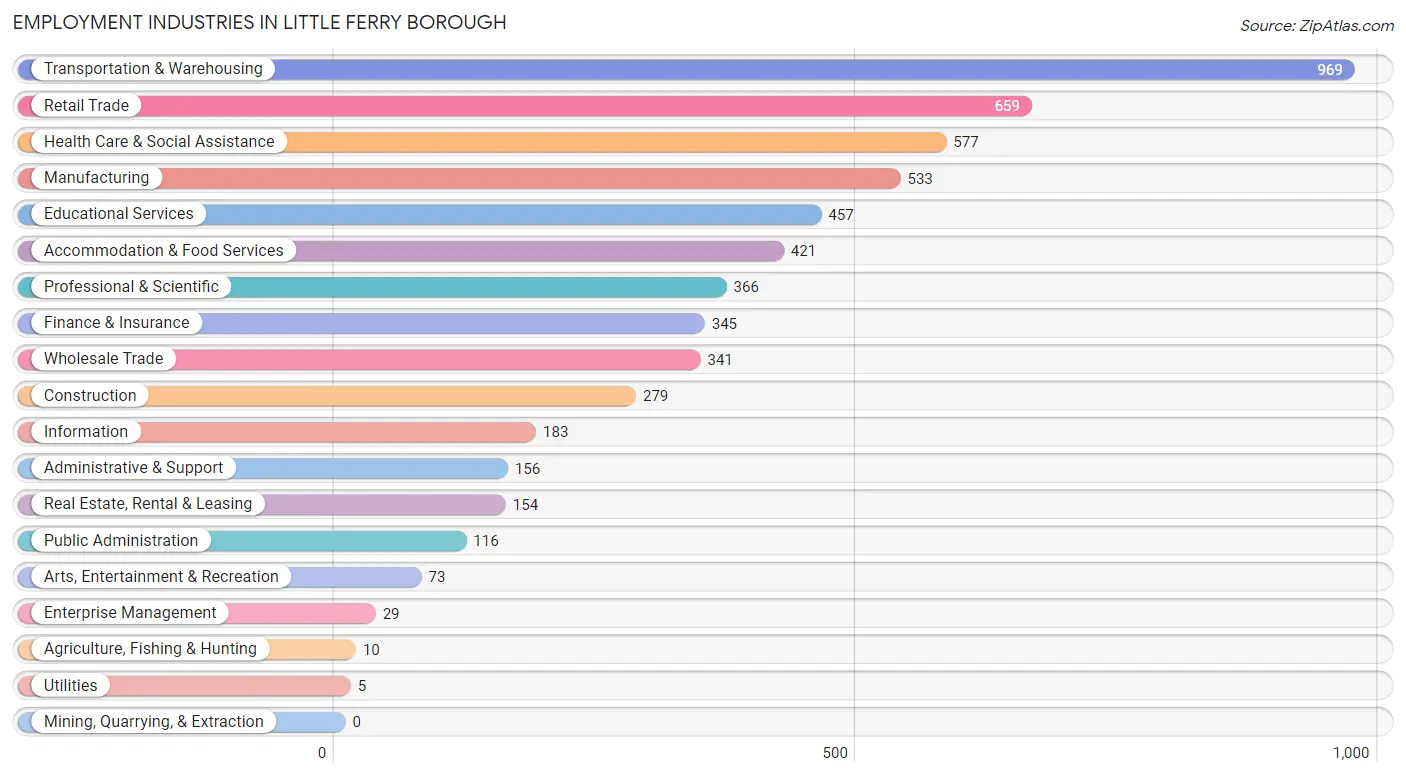
Employment Industries by Sex in Little Ferry borough
Employment Industries in Little Ferry borough
The major employment industries in Little Ferry borough include Transportation & Warehousing (969 | 15.8%), Retail Trade (659 | 10.8%), Health Care & Social Assistance (577 | 9.4%), Manufacturing (533 | 8.7%), and Educational Services (457 | 7.5%).
Employment Industries by Sex in Little Ferry borough
The Little Ferry borough industries that see more men than women are Agriculture, Fishing & Hunting (100.0%), Utilities (100.0%), and Construction (93.5%), whereas the industries that tend to have a higher number of women are Enterprise Management (100.0%), Educational Services (72.0%), and Health Care & Social Assistance (70.0%).
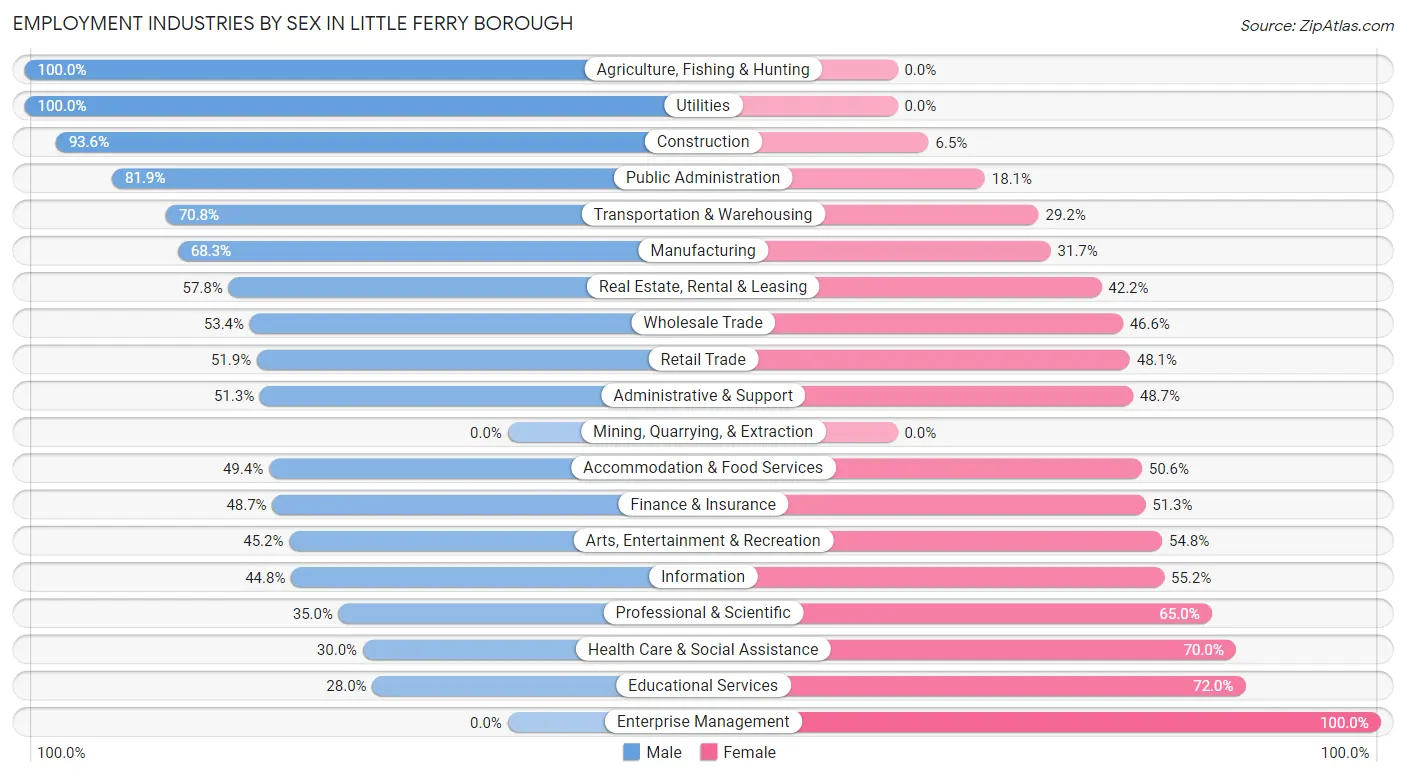
| Industry | Male | Female |
| Agriculture, Fishing & Hunting | 10 (100.0%) | 0 (0.0%) |
| Mining, Quarrying, & Extraction | 0 (0.0%) | 0 (0.0%) |
| Construction | 261 (93.5%) | 18 (6.5%) |
| Manufacturing | 364 (68.3%) | 169 (31.7%) |
| Wholesale Trade | 182 (53.4%) | 159 (46.6%) |
| Retail Trade | 342 (51.9%) | 317 (48.1%) |
| Transportation & Warehousing | 686 (70.8%) | 283 (29.2%) |
| Utilities | 5 (100.0%) | 0 (0.0%) |
| Information | 82 (44.8%) | 101 (55.2%) |
| Finance & Insurance | 168 (48.7%) | 177 (51.3%) |
| Real Estate, Rental & Leasing | 89 (57.8%) | 65 (42.2%) |
| Professional & Scientific | 128 (35.0%) | 238 (65.0%) |
| Enterprise Management | 0 (0.0%) | 29 (100.0%) |
| Administrative & Support | 80 (51.3%) | 76 (48.7%) |
| Educational Services | 128 (28.0%) | 329 (72.0%) |
| Health Care & Social Assistance | 173 (30.0%) | 404 (70.0%) |
| Arts, Entertainment & Recreation | 33 (45.2%) | 40 (54.8%) |
| Accommodation & Food Services | 208 (49.4%) | 213 (50.6%) |
| Public Administration | 95 (81.9%) | 21 (18.1%) |
| Total | 3,227 (52.7%) | 2,896 (47.3%) |
Education in Little Ferry borough
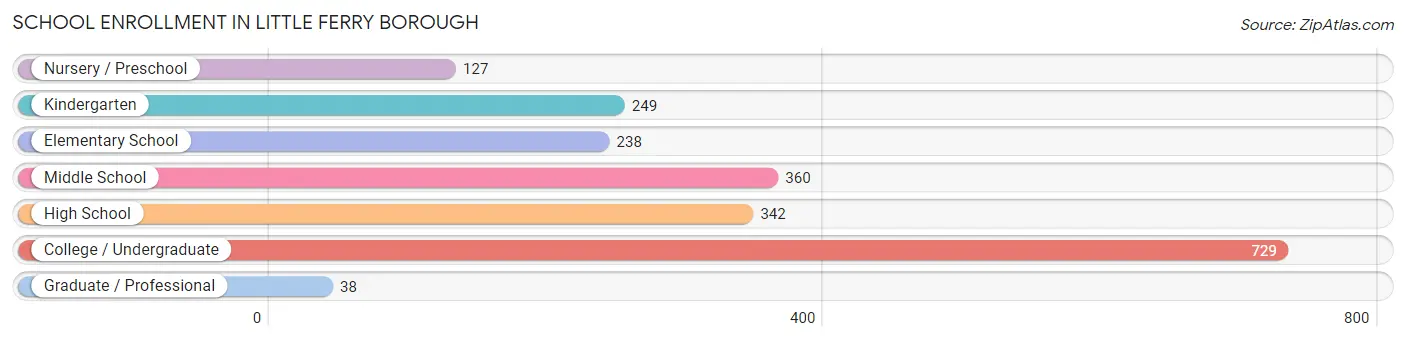
School Enrollment in Little Ferry borough
The most common levels of schooling among the 2,083 students in Little Ferry borough are college / undergraduate (729 | 35.0%), middle school (360 | 17.3%), and high school (342 | 16.4%).
| School Level | # Students | % Students |
| Nursery / Preschool | 127 | 6.1% |
| Kindergarten | 249 | 11.9% |
| Elementary School | 238 | 11.4% |
| Middle School | 360 | 17.3% |
| High School | 342 | 16.4% |
| College / Undergraduate | 729 | 35.0% |
| Graduate / Professional | 38 | 1.8% |
| Total | 2,083 | 100.0% |
School Enrollment by Age by Funding Source in Little Ferry borough
Out of a total of 2,083 students who are enrolled in schools in Little Ferry borough, 231 (11.1%) attend a private institution, while the remaining 1,852 (88.9%) are enrolled in public schools. The age group of 35 years and over has the highest likelihood of being enrolled in private schools, with 33 (56.9% in the age bracket) enrolled. Conversely, the age group of 10 to 14 year olds has the lowest likelihood of being enrolled in a private school, with 402 (96.9% in the age bracket) attending a public institution.
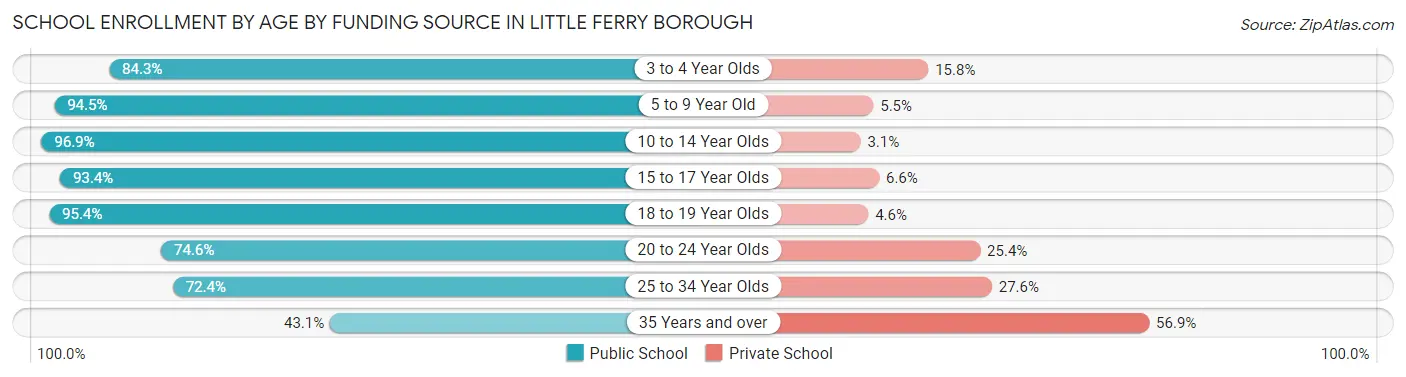
| Age Bracket | Public School | Private School |
| 3 to 4 Year Olds | 107 (84.3%) | 20 (15.8%) |
| 5 to 9 Year Old | 445 (94.5%) | 26 (5.5%) |
| 10 to 14 Year Olds | 402 (96.9%) | 13 (3.1%) |
| 15 to 17 Year Olds | 255 (93.4%) | 18 (6.6%) |
| 18 to 19 Year Olds | 313 (95.4%) | 15 (4.6%) |
| 20 to 24 Year Olds | 220 (74.6%) | 75 (25.4%) |
| 25 to 34 Year Olds | 84 (72.4%) | 32 (27.6%) |
| 35 Years and over | 25 (43.1%) | 33 (56.9%) |
| Total | 1,852 (88.9%) | 231 (11.1%) |
Educational Attainment by Field of Study in Little Ferry borough
Business (779 | 25.4%), science & technology (375 | 12.2%), social sciences (295 | 9.6%), education (280 | 9.1%), and communications (225 | 7.3%) are the most common fields of study among 3,073 individuals in Little Ferry borough who have obtained a bachelor's degree or higher.
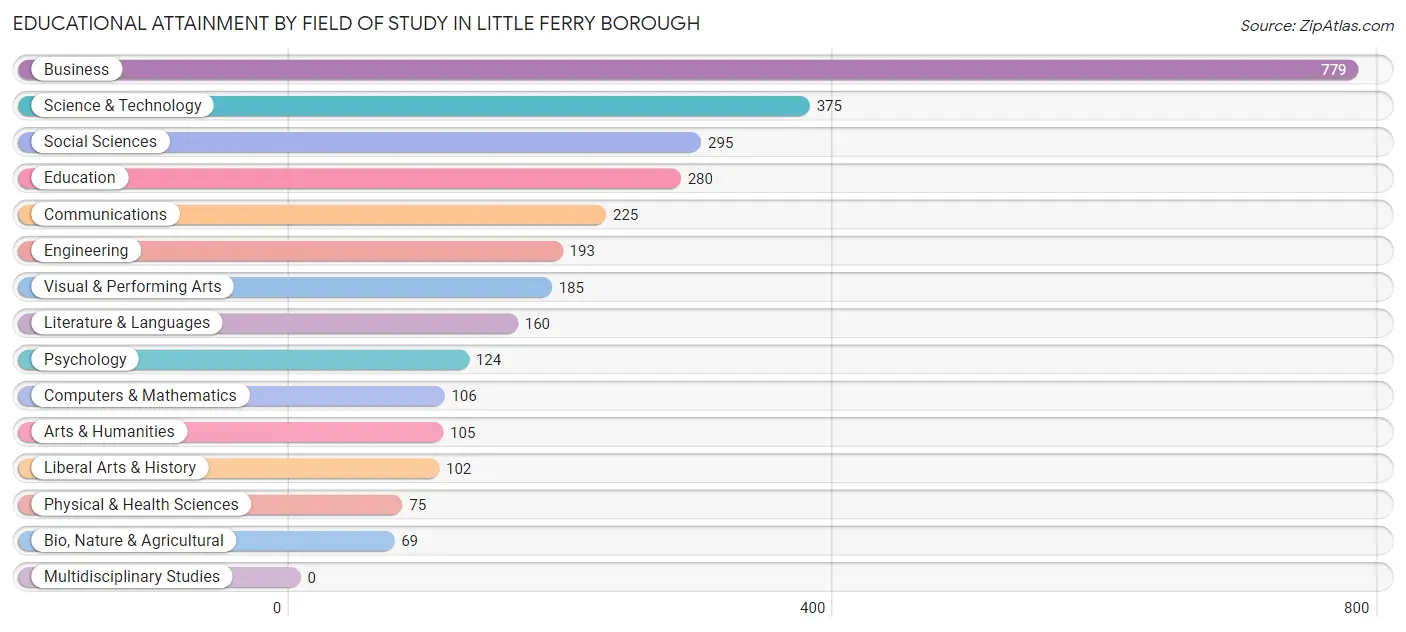
| Field of Study | # Graduates | % Graduates |
| Computers & Mathematics | 106 | 3.5% |
| Bio, Nature & Agricultural | 69 | 2.2% |
| Physical & Health Sciences | 75 | 2.4% |
| Psychology | 124 | 4.0% |
| Social Sciences | 295 | 9.6% |
| Engineering | 193 | 6.3% |
| Multidisciplinary Studies | 0 | 0.0% |
| Science & Technology | 375 | 12.2% |
| Business | 779 | 25.4% |
| Education | 280 | 9.1% |
| Literature & Languages | 160 | 5.2% |
| Liberal Arts & History | 102 | 3.3% |
| Visual & Performing Arts | 185 | 6.0% |
| Communications | 225 | 7.3% |
| Arts & Humanities | 105 | 3.4% |
| Total | 3,073 | 100.0% |
Transportation & Commute in Little Ferry borough
Vehicle Availability by Sex in Little Ferry borough
The most prevalent vehicle ownership categories in Little Ferry borough are males with 3 vehicles (969, accounting for 31.6%) and females with 3 vehicles (428, making up 35.5%).
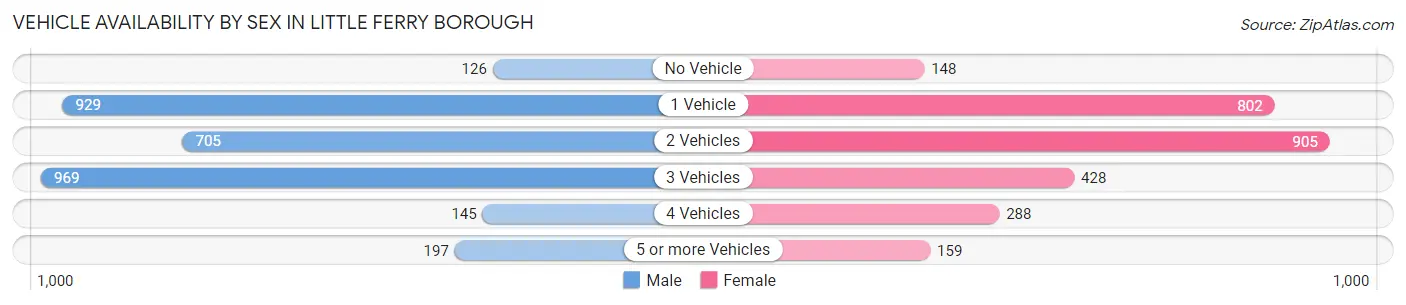
| Vehicles Available | Male | Female |
| No Vehicle | 126 (4.1%) | 148 (5.4%) |
| 1 Vehicle | 929 (30.2%) | 802 (29.4%) |
| 2 Vehicles | 705 (23.0%) | 905 (33.2%) |
| 3 Vehicles | 969 (31.6%) | 428 (15.7%) |
| 4 Vehicles | 145 (4.7%) | 288 (10.5%) |
| 5 or more Vehicles | 197 (6.4%) | 159 (5.8%) |
| Total | 3,071 (100.0%) | 2,730 (100.0%) |
Commute Time in Little Ferry borough
The most frequently occuring commute durations in Little Ferry borough are 10 to 14 minutes (882 commuters, 15.9%), 20 to 24 minutes (853 commuters, 15.4%), and 45 to 59 minutes (803 commuters, 14.5%).
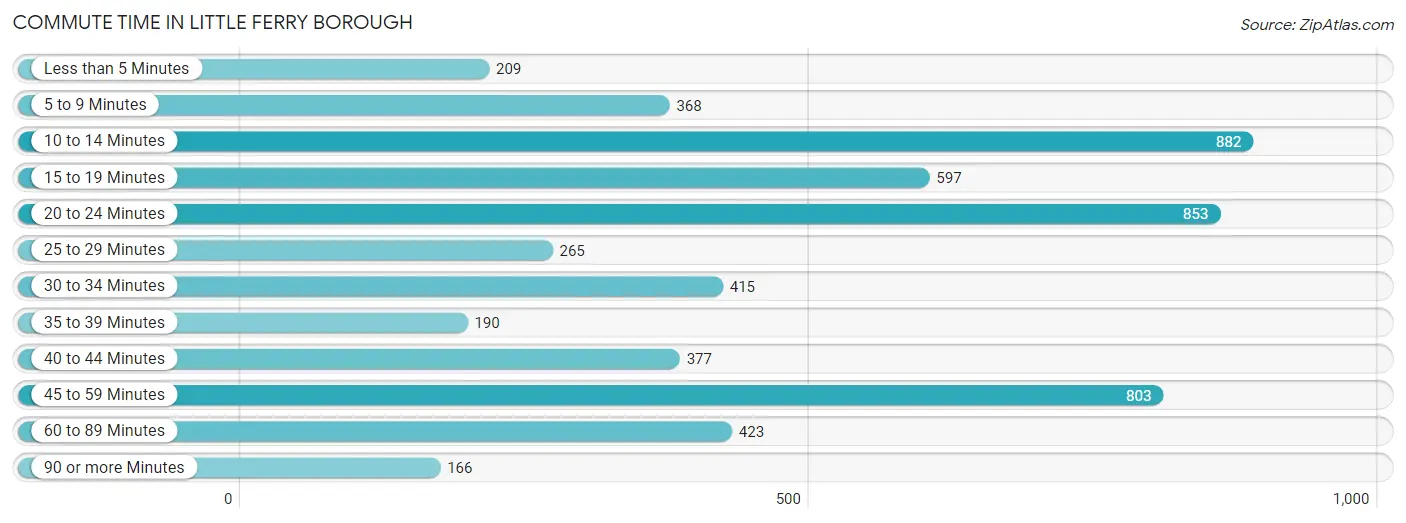
| Commute Time | # Commuters | % Commuters |
| Less than 5 Minutes | 209 | 3.8% |
| 5 to 9 Minutes | 368 | 6.6% |
| 10 to 14 Minutes | 882 | 15.9% |
| 15 to 19 Minutes | 597 | 10.8% |
| 20 to 24 Minutes | 853 | 15.4% |
| 25 to 29 Minutes | 265 | 4.8% |
| 30 to 34 Minutes | 415 | 7.5% |
| 35 to 39 Minutes | 190 | 3.4% |
| 40 to 44 Minutes | 377 | 6.8% |
| 45 to 59 Minutes | 803 | 14.5% |
| 60 to 89 Minutes | 423 | 7.6% |
| 90 or more Minutes | 166 | 3.0% |
Commute Time by Sex in Little Ferry borough
The most common commute times in Little Ferry borough are 10 to 14 minutes (568 commuters, 19.2%) for males and 20 to 24 minutes (438 commuters, 16.9%) for females.
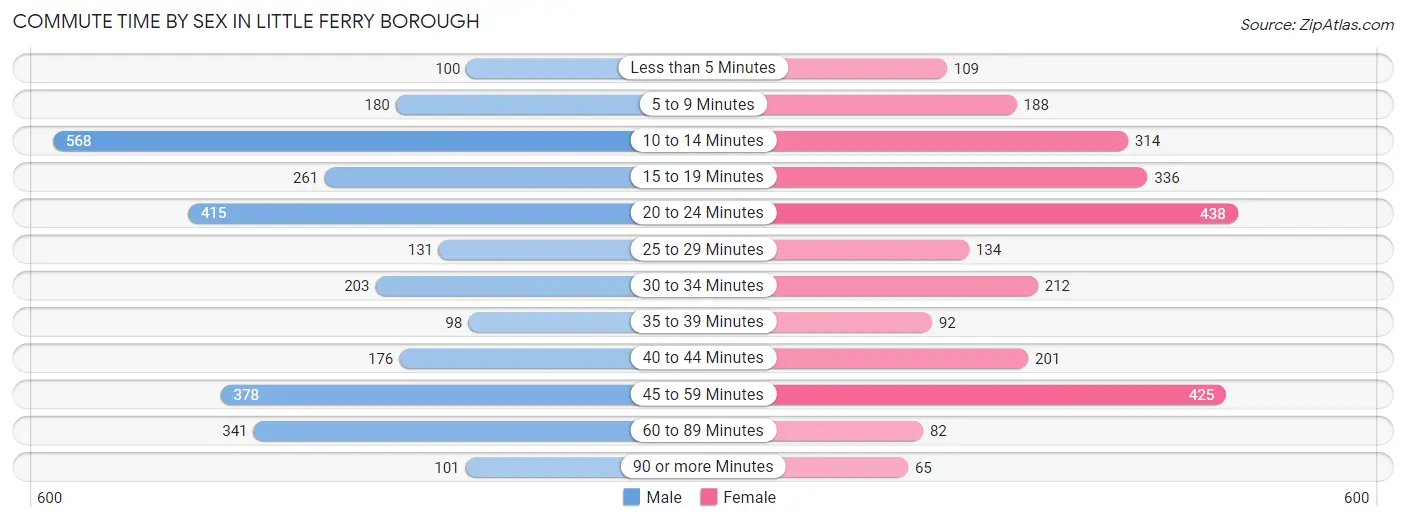
| Commute Time | Male | Female |
| Less than 5 Minutes | 100 (3.4%) | 109 (4.2%) |
| 5 to 9 Minutes | 180 (6.1%) | 188 (7.2%) |
| 10 to 14 Minutes | 568 (19.2%) | 314 (12.1%) |
| 15 to 19 Minutes | 261 (8.8%) | 336 (12.9%) |
| 20 to 24 Minutes | 415 (14.1%) | 438 (16.9%) |
| 25 to 29 Minutes | 131 (4.4%) | 134 (5.2%) |
| 30 to 34 Minutes | 203 (6.9%) | 212 (8.2%) |
| 35 to 39 Minutes | 98 (3.3%) | 92 (3.5%) |
| 40 to 44 Minutes | 176 (6.0%) | 201 (7.7%) |
| 45 to 59 Minutes | 378 (12.8%) | 425 (16.4%) |
| 60 to 89 Minutes | 341 (11.6%) | 82 (3.2%) |
| 90 or more Minutes | 101 (3.4%) | 65 (2.5%) |
Time of Departure to Work by Sex in Little Ferry borough
The most frequent times of departure to work in Little Ferry borough are 6:30 AM to 6:59 AM (584, 19.8%) for males and 8:00 AM to 8:29 AM (794, 30.6%) for females.
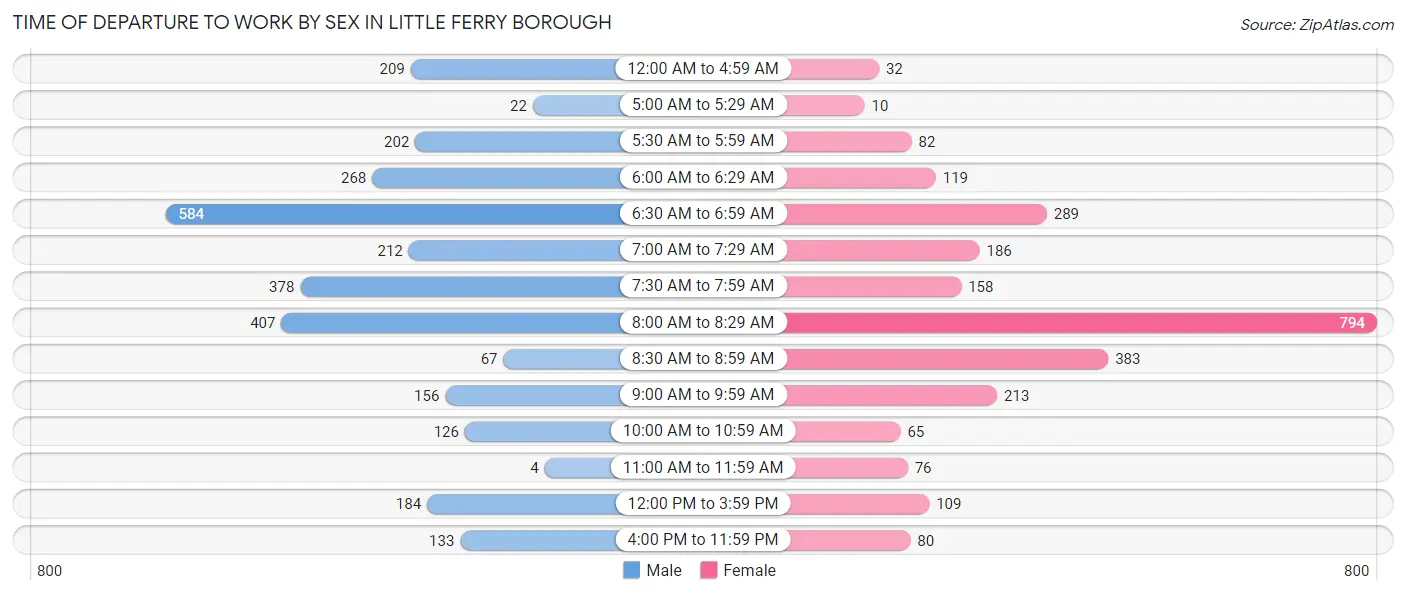
| Time of Departure | Male | Female |
| 12:00 AM to 4:59 AM | 209 (7.1%) | 32 (1.2%) |
| 5:00 AM to 5:29 AM | 22 (0.7%) | 10 (0.4%) |
| 5:30 AM to 5:59 AM | 202 (6.8%) | 82 (3.2%) |
| 6:00 AM to 6:29 AM | 268 (9.1%) | 119 (4.6%) |
| 6:30 AM to 6:59 AM | 584 (19.8%) | 289 (11.1%) |
| 7:00 AM to 7:29 AM | 212 (7.2%) | 186 (7.2%) |
| 7:30 AM to 7:59 AM | 378 (12.8%) | 158 (6.1%) |
| 8:00 AM to 8:29 AM | 407 (13.8%) | 794 (30.6%) |
| 8:30 AM to 8:59 AM | 67 (2.3%) | 383 (14.7%) |
| 9:00 AM to 9:59 AM | 156 (5.3%) | 213 (8.2%) |
| 10:00 AM to 10:59 AM | 126 (4.3%) | 65 (2.5%) |
| 11:00 AM to 11:59 AM | 4 (0.1%) | 76 (2.9%) |
| 12:00 PM to 3:59 PM | 184 (6.2%) | 109 (4.2%) |
| 4:00 PM to 11:59 PM | 133 (4.5%) | 80 (3.1%) |
| Total | 2,952 (100.0%) | 2,596 (100.0%) |
Housing Occupancy in Little Ferry borough
Occupancy by Ownership in Little Ferry borough
Of the total 4,334 dwellings in Little Ferry borough, owner-occupied units account for 1,742 (40.2%), while renter-occupied units make up 2,592 (59.8%).
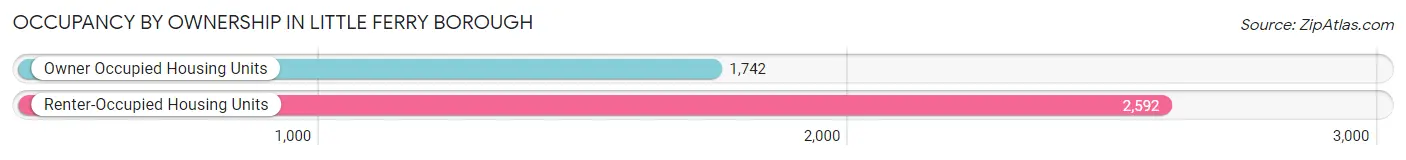
| Occupancy | # Housing Units | % Housing Units |
| Owner Occupied Housing Units | 1,742 | 40.2% |
| Renter-Occupied Housing Units | 2,592 | 59.8% |
| Total Occupied Housing Units | 4,334 | 100.0% |
Occupancy by Household Size in Little Ferry borough
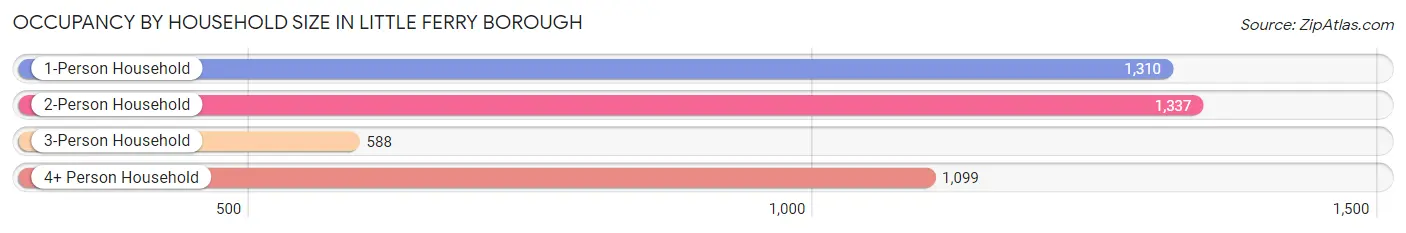
| Household Size | # Housing Units | % Housing Units |
| 1-Person Household | 1,310 | 30.2% |
| 2-Person Household | 1,337 | 30.8% |
| 3-Person Household | 588 | 13.6% |
| 4+ Person Household | 1,099 | 25.4% |
| Total Housing Units | 4,334 | 100.0% |
Occupancy by Ownership by Household Size in Little Ferry borough
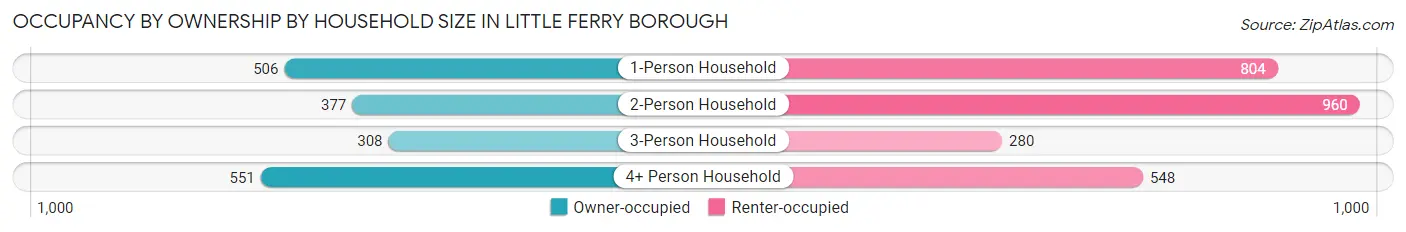
| Household Size | Owner-occupied | Renter-occupied |
| 1-Person Household | 506 (38.6%) | 804 (61.4%) |
| 2-Person Household | 377 (28.2%) | 960 (71.8%) |
| 3-Person Household | 308 (52.4%) | 280 (47.6%) |
| 4+ Person Household | 551 (50.1%) | 548 (49.9%) |
| Total Housing Units | 1,742 (40.2%) | 2,592 (59.8%) |
Occupancy by Educational Attainment in Little Ferry borough
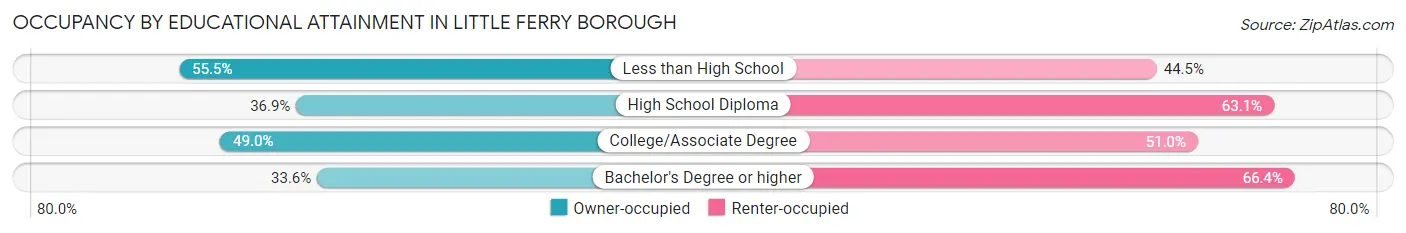
| Household Size | Owner-occupied | Renter-occupied |
| Less than High School | 177 (55.5%) | 142 (44.5%) |
| High School Diploma | 474 (36.9%) | 810 (63.1%) |
| College/Associate Degree | 552 (49.0%) | 575 (51.0%) |
| Bachelor's Degree or higher | 539 (33.6%) | 1,065 (66.4%) |
Occupancy by Age of Householder in Little Ferry borough
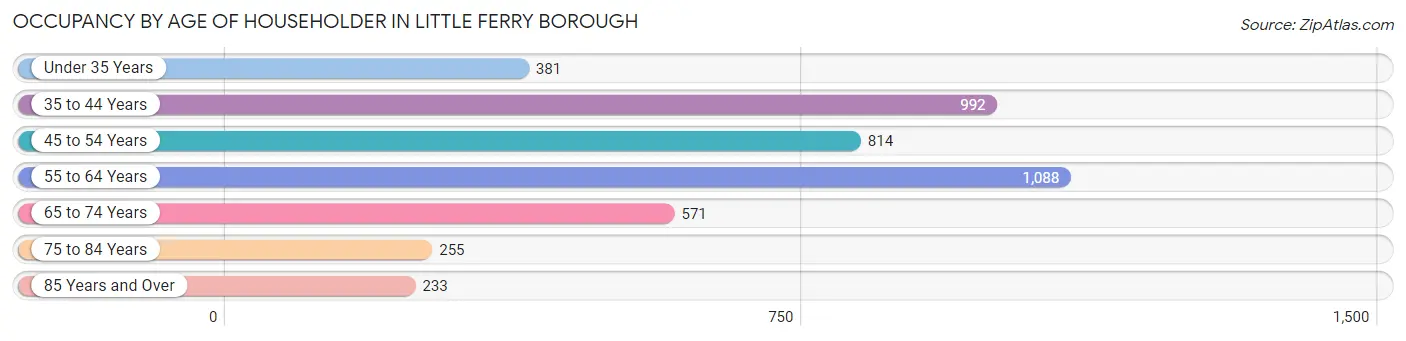
| Age Bracket | # Households | % Households |
| Under 35 Years | 381 | 8.8% |
| 35 to 44 Years | 992 | 22.9% |
| 45 to 54 Years | 814 | 18.8% |
| 55 to 64 Years | 1,088 | 25.1% |
| 65 to 74 Years | 571 | 13.2% |
| 75 to 84 Years | 255 | 5.9% |
| 85 Years and Over | 233 | 5.4% |
| Total | 4,334 | 100.0% |
Housing Finances in Little Ferry borough
Median Income by Occupancy in Little Ferry borough
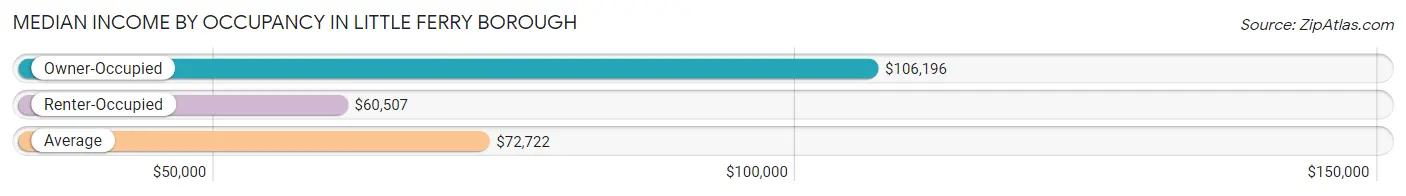
| Occupancy Type | # Households | Median Income |
| Owner-Occupied | 1,742 (40.2%) | $106,196 |
| Renter-Occupied | 2,592 (59.8%) | $60,507 |
| Average | 4,334 (100.0%) | $72,722 |
Occupancy by Householder Income Bracket in Little Ferry borough
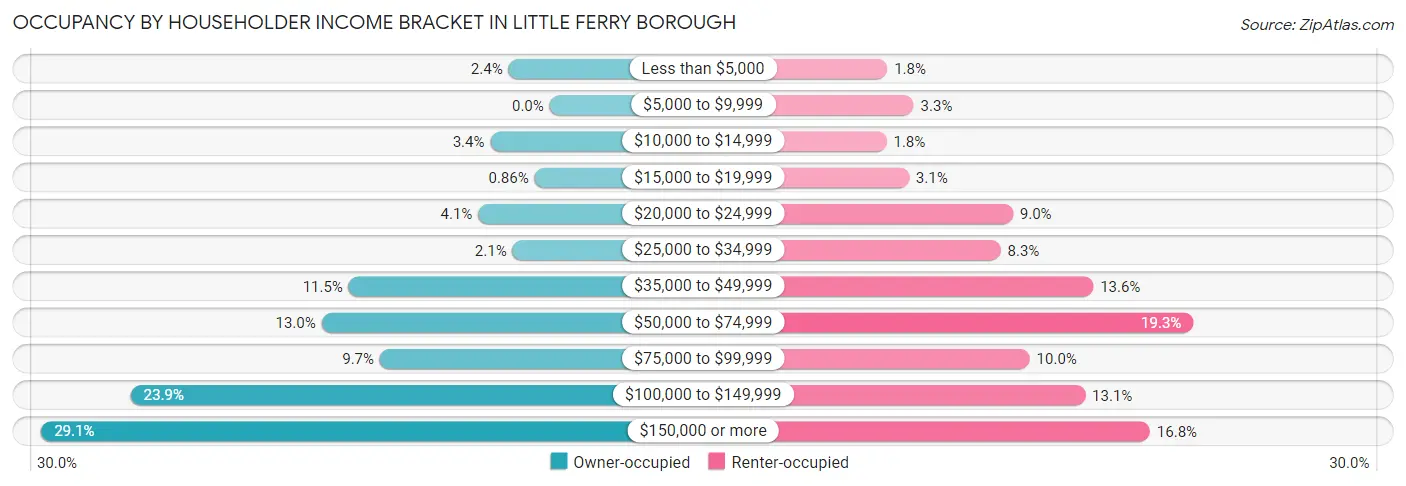
| Income Bracket | Owner-occupied | Renter-occupied |
| Less than $5,000 | 41 (2.4%) | 47 (1.8%) |
| $5,000 to $9,999 | 0 (0.0%) | 86 (3.3%) |
| $10,000 to $14,999 | 59 (3.4%) | 46 (1.8%) |
| $15,000 to $19,999 | 15 (0.9%) | 79 (3.0%) |
| $20,000 to $24,999 | 71 (4.1%) | 233 (9.0%) |
| $25,000 to $34,999 | 37 (2.1%) | 215 (8.3%) |
| $35,000 to $49,999 | 200 (11.5%) | 352 (13.6%) |
| $50,000 to $74,999 | 227 (13.0%) | 500 (19.3%) |
| $75,000 to $99,999 | 169 (9.7%) | 258 (10.0%) |
| $100,000 to $149,999 | 417 (23.9%) | 340 (13.1%) |
| $150,000 or more | 506 (29.0%) | 436 (16.8%) |
| Total | 1,742 (100.0%) | 2,592 (100.0%) |
Monthly Housing Cost Tiers in Little Ferry borough
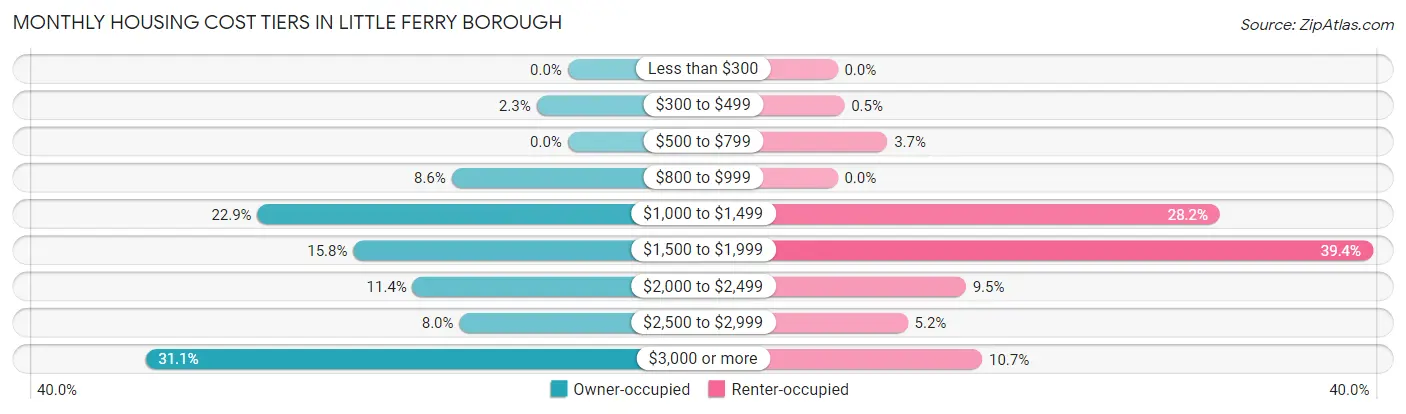
| Monthly Cost | Owner-occupied | Renter-occupied |
| Less than $300 | 0 (0.0%) | 0 (0.0%) |
| $300 to $499 | 40 (2.3%) | 13 (0.5%) |
| $500 to $799 | 0 (0.0%) | 95 (3.7%) |
| $800 to $999 | 149 (8.6%) | 0 (0.0%) |
| $1,000 to $1,499 | 398 (22.9%) | 730 (28.2%) |
| $1,500 to $1,999 | 275 (15.8%) | 1,022 (39.4%) |
| $2,000 to $2,499 | 199 (11.4%) | 245 (9.5%) |
| $2,500 to $2,999 | 139 (8.0%) | 134 (5.2%) |
| $3,000 or more | 542 (31.1%) | 276 (10.6%) |
| Total | 1,742 (100.0%) | 2,592 (100.0%) |
Physical Housing Characteristics in Little Ferry borough
Housing Structures in Little Ferry borough
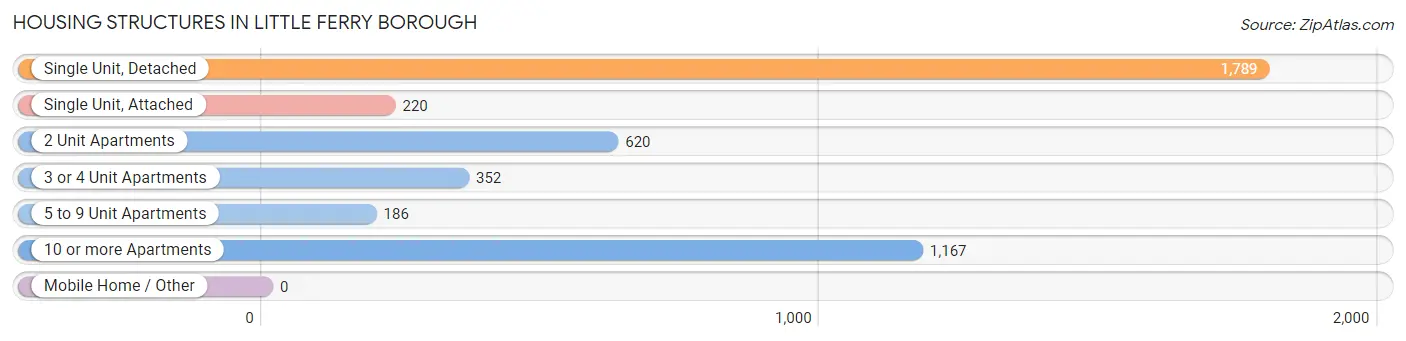
| Structure Type | # Housing Units | % Housing Units |
| Single Unit, Detached | 1,789 | 41.3% |
| Single Unit, Attached | 220 | 5.1% |
| 2 Unit Apartments | 620 | 14.3% |
| 3 or 4 Unit Apartments | 352 | 8.1% |
| 5 to 9 Unit Apartments | 186 | 4.3% |
| 10 or more Apartments | 1,167 | 26.9% |
| Mobile Home / Other | 0 | 0.0% |
| Total | 4,334 | 100.0% |
Housing Structures by Occupancy in Little Ferry borough
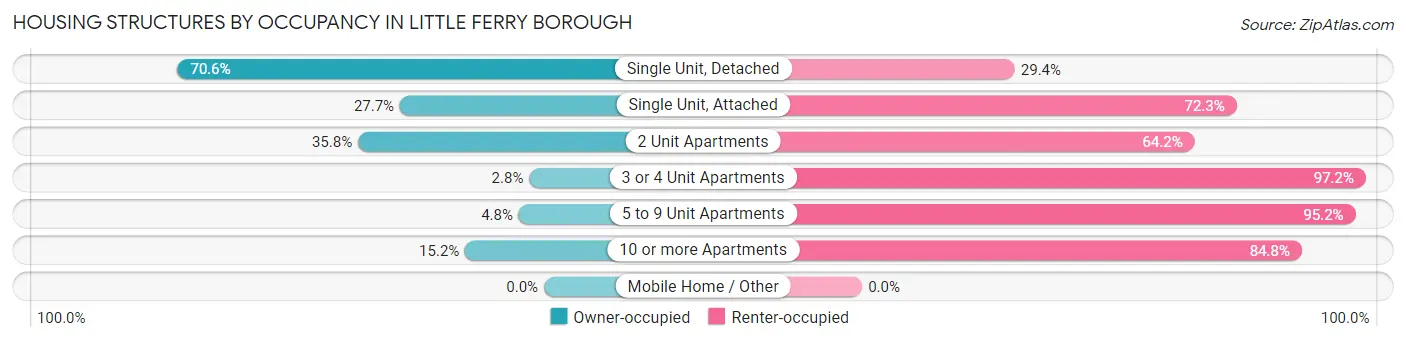
| Structure Type | Owner-occupied | Renter-occupied |
| Single Unit, Detached | 1,263 (70.6%) | 526 (29.4%) |
| Single Unit, Attached | 61 (27.7%) | 159 (72.3%) |
| 2 Unit Apartments | 222 (35.8%) | 398 (64.2%) |
| 3 or 4 Unit Apartments | 10 (2.8%) | 342 (97.2%) |
| 5 to 9 Unit Apartments | 9 (4.8%) | 177 (95.2%) |
| 10 or more Apartments | 177 (15.2%) | 990 (84.8%) |
| Mobile Home / Other | 0 (0.0%) | 0 (0.0%) |
| Total | 1,742 (40.2%) | 2,592 (59.8%) |
Housing Structures by Number of Rooms in Little Ferry borough
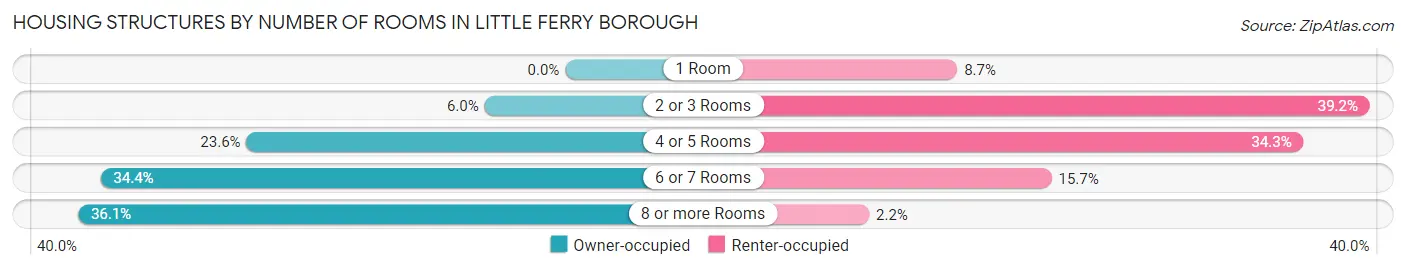
| Number of Rooms | Owner-occupied | Renter-occupied |
| 1 Room | 0 (0.0%) | 225 (8.7%) |
| 2 or 3 Rooms | 104 (6.0%) | 1,016 (39.2%) |
| 4 or 5 Rooms | 411 (23.6%) | 889 (34.3%) |
| 6 or 7 Rooms | 599 (34.4%) | 406 (15.7%) |
| 8 or more Rooms | 628 (36.0%) | 56 (2.2%) |
| Total | 1,742 (100.0%) | 2,592 (100.0%) |
Housing Structure by Heating Type in Little Ferry borough
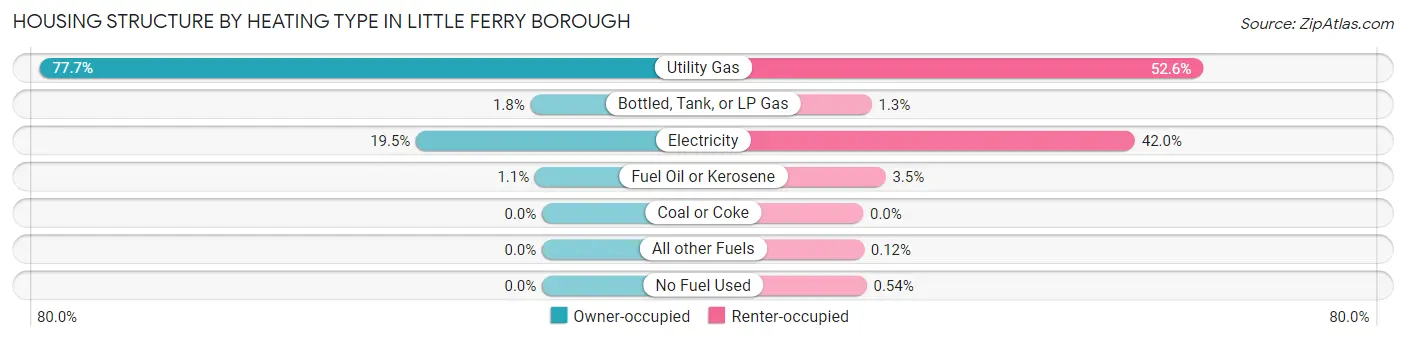
| Heating Type | Owner-occupied | Renter-occupied |
| Utility Gas | 1,353 (77.7%) | 1,362 (52.5%) |
| Bottled, Tank, or LP Gas | 31 (1.8%) | 34 (1.3%) |
| Electricity | 339 (19.5%) | 1,089 (42.0%) |
| Fuel Oil or Kerosene | 19 (1.1%) | 90 (3.5%) |
| Coal or Coke | 0 (0.0%) | 0 (0.0%) |
| All other Fuels | 0 (0.0%) | 3 (0.1%) |
| No Fuel Used | 0 (0.0%) | 14 (0.5%) |
| Total | 1,742 (100.0%) | 2,592 (100.0%) |
Household Vehicle Usage in Little Ferry borough
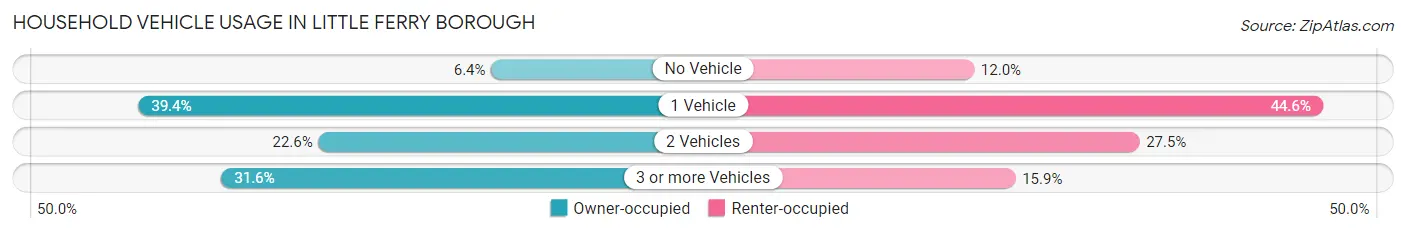
| Vehicles per Household | Owner-occupied | Renter-occupied |
| No Vehicle | 112 (6.4%) | 312 (12.0%) |
| 1 Vehicle | 686 (39.4%) | 1,156 (44.6%) |
| 2 Vehicles | 393 (22.6%) | 712 (27.5%) |
| 3 or more Vehicles | 551 (31.6%) | 412 (15.9%) |
| Total | 1,742 (100.0%) | 2,592 (100.0%) |
Real Estate & Mortgages in Little Ferry borough
Real Estate and Mortgage Overview in Little Ferry borough
| Characteristic | Without Mortgage | With Mortgage |
| Housing Units | 680 | 1,062 |
| Median Property Value | $396,400 | $386,100 |
| Median Household Income | $49,674 | $375 |
| Monthly Housing Costs | $1,314 | $542 |
| Real Estate Taxes | $10,001 | $12 |
Property Value by Mortgage Status in Little Ferry borough
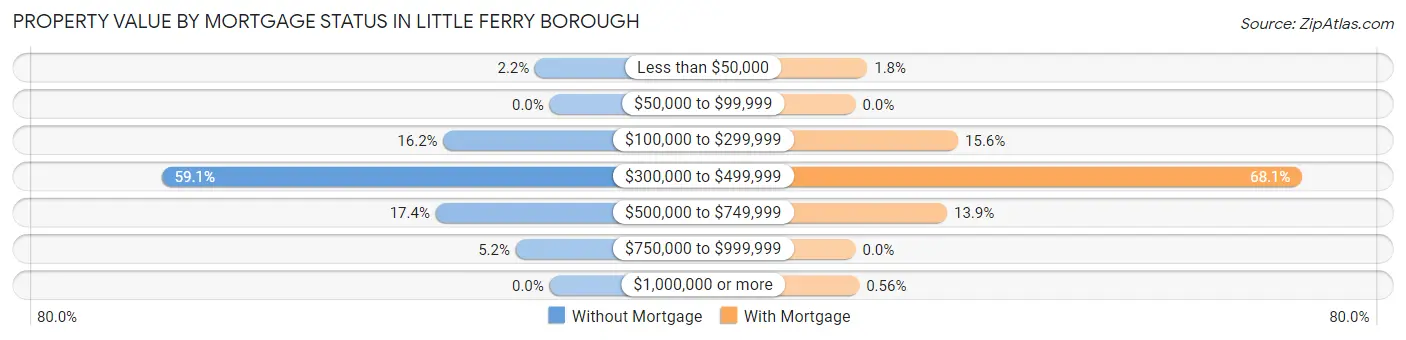
| Property Value | Without Mortgage | With Mortgage |
| Less than $50,000 | 15 (2.2%) | 19 (1.8%) |
| $50,000 to $99,999 | 0 (0.0%) | 0 (0.0%) |
| $100,000 to $299,999 | 110 (16.2%) | 166 (15.6%) |
| $300,000 to $499,999 | 402 (59.1%) | 723 (68.1%) |
| $500,000 to $749,999 | 118 (17.3%) | 148 (13.9%) |
| $750,000 to $999,999 | 35 (5.1%) | 0 (0.0%) |
| $1,000,000 or more | 0 (0.0%) | 6 (0.6%) |
| Total | 680 (100.0%) | 1,062 (100.0%) |
Household Income by Mortgage Status in Little Ferry borough
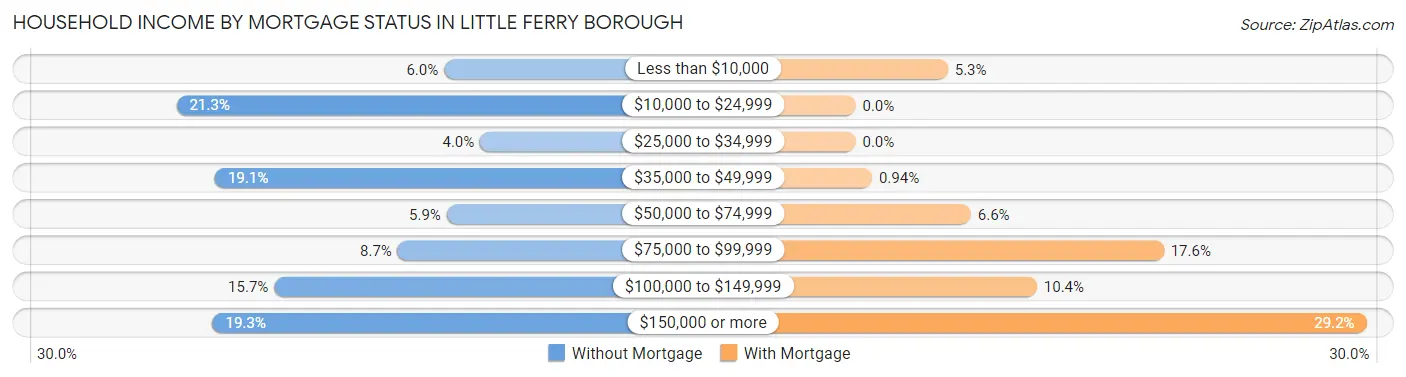
| Household Income | Without Mortgage | With Mortgage |
| Less than $10,000 | 41 (6.0%) | 56 (5.3%) |
| $10,000 to $24,999 | 145 (21.3%) | 0 (0.0%) |
| $25,000 to $34,999 | 27 (4.0%) | 0 (0.0%) |
| $35,000 to $49,999 | 130 (19.1%) | 10 (0.9%) |
| $50,000 to $74,999 | 40 (5.9%) | 70 (6.6%) |
| $75,000 to $99,999 | 59 (8.7%) | 187 (17.6%) |
| $100,000 to $149,999 | 107 (15.7%) | 110 (10.4%) |
| $150,000 or more | 131 (19.3%) | 310 (29.2%) |
| Total | 680 (100.0%) | 1,062 (100.0%) |
Property Value to Household Income Ratio in Little Ferry borough
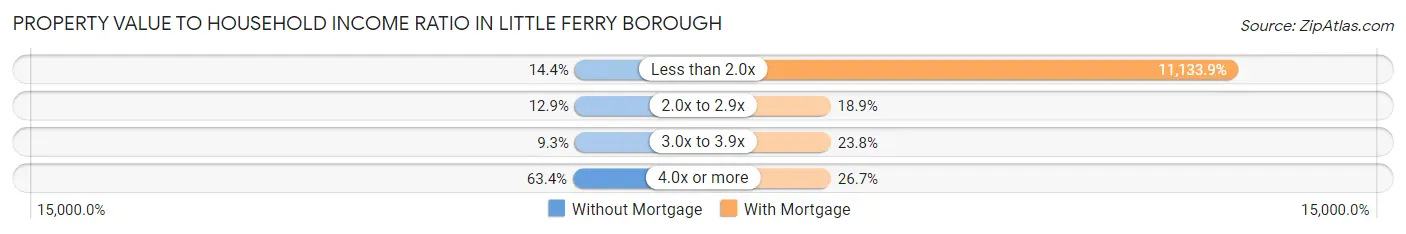
| Value-to-Income Ratio | Without Mortgage | With Mortgage |
| Less than 2.0x | 98 (14.4%) | 118,242 (11,133.9%) |
| 2.0x to 2.9x | 88 (12.9%) | 201 (18.9%) |
| 3.0x to 3.9x | 63 (9.3%) | 253 (23.8%) |
| 4.0x or more | 431 (63.4%) | 284 (26.7%) |
| Total | 680 (100.0%) | 1,062 (100.0%) |
Real Estate Taxes by Mortgage Status in Little Ferry borough
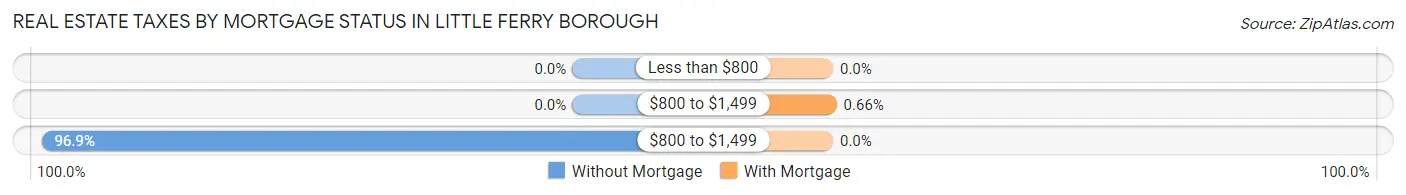
| Property Taxes | Without Mortgage | With Mortgage |
| Less than $800 | 0 (0.0%) | 0 (0.0%) |
| $800 to $1,499 | 0 (0.0%) | 7 (0.7%) |
| $800 to $1,499 | 659 (96.9%) | 0 (0.0%) |
| Total | 680 (100.0%) | 1,062 (100.0%) |
Health & Disability in Little Ferry borough
Health Insurance Coverage by Age in Little Ferry borough
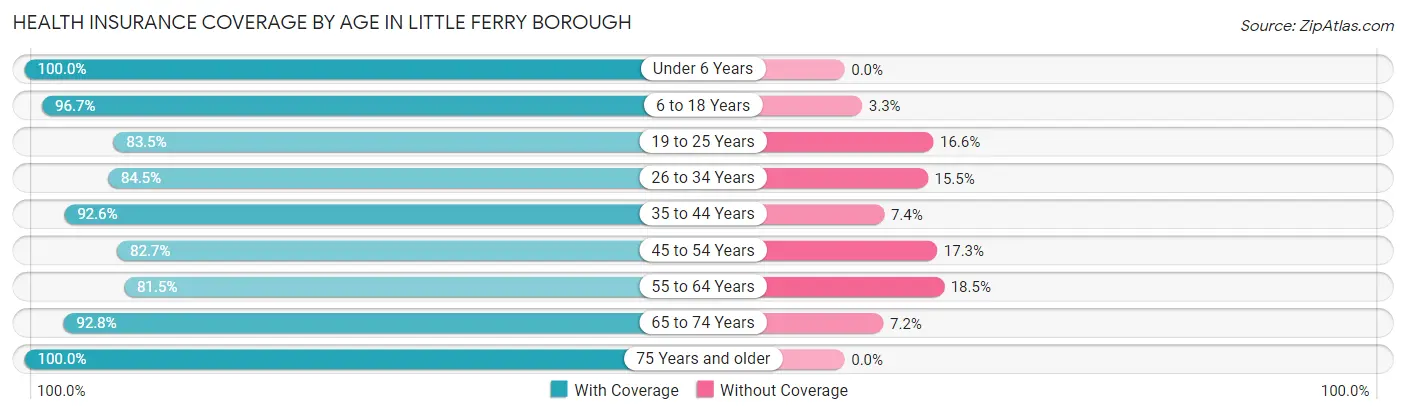
| Age Bracket | With Coverage | Without Coverage |
| Under 6 Years | 613 (100.0%) | 0 (0.0%) |
| 6 to 18 Years | 1,243 (96.7%) | 42 (3.3%) |
| 19 to 25 Years | 807 (83.5%) | 160 (16.6%) |
| 26 to 34 Years | 990 (84.5%) | 182 (15.5%) |
| 35 to 44 Years | 1,501 (92.6%) | 120 (7.4%) |
| 45 to 54 Years | 1,299 (82.7%) | 271 (17.3%) |
| 55 to 64 Years | 1,520 (81.5%) | 346 (18.5%) |
| 65 to 74 Years | 1,091 (92.8%) | 85 (7.2%) |
| 75 Years and older | 684 (100.0%) | 0 (0.0%) |
| Total | 9,748 (89.0%) | 1,206 (11.0%) |
Health Insurance Coverage by Citizenship Status in Little Ferry borough
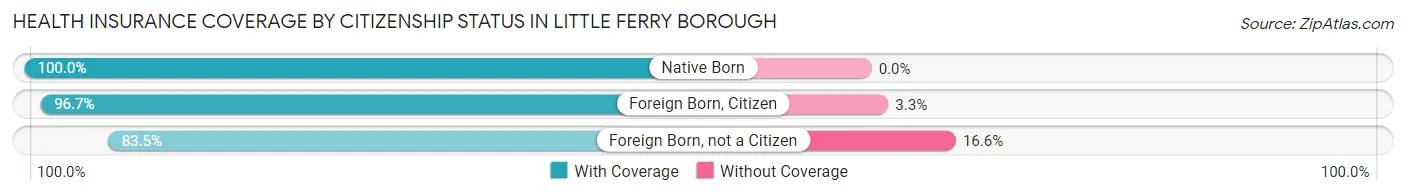
| Citizenship Status | With Coverage | Without Coverage |
| Native Born | 613 (100.0%) | 0 (0.0%) |
| Foreign Born, Citizen | 1,243 (96.7%) | 42 (3.3%) |
| Foreign Born, not a Citizen | 807 (83.5%) | 160 (16.6%) |
Health Insurance Coverage by Household Income in Little Ferry borough
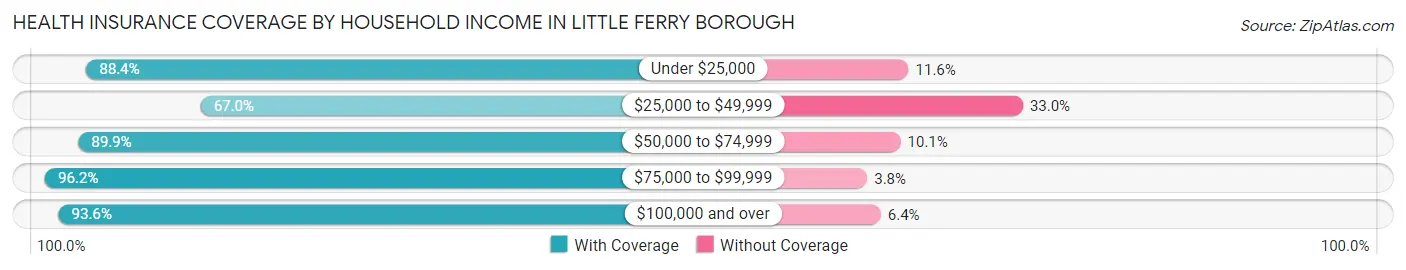
| Household Income | With Coverage | Without Coverage |
| Under $25,000 | 1,038 (88.4%) | 136 (11.6%) |
| $25,000 to $49,999 | 1,060 (67.0%) | 522 (33.0%) |
| $50,000 to $74,999 | 1,293 (89.9%) | 145 (10.1%) |
| $75,000 to $99,999 | 1,052 (96.2%) | 42 (3.8%) |
| $100,000 and over | 5,299 (93.6%) | 361 (6.4%) |
Public vs Private Health Insurance Coverage by Age in Little Ferry borough
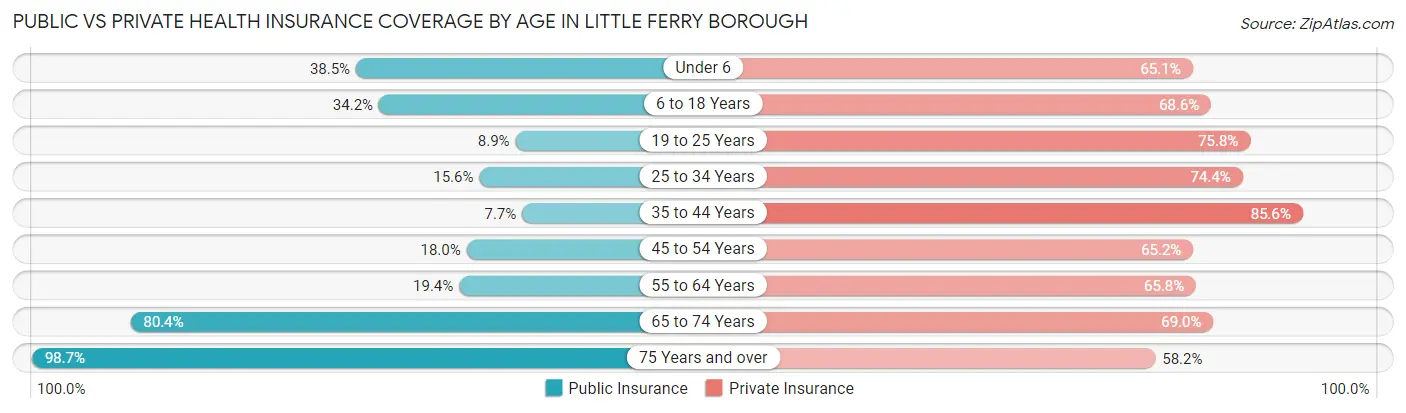
| Age Bracket | Public Insurance | Private Insurance |
| Under 6 | 236 (38.5%) | 399 (65.1%) |
| 6 to 18 Years | 440 (34.2%) | 881 (68.6%) |
| 19 to 25 Years | 86 (8.9%) | 733 (75.8%) |
| 25 to 34 Years | 183 (15.6%) | 872 (74.4%) |
| 35 to 44 Years | 124 (7.6%) | 1,387 (85.6%) |
| 45 to 54 Years | 282 (18.0%) | 1,024 (65.2%) |
| 55 to 64 Years | 361 (19.4%) | 1,227 (65.8%) |
| 65 to 74 Years | 945 (80.4%) | 811 (69.0%) |
| 75 Years and over | 675 (98.7%) | 398 (58.2%) |
| Total | 3,332 (30.4%) | 7,732 (70.6%) |
Disability Status by Sex by Age in Little Ferry borough
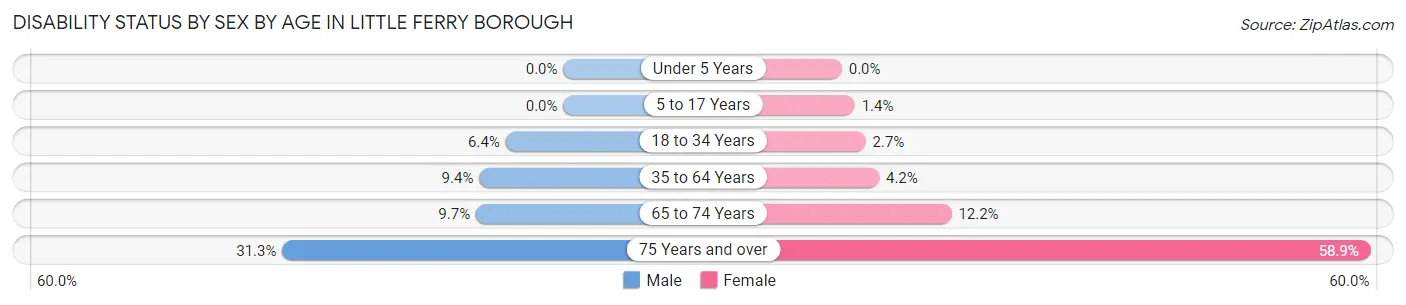
| Age Bracket | Male | Female |
| Under 5 Years | 0 (0.0%) | 0 (0.0%) |
| 5 to 17 Years | 0 (0.0%) | 10 (1.4%) |
| 18 to 34 Years | 82 (6.4%) | 28 (2.6%) |
| 35 to 64 Years | 223 (9.4%) | 111 (4.2%) |
| 65 to 74 Years | 73 (9.7%) | 52 (12.2%) |
| 75 Years and over | 77 (31.3%) | 258 (58.9%) |
Disability Class by Sex by Age in Little Ferry borough
Disability Class: Hearing Difficulty
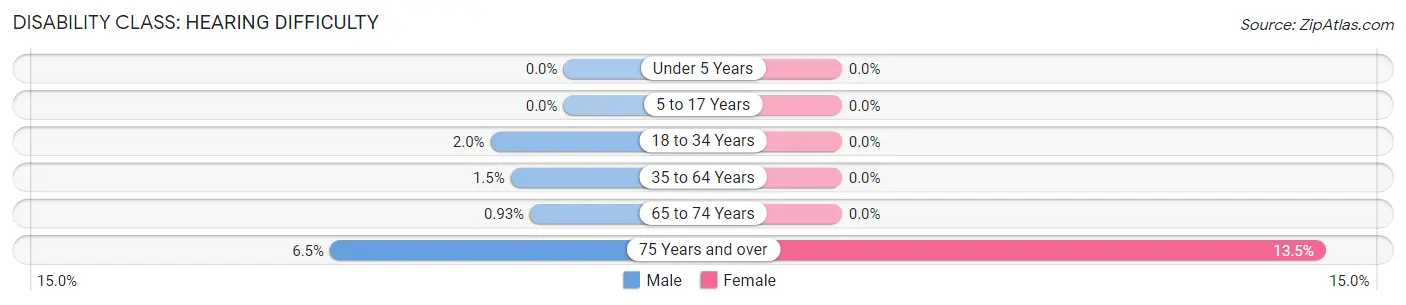
| Age Bracket | Male | Female |
| Under 5 Years | 0 (0.0%) | 0 (0.0%) |
| 5 to 17 Years | 0 (0.0%) | 0 (0.0%) |
| 18 to 34 Years | 26 (2.0%) | 0 (0.0%) |
| 35 to 64 Years | 35 (1.5%) | 0 (0.0%) |
| 65 to 74 Years | 7 (0.9%) | 0 (0.0%) |
| 75 Years and over | 16 (6.5%) | 59 (13.5%) |
Disability Class: Vision Difficulty
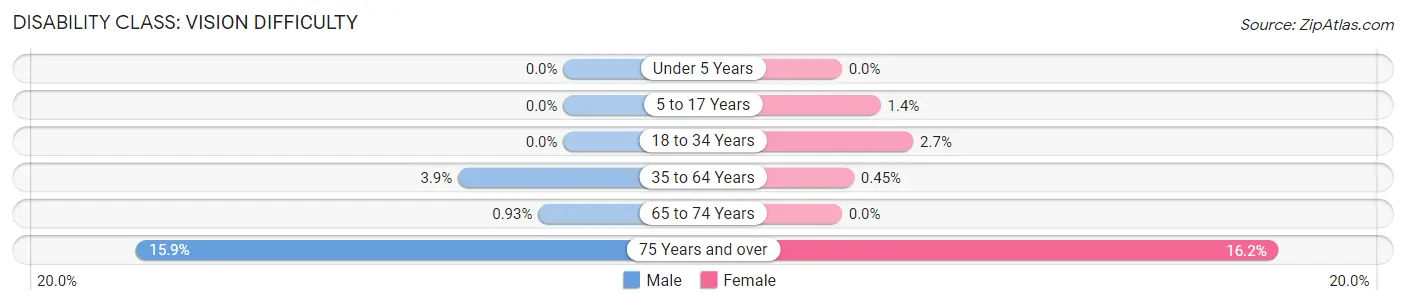
| Age Bracket | Male | Female |
| Under 5 Years | 0 (0.0%) | 0 (0.0%) |
| 5 to 17 Years | 0 (0.0%) | 10 (1.4%) |
| 18 to 34 Years | 0 (0.0%) | 28 (2.6%) |
| 35 to 64 Years | 93 (3.9%) | 12 (0.4%) |
| 65 to 74 Years | 7 (0.9%) | 0 (0.0%) |
| 75 Years and over | 39 (15.9%) | 71 (16.2%) |
Disability Class: Cognitive Difficulty
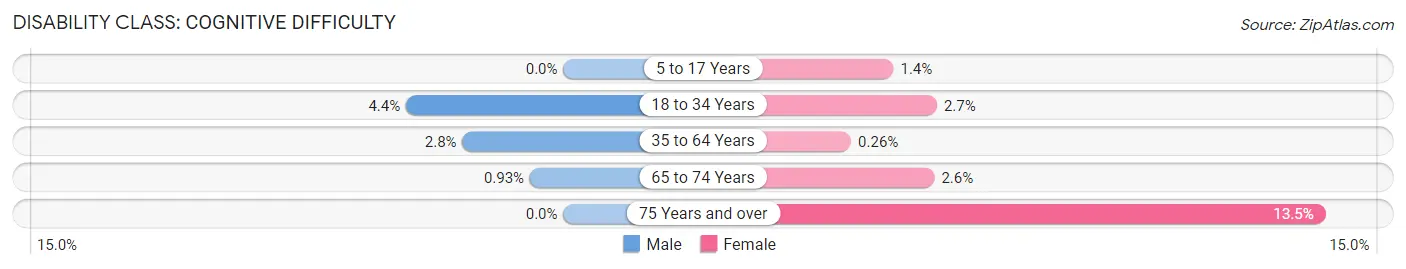
| Age Bracket | Male | Female |
| 5 to 17 Years | 0 (0.0%) | 10 (1.4%) |
| 18 to 34 Years | 56 (4.4%) | 28 (2.6%) |
| 35 to 64 Years | 67 (2.8%) | 7 (0.3%) |
| 65 to 74 Years | 7 (0.9%) | 11 (2.6%) |
| 75 Years and over | 0 (0.0%) | 59 (13.5%) |
Disability Class: Ambulatory Difficulty
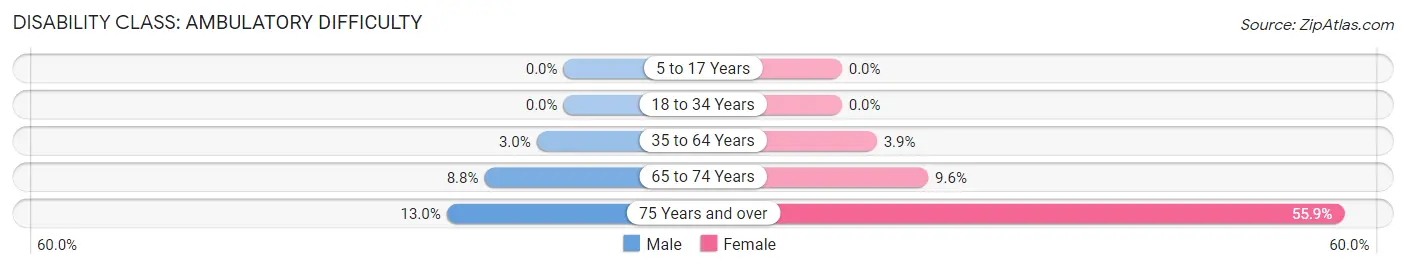
| Age Bracket | Male | Female |
| 5 to 17 Years | 0 (0.0%) | 0 (0.0%) |
| 18 to 34 Years | 0 (0.0%) | 0 (0.0%) |
| 35 to 64 Years | 71 (3.0%) | 104 (3.9%) |
| 65 to 74 Years | 66 (8.8%) | 41 (9.6%) |
| 75 Years and over | 32 (13.0%) | 245 (55.9%) |
Disability Class: Self-Care Difficulty
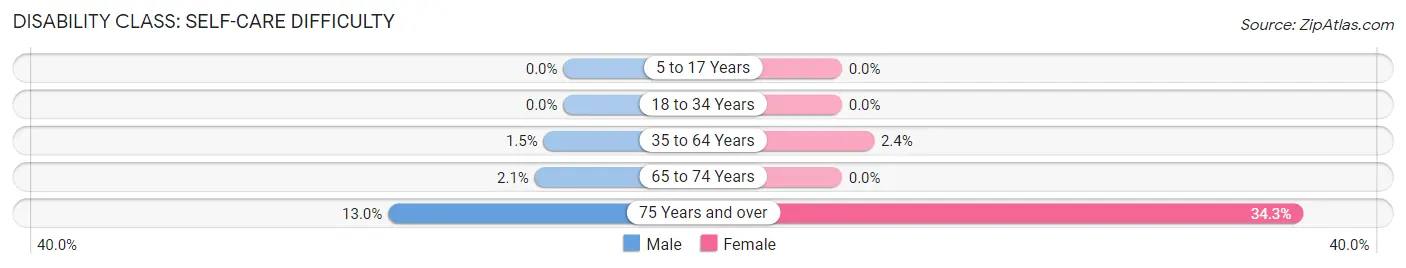
| Age Bracket | Male | Female |
| 5 to 17 Years | 0 (0.0%) | 0 (0.0%) |
| 18 to 34 Years | 0 (0.0%) | 0 (0.0%) |
| 35 to 64 Years | 35 (1.5%) | 64 (2.4%) |
| 65 to 74 Years | 16 (2.1%) | 0 (0.0%) |
| 75 Years and over | 32 (13.0%) | 150 (34.3%) |
Technology Access in Little Ferry borough
Computing Device Access in Little Ferry borough
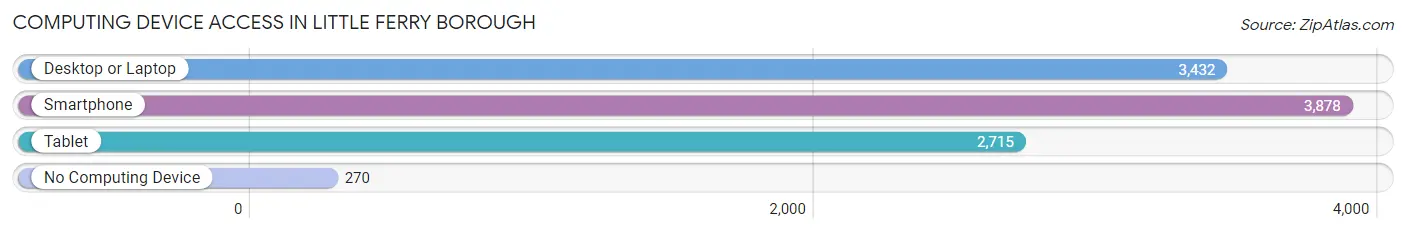
| Device Type | # Households | % Households |
| Desktop or Laptop | 3,432 | 79.2% |
| Smartphone | 3,878 | 89.5% |
| Tablet | 2,715 | 62.6% |
| No Computing Device | 270 | 6.2% |
| Total | 4,334 | 100.0% |
Internet Access in Little Ferry borough
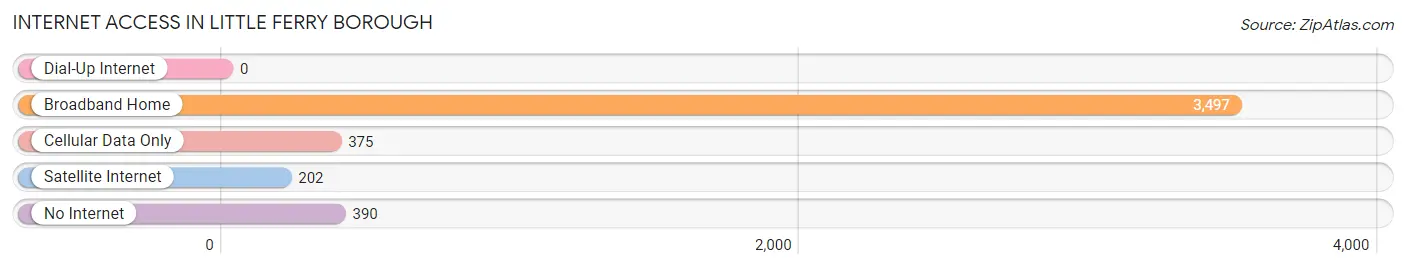
| Internet Type | # Households | % Households |
| Dial-Up Internet | 0 | 0.0% |
| Broadband Home | 3,497 | 80.7% |
| Cellular Data Only | 375 | 8.6% |
| Satellite Internet | 202 | 4.7% |
| No Internet | 390 | 9.0% |
| Total | 4,334 | 100.0% |
Little Ferry borough Summary
History
Little Ferry is a borough in Bergen County, New Jersey, United States. It is located along the Hackensack River, and is part of the New York metropolitan area. The borough was incorporated in 1894 from portions of Lodi Township.
Little Ferry was originally inhabited by the Lenni Lenape Native Americans. The first European settlers were Dutch farmers who arrived in the area in the late 17th century. The area was known as New Barbadoes Neck, and was part of the larger area of Bergen County.
In the early 19th century, the area was known as Little Ferry, and was a small farming community. The area was home to a ferry service that connected the Hackensack River with the Passaic River. The ferry service was operated by the Van Winkle family, who were among the first settlers in the area.
In 1894, Little Ferry was incorporated as a borough. The borough was named after the ferry service that operated in the area.
Geography
Little Ferry is located in Bergen County, New Jersey, United States. It is located along the Hackensack River, and is part of the New York metropolitan area. The borough is bordered by the boroughs of South Hackensack, Moonachie, and Ridgefield Park.
The borough has a total area of 1.3 square miles, all of which is land. The borough is located in the Hackensack River Valley, and is surrounded by wetlands and woodlands.
Economy
The economy of Little Ferry is largely based on manufacturing and retail. The borough is home to several manufacturing companies, including a plastics manufacturer, a metal fabricator, and a printing company.
The borough is also home to several retail stores, including a grocery store, a pharmacy, and a hardware store.
Demographics
As of the 2010 United States Census, there were 10,626 people, 4,072 households, and 2,717 families residing in the borough. The population density was 8,093.3 people per square mile. The racial makeup of the borough was 64.2% White, 4.3% African American, 0.3% Native American, 17.2% Asian, 0.1% Pacific Islander, 10.7% from other races, and 3.3% from two or more races. Hispanic or Latino of any race were 28.2% of the population.
The median income for a household in the borough was $60,938, and the median income for a family was $71,944. The per capita income for the borough was $27,945. About 8.2% of families and 10.2% of the population were below the poverty line, including 14.2% of those under age 18 and 8.2% of those age 65 or over.
Common Questions
What is Per Capita Income in Little Ferry borough?
Per Capita income in Little Ferry borough is $42,435.
What is the Median Family Income in Little Ferry borough?
Median Family Income in Little Ferry borough is $89,495.
What is the Median Household income in Little Ferry borough?
Median Household Income in Little Ferry borough is $72,722.
What is Income or Wage Gap in Little Ferry borough?
Income or Wage Gap in Little Ferry borough is 25.7%.
Women in Little Ferry borough earn 74.3 cents for every dollar earned by a man.
What is Inequality or Gini Index in Little Ferry borough?
Inequality or Gini Index in Little Ferry borough is 0.46.
What is the Total Population of Little Ferry borough?
Total Population of Little Ferry borough is 10,954.
What is the Total Male Population of Little Ferry borough?
Total Male Population of Little Ferry borough is 5,446.
What is the Total Female Population of Little Ferry borough?
Total Female Population of Little Ferry borough is 5,508.
What is the Ratio of Males per 100 Females in Little Ferry borough?
There are 98.87 Males per 100 Females in Little Ferry borough.
What is the Ratio of Females per 100 Males in Little Ferry borough?
There are 101.14 Females per 100 Males in Little Ferry borough.
What is the Median Population Age in Little Ferry borough?
Median Population Age in Little Ferry borough is 44.3 Years.
What is the Average Family Size in Little Ferry borough
Average Family Size in Little Ferry borough is 3.1 People.
What is the Average Household Size in Little Ferry borough
Average Household Size in Little Ferry borough is 2.5 People.
How Large is the Labor Force in Little Ferry borough?
There are 6,678 People in the Labor Forcein in Little Ferry borough.
What is the Percentage of People in the Labor Force in Little Ferry borough?
70.3% of People are in the Labor Force in Little Ferry borough.
What is the Unemployment Rate in Little Ferry borough?
Unemployment Rate in Little Ferry borough is 8.3%.