Mountainside borough, NJ Map & Demographics
Mountainside borough Overview
$79,245
PER CAPITA INCOME
$201,449
AVG FAMILY INCOME
$162,531
AVG HOUSEHOLD INCOME
41.6%
WAGE / INCOME GAP [ % ]
58.4¢/ $1
WAGE / INCOME GAP [ $ ]
0.45
INEQUALITY / GINI INDEX
6,991
TOTAL POPULATION
3,248
MALE POPULATION
3,743
FEMALE POPULATION
86.78
MALES / 100 FEMALES
115.24
FEMALES / 100 MALES
50.1
MEDIAN AGE
3.1
AVG FAMILY SIZE
2.7
AVG HOUSEHOLD SIZE
3,219
LABOR FORCE [ PEOPLE ]
57.6%
PERCENT IN LABOR FORCE
3.4%
UNEMPLOYMENT RATE
Income in Mountainside borough
Income Overview in Mountainside borough
Per Capita Income in Mountainside borough is $79,245, while median incomes of families and households are $201,449 and $162,531 respectively.
| Characteristic | Number | Measure |
| Per Capita Income | 6,991 | $79,245 |
| Median Family Income | 2,013 | $201,449 |
| Mean Family Income | 2,013 | $243,547 |
| Median Household Income | 2,537 | $162,531 |
| Mean Household Income | 2,537 | $214,930 |
| Income Deficit | 2,013 | $0 |
| Wage / Income Gap (%) | 6,991 | 41.58% |
| Wage / Income Gap ($) | 6,991 | 58.42¢ per $1 |
| Gini / Inequality Index | 6,991 | 0.45 |
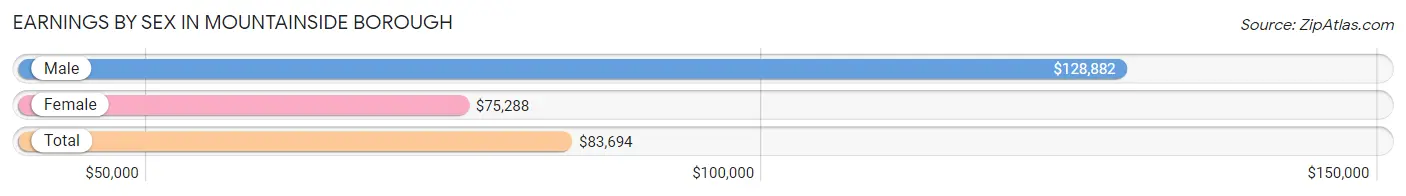
Earnings by Sex in Mountainside borough
Average Earnings in Mountainside borough are $83,694, $128,882 for men and $75,288 for women, a difference of 41.6%.
| Sex | Number | Average Earnings |
| Male | 1,765 (53.1%) | $128,882 |
| Female | 1,561 (46.9%) | $75,288 |
| Total | 3,326 (100.0%) | $83,694 |
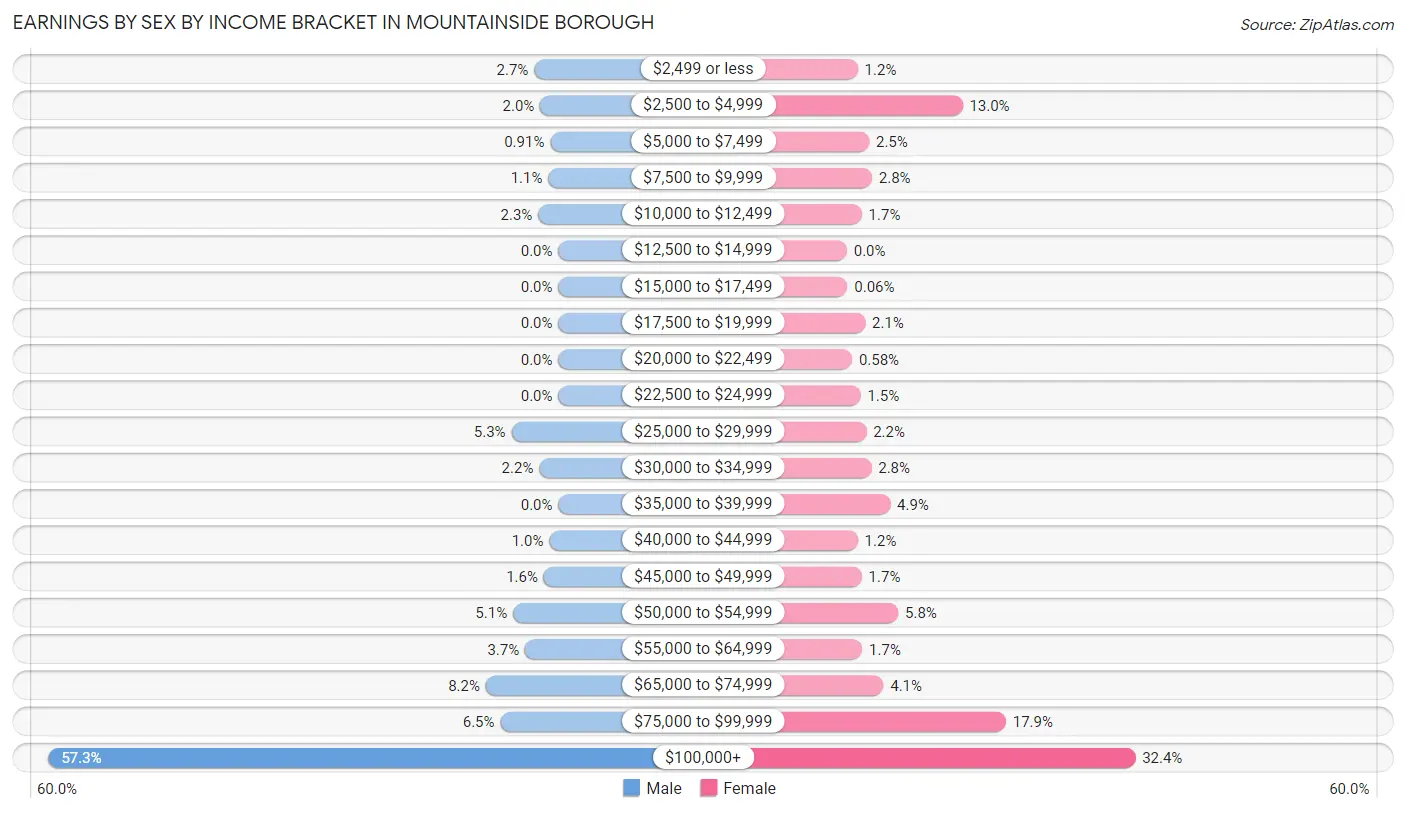
Earnings by Sex by Income Bracket in Mountainside borough
The most common earnings brackets in Mountainside borough are $100,000+ for men (1,012 | 57.3%) and $100,000+ for women (506 | 32.4%).
| Income | Male | Female |
| $2,499 or less | 48 (2.7%) | 19 (1.2%) |
| $2,500 to $4,999 | 36 (2.0%) | 203 (13.0%) |
| $5,000 to $7,499 | 16 (0.9%) | 39 (2.5%) |
| $7,500 to $9,999 | 20 (1.1%) | 44 (2.8%) |
| $10,000 to $12,499 | 40 (2.3%) | 26 (1.7%) |
| $12,500 to $14,999 | 0 (0.0%) | 0 (0.0%) |
| $15,000 to $17,499 | 0 (0.0%) | 1 (0.1%) |
| $17,500 to $19,999 | 0 (0.0%) | 32 (2.1%) |
| $20,000 to $22,499 | 0 (0.0%) | 9 (0.6%) |
| $22,500 to $24,999 | 0 (0.0%) | 24 (1.5%) |
| $25,000 to $29,999 | 93 (5.3%) | 34 (2.2%) |
| $30,000 to $34,999 | 38 (2.1%) | 43 (2.8%) |
| $35,000 to $39,999 | 0 (0.0%) | 76 (4.9%) |
| $40,000 to $44,999 | 18 (1.0%) | 19 (1.2%) |
| $45,000 to $49,999 | 29 (1.6%) | 26 (1.7%) |
| $50,000 to $54,999 | 90 (5.1%) | 90 (5.8%) |
| $55,000 to $64,999 | 66 (3.7%) | 27 (1.7%) |
| $65,000 to $74,999 | 144 (8.2%) | 64 (4.1%) |
| $75,000 to $99,999 | 115 (6.5%) | 279 (17.9%) |
| $100,000+ | 1,012 (57.3%) | 506 (32.4%) |
| Total | 1,765 (100.0%) | 1,561 (100.0%) |
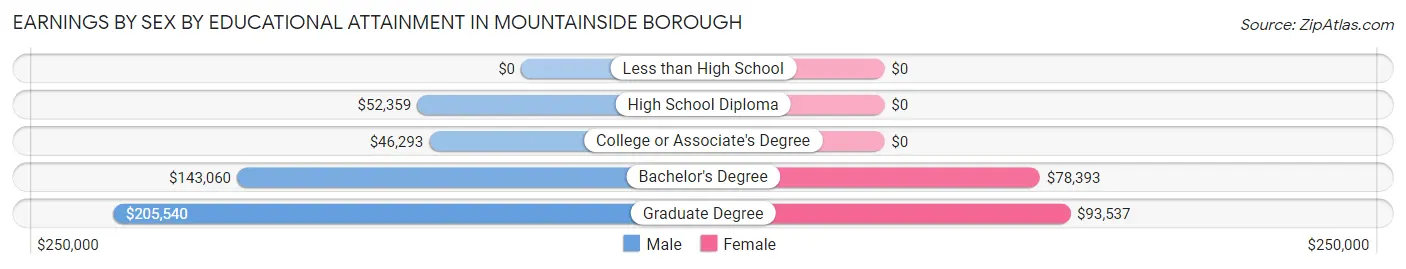
Earnings by Sex by Educational Attainment in Mountainside borough
Average earnings in Mountainside borough are $143,233 for men and $77,051 for women, a difference of 46.2%. Men with an educational attainment of graduate degree enjoy the highest average annual earnings of $205,540, while those with college or associate's degree education earn the least with $46,293. Women with an educational attainment of graduate degree earn the most with the average annual earnings of $93,537, while those with bachelor's degree education have the smallest earnings of $78,393.
| Educational Attainment | Male Income | Female Income |
| Less than High School | - | - |
| High School Diploma | $52,359 | $0 |
| College or Associate's Degree | $46,293 | $0 |
| Bachelor's Degree | $143,060 | $78,393 |
| Graduate Degree | $205,540 | $93,537 |
| Total | $143,233 | $77,051 |
Family Income in Mountainside borough
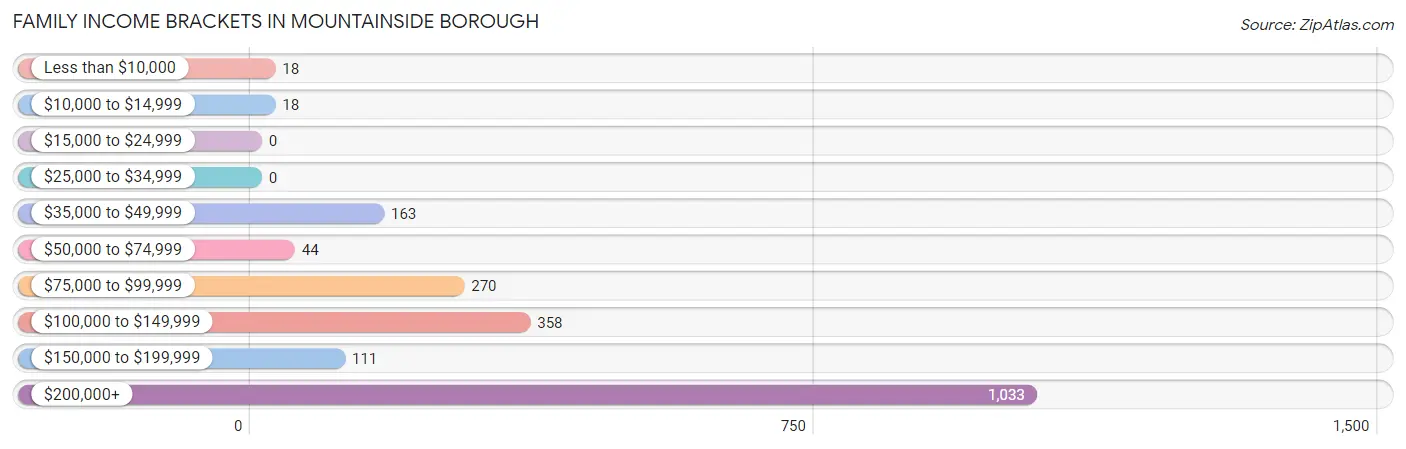
Family Income Brackets in Mountainside borough
According to the Mountainside borough family income data, there are 1,033 families falling into the $200,000+ income range, which is the most common income bracket and makes up 51.3% of all families.
| Income Bracket | # Families | % Families |
| Less than $10,000 | 18 | 0.9% |
| $10,000 to $14,999 | 18 | 0.9% |
| $15,000 to $24,999 | 0 | 0.0% |
| $25,000 to $34,999 | 0 | 0.0% |
| $35,000 to $49,999 | 163 | 8.1% |
| $50,000 to $74,999 | 44 | 2.2% |
| $75,000 to $99,999 | 270 | 13.4% |
| $100,000 to $149,999 | 358 | 17.8% |
| $150,000 to $199,999 | 111 | 5.5% |
| $200,000+ | 1,033 | 51.3% |
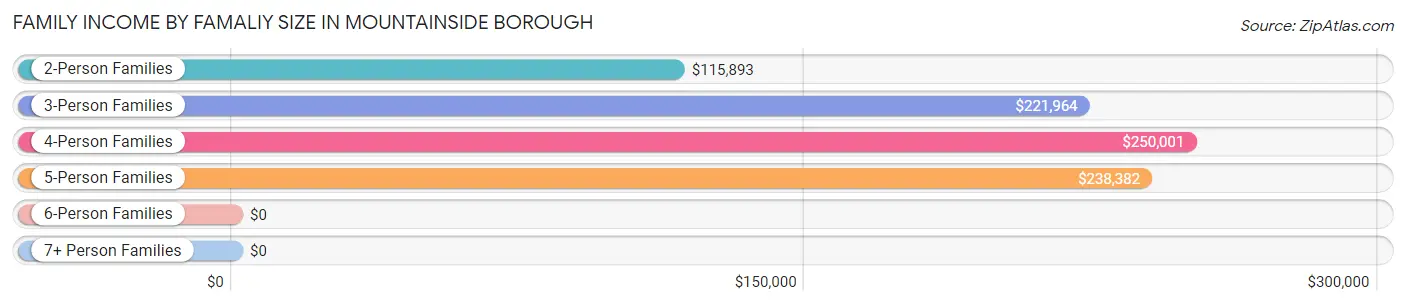
Family Income by Famaliy Size in Mountainside borough
4-person families (349 | 17.3%) account for the highest median family income in Mountainside borough with $250,001 per family, while 3-person families (452 | 22.5%) have the highest median income of $73,988 per family member.
| Income Bracket | # Families | Median Income |
| 2-Person Families | 855 (42.5%) | $115,893 |
| 3-Person Families | 452 (22.5%) | $221,964 |
| 4-Person Families | 349 (17.3%) | $250,001 |
| 5-Person Families | 357 (17.7%) | $238,382 |
| 6-Person Families | 0 (0.0%) | $0 |
| 7+ Person Families | 0 (0.0%) | $0 |
| Total | 2,013 (100.0%) | $201,449 |
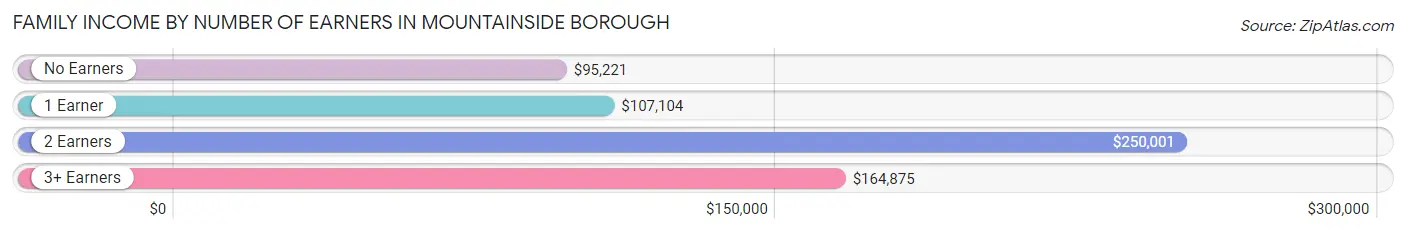
Family Income by Number of Earners in Mountainside borough
The median family income in Mountainside borough is $201,449, with families comprising 2 earners (1,011) having the highest median family income of $250,001, while families with no earners (203) have the lowest median family income of $95,221, accounting for 50.2% and 10.1% of families, respectively.
| Number of Earners | # Families | Median Income |
| No Earners | 203 (10.1%) | $95,221 |
| 1 Earner | 673 (33.4%) | $107,104 |
| 2 Earners | 1,011 (50.2%) | $250,001 |
| 3+ Earners | 126 (6.3%) | $164,875 |
| Total | 2,013 (100.0%) | $201,449 |
Household Income in Mountainside borough
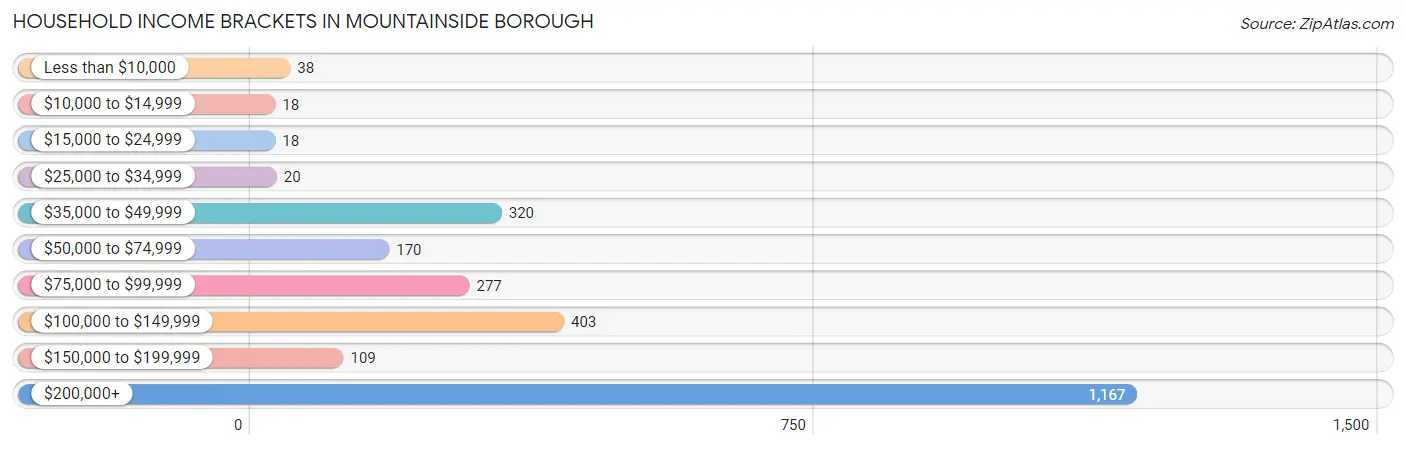
Household Income Brackets in Mountainside borough
With 1,167 households falling in the category, the $200,000+ income range is the most frequent in Mountainside borough, accounting for 46.0% of all households. In contrast, only 18 households (0.7%) fall into the $10,000 to $14,999 income bracket, making it the least populous group.
| Income Bracket | # Households | % Households |
| Less than $10,000 | 38 | 1.5% |
| $10,000 to $14,999 | 18 | 0.7% |
| $15,000 to $24,999 | 18 | 0.7% |
| $25,000 to $34,999 | 20 | 0.8% |
| $35,000 to $49,999 | 320 | 12.6% |
| $50,000 to $74,999 | 170 | 6.7% |
| $75,000 to $99,999 | 277 | 10.9% |
| $100,000 to $149,999 | 403 | 15.9% |
| $150,000 to $199,999 | 109 | 4.3% |
| $200,000+ | 1,167 | 46.0% |
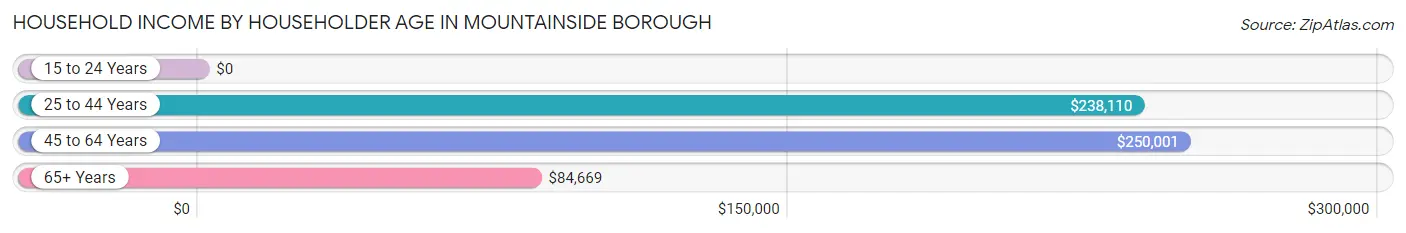
Household Income by Householder Age in Mountainside borough
The median household income in Mountainside borough is $162,531, with the highest median household income of $250,001 found in the 45 to 64 years age bracket for the primary householder. A total of 949 households (37.4%) fall into this category.
| Income Bracket | # Households | Median Income |
| 15 to 24 Years | 0 (0.0%) | $0 |
| 25 to 44 Years | 571 (22.5%) | $238,110 |
| 45 to 64 Years | 949 (37.4%) | $250,001 |
| 65+ Years | 1,017 (40.1%) | $84,669 |
| Total | 2,537 (100.0%) | $162,531 |
Poverty in Mountainside borough
Income Below Poverty by Sex and Age in Mountainside borough
With 2.6% poverty level for males and 2.3% for females among the residents of Mountainside borough, 18 to 24 year old males and 75 year old and over females are the most vulnerable to poverty, with 27 males (35.5%) and 27 females (7.0%) in their respective age groups living below the poverty level.
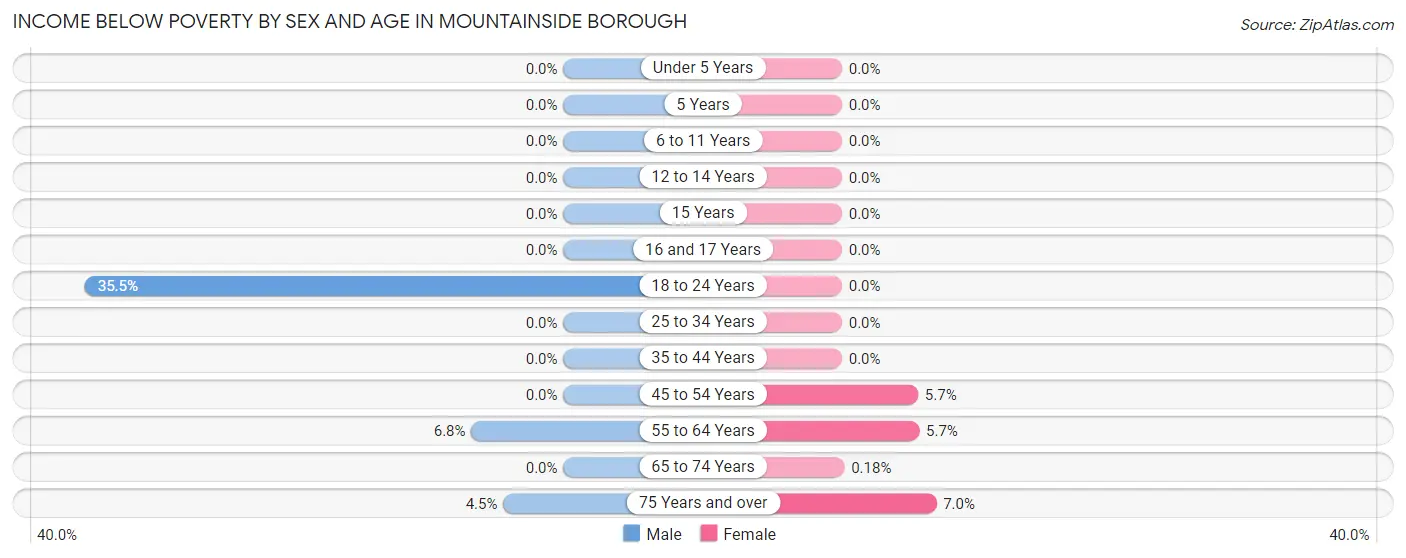
| Age Bracket | Male | Female |
| Under 5 Years | 0 (0.0%) | 0 (0.0%) |
| 5 Years | 0 (0.0%) | 0 (0.0%) |
| 6 to 11 Years | 0 (0.0%) | 0 (0.0%) |
| 12 to 14 Years | 0 (0.0%) | 0 (0.0%) |
| 15 Years | 0 (0.0%) | 0 (0.0%) |
| 16 and 17 Years | 0 (0.0%) | 0 (0.0%) |
| 18 to 24 Years | 27 (35.5%) | 0 (0.0%) |
| 25 to 34 Years | 0 (0.0%) | 0 (0.0%) |
| 35 to 44 Years | 0 (0.0%) | 0 (0.0%) |
| 45 to 54 Years | 0 (0.0%) | 20 (5.7%) |
| 55 to 64 Years | 38 (6.8%) | 35 (5.7%) |
| 65 to 74 Years | 0 (0.0%) | 1 (0.2%) |
| 75 Years and over | 18 (4.5%) | 27 (7.0%) |
| Total | 83 (2.6%) | 83 (2.3%) |
Income Above Poverty by Sex and Age in Mountainside borough
According to the poverty statistics in Mountainside borough, males aged under 5 years and females aged under 5 years are the age groups that are most secure financially, with 100.0% of males and 100.0% of females in these age groups living above the poverty line.
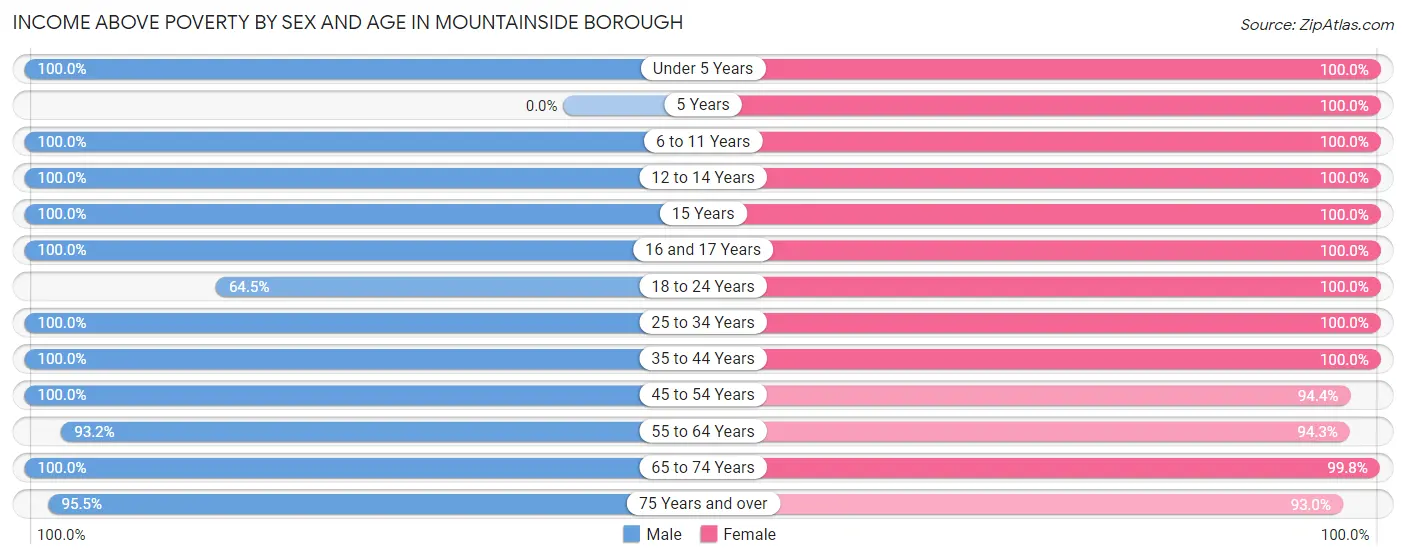
| Age Bracket | Male | Female |
| Under 5 Years | 169 (100.0%) | 448 (100.0%) |
| 5 Years | 0 (0.0%) | 12 (100.0%) |
| 6 to 11 Years | 298 (100.0%) | 218 (100.0%) |
| 12 to 14 Years | 67 (100.0%) | 70 (100.0%) |
| 15 Years | 35 (100.0%) | 72 (100.0%) |
| 16 and 17 Years | 163 (100.0%) | 117 (100.0%) |
| 18 to 24 Years | 49 (64.5%) | 202 (100.0%) |
| 25 to 34 Years | 53 (100.0%) | 150 (100.0%) |
| 35 to 44 Years | 494 (100.0%) | 476 (100.0%) |
| 45 to 54 Years | 523 (100.0%) | 334 (94.4%) |
| 55 to 64 Years | 518 (93.2%) | 575 (94.3%) |
| 65 to 74 Years | 378 (100.0%) | 543 (99.8%) |
| 75 Years and over | 386 (95.5%) | 358 (93.0%) |
| Total | 3,133 (97.4%) | 3,575 (97.7%) |
Income Below Poverty Among Married-Couple Families in Mountainside borough
The poverty statistics for married-couple families in Mountainside borough show that 2.0% or 37 of the total 1,889 families live below the poverty line. Families with no children have the highest poverty rate of 3.6%, comprising of 37 families. On the other hand, families with 1 or 2 children have the lowest poverty rate of 0.0%, which includes 0 families.
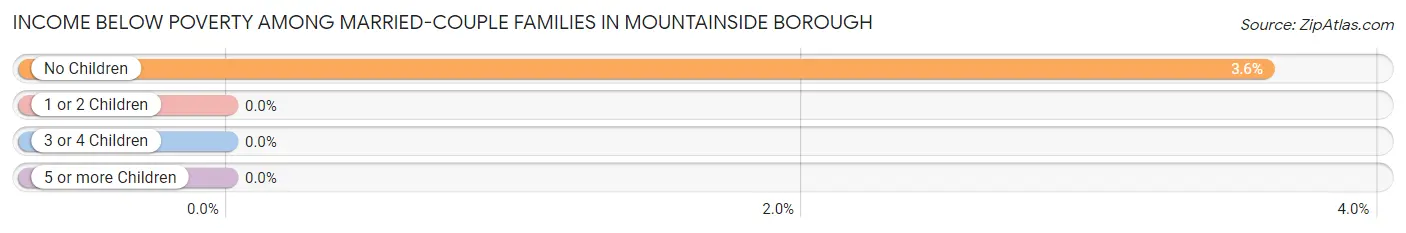
| Children | Above Poverty | Below Poverty |
| No Children | 989 (96.4%) | 37 (3.6%) |
| 1 or 2 Children | 697 (100.0%) | 0 (0.0%) |
| 3 or 4 Children | 166 (100.0%) | 0 (0.0%) |
| 5 or more Children | 0 (0.0%) | 0 (0.0%) |
| Total | 1,852 (98.0%) | 37 (2.0%) |
Income Below Poverty Among Single-Parent Households in Mountainside borough
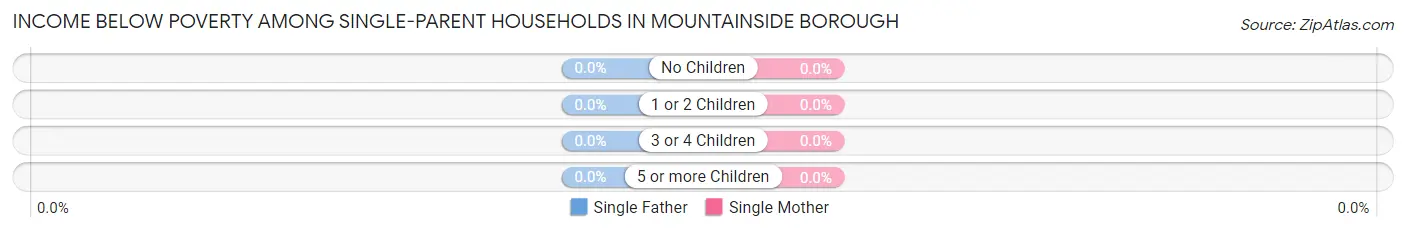
| Children | Single Father | Single Mother |
| No Children | 0 (0.0%) | 0 (0.0%) |
| 1 or 2 Children | 0 (0.0%) | 0 (0.0%) |
| 3 or 4 Children | 0 (0.0%) | 0 (0.0%) |
| 5 or more Children | 0 (0.0%) | 0 (0.0%) |
| Total | 0 (0.0%) | 0 (0.0%) |
Income Below Poverty Among Married-Couple vs Single-Parent Households in Mountainside borough
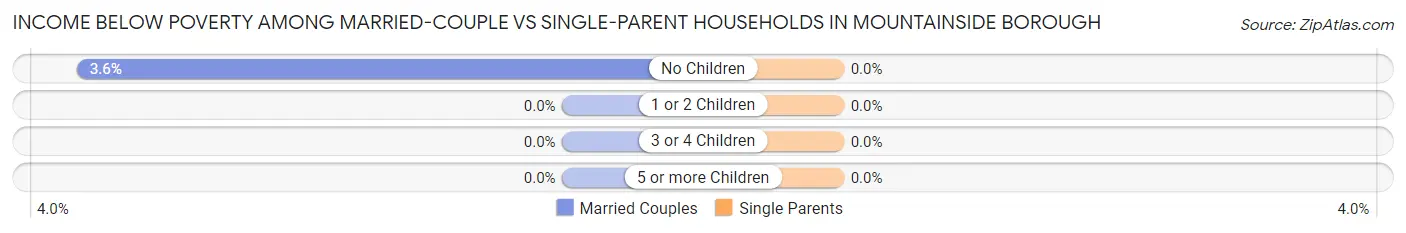
| Children | Married-Couple Families | Single-Parent Households |
| No Children | 37 (3.6%) | 0 (0.0%) |
| 1 or 2 Children | 0 (0.0%) | 0 (0.0%) |
| 3 or 4 Children | 0 (0.0%) | 0 (0.0%) |
| 5 or more Children | 0 (0.0%) | 0 (0.0%) |
| Total | 37 (2.0%) | 0 (0.0%) |
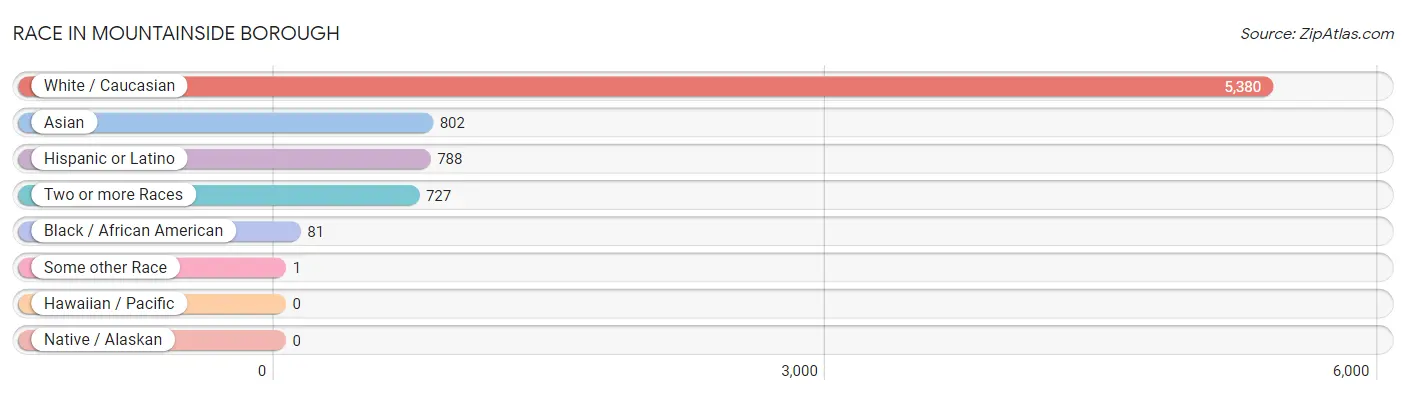
Race in Mountainside borough
The most populous races in Mountainside borough are White / Caucasian (5,380 | 77.0%), Asian (802 | 11.5%), and Hispanic or Latino (788 | 11.3%).
| Race | # Population | % Population |
| Asian | 802 | 11.5% |
| Black / African American | 81 | 1.2% |
| Hawaiian / Pacific | 0 | 0.0% |
| Hispanic or Latino | 788 | 11.3% |
| Native / Alaskan | 0 | 0.0% |
| White / Caucasian | 5,380 | 77.0% |
| Two or more Races | 727 | 10.4% |
| Some other Race | 1 | 0.0% |
| Total | 6,991 | 100.0% |
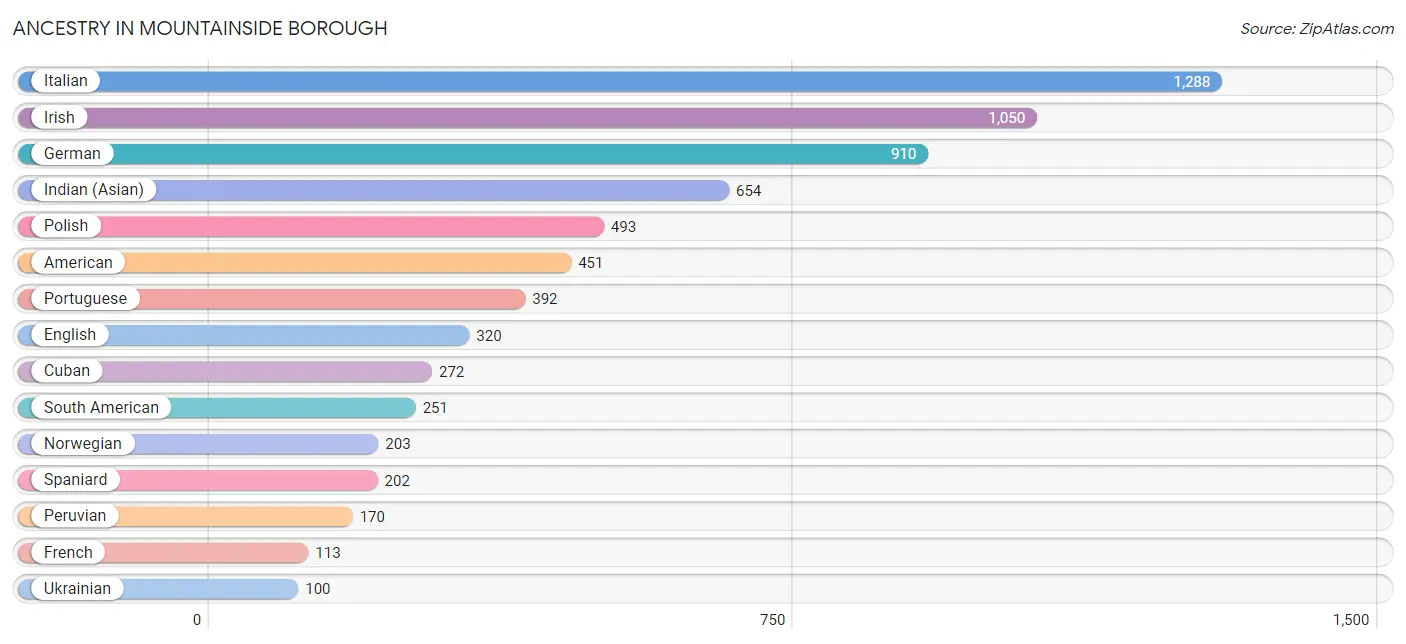
Ancestry in Mountainside borough
The most populous ancestries reported in Mountainside borough are Italian (1,288 | 18.4%), Irish (1,050 | 15.0%), German (910 | 13.0%), Indian (Asian) (654 | 9.3%), and Polish (493 | 7.0%), together accounting for 62.9% of all Mountainside borough residents.
| Ancestry | # Population | % Population |
| American | 451 | 6.5% |
| Armenian | 36 | 0.5% |
| Austrian | 13 | 0.2% |
| Bhutanese | 43 | 0.6% |
| Bolivian | 19 | 0.3% |
| Brazilian | 1 | 0.0% |
| British | 77 | 1.1% |
| British West Indian | 56 | 0.8% |
| Burmese | 65 | 0.9% |
| Cuban | 272 | 3.9% |
| Czech | 26 | 0.4% |
| Danish | 69 | 1.0% |
| Dominican | 11 | 0.2% |
| Dutch | 10 | 0.1% |
| Eastern European | 71 | 1.0% |
| English | 320 | 4.6% |
| European | 79 | 1.1% |
| Filipino | 38 | 0.5% |
| French | 113 | 1.6% |
| French Canadian | 13 | 0.2% |
| German | 910 | 13.0% |
| Greek | 65 | 0.9% |
| Hungarian | 72 | 1.0% |
| Indian (Asian) | 654 | 9.3% |
| Irish | 1,050 | 15.0% |
| Italian | 1,288 | 18.4% |
| Korean | 74 | 1.1% |
| Lithuanian | 58 | 0.8% |
| Maltese | 26 | 0.4% |
| Mexican | 12 | 0.2% |
| Norwegian | 203 | 2.9% |
| Peruvian | 170 | 2.4% |
| Polish | 493 | 7.0% |
| Portuguese | 392 | 5.6% |
| Puerto Rican | 21 | 0.3% |
| Russian | 85 | 1.2% |
| Scotch-Irish | 67 | 1.0% |
| Scottish | 44 | 0.6% |
| Slovak | 46 | 0.7% |
| South American | 251 | 3.6% |
| Spaniard | 202 | 2.9% |
| Spanish | 17 | 0.2% |
| Swedish | 43 | 0.6% |
| Thai | 76 | 1.1% |
| Trinidadian and Tobagonian | 19 | 0.3% |
| Ukrainian | 100 | 1.4% |
| Venezuelan | 24 | 0.3% |
| Welsh | 25 | 0.4% | View All 48 Rows |
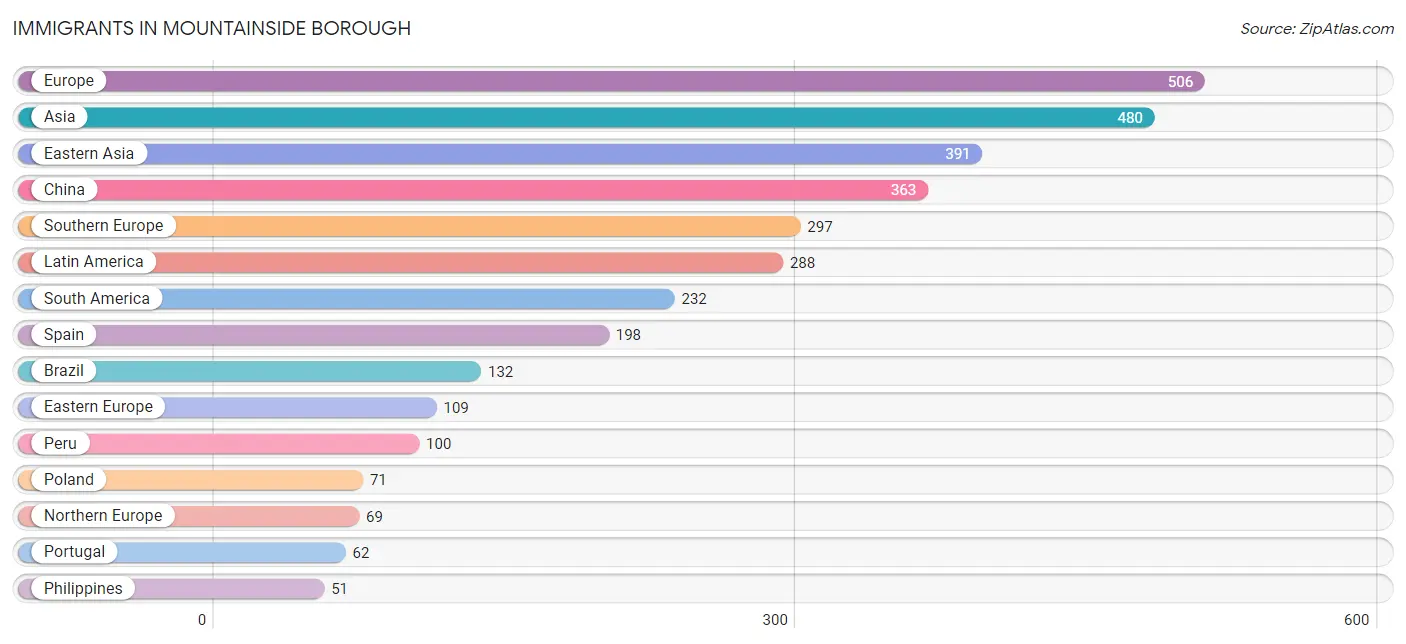
Immigrants in Mountainside borough
The most numerous immigrant groups reported in Mountainside borough came from Europe (506 | 7.2%), Asia (480 | 6.9%), Eastern Asia (391 | 5.6%), China (363 | 5.2%), and Southern Europe (297 | 4.3%), together accounting for 29.1% of all Mountainside borough residents.
| Immigration Origin | # Population | % Population |
| Asia | 480 | 6.9% |
| Brazil | 132 | 1.9% |
| Caribbean | 44 | 0.6% |
| Central America | 12 | 0.2% |
| China | 363 | 5.2% |
| Cuba | 33 | 0.5% |
| Czechoslovakia | 13 | 0.2% |
| Dominican Republic | 11 | 0.2% |
| Eastern Asia | 391 | 5.6% |
| Eastern Europe | 109 | 1.6% |
| El Salvador | 2 | 0.0% |
| Europe | 506 | 7.2% |
| France | 31 | 0.4% |
| Greece | 19 | 0.3% |
| Hong Kong | 13 | 0.2% |
| India | 38 | 0.5% |
| Ireland | 7 | 0.1% |
| Italy | 18 | 0.3% |
| Japan | 11 | 0.2% |
| Korea | 17 | 0.2% |
| Latin America | 288 | 4.1% |
| Mexico | 10 | 0.1% |
| Northern Europe | 69 | 1.0% |
| Peru | 100 | 1.4% |
| Philippines | 51 | 0.7% |
| Poland | 71 | 1.0% |
| Portugal | 62 | 0.9% |
| Russia | 25 | 0.4% |
| South America | 232 | 3.3% |
| South Central Asia | 38 | 0.5% |
| South Eastern Asia | 51 | 0.7% |
| Southern Europe | 297 | 4.3% |
| Spain | 198 | 2.8% |
| Taiwan | 13 | 0.2% |
| Western Europe | 31 | 0.4% | View All 35 Rows |
Sex and Age in Mountainside borough
Sex and Age in Mountainside borough
The most populous age groups in Mountainside borough are 60 to 64 Years (333 | 10.2%) for men and Under 5 Years (451 | 12.0%) for women.
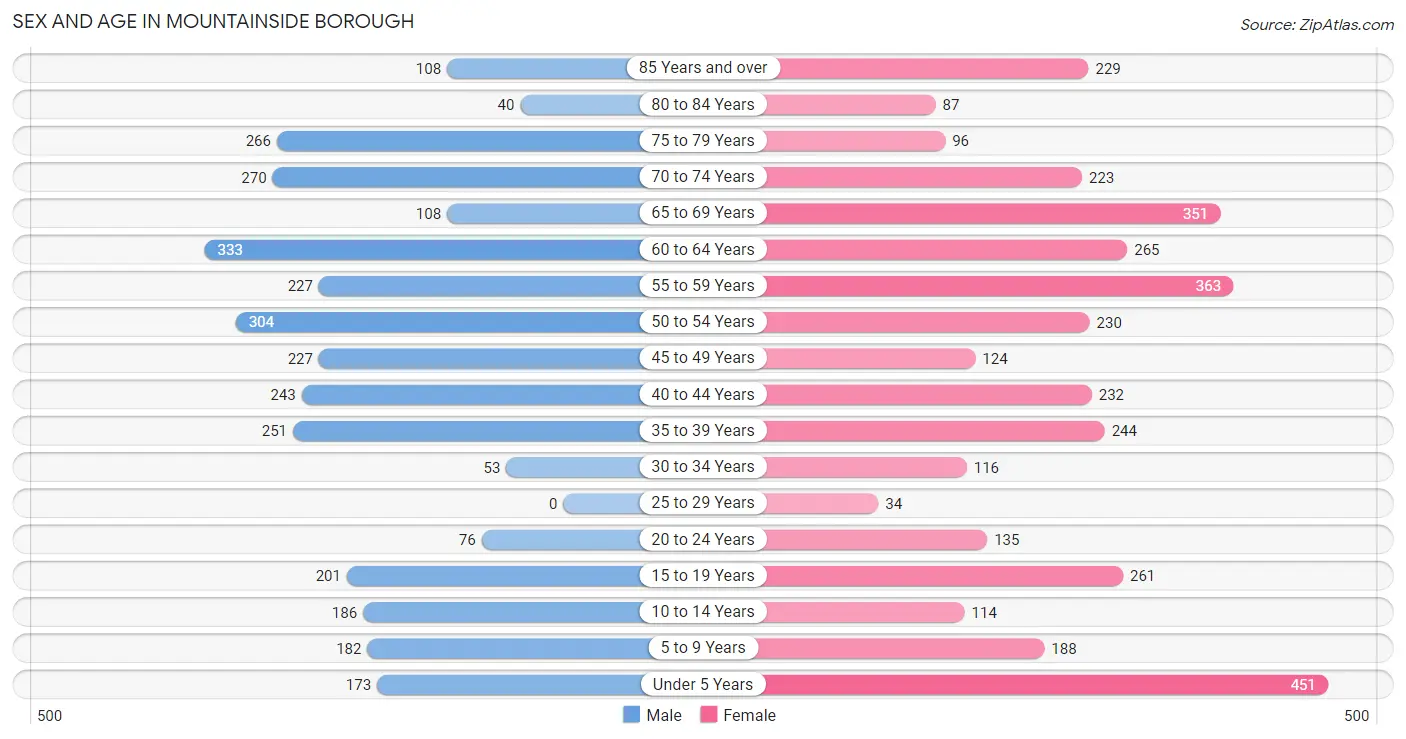
| Age Bracket | Male | Female |
| Under 5 Years | 173 (5.3%) | 451 (12.0%) |
| 5 to 9 Years | 182 (5.6%) | 188 (5.0%) |
| 10 to 14 Years | 186 (5.7%) | 114 (3.0%) |
| 15 to 19 Years | 201 (6.2%) | 261 (7.0%) |
| 20 to 24 Years | 76 (2.3%) | 135 (3.6%) |
| 25 to 29 Years | 0 (0.0%) | 34 (0.9%) |
| 30 to 34 Years | 53 (1.6%) | 116 (3.1%) |
| 35 to 39 Years | 251 (7.7%) | 244 (6.5%) |
| 40 to 44 Years | 243 (7.5%) | 232 (6.2%) |
| 45 to 49 Years | 227 (7.0%) | 124 (3.3%) |
| 50 to 54 Years | 304 (9.4%) | 230 (6.1%) |
| 55 to 59 Years | 227 (7.0%) | 363 (9.7%) |
| 60 to 64 Years | 333 (10.2%) | 265 (7.1%) |
| 65 to 69 Years | 108 (3.3%) | 351 (9.4%) |
| 70 to 74 Years | 270 (8.3%) | 223 (6.0%) |
| 75 to 79 Years | 266 (8.2%) | 96 (2.6%) |
| 80 to 84 Years | 40 (1.2%) | 87 (2.3%) |
| 85 Years and over | 108 (3.3%) | 229 (6.1%) |
| Total | 3,248 (100.0%) | 3,743 (100.0%) |
Families and Households in Mountainside borough
Median Family Size in Mountainside borough
The median family size in Mountainside borough is 3.09 persons per family, with married-couple families (1,889 | 93.8%) accounting for the largest median family size of 3.14 persons per family. On the other hand, single male/father families (12 | 0.6%) represent the smallest median family size with 1.92 persons per family.
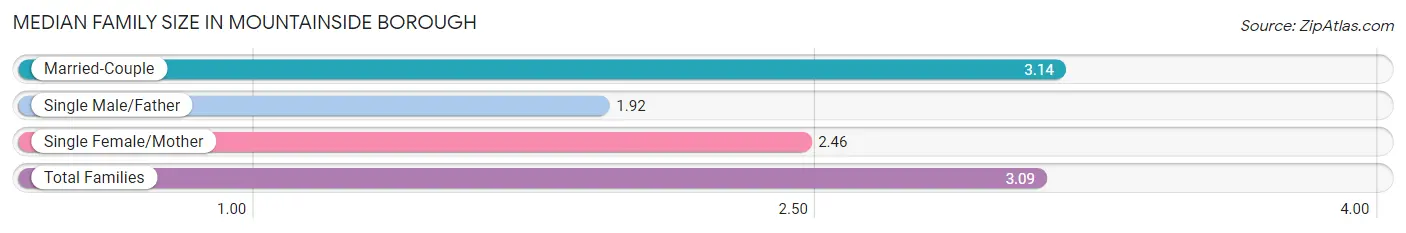
| Family Type | # Families | Family Size |
| Married-Couple | 1,889 (93.8%) | 3.14 |
| Single Male/Father | 12 (0.6%) | 1.92 |
| Single Female/Mother | 112 (5.6%) | 2.46 |
| Total Families | 2,013 (100.0%) | 3.09 |
Median Household Size in Mountainside borough
The median household size in Mountainside borough is 2.70 persons per household, with married-couple households (1,889 | 74.5%) accounting for the largest median household size of 3.15 persons per household. non-family households (524 | 20.6%) represent the smallest median household size with 1.13 persons per household.
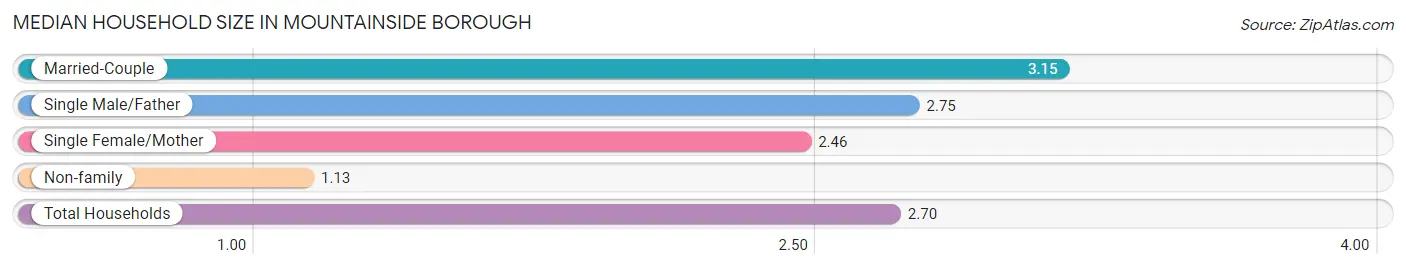
| Household Type | # Households | Household Size |
| Married-Couple | 1,889 (74.5%) | 3.15 |
| Single Male/Father | 12 (0.5%) | 2.75 |
| Single Female/Mother | 112 (4.4%) | 2.46 |
| Non-family | 524 (20.6%) | 1.13 |
| Total Households | 2,537 (100.0%) | 2.70 |
Household Size by Marriage Status in Mountainside borough
Out of a total of 2,537 households in Mountainside borough, 2,013 (79.3%) are family households, while 524 (20.6%) are nonfamily households. The most numerous type of family households are 2-person households, comprising 843, and the most common type of nonfamily households are 1-person households, comprising 474.
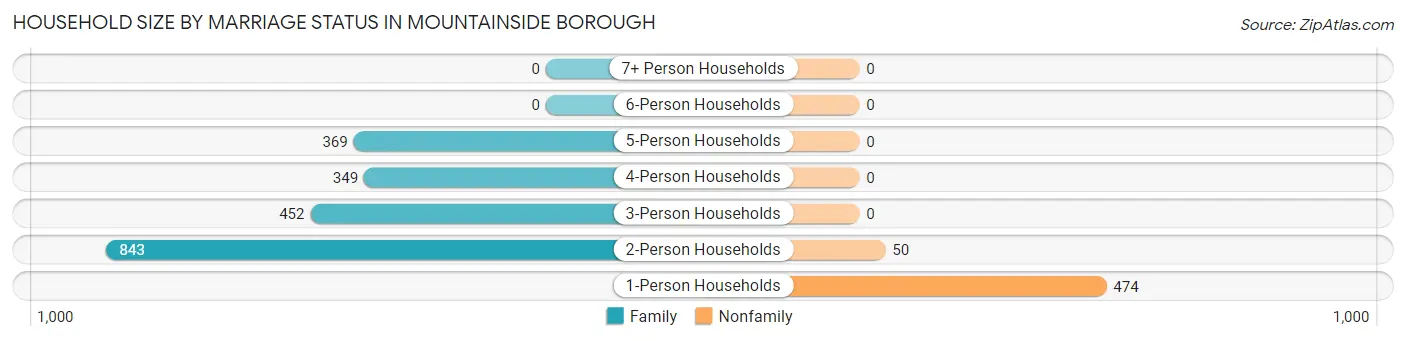
| Household Size | Family Households | Nonfamily Households |
| 1-Person Households | - | 474 (18.7%) |
| 2-Person Households | 843 (33.2%) | 50 (2.0%) |
| 3-Person Households | 452 (17.8%) | 0 (0.0%) |
| 4-Person Households | 349 (13.8%) | 0 (0.0%) |
| 5-Person Households | 369 (14.5%) | 0 (0.0%) |
| 6-Person Households | 0 (0.0%) | 0 (0.0%) |
| 7+ Person Households | 0 (0.0%) | 0 (0.0%) |
| Total | 2,013 (79.3%) | 524 (20.6%) |
Female Fertility in Mountainside borough
Fertility by Age in Mountainside borough
Average fertility rate in Mountainside borough is 135.0 births per 1,000 women. Women in the age bracket of 35 to 50 years have the highest fertility rate with 205.0 births per 1,000 women. Women in the age bracket of 35 to 50 years acount for 83.6% of all women with births.
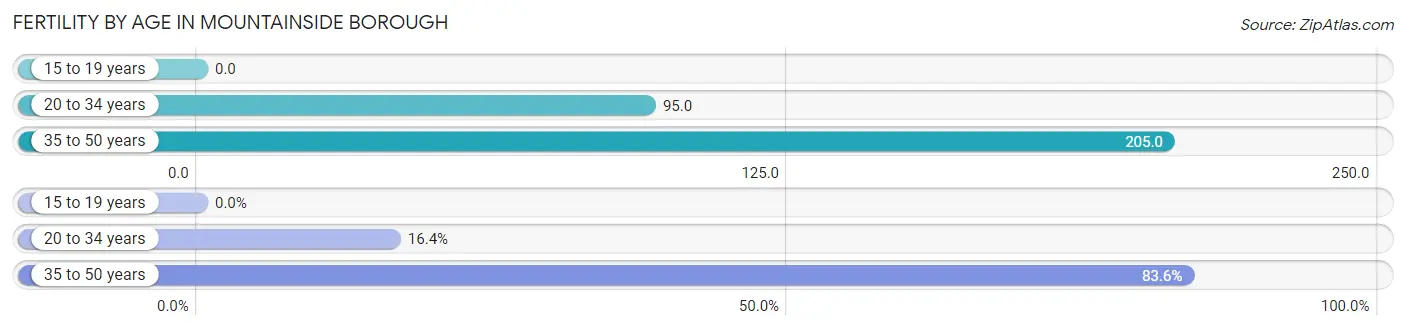
| Age Bracket | Women with Births | Births / 1,000 Women |
| 15 to 19 years | 0 (0.0%) | 0.0 |
| 20 to 34 years | 27 (16.4%) | 95.0 |
| 35 to 50 years | 138 (83.6%) | 205.0 |
| Total | 165 (100.0%) | 135.0 |
Fertility by Age by Marriage Status in Mountainside borough
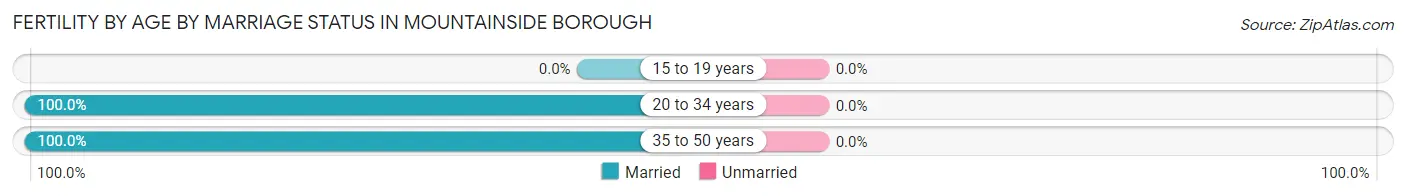
| Age Bracket | Married | Unmarried |
| 15 to 19 years | 0 (0.0%) | 0 (0.0%) |
| 20 to 34 years | 27 (100.0%) | 0 (0.0%) |
| 35 to 50 years | 138 (100.0%) | 0 (0.0%) |
| Total | 165 (100.0%) | 0 (0.0%) |
Fertility by Education in Mountainside borough
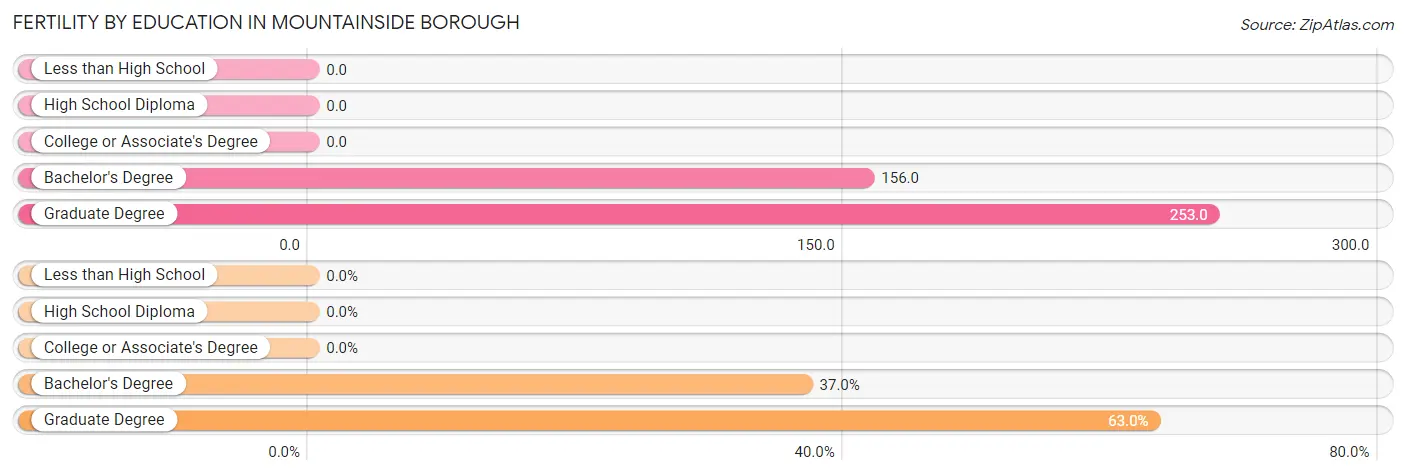
| Educational Attainment | Women with Births | Births / 1,000 Women |
| Less than High School | 0 (0.0%) | 0.0 |
| High School Diploma | 0 (0.0%) | 0.0 |
| College or Associate's Degree | 0 (0.0%) | 0.0 |
| Bachelor's Degree | 61 (37.0%) | 156.0 |
| Graduate Degree | 104 (63.0%) | 253.0 |
| Total | 165 (100.0%) | 135.0 |
Fertility by Education by Marriage Status in Mountainside borough
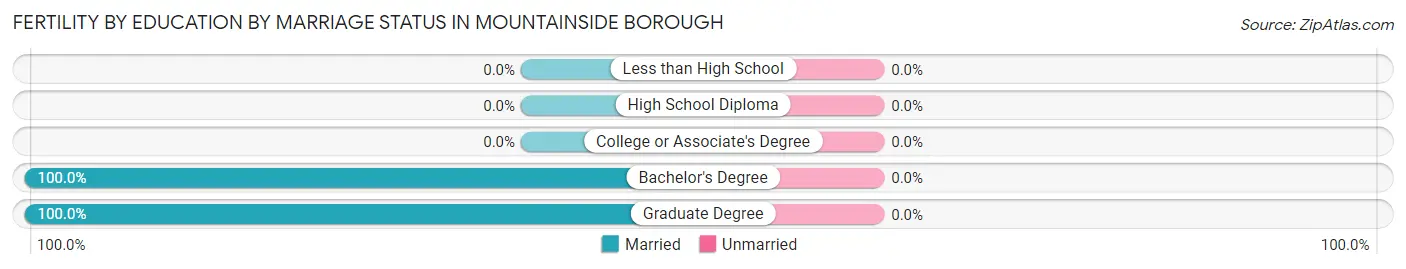
| Educational Attainment | Married | Unmarried |
| Less than High School | 0 (0.0%) | 0 (0.0%) |
| High School Diploma | 0 (0.0%) | 0 (0.0%) |
| College or Associate's Degree | 0 (0.0%) | 0 (0.0%) |
| Bachelor's Degree | 61 (100.0%) | 0 (0.0%) |
| Graduate Degree | 104 (100.0%) | 0 (0.0%) |
| Total | 165 (100.0%) | 0 (0.0%) |
Employment Characteristics in Mountainside borough
Employment by Class of Employer in Mountainside borough
Among the 3,098 employed individuals in Mountainside borough, private company employees (2,045 | 66.0%), local government employees (245 | 7.9%), and self-employed (incorporated) (238 | 7.7%) make up the most common classes of employment.
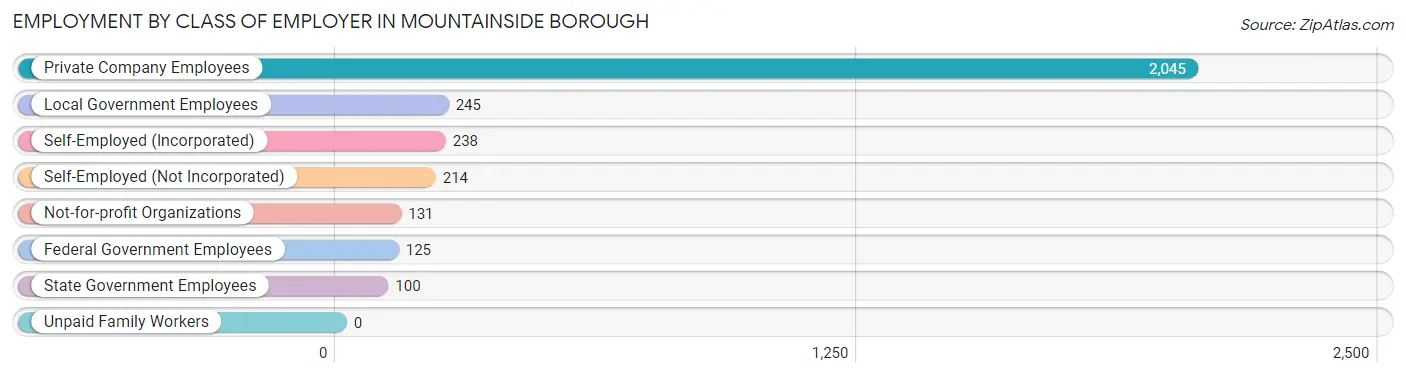
| Employer Class | # Employees | % Employees |
| Private Company Employees | 2,045 | 66.0% |
| Self-Employed (Incorporated) | 238 | 7.7% |
| Self-Employed (Not Incorporated) | 214 | 6.9% |
| Not-for-profit Organizations | 131 | 4.2% |
| Local Government Employees | 245 | 7.9% |
| State Government Employees | 100 | 3.2% |
| Federal Government Employees | 125 | 4.0% |
| Unpaid Family Workers | 0 | 0.0% |
| Total | 3,098 | 100.0% |
Employment Status by Age in Mountainside borough
According to the labor force statistics for Mountainside borough, out of the total population over 16 years of age (5,588), 57.6% or 3,219 individuals are in the labor force, with 3.4% or 109 of them unemployed. The age group with the highest labor force participation rate is 25 to 29 years, with 100.0% or 34 individuals in the labor force. Within the labor force, the 20 to 24 years age range has the highest percentage of unemployed individuals, with 28.9% or 44 of them being unemployed.
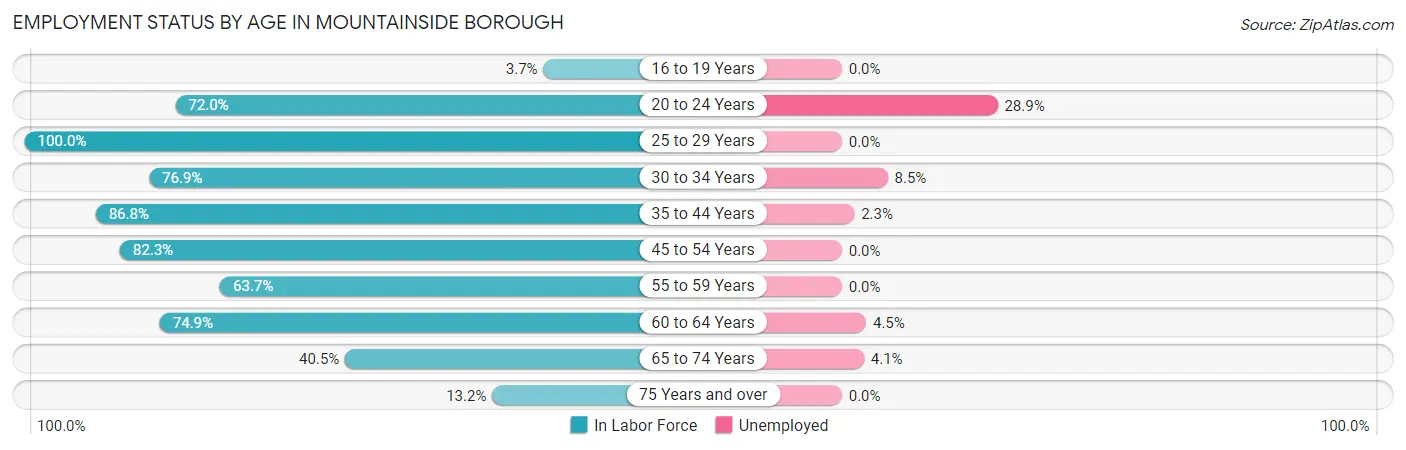
| Age Bracket | In Labor Force | Unemployed |
| 16 to 19 Years | 13 (3.7%) | 0 (0.0%) |
| 20 to 24 Years | 152 (72.0%) | 44 (28.9%) |
| 25 to 29 Years | 34 (100.0%) | 0 (0.0%) |
| 30 to 34 Years | 130 (76.9%) | 11 (8.5%) |
| 35 to 44 Years | 842 (86.8%) | 19 (2.3%) |
| 45 to 54 Years | 728 (82.3%) | 0 (0.0%) |
| 55 to 59 Years | 376 (63.7%) | 0 (0.0%) |
| 60 to 64 Years | 448 (74.9%) | 20 (4.5%) |
| 65 to 74 Years | 386 (40.5%) | 16 (4.1%) |
| 75 Years and over | 109 (13.2%) | 0 (0.0%) |
| Total | 3,219 (57.6%) | 109 (3.4%) |
Employment Status by Educational Attainment in Mountainside borough
According to labor force statistics for Mountainside borough, 78.8% of individuals (2,558) out of the total population between 25 and 64 years of age (3,246) are in the labor force, with 2.0% or 51 of them being unemployed. The group with the highest labor force participation rate are those with the educational attainment of bachelor's degree or higher, with 86.4% or 2,112 individuals in the labor force. Within the labor force, individuals with bachelor's degree or higher education have the highest percentage of unemployment, with 2.4% or 51 of them being unemployed.
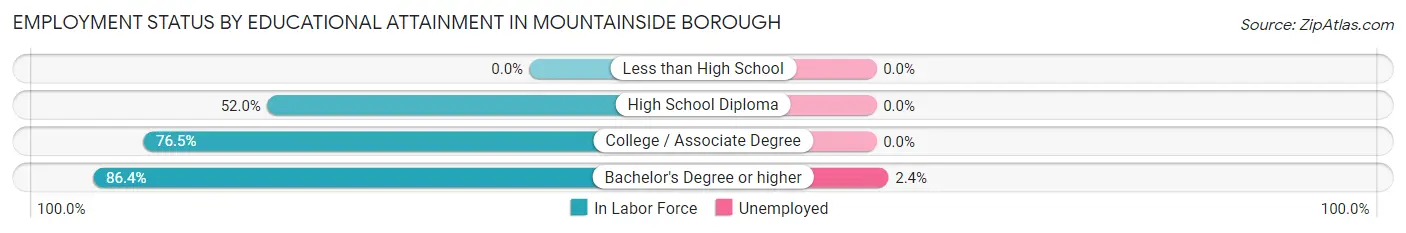
| Educational Attainment | In Labor Force | Unemployed |
| Less than High School | 0 (0.0%) | 0 (0.0%) |
| High School Diploma | 144 (52.0%) | 0 (0.0%) |
| College / Associate Degree | 303 (76.5%) | 0 (0.0%) |
| Bachelor's Degree or higher | 2,112 (86.4%) | 59 (2.4%) |
| Total | 2,558 (78.8%) | 65 (2.0%) |
Employment Occupations by Sex in Mountainside borough
Management, Business, Science and Arts Occupations
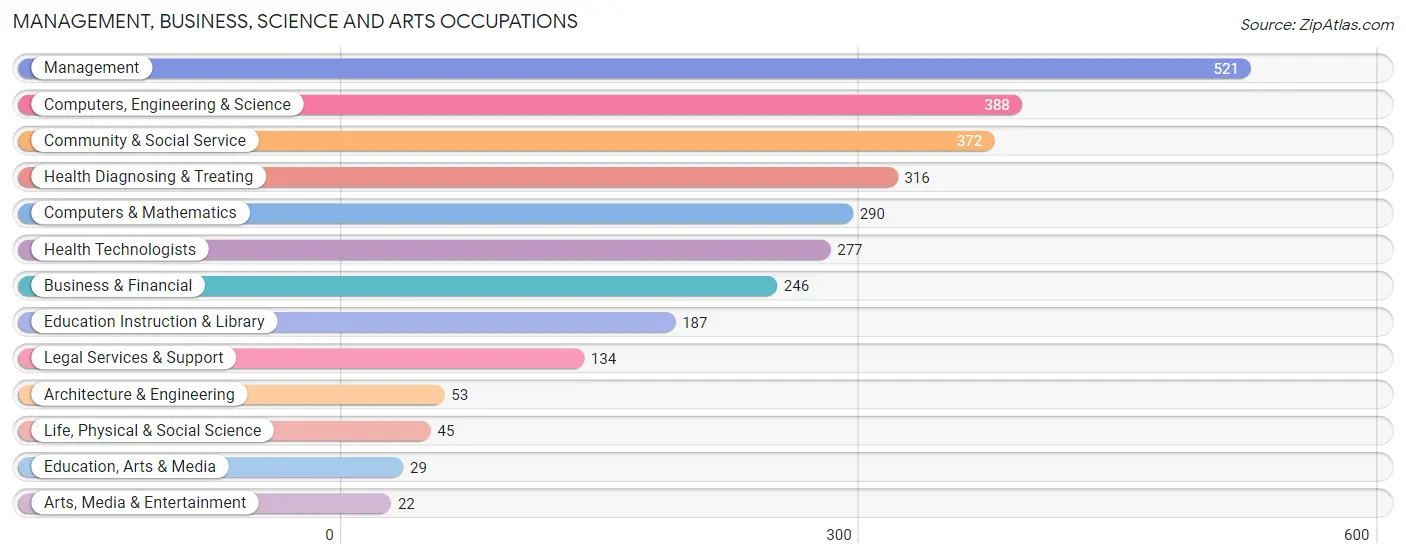
The most common Management, Business, Science and Arts occupations in Mountainside borough are Management (521 | 16.8%), Computers, Engineering & Science (388 | 12.5%), Community & Social Service (372 | 12.0%), Health Diagnosing & Treating (316 | 10.2%), and Computers & Mathematics (290 | 9.3%).
Management, Business, Science and Arts Occupations by Sex
Within the Management, Business, Science and Arts occupations in Mountainside borough, the most male-oriented occupations are Architecture & Engineering (100.0%), Arts, Media & Entertainment (100.0%), and Legal Services & Support (78.4%), while the most female-oriented occupations are Life, Physical & Social Science (100.0%), Education, Arts & Media (89.7%), and Education Instruction & Library (84.0%).
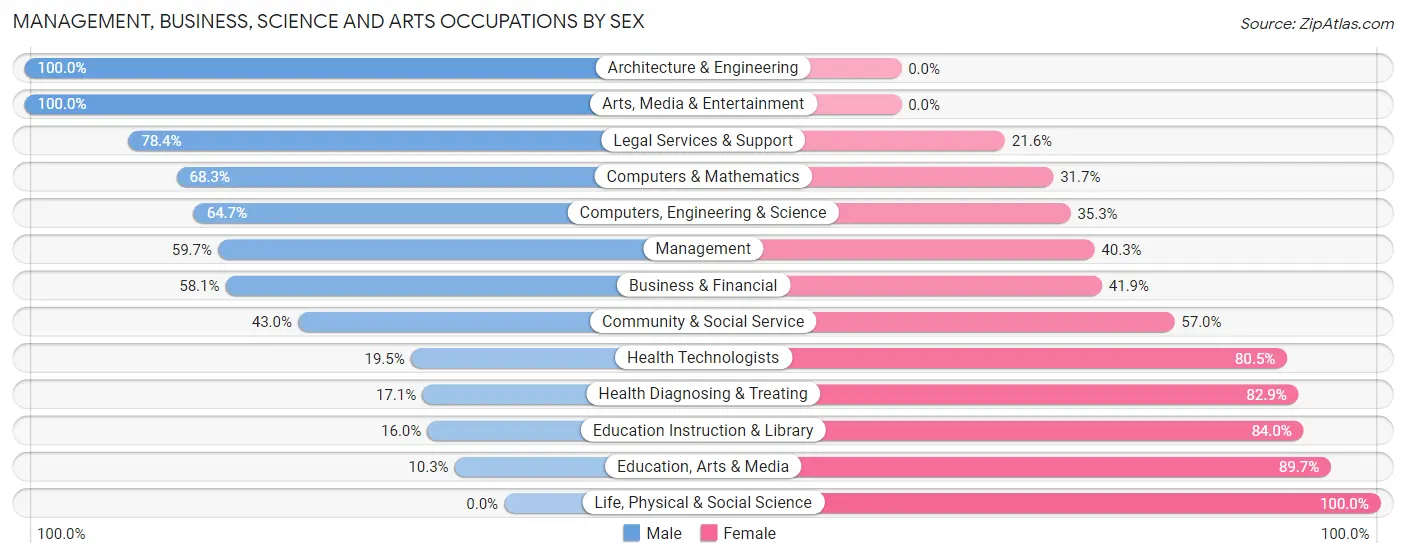
| Occupation | Male | Female |
| Management | 311 (59.7%) | 210 (40.3%) |
| Business & Financial | 143 (58.1%) | 103 (41.9%) |
| Computers, Engineering & Science | 251 (64.7%) | 137 (35.3%) |
| Computers & Mathematics | 198 (68.3%) | 92 (31.7%) |
| Architecture & Engineering | 53 (100.0%) | 0 (0.0%) |
| Life, Physical & Social Science | 0 (0.0%) | 45 (100.0%) |
| Community & Social Service | 160 (43.0%) | 212 (57.0%) |
| Education, Arts & Media | 3 (10.3%) | 26 (89.7%) |
| Legal Services & Support | 105 (78.4%) | 29 (21.6%) |
| Education Instruction & Library | 30 (16.0%) | 157 (84.0%) |
| Arts, Media & Entertainment | 22 (100.0%) | 0 (0.0%) |
| Health Diagnosing & Treating | 54 (17.1%) | 262 (82.9%) |
| Health Technologists | 54 (19.5%) | 223 (80.5%) |
| Total (Category) | 919 (49.9%) | 924 (50.1%) |
| Total (Overall) | 1,626 (52.3%) | 1,482 (47.7%) |
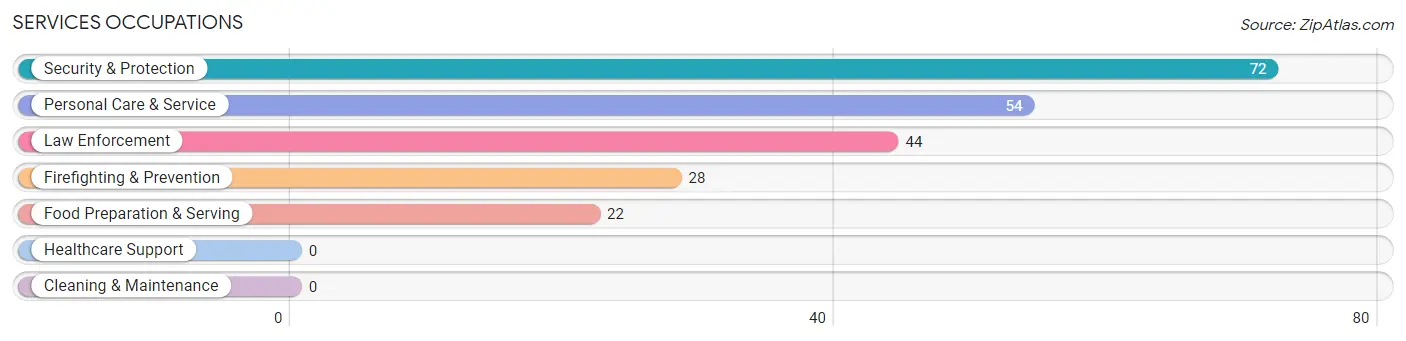
Services Occupations
The most common Services occupations in Mountainside borough are Security & Protection (72 | 2.3%), Personal Care & Service (54 | 1.7%), Law Enforcement (44 | 1.4%), Firefighting & Prevention (28 | 0.9%), and Food Preparation & Serving (22 | 0.7%).
Services Occupations by Sex
Within the Services occupations in Mountainside borough, the most male-oriented occupations are Security & Protection (100.0%), Firefighting & Prevention (100.0%), and Law Enforcement (100.0%), while the most female-oriented occupations are Food Preparation & Serving (100.0%), and Personal Care & Service (66.7%).
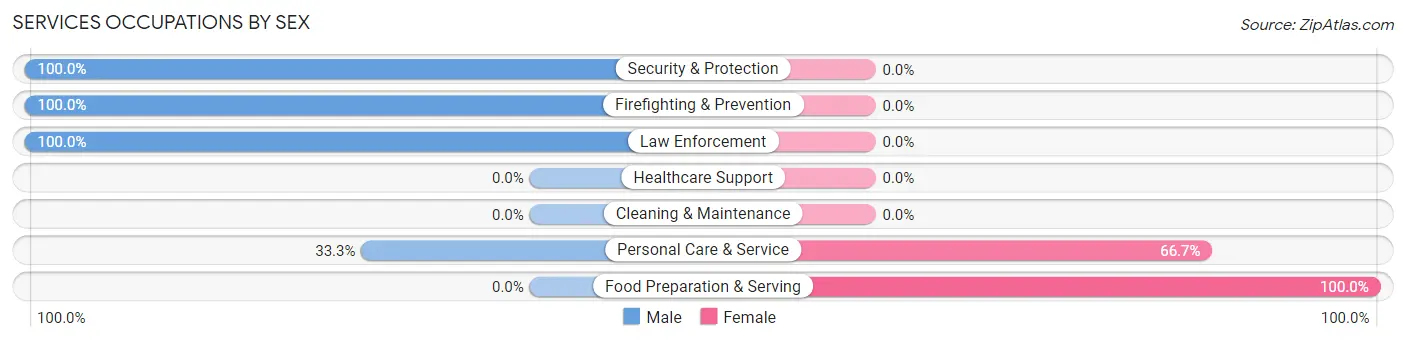
| Occupation | Male | Female |
| Healthcare Support | 0 (0.0%) | 0 (0.0%) |
| Security & Protection | 72 (100.0%) | 0 (0.0%) |
| Firefighting & Prevention | 28 (100.0%) | 0 (0.0%) |
| Law Enforcement | 44 (100.0%) | 0 (0.0%) |
| Food Preparation & Serving | 0 (0.0%) | 22 (100.0%) |
| Cleaning & Maintenance | 0 (0.0%) | 0 (0.0%) |
| Personal Care & Service | 18 (33.3%) | 36 (66.7%) |
| Total (Category) | 90 (60.8%) | 58 (39.2%) |
| Total (Overall) | 1,626 (52.3%) | 1,482 (47.7%) |
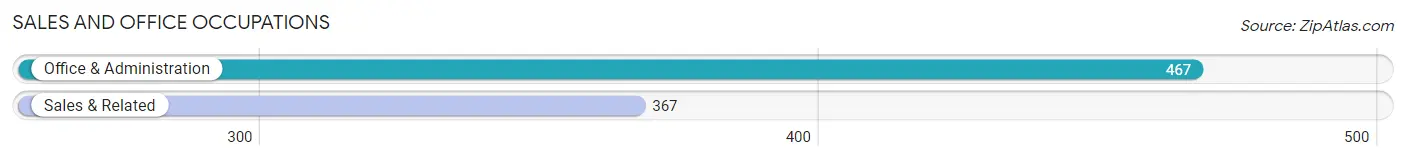
Sales and Office Occupations
The most common Sales and Office occupations in Mountainside borough are Office & Administration (467 | 15.0%), and Sales & Related (367 | 11.8%).
Sales and Office Occupations by Sex
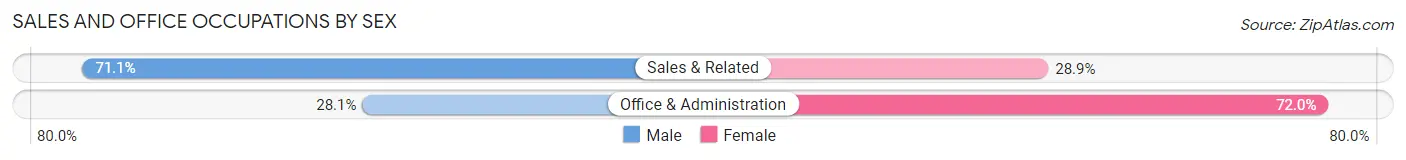
| Occupation | Male | Female |
| Sales & Related | 261 (71.1%) | 106 (28.9%) |
| Office & Administration | 131 (28.1%) | 336 (72.0%) |
| Total (Category) | 392 (47.0%) | 442 (53.0%) |
| Total (Overall) | 1,626 (52.3%) | 1,482 (47.7%) |
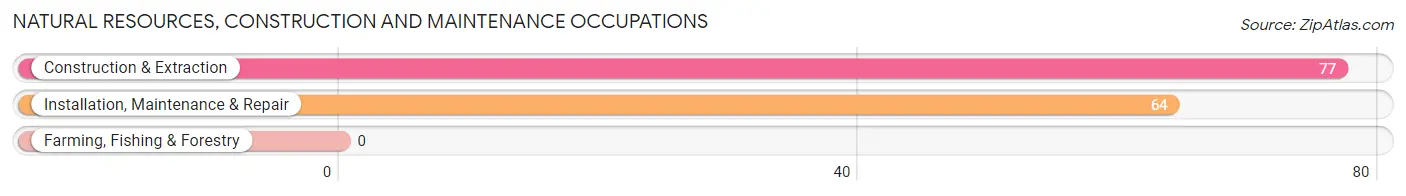
Natural Resources, Construction and Maintenance Occupations
The most common Natural Resources, Construction and Maintenance occupations in Mountainside borough are Construction & Extraction (77 | 2.5%), and Installation, Maintenance & Repair (64 | 2.1%).
Natural Resources, Construction and Maintenance Occupations by Sex
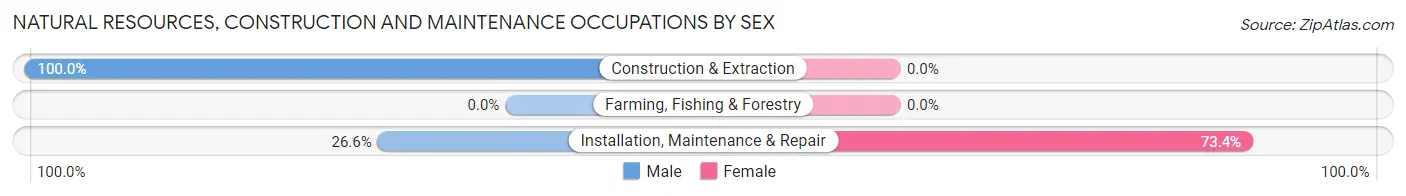
| Occupation | Male | Female |
| Farming, Fishing & Forestry | 0 (0.0%) | 0 (0.0%) |
| Construction & Extraction | 77 (100.0%) | 0 (0.0%) |
| Installation, Maintenance & Repair | 17 (26.6%) | 47 (73.4%) |
| Total (Category) | 94 (66.7%) | 47 (33.3%) |
| Total (Overall) | 1,626 (52.3%) | 1,482 (47.7%) |
Production, Transportation and Moving Occupations
The most common Production, Transportation and Moving occupations in Mountainside borough are , and Production (142 | 4.6%).
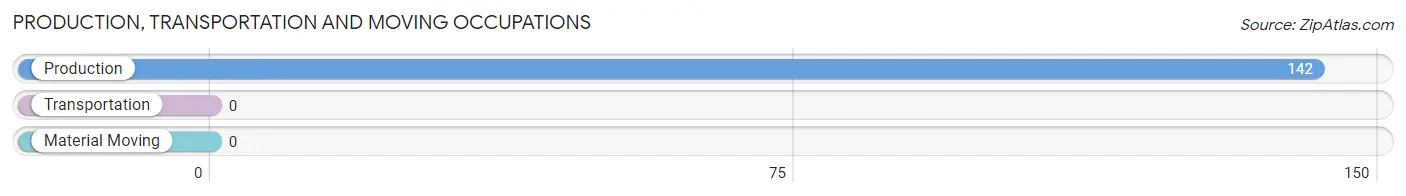
Production, Transportation and Moving Occupations by Sex
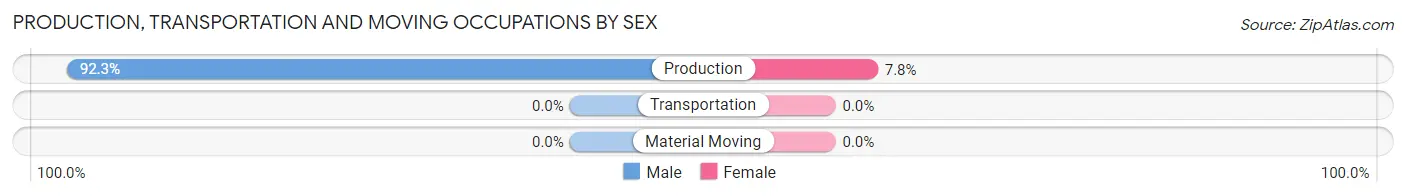
| Occupation | Male | Female |
| Production | 131 (92.2%) | 11 (7.7%) |
| Transportation | 0 (0.0%) | 0 (0.0%) |
| Material Moving | 0 (0.0%) | 0 (0.0%) |
| Total (Category) | 131 (92.2%) | 11 (7.7%) |
| Total (Overall) | 1,626 (52.3%) | 1,482 (47.7%) |
Employment Industries by Sex in Mountainside borough
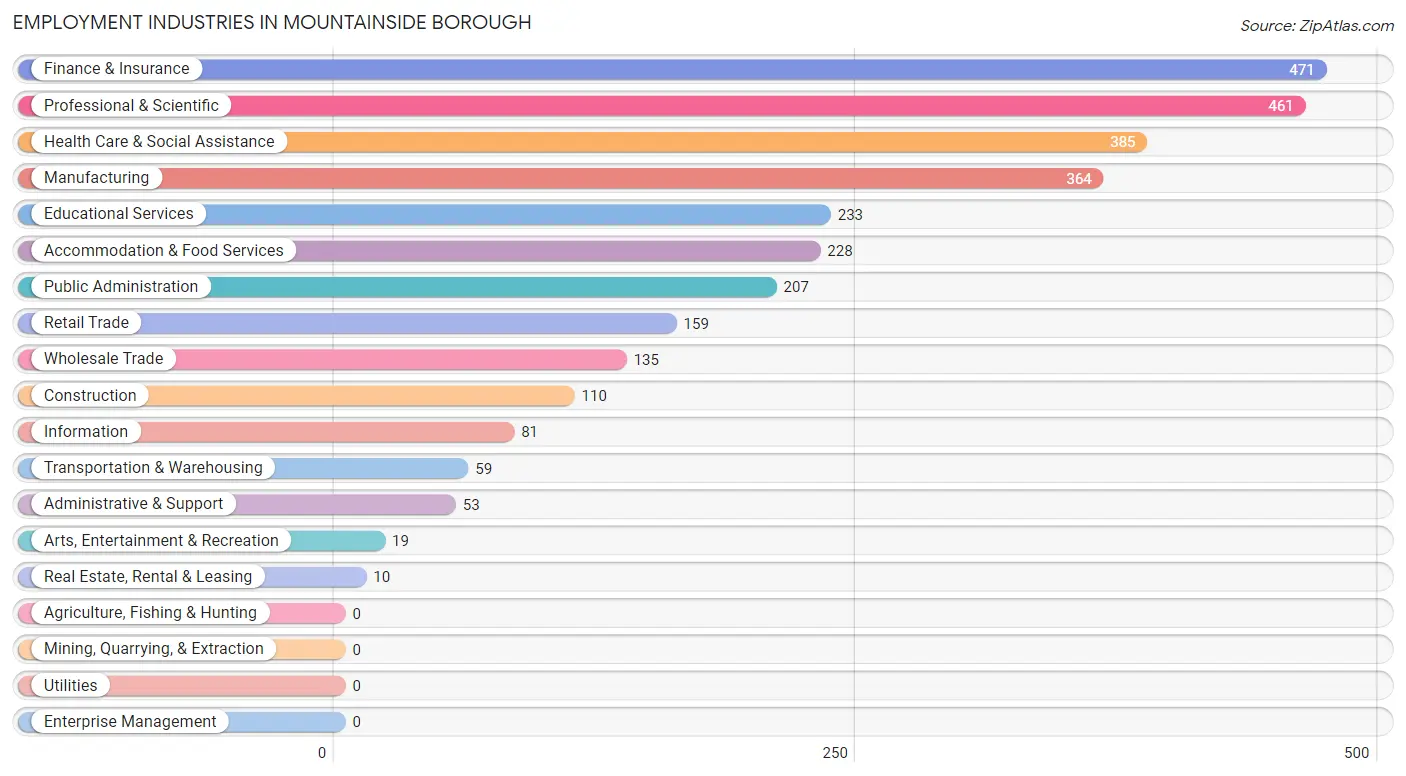
Employment Industries in Mountainside borough
The major employment industries in Mountainside borough include Finance & Insurance (471 | 15.1%), Professional & Scientific (461 | 14.8%), Health Care & Social Assistance (385 | 12.4%), Manufacturing (364 | 11.7%), and Educational Services (233 | 7.5%).
Employment Industries by Sex in Mountainside borough
The Mountainside borough industries that see more men than women are Construction (100.0%), Arts, Entertainment & Recreation (100.0%), and Wholesale Trade (91.1%), whereas the industries that tend to have a higher number of women are Real Estate, Rental & Leasing (100.0%), Accommodation & Food Services (100.0%), and Educational Services (83.7%).

| Industry | Male | Female |
| Agriculture, Fishing & Hunting | 0 (0.0%) | 0 (0.0%) |
| Mining, Quarrying, & Extraction | 0 (0.0%) | 0 (0.0%) |
| Construction | 110 (100.0%) | 0 (0.0%) |
| Manufacturing | 213 (58.5%) | 151 (41.5%) |
| Wholesale Trade | 123 (91.1%) | 12 (8.9%) |
| Retail Trade | 92 (57.9%) | 67 (42.1%) |
| Transportation & Warehousing | 35 (59.3%) | 24 (40.7%) |
| Utilities | 0 (0.0%) | 0 (0.0%) |
| Information | 47 (58.0%) | 34 (42.0%) |
| Finance & Insurance | 275 (58.4%) | 196 (41.6%) |
| Real Estate, Rental & Leasing | 0 (0.0%) | 10 (100.0%) |
| Professional & Scientific | 350 (75.9%) | 111 (24.1%) |
| Enterprise Management | 0 (0.0%) | 0 (0.0%) |
| Administrative & Support | 15 (28.3%) | 38 (71.7%) |
| Educational Services | 38 (16.3%) | 195 (83.7%) |
| Health Care & Social Assistance | 133 (34.5%) | 252 (65.4%) |
| Arts, Entertainment & Recreation | 19 (100.0%) | 0 (0.0%) |
| Accommodation & Food Services | 0 (0.0%) | 228 (100.0%) |
| Public Administration | 144 (69.6%) | 63 (30.4%) |
| Total | 1,626 (52.3%) | 1,482 (47.7%) |
Education in Mountainside borough
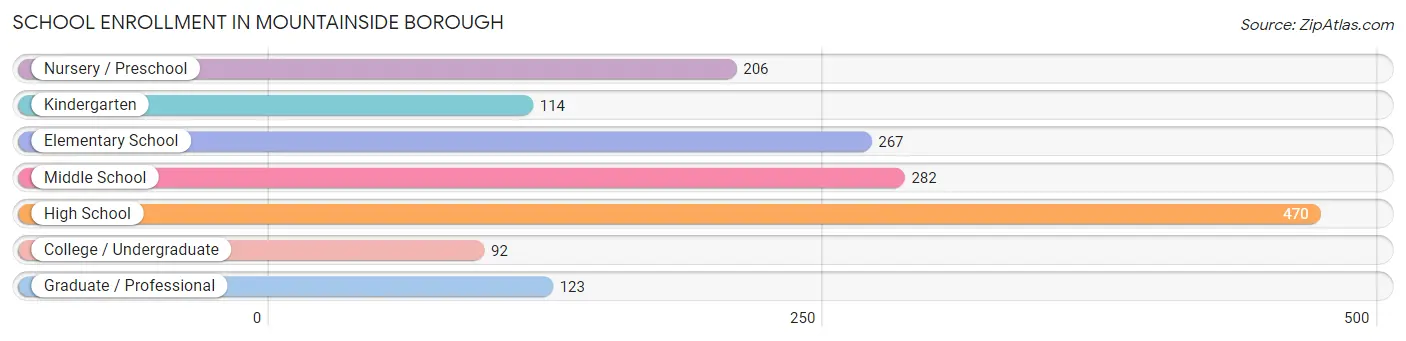
School Enrollment in Mountainside borough
The most common levels of schooling among the 1,554 students in Mountainside borough are high school (470 | 30.2%), middle school (282 | 18.1%), and elementary school (267 | 17.2%).
| School Level | # Students | % Students |
| Nursery / Preschool | 206 | 13.3% |
| Kindergarten | 114 | 7.3% |
| Elementary School | 267 | 17.2% |
| Middle School | 282 | 18.1% |
| High School | 470 | 30.2% |
| College / Undergraduate | 92 | 5.9% |
| Graduate / Professional | 123 | 7.9% |
| Total | 1,554 | 100.0% |
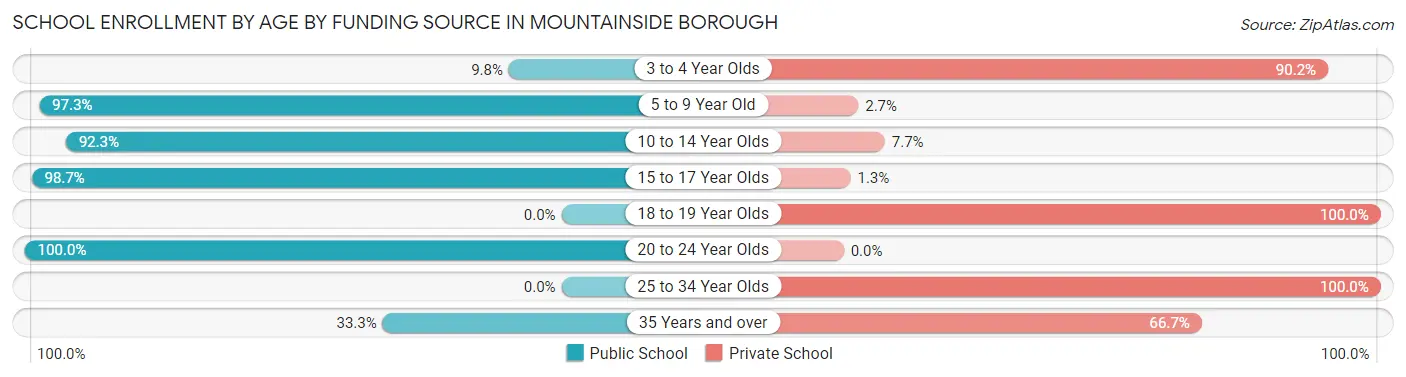
School Enrollment by Age by Funding Source in Mountainside borough
Out of a total of 1,554 students who are enrolled in schools in Mountainside borough, 375 (24.1%) attend a private institution, while the remaining 1,179 (75.9%) are enrolled in public schools. The age group of 18 to 19 year olds has the highest likelihood of being enrolled in private schools, with 68 (100.0% in the age bracket) enrolled. Conversely, the age group of 20 to 24 year olds has the lowest likelihood of being enrolled in a private school, with 125 (100.0% in the age bracket) attending a public institution.
| Age Bracket | Public School | Private School |
| 3 to 4 Year Olds | 21 (9.8%) | 193 (90.2%) |
| 5 to 9 Year Old | 358 (97.3%) | 10 (2.7%) |
| 10 to 14 Year Olds | 277 (92.3%) | 23 (7.7%) |
| 15 to 17 Year Olds | 385 (98.7%) | 5 (1.3%) |
| 18 to 19 Year Olds | 0 (0.0%) | 68 (100.0%) |
| 20 to 24 Year Olds | 125 (100.0%) | 0 (0.0%) |
| 25 to 34 Year Olds | 0 (0.0%) | 50 (100.0%) |
| 35 Years and over | 13 (33.3%) | 26 (66.7%) |
| Total | 1,179 (75.9%) | 375 (24.1%) |
Educational Attainment by Field of Study in Mountainside borough
Business (944 | 28.4%), engineering (566 | 17.0%), social sciences (274 | 8.2%), education (244 | 7.3%), and science & technology (212 | 6.4%) are the most common fields of study among 3,325 individuals in Mountainside borough who have obtained a bachelor's degree or higher.
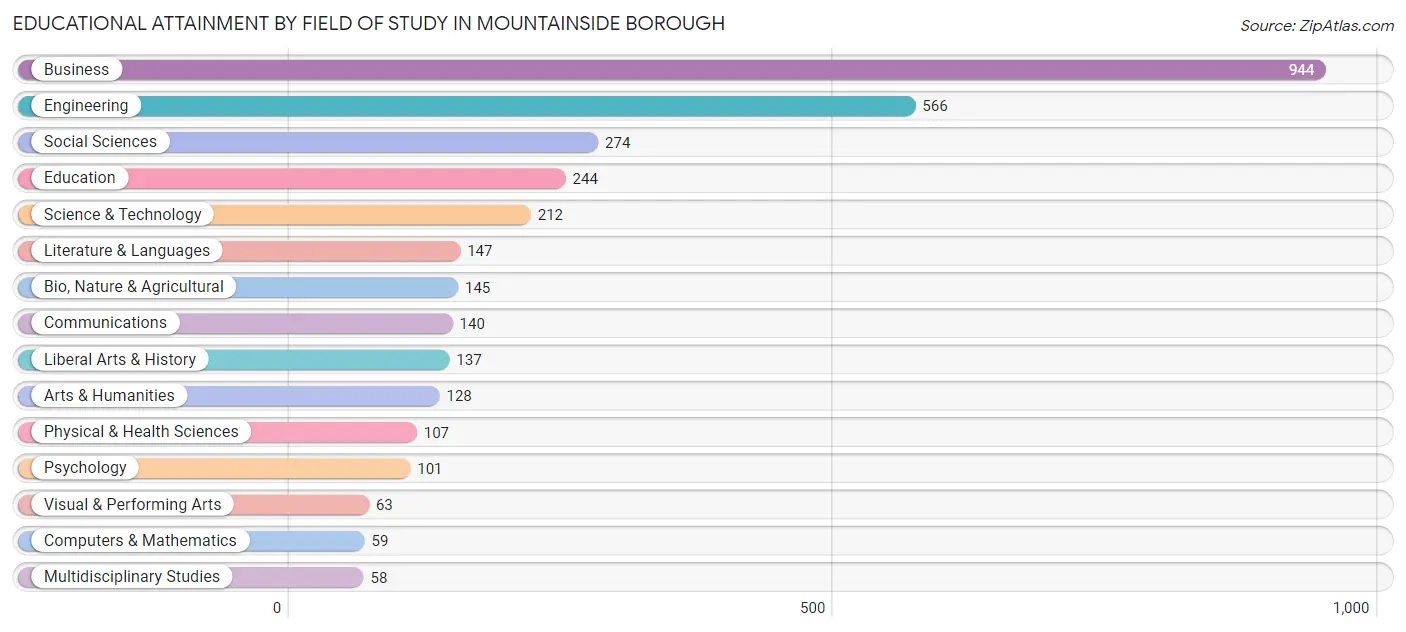
| Field of Study | # Graduates | % Graduates |
| Computers & Mathematics | 59 | 1.8% |
| Bio, Nature & Agricultural | 145 | 4.4% |
| Physical & Health Sciences | 107 | 3.2% |
| Psychology | 101 | 3.0% |
| Social Sciences | 274 | 8.2% |
| Engineering | 566 | 17.0% |
| Multidisciplinary Studies | 58 | 1.7% |
| Science & Technology | 212 | 6.4% |
| Business | 944 | 28.4% |
| Education | 244 | 7.3% |
| Literature & Languages | 147 | 4.4% |
| Liberal Arts & History | 137 | 4.1% |
| Visual & Performing Arts | 63 | 1.9% |
| Communications | 140 | 4.2% |
| Arts & Humanities | 128 | 3.8% |
| Total | 3,325 | 100.0% |
Transportation & Commute in Mountainside borough
Vehicle Availability by Sex in Mountainside borough
The most prevalent vehicle ownership categories in Mountainside borough are males with 2 vehicles (1,093, accounting for 67.3%) and females with 2 vehicles (972, making up 74.3%).
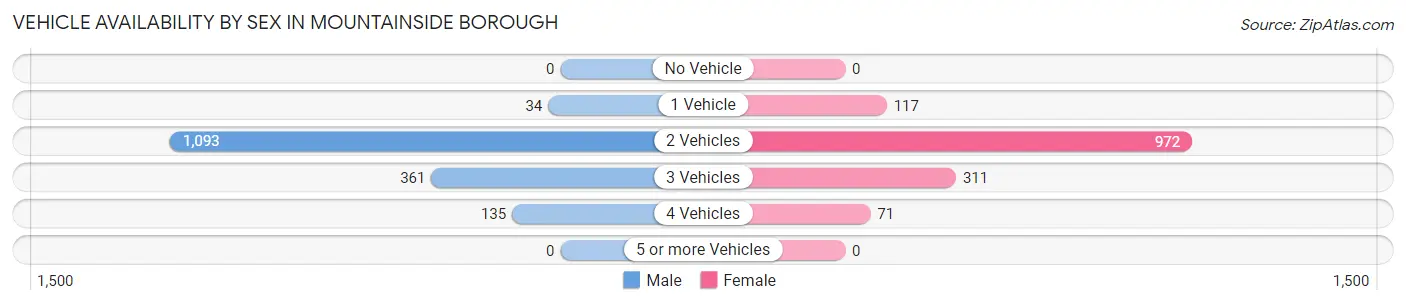
| Vehicles Available | Male | Female |
| No Vehicle | 0 (0.0%) | 0 (0.0%) |
| 1 Vehicle | 34 (2.1%) | 117 (8.0%) |
| 2 Vehicles | 1,093 (67.3%) | 972 (66.1%) |
| 3 Vehicles | 361 (22.2%) | 311 (21.1%) |
| 4 Vehicles | 135 (8.3%) | 71 (4.8%) |
| 5 or more Vehicles | 0 (0.0%) | 0 (0.0%) |
| Total | 1,623 (100.0%) | 1,471 (100.0%) |
Commute Time in Mountainside borough
The most frequently occuring commute durations in Mountainside borough are 30 to 34 minutes (521 commuters, 22.2%), 60 to 89 minutes (391 commuters, 16.6%), and 15 to 19 minutes (297 commuters, 12.6%).
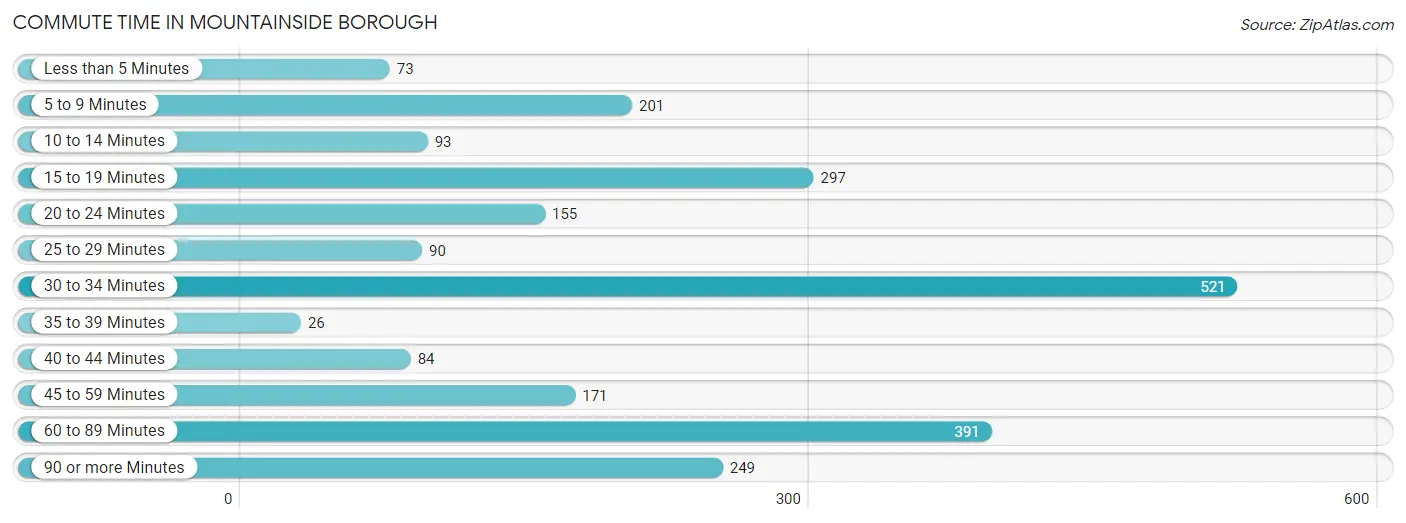
| Commute Time | # Commuters | % Commuters |
| Less than 5 Minutes | 73 | 3.1% |
| 5 to 9 Minutes | 201 | 8.6% |
| 10 to 14 Minutes | 93 | 4.0% |
| 15 to 19 Minutes | 297 | 12.6% |
| 20 to 24 Minutes | 155 | 6.6% |
| 25 to 29 Minutes | 90 | 3.8% |
| 30 to 34 Minutes | 521 | 22.2% |
| 35 to 39 Minutes | 26 | 1.1% |
| 40 to 44 Minutes | 84 | 3.6% |
| 45 to 59 Minutes | 171 | 7.3% |
| 60 to 89 Minutes | 391 | 16.6% |
| 90 or more Minutes | 249 | 10.6% |
Commute Time by Sex in Mountainside borough
The most common commute times in Mountainside borough are 30 to 34 minutes (335 commuters, 26.7%) for males and 15 to 19 minutes (202 commuters, 18.4%) for females.
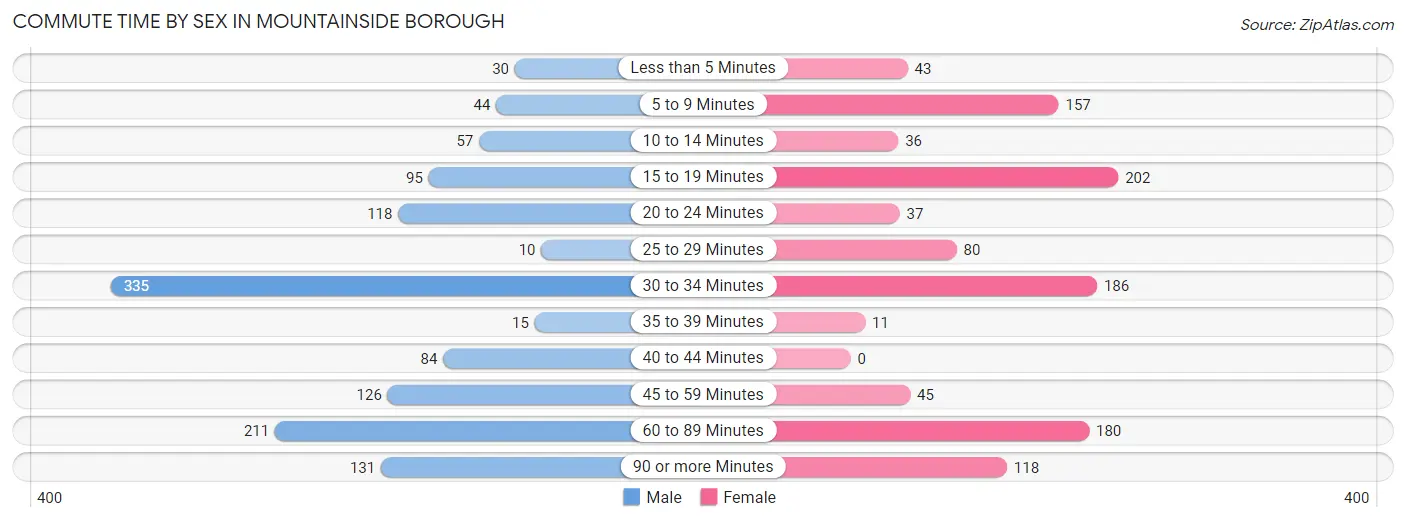
| Commute Time | Male | Female |
| Less than 5 Minutes | 30 (2.4%) | 43 (3.9%) |
| 5 to 9 Minutes | 44 (3.5%) | 157 (14.3%) |
| 10 to 14 Minutes | 57 (4.5%) | 36 (3.3%) |
| 15 to 19 Minutes | 95 (7.6%) | 202 (18.4%) |
| 20 to 24 Minutes | 118 (9.4%) | 37 (3.4%) |
| 25 to 29 Minutes | 10 (0.8%) | 80 (7.3%) |
| 30 to 34 Minutes | 335 (26.7%) | 186 (17.0%) |
| 35 to 39 Minutes | 15 (1.2%) | 11 (1.0%) |
| 40 to 44 Minutes | 84 (6.7%) | 0 (0.0%) |
| 45 to 59 Minutes | 126 (10.0%) | 45 (4.1%) |
| 60 to 89 Minutes | 211 (16.8%) | 180 (16.4%) |
| 90 or more Minutes | 131 (10.4%) | 118 (10.8%) |
Time of Departure to Work by Sex in Mountainside borough
The most frequent times of departure to work in Mountainside borough are 8:30 AM to 8:59 AM (256, 20.4%) for males and 7:30 AM to 7:59 AM (311, 28.4%) for females.
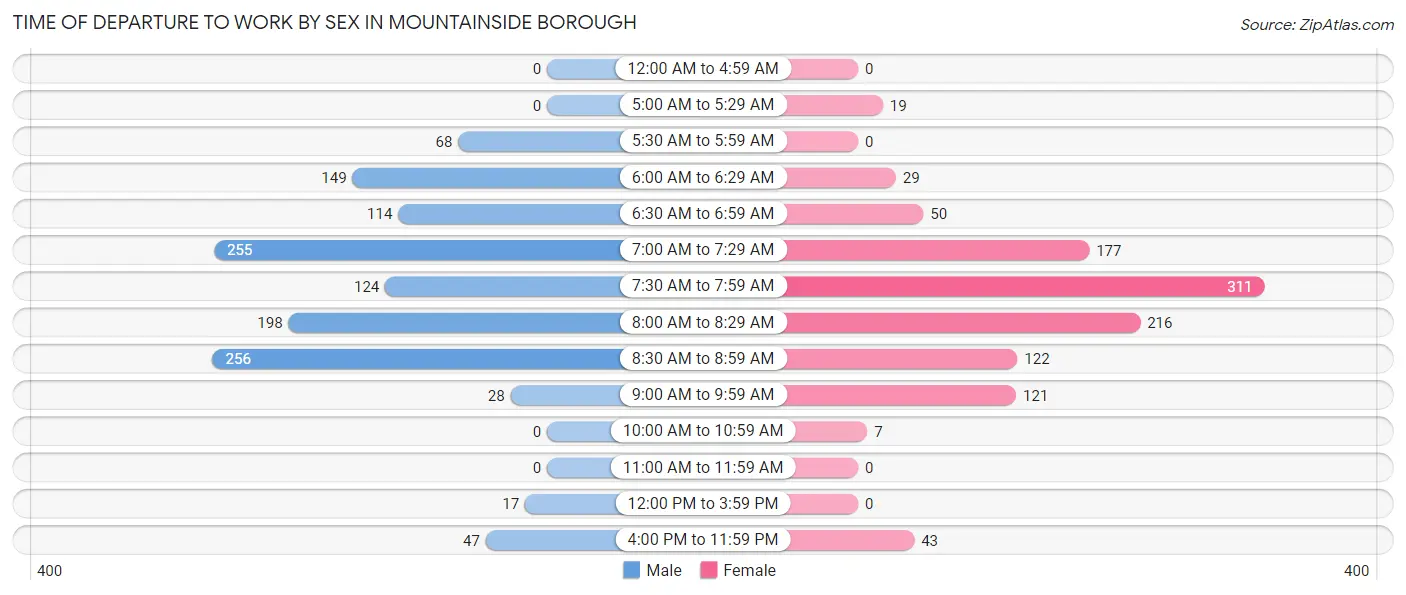
| Time of Departure | Male | Female |
| 12:00 AM to 4:59 AM | 0 (0.0%) | 0 (0.0%) |
| 5:00 AM to 5:29 AM | 0 (0.0%) | 19 (1.7%) |
| 5:30 AM to 5:59 AM | 68 (5.4%) | 0 (0.0%) |
| 6:00 AM to 6:29 AM | 149 (11.9%) | 29 (2.6%) |
| 6:30 AM to 6:59 AM | 114 (9.1%) | 50 (4.6%) |
| 7:00 AM to 7:29 AM | 255 (20.3%) | 177 (16.2%) |
| 7:30 AM to 7:59 AM | 124 (9.9%) | 311 (28.4%) |
| 8:00 AM to 8:29 AM | 198 (15.8%) | 216 (19.7%) |
| 8:30 AM to 8:59 AM | 256 (20.4%) | 122 (11.1%) |
| 9:00 AM to 9:59 AM | 28 (2.2%) | 121 (11.1%) |
| 10:00 AM to 10:59 AM | 0 (0.0%) | 7 (0.6%) |
| 11:00 AM to 11:59 AM | 0 (0.0%) | 0 (0.0%) |
| 12:00 PM to 3:59 PM | 17 (1.3%) | 0 (0.0%) |
| 4:00 PM to 11:59 PM | 47 (3.7%) | 43 (3.9%) |
| Total | 1,256 (100.0%) | 1,095 (100.0%) |
Housing Occupancy in Mountainside borough
Occupancy by Ownership in Mountainside borough
Of the total 2,537 dwellings in Mountainside borough, owner-occupied units account for 2,141 (84.4%), while renter-occupied units make up 396 (15.6%).
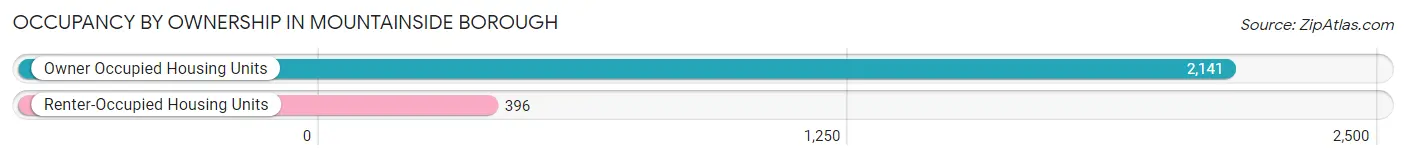
| Occupancy | # Housing Units | % Housing Units |
| Owner Occupied Housing Units | 2,141 | 84.4% |
| Renter-Occupied Housing Units | 396 | 15.6% |
| Total Occupied Housing Units | 2,537 | 100.0% |
Occupancy by Household Size in Mountainside borough
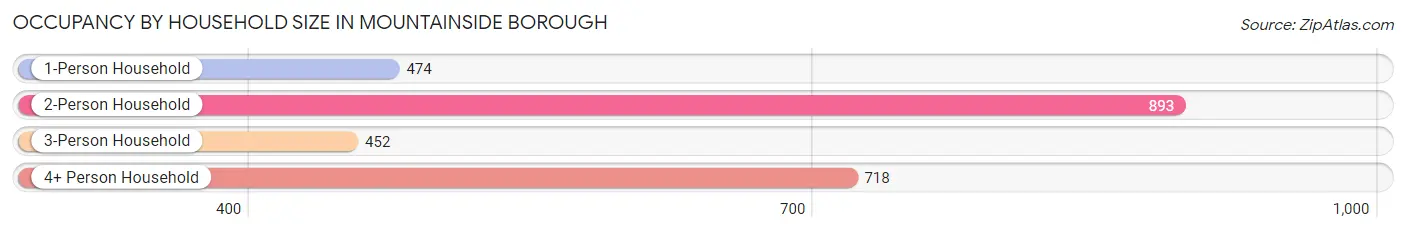
| Household Size | # Housing Units | % Housing Units |
| 1-Person Household | 474 | 18.7% |
| 2-Person Household | 893 | 35.2% |
| 3-Person Household | 452 | 17.8% |
| 4+ Person Household | 718 | 28.3% |
| Total Housing Units | 2,537 | 100.0% |
Occupancy by Ownership by Household Size in Mountainside borough
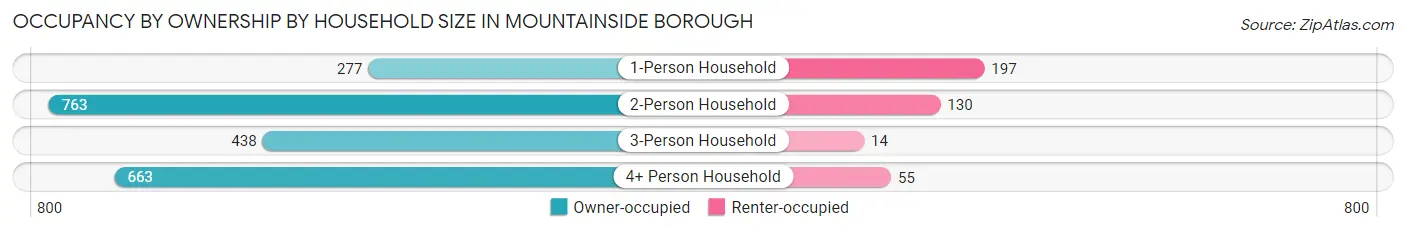
| Household Size | Owner-occupied | Renter-occupied |
| 1-Person Household | 277 (58.4%) | 197 (41.6%) |
| 2-Person Household | 763 (85.4%) | 130 (14.6%) |
| 3-Person Household | 438 (96.9%) | 14 (3.1%) |
| 4+ Person Household | 663 (92.3%) | 55 (7.7%) |
| Total Housing Units | 2,141 (84.4%) | 396 (15.6%) |
Occupancy by Educational Attainment in Mountainside borough
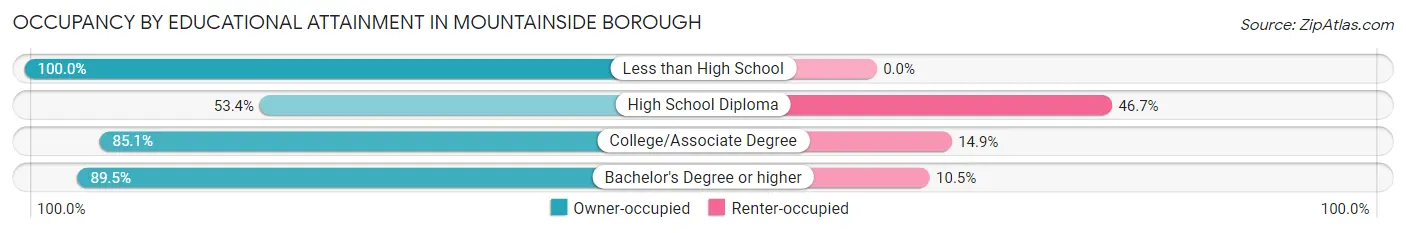
| Household Size | Owner-occupied | Renter-occupied |
| Less than High School | 6 (100.0%) | 0 (0.0%) |
| High School Diploma | 175 (53.3%) | 153 (46.7%) |
| College/Associate Degree | 229 (85.1%) | 40 (14.9%) |
| Bachelor's Degree or higher | 1,731 (89.5%) | 203 (10.5%) |
Occupancy by Age of Householder in Mountainside borough
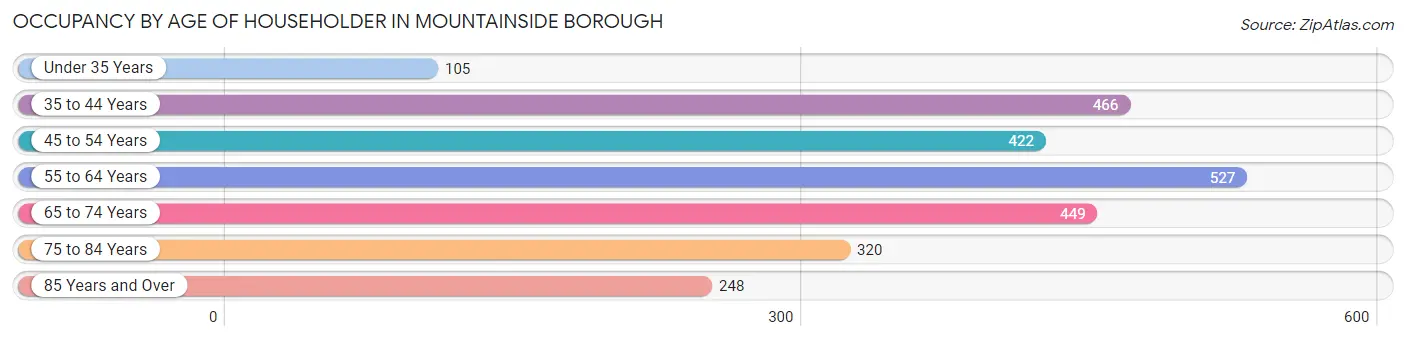
| Age Bracket | # Households | % Households |
| Under 35 Years | 105 | 4.1% |
| 35 to 44 Years | 466 | 18.4% |
| 45 to 54 Years | 422 | 16.6% |
| 55 to 64 Years | 527 | 20.8% |
| 65 to 74 Years | 449 | 17.7% |
| 75 to 84 Years | 320 | 12.6% |
| 85 Years and Over | 248 | 9.8% |
| Total | 2,537 | 100.0% |
Housing Finances in Mountainside borough
Median Income by Occupancy in Mountainside borough
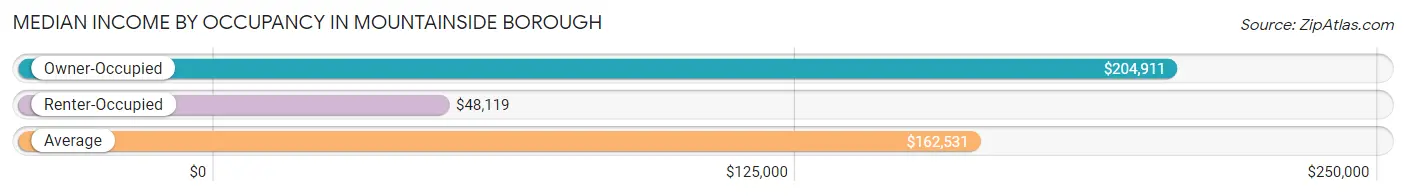
| Occupancy Type | # Households | Median Income |
| Owner-Occupied | 2,141 (84.4%) | $204,911 |
| Renter-Occupied | 396 (15.6%) | $48,119 |
| Average | 2,537 (100.0%) | $162,531 |
Occupancy by Householder Income Bracket in Mountainside borough
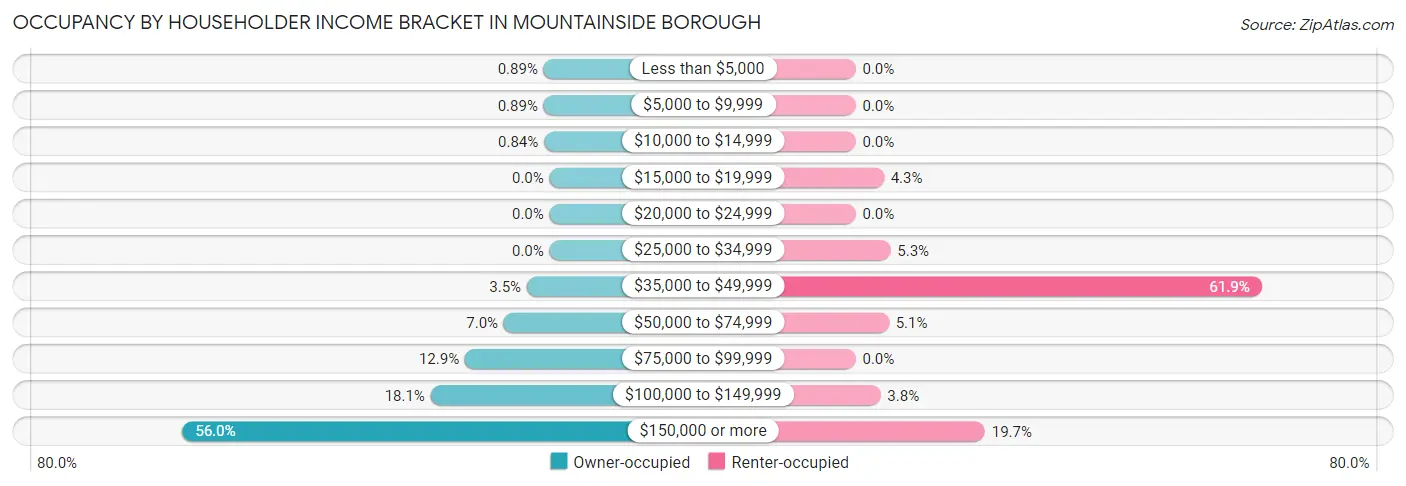
| Income Bracket | Owner-occupied | Renter-occupied |
| Less than $5,000 | 19 (0.9%) | 0 (0.0%) |
| $5,000 to $9,999 | 19 (0.9%) | 0 (0.0%) |
| $10,000 to $14,999 | 18 (0.8%) | 0 (0.0%) |
| $15,000 to $19,999 | 0 (0.0%) | 17 (4.3%) |
| $20,000 to $24,999 | 0 (0.0%) | 0 (0.0%) |
| $25,000 to $34,999 | 0 (0.0%) | 21 (5.3%) |
| $35,000 to $49,999 | 74 (3.5%) | 245 (61.9%) |
| $50,000 to $74,999 | 149 (7.0%) | 20 (5.1%) |
| $75,000 to $99,999 | 276 (12.9%) | 0 (0.0%) |
| $100,000 to $149,999 | 388 (18.1%) | 15 (3.8%) |
| $150,000 or more | 1,198 (56.0%) | 78 (19.7%) |
| Total | 2,141 (100.0%) | 396 (100.0%) |
Monthly Housing Cost Tiers in Mountainside borough
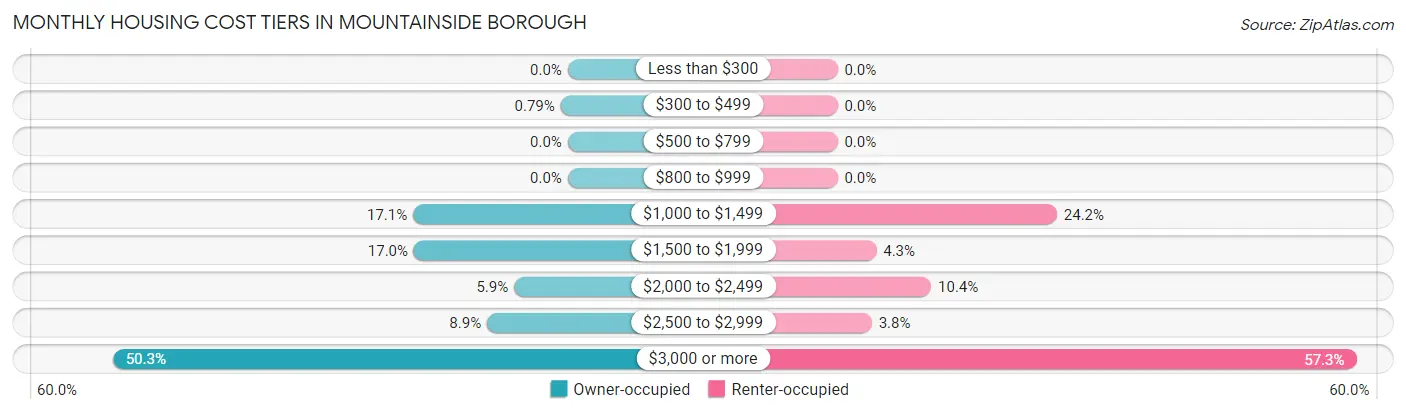
| Monthly Cost | Owner-occupied | Renter-occupied |
| Less than $300 | 0 (0.0%) | 0 (0.0%) |
| $300 to $499 | 17 (0.8%) | 0 (0.0%) |
| $500 to $799 | 0 (0.0%) | 0 (0.0%) |
| $800 to $999 | 0 (0.0%) | 0 (0.0%) |
| $1,000 to $1,499 | 366 (17.1%) | 96 (24.2%) |
| $1,500 to $1,999 | 364 (17.0%) | 17 (4.3%) |
| $2,000 to $2,499 | 127 (5.9%) | 41 (10.3%) |
| $2,500 to $2,999 | 191 (8.9%) | 15 (3.8%) |
| $3,000 or more | 1,076 (50.3%) | 227 (57.3%) |
| Total | 2,141 (100.0%) | 396 (100.0%) |
Physical Housing Characteristics in Mountainside borough
Housing Structures in Mountainside borough
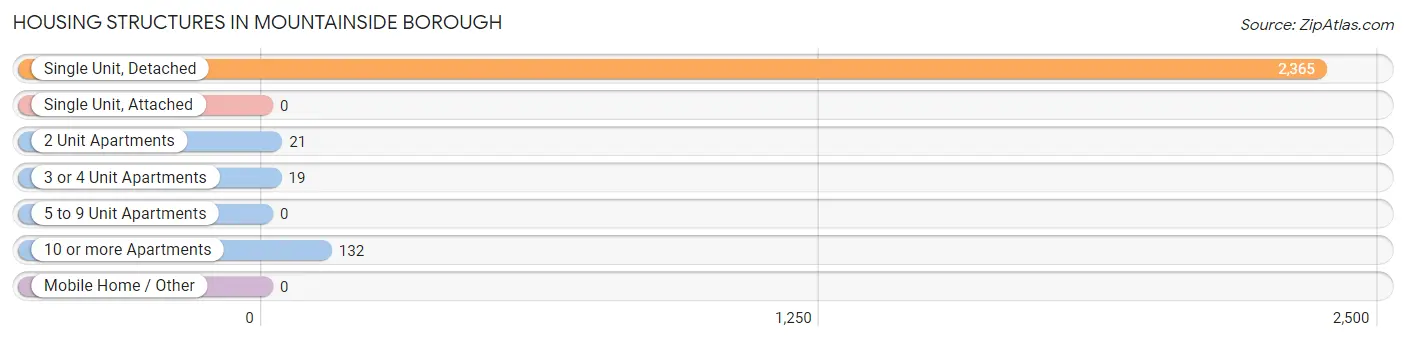
| Structure Type | # Housing Units | % Housing Units |
| Single Unit, Detached | 2,365 | 93.2% |
| Single Unit, Attached | 0 | 0.0% |
| 2 Unit Apartments | 21 | 0.8% |
| 3 or 4 Unit Apartments | 19 | 0.7% |
| 5 to 9 Unit Apartments | 0 | 0.0% |
| 10 or more Apartments | 132 | 5.2% |
| Mobile Home / Other | 0 | 0.0% |
| Total | 2,537 | 100.0% |
Housing Structures by Occupancy in Mountainside borough
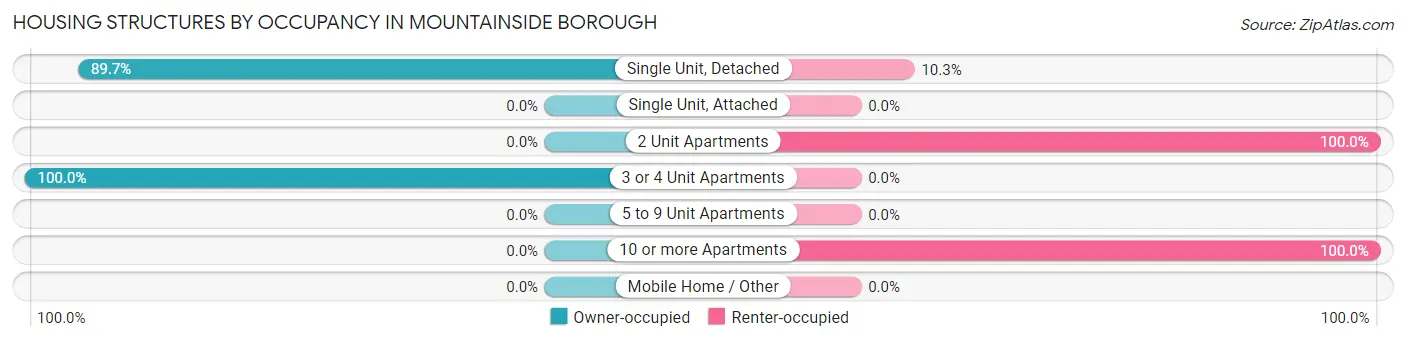
| Structure Type | Owner-occupied | Renter-occupied |
| Single Unit, Detached | 2,122 (89.7%) | 243 (10.3%) |
| Single Unit, Attached | 0 (0.0%) | 0 (0.0%) |
| 2 Unit Apartments | 0 (0.0%) | 21 (100.0%) |
| 3 or 4 Unit Apartments | 19 (100.0%) | 0 (0.0%) |
| 5 to 9 Unit Apartments | 0 (0.0%) | 0 (0.0%) |
| 10 or more Apartments | 0 (0.0%) | 132 (100.0%) |
| Mobile Home / Other | 0 (0.0%) | 0 (0.0%) |
| Total | 2,141 (84.4%) | 396 (15.6%) |
Housing Structures by Number of Rooms in Mountainside borough
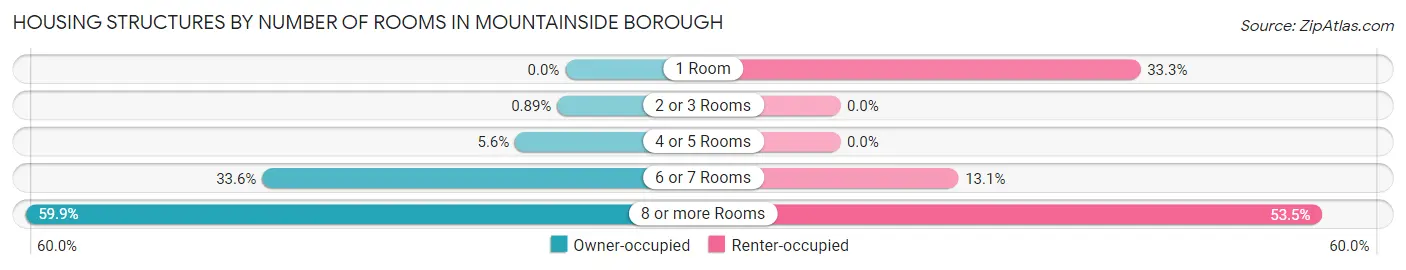
| Number of Rooms | Owner-occupied | Renter-occupied |
| 1 Room | 0 (0.0%) | 132 (33.3%) |
| 2 or 3 Rooms | 19 (0.9%) | 0 (0.0%) |
| 4 or 5 Rooms | 119 (5.6%) | 0 (0.0%) |
| 6 or 7 Rooms | 720 (33.6%) | 52 (13.1%) |
| 8 or more Rooms | 1,283 (59.9%) | 212 (53.5%) |
| Total | 2,141 (100.0%) | 396 (100.0%) |
Housing Structure by Heating Type in Mountainside borough
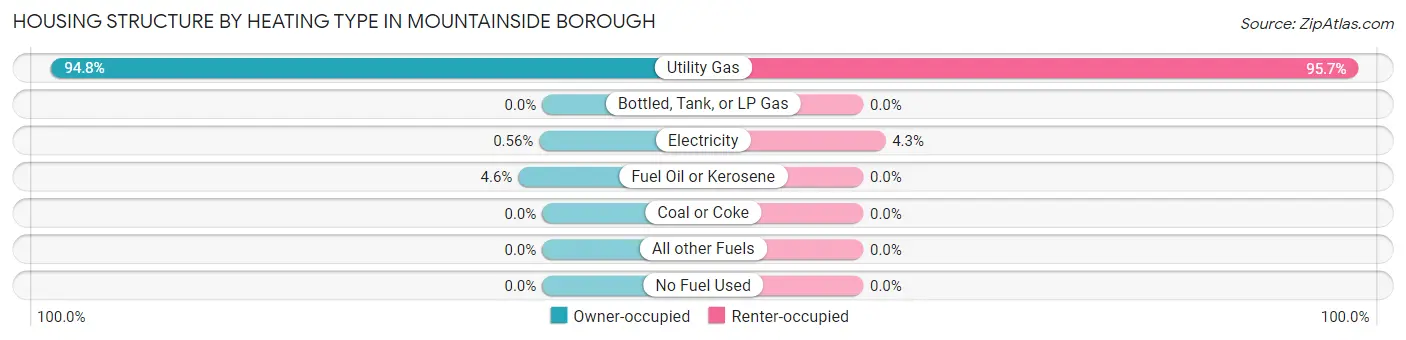
| Heating Type | Owner-occupied | Renter-occupied |
| Utility Gas | 2,030 (94.8%) | 379 (95.7%) |
| Bottled, Tank, or LP Gas | 0 (0.0%) | 0 (0.0%) |
| Electricity | 12 (0.6%) | 17 (4.3%) |
| Fuel Oil or Kerosene | 99 (4.6%) | 0 (0.0%) |
| Coal or Coke | 0 (0.0%) | 0 (0.0%) |
| All other Fuels | 0 (0.0%) | 0 (0.0%) |
| No Fuel Used | 0 (0.0%) | 0 (0.0%) |
| Total | 2,141 (100.0%) | 396 (100.0%) |
Household Vehicle Usage in Mountainside borough
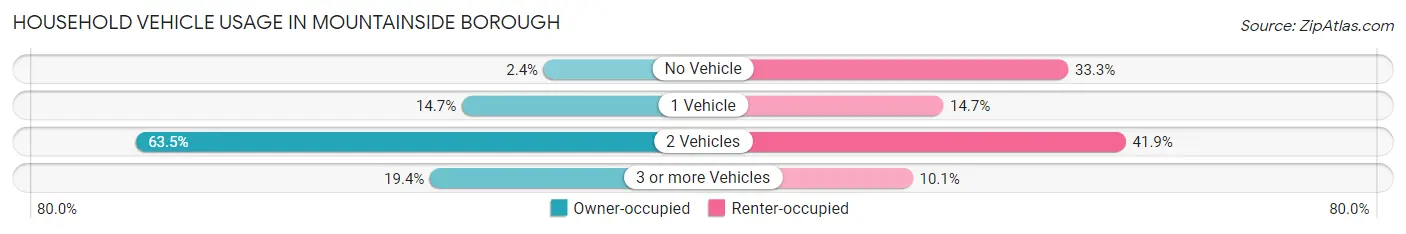
| Vehicles per Household | Owner-occupied | Renter-occupied |
| No Vehicle | 52 (2.4%) | 132 (33.3%) |
| 1 Vehicle | 314 (14.7%) | 58 (14.6%) |
| 2 Vehicles | 1,359 (63.5%) | 166 (41.9%) |
| 3 or more Vehicles | 416 (19.4%) | 40 (10.1%) |
| Total | 2,141 (100.0%) | 396 (100.0%) |
Real Estate & Mortgages in Mountainside borough
Real Estate and Mortgage Overview in Mountainside borough
| Characteristic | Without Mortgage | With Mortgage |
| Housing Units | 771 | 1,370 |
| Median Property Value | $660,700 | $772,700 |
| Median Household Income | $119,837 | $842 |
| Monthly Housing Costs | $1,501 | $1,053 |
| Real Estate Taxes | $10,001 | $0 |
Property Value by Mortgage Status in Mountainside borough
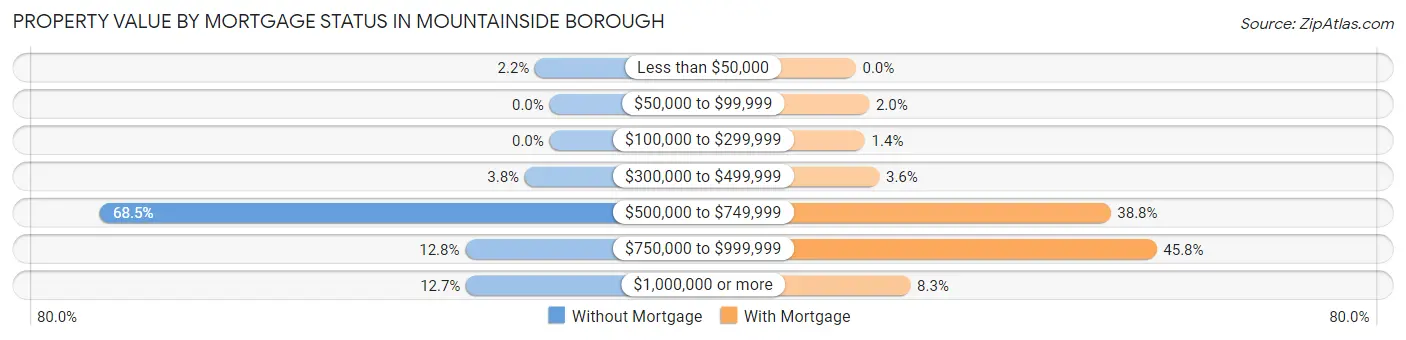
| Property Value | Without Mortgage | With Mortgage |
| Less than $50,000 | 17 (2.2%) | 0 (0.0%) |
| $50,000 to $99,999 | 0 (0.0%) | 28 (2.0%) |
| $100,000 to $299,999 | 0 (0.0%) | 19 (1.4%) |
| $300,000 to $499,999 | 29 (3.8%) | 49 (3.6%) |
| $500,000 to $749,999 | 528 (68.5%) | 532 (38.8%) |
| $750,000 to $999,999 | 99 (12.8%) | 628 (45.8%) |
| $1,000,000 or more | 98 (12.7%) | 114 (8.3%) |
| Total | 771 (100.0%) | 1,370 (100.0%) |
Household Income by Mortgage Status in Mountainside borough
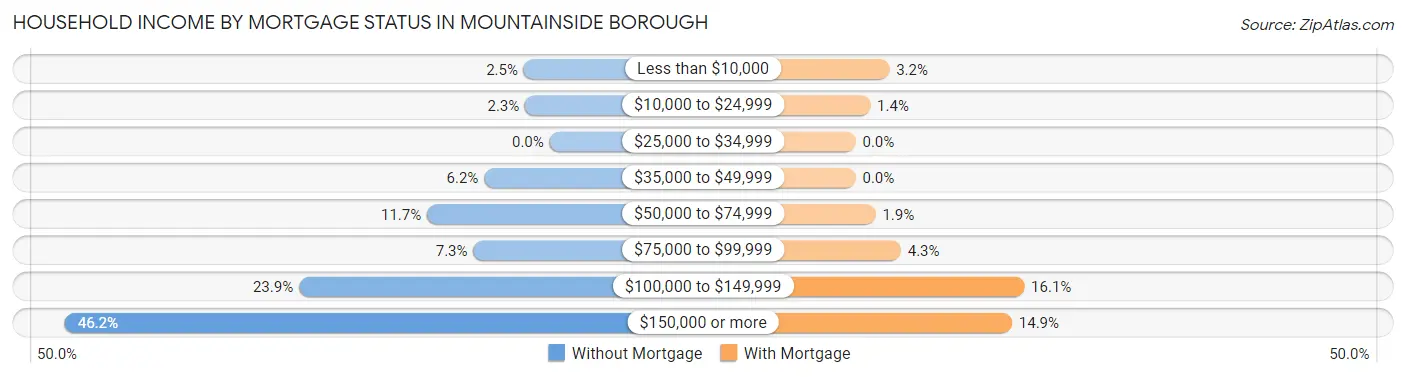
| Household Income | Without Mortgage | With Mortgage |
| Less than $10,000 | 19 (2.5%) | 44 (3.2%) |
| $10,000 to $24,999 | 18 (2.3%) | 19 (1.4%) |
| $25,000 to $34,999 | 0 (0.0%) | 0 (0.0%) |
| $35,000 to $49,999 | 48 (6.2%) | 0 (0.0%) |
| $50,000 to $74,999 | 90 (11.7%) | 26 (1.9%) |
| $75,000 to $99,999 | 56 (7.3%) | 59 (4.3%) |
| $100,000 to $149,999 | 184 (23.9%) | 220 (16.1%) |
| $150,000 or more | 356 (46.2%) | 204 (14.9%) |
| Total | 771 (100.0%) | 1,370 (100.0%) |
Property Value to Household Income Ratio in Mountainside borough
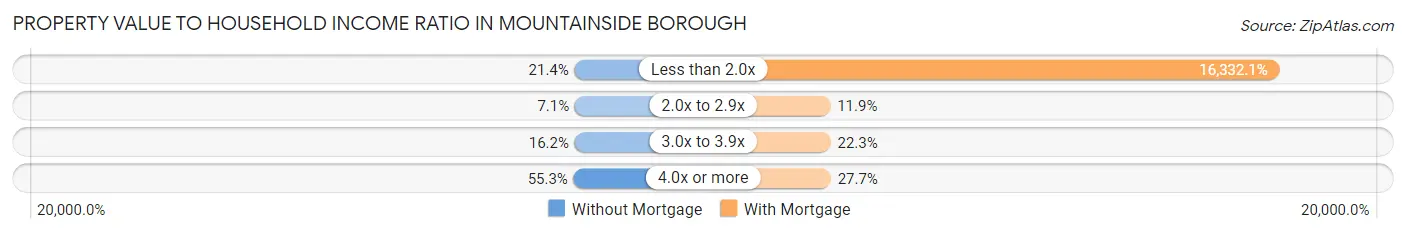
| Value-to-Income Ratio | Without Mortgage | With Mortgage |
| Less than 2.0x | 165 (21.4%) | 223,750 (16,332.1%) |
| 2.0x to 2.9x | 55 (7.1%) | 163 (11.9%) |
| 3.0x to 3.9x | 125 (16.2%) | 305 (22.3%) |
| 4.0x or more | 426 (55.2%) | 380 (27.7%) |
| Total | 771 (100.0%) | 1,370 (100.0%) |
Real Estate Taxes by Mortgage Status in Mountainside borough
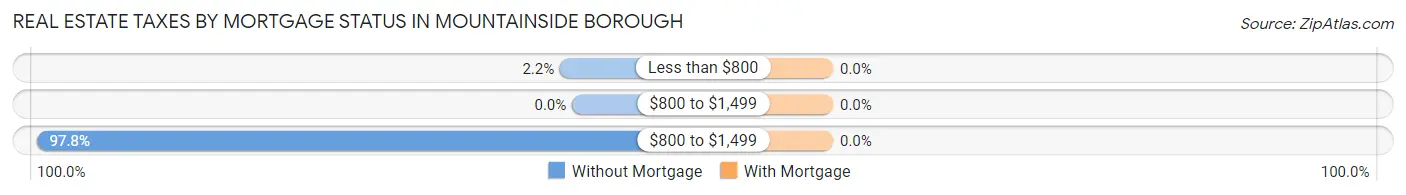
| Property Taxes | Without Mortgage | With Mortgage |
| Less than $800 | 17 (2.2%) | 0 (0.0%) |
| $800 to $1,499 | 0 (0.0%) | 0 (0.0%) |
| $800 to $1,499 | 754 (97.8%) | 0 (0.0%) |
| Total | 771 (100.0%) | 1,370 (100.0%) |
Health & Disability in Mountainside borough
Health Insurance Coverage by Age in Mountainside borough
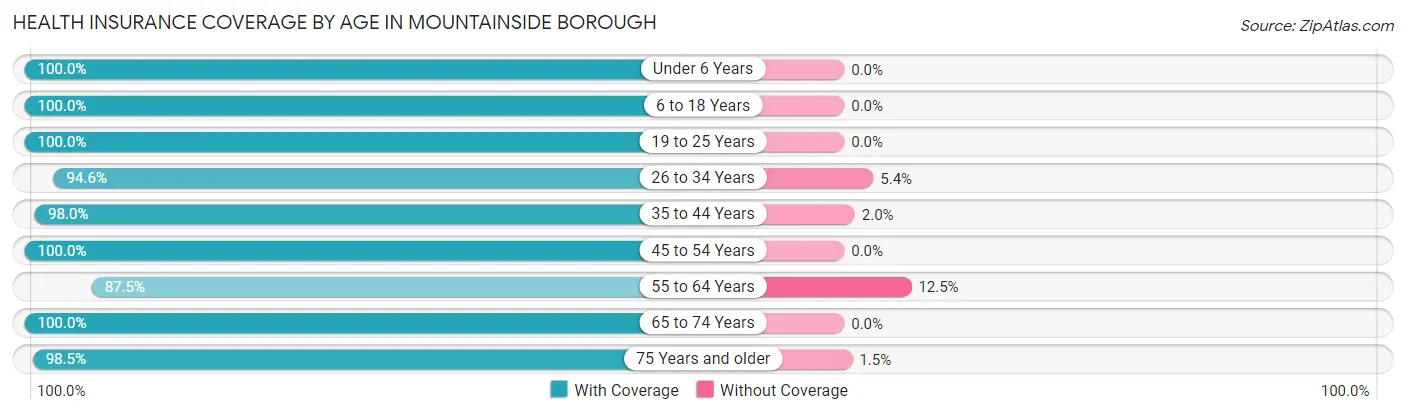
| Age Bracket | With Coverage | Without Coverage |
| Under 6 Years | 629 (100.0%) | 0 (0.0%) |
| 6 to 18 Years | 1,040 (100.0%) | 0 (0.0%) |
| 19 to 25 Years | 278 (100.0%) | 0 (0.0%) |
| 26 to 34 Years | 192 (94.6%) | 11 (5.4%) |
| 35 to 44 Years | 951 (98.0%) | 19 (2.0%) |
| 45 to 54 Years | 877 (100.0%) | 0 (0.0%) |
| 55 to 64 Years | 1,020 (87.5%) | 146 (12.5%) |
| 65 to 74 Years | 922 (100.0%) | 0 (0.0%) |
| 75 Years and older | 777 (98.5%) | 12 (1.5%) |
| Total | 6,686 (97.3%) | 188 (2.7%) |
Health Insurance Coverage by Citizenship Status in Mountainside borough
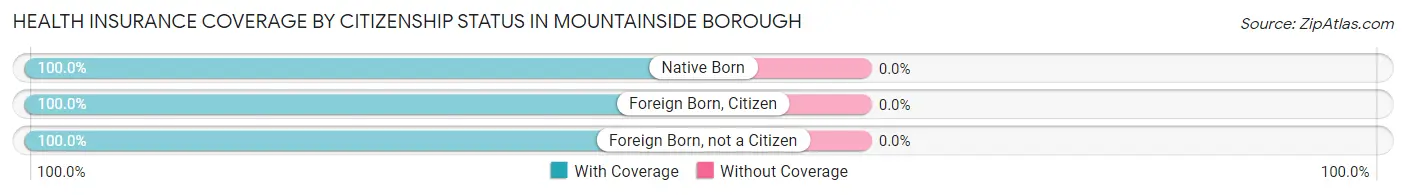
| Citizenship Status | With Coverage | Without Coverage |
| Native Born | 629 (100.0%) | 0 (0.0%) |
| Foreign Born, Citizen | 1,040 (100.0%) | 0 (0.0%) |
| Foreign Born, not a Citizen | 278 (100.0%) | 0 (0.0%) |
Health Insurance Coverage by Household Income in Mountainside borough
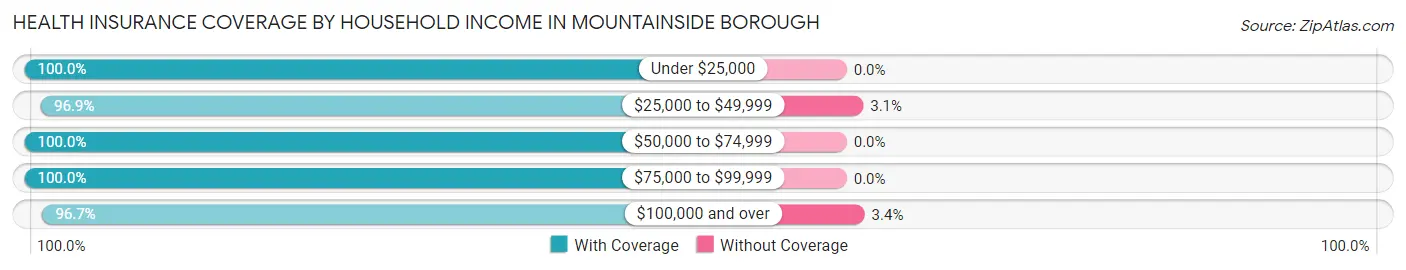
| Household Income | With Coverage | Without Coverage |
| Under $25,000 | 172 (100.0%) | 0 (0.0%) |
| $25,000 to $49,999 | 596 (96.9%) | 19 (3.1%) |
| $50,000 to $74,999 | 247 (100.0%) | 0 (0.0%) |
| $75,000 to $99,999 | 768 (100.0%) | 0 (0.0%) |
| $100,000 and over | 4,873 (96.7%) | 169 (3.4%) |
Public vs Private Health Insurance Coverage by Age in Mountainside borough
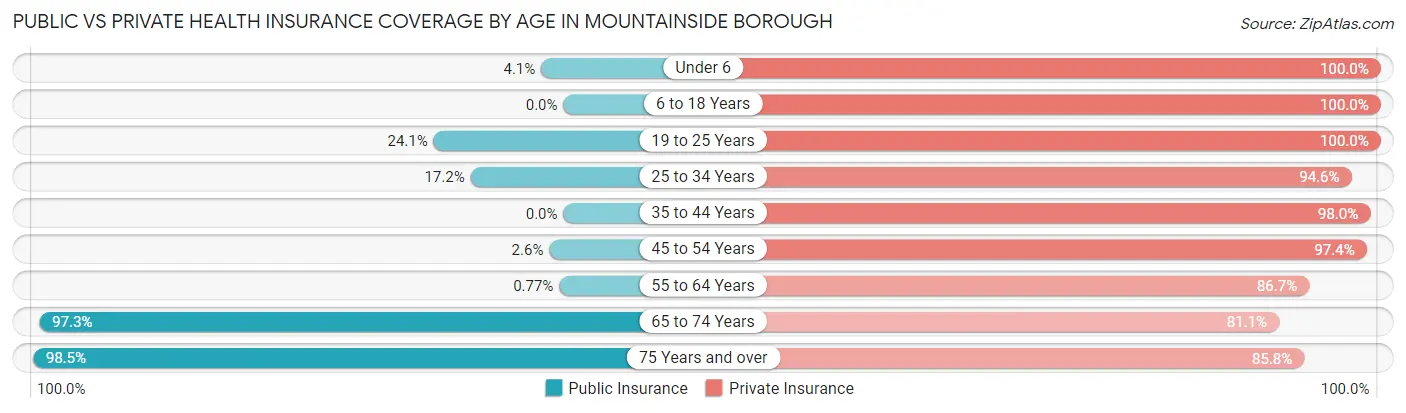
| Age Bracket | Public Insurance | Private Insurance |
| Under 6 | 26 (4.1%) | 629 (100.0%) |
| 6 to 18 Years | 0 (0.0%) | 1,040 (100.0%) |
| 19 to 25 Years | 67 (24.1%) | 278 (100.0%) |
| 25 to 34 Years | 35 (17.2%) | 192 (94.6%) |
| 35 to 44 Years | 0 (0.0%) | 951 (98.0%) |
| 45 to 54 Years | 23 (2.6%) | 854 (97.4%) |
| 55 to 64 Years | 9 (0.8%) | 1,011 (86.7%) |
| 65 to 74 Years | 897 (97.3%) | 748 (81.1%) |
| 75 Years and over | 777 (98.5%) | 677 (85.8%) |
| Total | 1,834 (26.7%) | 6,380 (92.8%) |
Disability Status by Sex by Age in Mountainside borough
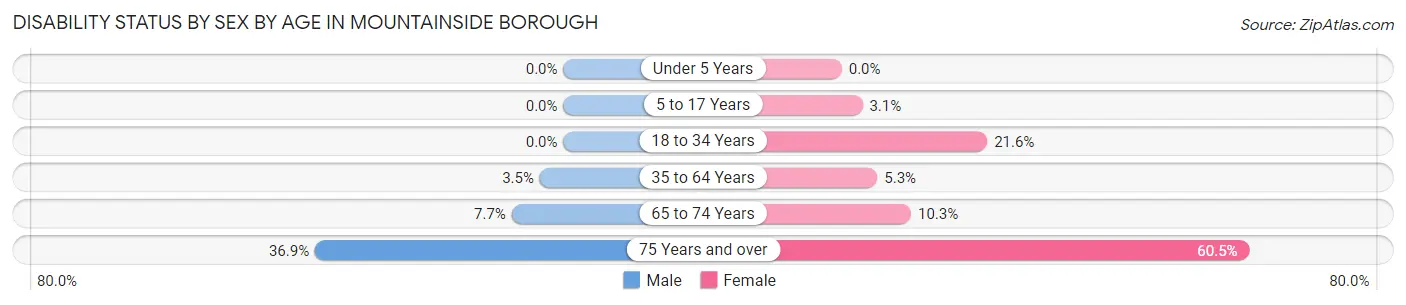
| Age Bracket | Male | Female |
| Under 5 Years | 0 (0.0%) | 0 (0.0%) |
| 5 to 17 Years | 0 (0.0%) | 15 (3.1%) |
| 18 to 34 Years | 0 (0.0%) | 76 (21.6%) |
| 35 to 64 Years | 55 (3.5%) | 76 (5.3%) |
| 65 to 74 Years | 29 (7.7%) | 56 (10.3%) |
| 75 Years and over | 149 (36.9%) | 233 (60.5%) |
Disability Class by Sex by Age in Mountainside borough
Disability Class: Hearing Difficulty
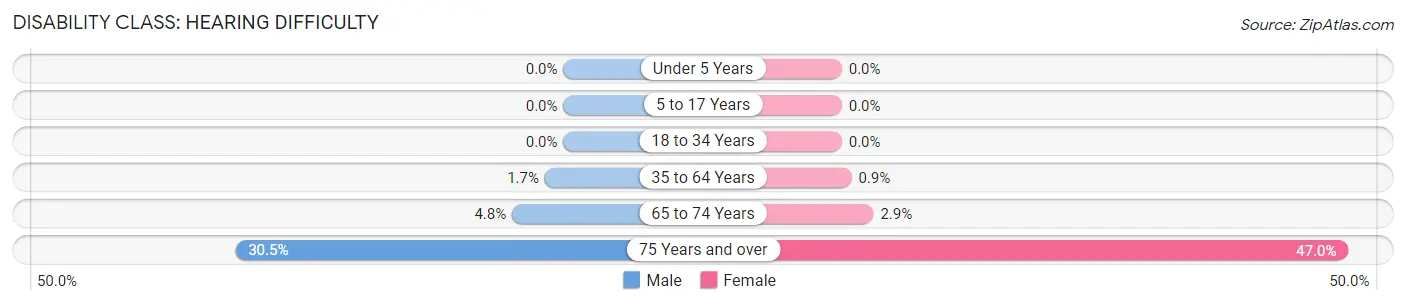
| Age Bracket | Male | Female |
| Under 5 Years | 0 (0.0%) | 0 (0.0%) |
| 5 to 17 Years | 0 (0.0%) | 0 (0.0%) |
| 18 to 34 Years | 0 (0.0%) | 0 (0.0%) |
| 35 to 64 Years | 27 (1.7%) | 13 (0.9%) |
| 65 to 74 Years | 18 (4.8%) | 16 (2.9%) |
| 75 Years and over | 123 (30.4%) | 181 (47.0%) |
Disability Class: Vision Difficulty
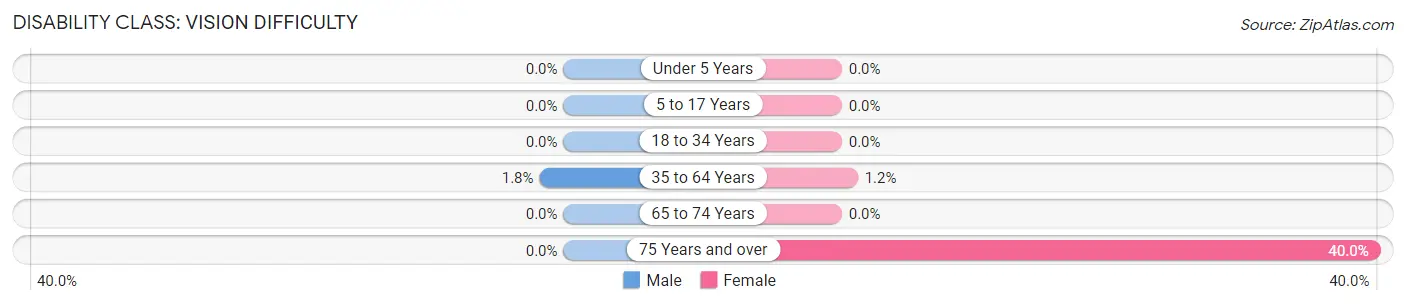
| Age Bracket | Male | Female |
| Under 5 Years | 0 (0.0%) | 0 (0.0%) |
| 5 to 17 Years | 0 (0.0%) | 0 (0.0%) |
| 18 to 34 Years | 0 (0.0%) | 0 (0.0%) |
| 35 to 64 Years | 28 (1.8%) | 17 (1.2%) |
| 65 to 74 Years | 0 (0.0%) | 0 (0.0%) |
| 75 Years and over | 0 (0.0%) | 154 (40.0%) |
Disability Class: Cognitive Difficulty
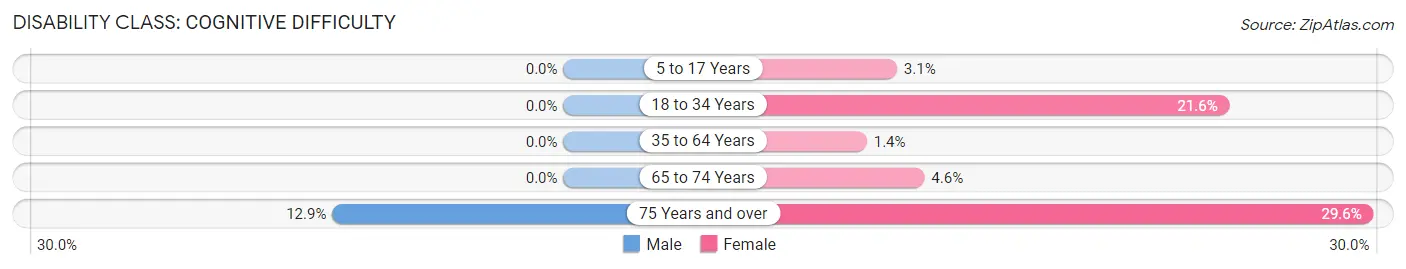
| Age Bracket | Male | Female |
| 5 to 17 Years | 0 (0.0%) | 15 (3.1%) |
| 18 to 34 Years | 0 (0.0%) | 76 (21.6%) |
| 35 to 64 Years | 0 (0.0%) | 20 (1.4%) |
| 65 to 74 Years | 0 (0.0%) | 25 (4.6%) |
| 75 Years and over | 52 (12.9%) | 114 (29.6%) |
Disability Class: Ambulatory Difficulty
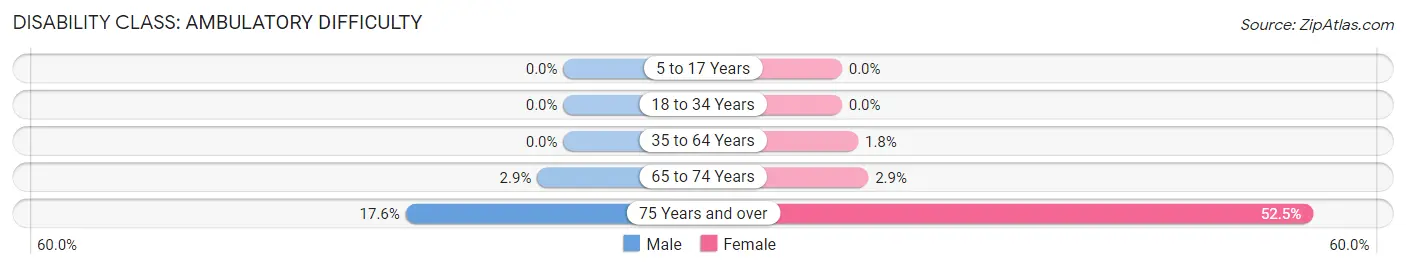
| Age Bracket | Male | Female |
| 5 to 17 Years | 0 (0.0%) | 0 (0.0%) |
| 18 to 34 Years | 0 (0.0%) | 0 (0.0%) |
| 35 to 64 Years | 0 (0.0%) | 26 (1.8%) |
| 65 to 74 Years | 11 (2.9%) | 16 (2.9%) |
| 75 Years and over | 71 (17.6%) | 202 (52.5%) |
Disability Class: Self-Care Difficulty
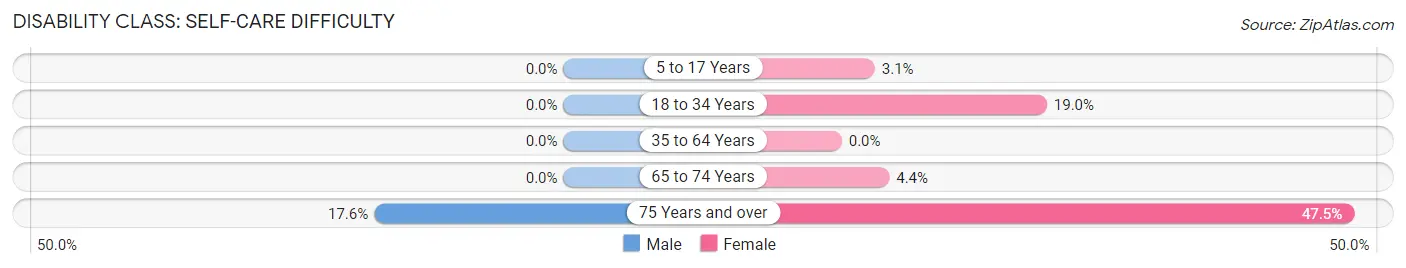
| Age Bracket | Male | Female |
| 5 to 17 Years | 0 (0.0%) | 15 (3.1%) |
| 18 to 34 Years | 0 (0.0%) | 67 (19.0%) |
| 35 to 64 Years | 0 (0.0%) | 0 (0.0%) |
| 65 to 74 Years | 0 (0.0%) | 24 (4.4%) |
| 75 Years and over | 71 (17.6%) | 183 (47.5%) |
Technology Access in Mountainside borough
Computing Device Access in Mountainside borough
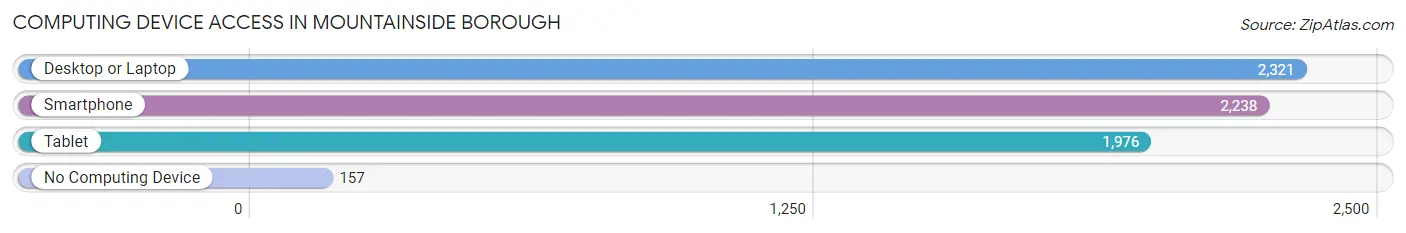
| Device Type | # Households | % Households |
| Desktop or Laptop | 2,321 | 91.5% |
| Smartphone | 2,238 | 88.2% |
| Tablet | 1,976 | 77.9% |
| No Computing Device | 157 | 6.2% |
| Total | 2,537 | 100.0% |
Internet Access in Mountainside borough
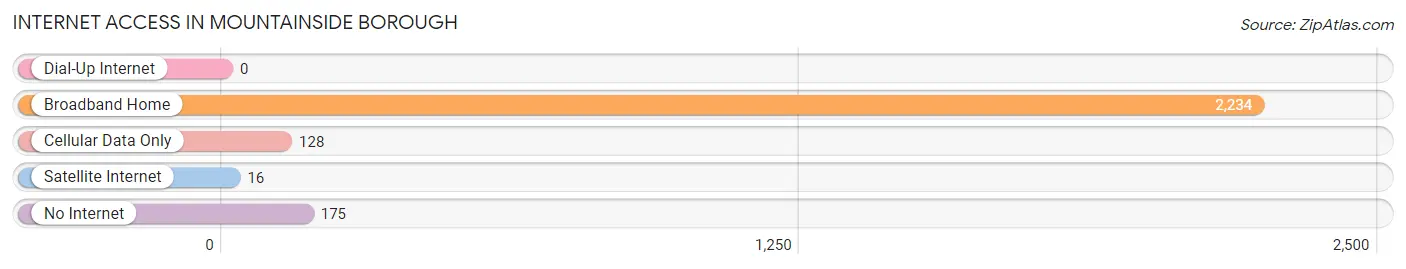
| Internet Type | # Households | % Households |
| Dial-Up Internet | 0 | 0.0% |
| Broadband Home | 2,234 | 88.1% |
| Cellular Data Only | 128 | 5.1% |
| Satellite Internet | 16 | 0.6% |
| No Internet | 175 | 6.9% |
| Total | 2,537 | 100.0% |
Mountainside borough Summary
Mountainside Borough is a small borough located in Union County, New Jersey. It is situated in the Watchung Mountains, and is bordered by Berkeley Heights, Springfield, and Westfield. The borough has a population of 6,685 as of the 2010 census, and is home to a variety of businesses, parks, and recreational activities.
History
Mountainside was originally inhabited by the Lenape Native Americans, who called the area “Minsi”, meaning “place of the mountain”. The area was first settled by Europeans in the late 17th century, and was part of the Elizabethtown Tract, a large tract of land granted to the Elizabethtown Associates in 1664. The area was known as New Providence Township until 1895, when it was incorporated as Mountainside Borough.
Geography
Mountainside is located in the Watchung Mountains, a range of low mountains in northern New Jersey. The borough is bordered by Berkeley Heights to the north, Springfield to the east, and Westfield to the south and west. The borough covers an area of 2.2 square miles, and is located at an elevation of approximately 500 feet.
Climate
Mountainside has a humid continental climate, with hot, humid summers and cold, snowy winters. The average annual temperature is around 50°F, and the average annual precipitation is around 45 inches.
Economy
Mountainside is home to a variety of businesses, including retail stores, restaurants, and professional services. The borough is also home to several corporate headquarters, including the headquarters of the pharmaceutical company Merck & Co. and the financial services company Prudential Financial.
Demographics
As of the 2010 census, Mountainside had a population of 6,685. The racial makeup of the borough was 87.3% White, 4.2% African American, 0.2% Native American, 5.2% Asian, and 2.9% from other races. The median household income was $107,917, and the median family income was $125,917.
Conclusion
Mountainside Borough is a small borough located in Union County, New Jersey. It is situated in the Watchung Mountains, and is bordered by Berkeley Heights, Springfield, and Westfield. The borough has a population of 6,685 as of the 2010 census, and is home to a variety of businesses, parks, and recreational activities. Mountainside has a humid continental climate, with hot, humid summers and cold, snowy winters. The borough is home to a variety of businesses, including retail stores, restaurants, and professional services. The racial makeup of the borough was 87.3% White, 4.2% African American, 0.2% Native American, 5.2% Asian, and 2.9% from other races. The median household income was $107,917, and the median family income was $125,917.
Common Questions
What is Per Capita Income in Mountainside borough?
Per Capita income in Mountainside borough is $79,245.
What is the Median Family Income in Mountainside borough?
Median Family Income in Mountainside borough is $201,449.
What is the Median Household income in Mountainside borough?
Median Household Income in Mountainside borough is $162,531.
What is Income or Wage Gap in Mountainside borough?
Income or Wage Gap in Mountainside borough is 41.6%.
Women in Mountainside borough earn 58.4 cents for every dollar earned by a man.
What is Inequality or Gini Index in Mountainside borough?
Inequality or Gini Index in Mountainside borough is 0.45.
What is the Total Population of Mountainside borough?
Total Population of Mountainside borough is 6,991.
What is the Total Male Population of Mountainside borough?
Total Male Population of Mountainside borough is 3,248.
What is the Total Female Population of Mountainside borough?
Total Female Population of Mountainside borough is 3,743.
What is the Ratio of Males per 100 Females in Mountainside borough?
There are 86.78 Males per 100 Females in Mountainside borough.
What is the Ratio of Females per 100 Males in Mountainside borough?
There are 115.24 Females per 100 Males in Mountainside borough.
What is the Median Population Age in Mountainside borough?
Median Population Age in Mountainside borough is 50.1 Years.
What is the Average Family Size in Mountainside borough
Average Family Size in Mountainside borough is 3.1 People.
What is the Average Household Size in Mountainside borough
Average Household Size in Mountainside borough is 2.7 People.
How Large is the Labor Force in Mountainside borough?
There are 3,219 People in the Labor Forcein in Mountainside borough.
What is the Percentage of People in the Labor Force in Mountainside borough?
57.6% of People are in the Labor Force in Mountainside borough.
What is the Unemployment Rate in Mountainside borough?
Unemployment Rate in Mountainside borough is 3.4%.