Cities with the Highest Percentage of Population with a Degree in Science and Engineering in Virginia
RELATED REPORTS & OPTIONS
Science and Engineering
Virginia
Compare Cities
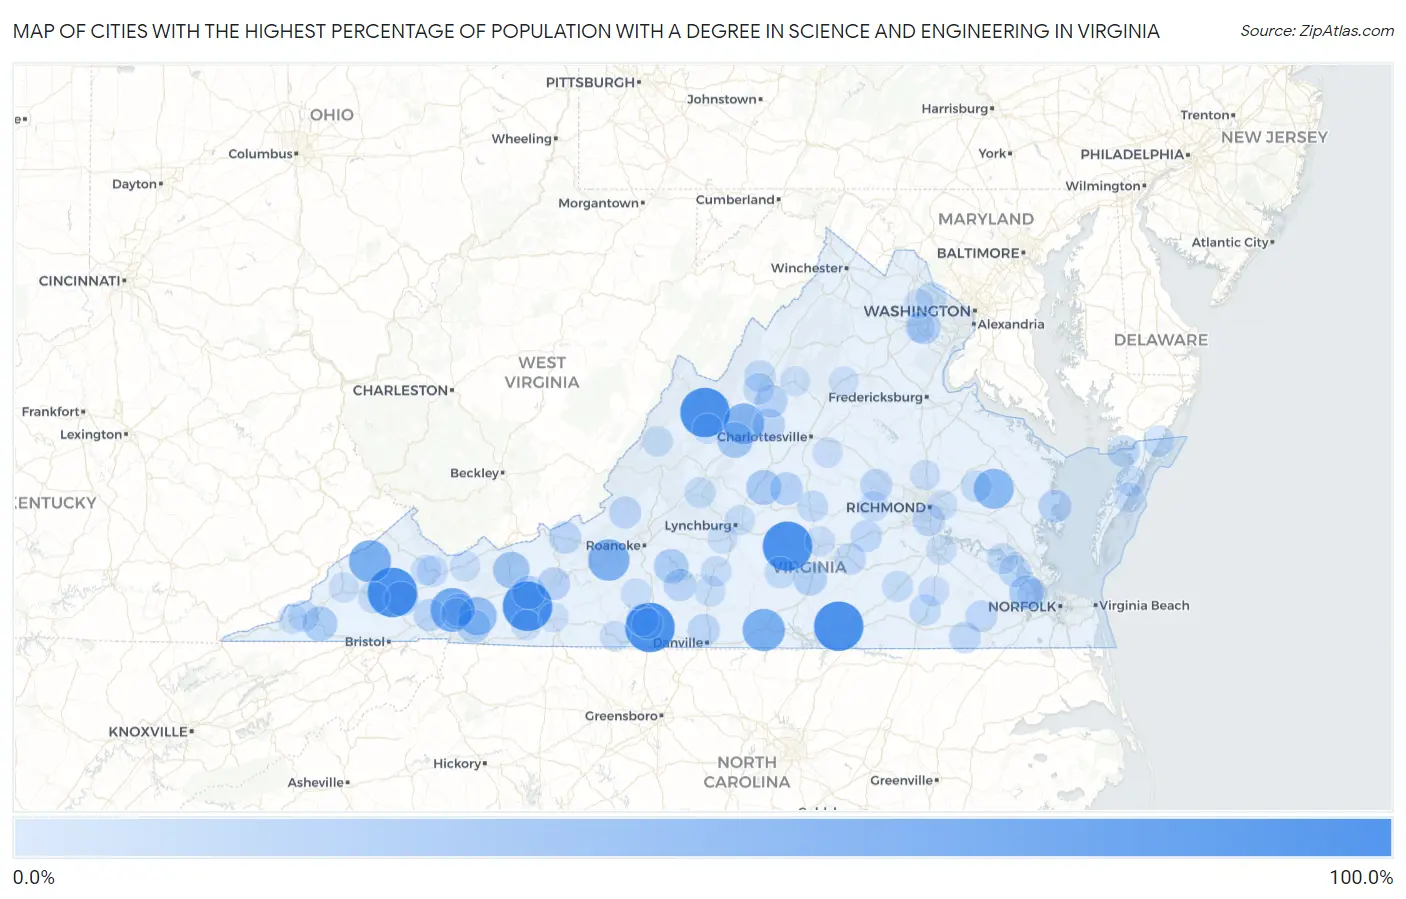
Map of Cities with the Highest Percentage of Population with a Degree in Science and Engineering in Virginia
0.0%
100.0%
Cities with the Highest Percentage of Population with a Degree in Science and Engineering in Virginia
| City | % Graduates | vs State | vs National | |
| 1. | Ivanhoe | 100.0% | 8.0%(+92.0)#1 | 9.8%(+90.2)#21 |
| 2. | Villa Heights | 100.0% | 8.0%(+92.0)#2 | 9.8%(+90.2)#30 |
| 3. | Cleveland | 100.0% | 8.0%(+92.0)#3 | 9.8%(+90.2)#51 |
| 4. | Deerfield | 100.0% | 8.0%(+92.0)#4 | 9.8%(+90.2)#52 |
| 5. | Breaks | 100.0% | 8.0%(+92.0)#5 | 9.8%(+90.2)#91 |
| 6. | Union Level | 100.0% | 8.0%(+92.0)#6 | 9.8%(+90.2)#153 |
| 7. | Pamplin City | 100.0% | 8.0%(+92.0)#7 | 9.8%(+90.2)#156 |
| 8. | Fairfield | 91.3% | 8.0%(+83.3)#8 | 9.8%(+81.5)#216 |
| 9. | Stewartsville | 86.6% | 8.0%(+78.6)#9 | 9.8%(+76.8)#224 |
| 10. | Seven Mile Ford | 74.2% | 8.0%(+66.2)#10 | 9.8%(+64.4)#284 |
| 11. | Riverdale | 67.3% | 8.0%(+59.3)#11 | 9.8%(+57.5)#320 |
| 12. | Clinchco | 66.7% | 8.0%(+58.7)#12 | 9.8%(+56.9)#323 |
| 13. | Shawsville | 63.8% | 8.0%(+55.8)#13 | 9.8%(+54.0)#358 |
| 14. | Jolivue | 60.5% | 8.0%(+52.5)#14 | 9.8%(+50.7)#396 |
| 15. | King And Queen Court House | 57.1% | 8.0%(+49.2)#15 | 9.8%(+47.4)#448 |
| 16. | Boissevain | 52.9% | 8.0%(+44.9)#16 | 9.8%(+43.1)#508 |
| 17. | Sugar Grove | 50.0% | 8.0%(+42.0)#17 | 9.8%(+40.2)#547 |
| 18. | Millboro | 50.0% | 8.0%(+42.0)#18 | 9.8%(+40.2)#593 |
| 19. | Pounding Mill | 48.0% | 8.0%(+40.0)#19 | 9.8%(+38.2)#674 |
| 20. | Bland | 41.5% | 8.0%(+33.5)#20 | 9.8%(+31.7)#895 |
| 21. | Greenville | 38.5% | 8.0%(+30.5)#21 | 9.8%(+28.7)#1,038 |
| 22. | Arrington | 35.2% | 8.0%(+27.3)#22 | 9.8%(+25.4)#1,225 |
| 23. | Duffield | 33.3% | 8.0%(+25.4)#23 | 9.8%(+23.6)#1,400 |
| 24. | Westlake Corner | 33.0% | 8.0%(+25.0)#24 | 9.8%(+23.2)#1,422 |
| 25. | Benns Church | 32.2% | 8.0%(+24.3)#25 | 9.8%(+22.5)#1,464 |
| 26. | Kincora | 32.2% | 8.0%(+24.2)#26 | 9.8%(+22.4)#1,469 |
| 27. | Lebanon | 31.9% | 8.0%(+24.0)#27 | 9.8%(+22.2)#1,482 |
| 28. | Keysville | 29.5% | 8.0%(+21.5)#28 | 9.8%(+19.7)#1,739 |
| 29. | Loch Lomond | 29.0% | 8.0%(+21.0)#29 | 9.8%(+19.2)#1,814 |
| 30. | Troutdale | 28.6% | 8.0%(+20.6)#30 | 9.8%(+18.8)#1,878 |
| 31. | Fort Chiswell | 27.8% | 8.0%(+19.9)#31 | 9.8%(+18.1)#1,973 |
| 32. | Yogaville | 26.7% | 8.0%(+18.7)#32 | 9.8%(+16.9)#2,141 |
| 33. | Deltaville | 26.6% | 8.0%(+18.6)#33 | 9.8%(+16.8)#2,150 |
| 34. | Dooms | 25.9% | 8.0%(+18.0)#34 | 9.8%(+16.1)#2,247 |
| 35. | Grottoes | 25.8% | 8.0%(+17.8)#35 | 9.8%(+16.0)#2,275 |
| 36. | Draper | 25.4% | 8.0%(+17.4)#36 | 9.8%(+15.6)#2,337 |
| 37. | Mcmullin | 25.0% | 8.0%(+17.0)#37 | 9.8%(+15.2)#2,429 |
| 38. | Penhook | 24.8% | 8.0%(+16.8)#38 | 9.8%(+15.0)#2,515 |
| 39. | Emory | 24.6% | 8.0%(+16.6)#39 | 9.8%(+14.8)#2,544 |
| 40. | Pembroke | 24.2% | 8.0%(+16.2)#40 | 9.8%(+14.4)#2,604 |
| 41. | Mount Hermon | 24.2% | 8.0%(+16.2)#41 | 9.8%(+14.4)#2,614 |
| 42. | Bensley | 24.0% | 8.0%(+16.0)#42 | 9.8%(+14.2)#2,654 |
| 43. | Hiltons | 23.8% | 8.0%(+15.8)#43 | 9.8%(+14.0)#2,689 |
| 44. | Rushmere | 23.3% | 8.0%(+15.3)#44 | 9.8%(+13.5)#2,816 |
| 45. | Goochland | 23.1% | 8.0%(+15.1)#45 | 9.8%(+13.3)#2,865 |
| 46. | New Castle | 22.8% | 8.0%(+14.8)#46 | 9.8%(+13.0)#2,950 |
| 47. | Stanleytown | 22.4% | 8.0%(+14.4)#47 | 9.8%(+12.6)#3,060 |
| 48. | Saxis | 22.2% | 8.0%(+14.3)#48 | 9.8%(+12.4)#3,109 |
| 49. | Amelia Court House | 21.8% | 8.0%(+13.9)#49 | 9.8%(+12.0)#3,226 |
| 50. | Belmont Estates | 21.8% | 8.0%(+13.8)#50 | 9.8%(+12.0)#3,237 |
| 51. | Crewe | 21.7% | 8.0%(+13.7)#51 | 9.8%(+11.9)#3,263 |
| 52. | Sedley | 21.5% | 8.0%(+13.5)#52 | 9.8%(+11.7)#3,333 |
| 53. | Newsoms | 21.3% | 8.0%(+13.4)#53 | 9.8%(+11.5)#3,400 |
| 54. | Dillwyn | 20.4% | 8.0%(+12.4)#54 | 9.8%(+10.6)#3,682 |
| 55. | Jarratt | 20.3% | 8.0%(+12.3)#55 | 9.8%(+10.5)#3,709 |
| 56. | Dryden | 20.3% | 8.0%(+12.3)#56 | 9.8%(+10.5)#3,713 |
| 57. | St Paul | 20.1% | 8.0%(+12.1)#57 | 9.8%(+10.3)#3,761 |
| 58. | Mount Crawford | 20.0% | 8.0%(+12.0)#58 | 9.8%(+10.2)#3,814 |
| 59. | Phenix | 20.0% | 8.0%(+12.0)#59 | 9.8%(+10.2)#3,823 |
| 60. | King William | 20.0% | 8.0%(+12.0)#60 | 9.8%(+10.2)#3,865 |
| 61. | Captains Cove | 19.9% | 8.0%(+12.0)#61 | 9.8%(+10.2)#3,909 |
| 62. | Richlands | 19.0% | 8.0%(+11.1)#62 | 9.8%(+9.23)#4,224 |
| 63. | Collinsville | 18.8% | 8.0%(+10.8)#63 | 9.8%(+9.00)#4,322 |
| 64. | Scotland | 18.8% | 8.0%(+10.8)#64 | 9.8%(+8.97)#4,366 |
| 65. | Adwolf | 18.4% | 8.0%(+10.5)#65 | 9.8%(+8.66)#4,494 |
| 66. | Mckenney | 18.4% | 8.0%(+10.5)#66 | 9.8%(+8.64)#4,498 |
| 67. | Oak Grove | 18.4% | 8.0%(+10.4)#67 | 9.8%(+8.57)#4,535 |
| 68. | Glasgow | 18.3% | 8.0%(+10.4)#68 | 9.8%(+8.55)#4,543 |
| 69. | Powhatan | 17.7% | 8.0%(+9.75)#69 | 9.8%(+7.93)#4,832 |
| 70. | Gretna | 17.4% | 8.0%(+9.46)#70 | 9.8%(+7.64)#4,987 |
| 71. | North Garden | 17.2% | 8.0%(+9.23)#71 | 9.8%(+7.41)#5,115 |
| 72. | Hurt | 17.1% | 8.0%(+9.17)#72 | 9.8%(+7.35)#5,146 |
| 73. | Ferrum | 17.0% | 8.0%(+9.08)#73 | 9.8%(+7.26)#5,200 |
| 74. | Port Republic | 16.9% | 8.0%(+8.89)#74 | 9.8%(+7.07)#5,298 |
| 75. | Camp Barrett | 16.8% | 8.0%(+8.80)#75 | 9.8%(+6.98)#5,334 |
| 76. | Tazewell | 16.7% | 8.0%(+8.76)#76 | 9.8%(+6.94)#5,345 |
| 77. | Hot Springs | 16.7% | 8.0%(+8.71)#77 | 9.8%(+6.89)#5,400 |
| 78. | Afton | 16.7% | 8.0%(+8.71)#78 | 9.8%(+6.89)#5,446 |
| 79. | Patrick Springs | 16.6% | 8.0%(+8.65)#79 | 9.8%(+6.83)#5,506 |
| 80. | Lake Monticello | 16.4% | 8.0%(+8.42)#80 | 9.8%(+6.60)#5,620 |
| 81. | Farmville | 16.3% | 8.0%(+8.35)#81 | 9.8%(+6.53)#5,666 |
| 82. | Wise | 16.2% | 8.0%(+8.25)#82 | 9.8%(+6.43)#5,725 |
| 83. | Stony Creek | 15.9% | 8.0%(+7.91)#83 | 9.8%(+6.09)#5,937 |
| 84. | Raven | 15.9% | 8.0%(+7.91)#84 | 9.8%(+6.08)#5,941 |
| 85. | Fort Lee | 15.9% | 8.0%(+7.89)#85 | 9.8%(+6.07)#5,951 |
| 86. | Carrollton | 15.8% | 8.0%(+7.88)#86 | 9.8%(+6.05)#5,960 |
| 87. | Accomac | 15.8% | 8.0%(+7.83)#87 | 9.8%(+6.01)#5,988 |
| 88. | Highland Springs | 15.8% | 8.0%(+7.81)#88 | 9.8%(+5.99)#6,022 |
| 89. | Wachapreague | 15.4% | 8.0%(+7.42)#89 | 9.8%(+5.60)#6,300 |
| 90. | Fries | 15.3% | 8.0%(+7.32)#90 | 9.8%(+5.50)#6,391 |
| 91. | Madison Heights | 15.3% | 8.0%(+7.30)#91 | 9.8%(+5.48)#6,399 |
| 92. | Timberlake | 15.2% | 8.0%(+7.26)#92 | 9.8%(+5.43)#6,433 |
| 93. | Craigsville | 15.2% | 8.0%(+7.19)#93 | 9.8%(+5.37)#6,475 |
| 94. | Ashland | 15.0% | 8.0%(+7.04)#94 | 9.8%(+5.22)#6,583 |
| 95. | Elkton | 14.9% | 8.0%(+6.98)#95 | 9.8%(+5.16)#6,652 |
| 96. | Bull Run | 14.9% | 8.0%(+6.97)#96 | 9.8%(+5.15)#6,660 |
| 97. | Pennington Gap | 14.9% | 8.0%(+6.89)#97 | 9.8%(+5.07)#6,727 |
| 98. | Arcola | 14.8% | 8.0%(+6.80)#98 | 9.8%(+4.98)#6,794 |
| 99. | Brightwood | 14.5% | 8.0%(+6.51)#99 | 9.8%(+4.69)#6,993 |
| 100. | Hillsville | 14.2% | 8.0%(+6.28)#100 | 9.8%(+4.46)#7,260 |
Common Questions
What are the Top 10 Cities with the Highest Percentage of Population with a Degree in Science and Engineering in Virginia?
Top 10 Cities with the Highest Percentage of Population with a Degree in Science and Engineering in Virginia are:
#1
100.0%
#2
100.0%
#3
100.0%
#4
100.0%
#5
100.0%
#6
100.0%
#7
74.2%
#8
67.3%
#9
66.7%
#10
63.8%
What city has the Highest Percentage of Population with a Degree in Science and Engineering in Virginia?
Ivanhoe has the Highest Percentage of Population with a Degree in Science and Engineering in Virginia with 100.0%.
What is the Percentage of Population with a Degree in Science and Engineering in the State of Virginia?
Percentage of Population with a Degree in Science and Engineering in Virginia is 8.0%.
What is the Percentage of Population with a Degree in Science and Engineering in the United States?
Percentage of Population with a Degree in Science and Engineering in the United States is 9.8%.