South Oroville, CA Map & Demographics
South Oroville Map
South Oroville Overview
$28,905
PER CAPITA INCOME
$78,250
AVG FAMILY INCOME
$66,150
AVG HOUSEHOLD INCOME
16.4%
WAGE / INCOME GAP [ % ]
83.6¢/ $1
WAGE / INCOME GAP [ $ ]
0.34
INEQUALITY / GINI INDEX
2,291
TOTAL POPULATION
1,210
MALE POPULATION
1,081
FEMALE POPULATION
111.93
MALES / 100 FEMALES
89.34
FEMALES / 100 MALES
37.0
MEDIAN AGE
3.2
AVG FAMILY SIZE
2.6
AVG HOUSEHOLD SIZE
1,241
LABOR FORCE [ PEOPLE ]
65.1%
PERCENT IN LABOR FORCE
4.8%
UNEMPLOYMENT RATE
Income in South Oroville
Income Overview in South Oroville
Per Capita Income in South Oroville is $28,905, while median incomes of families and households are $78,250 and $66,150 respectively.
| Characteristic | Number | Measure |
| Per Capita Income | 2,291 | $28,905 |
| Median Family Income | 451 | $78,250 |
| Mean Family Income | 451 | $92,034 |
| Median Household Income | 895 | $66,150 |
| Mean Household Income | 895 | $74,353 |
| Income Deficit | 451 | $0 |
| Wage / Income Gap (%) | 2,291 | 16.41% |
| Wage / Income Gap ($) | 2,291 | 83.59¢ per $1 |
| Gini / Inequality Index | 2,291 | 0.34 |
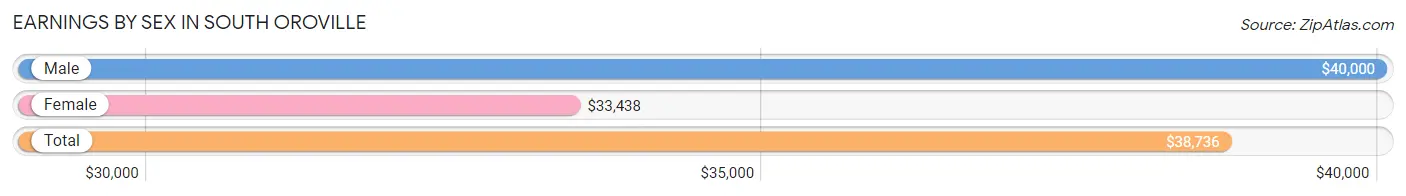
Earnings by Sex in South Oroville
Average Earnings in South Oroville are $38,736, $40,000 for men and $33,438 for women, a difference of 16.4%.
| Sex | Number | Average Earnings |
| Male | 760 (58.3%) | $40,000 |
| Female | 544 (41.7%) | $33,438 |
| Total | 1,304 (100.0%) | $38,736 |
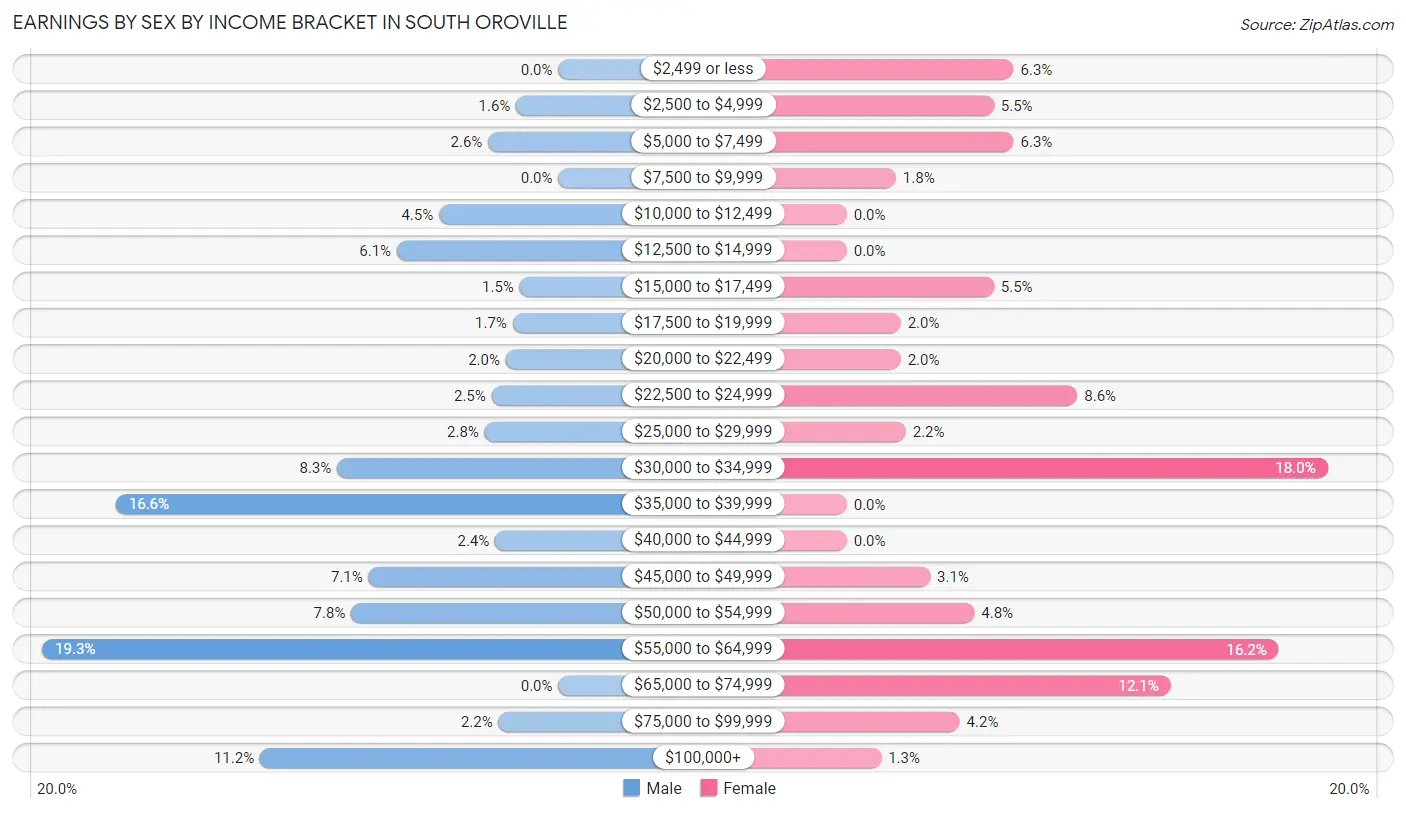
Earnings by Sex by Income Bracket in South Oroville
The most common earnings brackets in South Oroville are $55,000 to $64,999 for men (147 | 19.3%) and $30,000 to $34,999 for women (98 | 18.0%).
| Income | Male | Female |
| $2,499 or less | 0 (0.0%) | 34 (6.2%) |
| $2,500 to $4,999 | 12 (1.6%) | 30 (5.5%) |
| $5,000 to $7,499 | 20 (2.6%) | 34 (6.2%) |
| $7,500 to $9,999 | 0 (0.0%) | 10 (1.8%) |
| $10,000 to $12,499 | 34 (4.5%) | 0 (0.0%) |
| $12,500 to $14,999 | 46 (6.0%) | 0 (0.0%) |
| $15,000 to $17,499 | 11 (1.5%) | 30 (5.5%) |
| $17,500 to $19,999 | 13 (1.7%) | 11 (2.0%) |
| $20,000 to $22,499 | 15 (2.0%) | 11 (2.0%) |
| $22,500 to $24,999 | 19 (2.5%) | 47 (8.6%) |
| $25,000 to $29,999 | 21 (2.8%) | 12 (2.2%) |
| $30,000 to $34,999 | 63 (8.3%) | 98 (18.0%) |
| $35,000 to $39,999 | 126 (16.6%) | 0 (0.0%) |
| $40,000 to $44,999 | 18 (2.4%) | 0 (0.0%) |
| $45,000 to $49,999 | 54 (7.1%) | 17 (3.1%) |
| $50,000 to $54,999 | 59 (7.8%) | 26 (4.8%) |
| $55,000 to $64,999 | 147 (19.3%) | 88 (16.2%) |
| $65,000 to $74,999 | 0 (0.0%) | 66 (12.1%) |
| $75,000 to $99,999 | 17 (2.2%) | 23 (4.2%) |
| $100,000+ | 85 (11.2%) | 7 (1.3%) |
| Total | 760 (100.0%) | 544 (100.0%) |
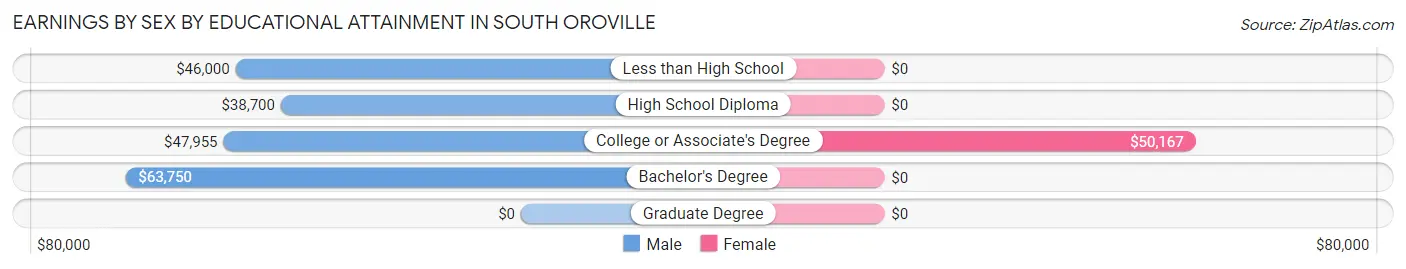
Earnings by Sex by Educational Attainment in South Oroville
Average earnings in South Oroville are $45,875 for men and $34,861 for women, a difference of 24.0%. Men with an educational attainment of bachelor's degree enjoy the highest average annual earnings of $63,750, while those with high school diploma education earn the least with $38,700. Women with an educational attainment of college or associate's degree earn the most with the average annual earnings of $50,167, while those with college or associate's degree education have the smallest earnings of $50,167.
| Educational Attainment | Male Income | Female Income |
| Less than High School | $46,000 | $0 |
| High School Diploma | $38,700 | $0 |
| College or Associate's Degree | $47,955 | $50,167 |
| Bachelor's Degree | $63,750 | $0 |
| Graduate Degree | - | - |
| Total | $45,875 | $34,861 |
Family Income in South Oroville
Family Income Brackets in South Oroville
According to the South Oroville family income data, there are 133 families falling into the $50,000 to $74,999 income range, which is the most common income bracket and makes up 29.5% of all families.
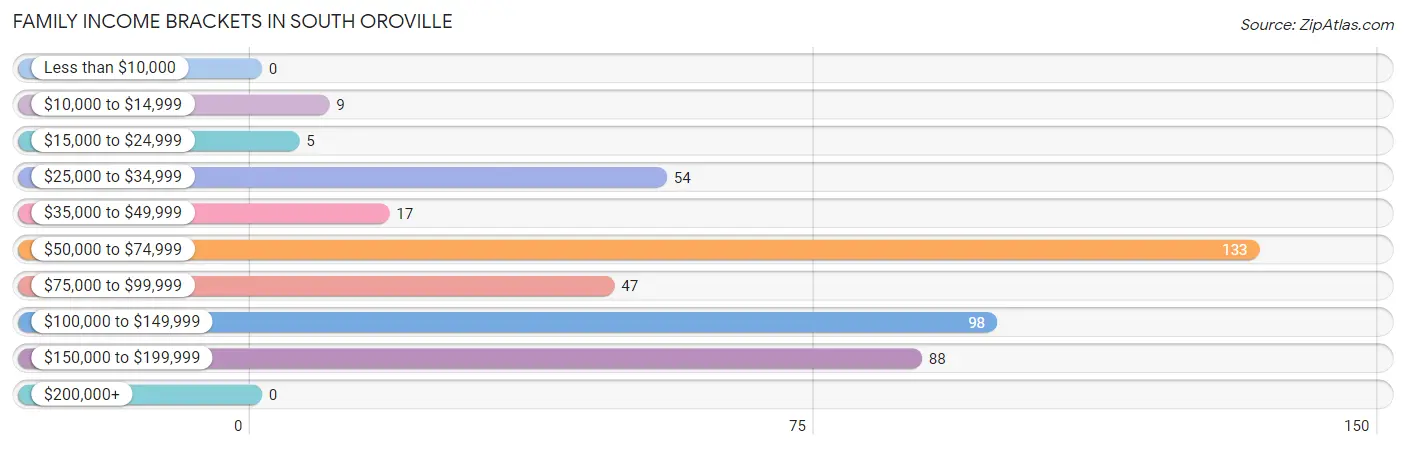
| Income Bracket | # Families | % Families |
| Less than $10,000 | 0 | 0.0% |
| $10,000 to $14,999 | 9 | 2.0% |
| $15,000 to $24,999 | 5 | 1.1% |
| $25,000 to $34,999 | 54 | 12.0% |
| $35,000 to $49,999 | 17 | 3.8% |
| $50,000 to $74,999 | 133 | 29.5% |
| $75,000 to $99,999 | 47 | 10.4% |
| $100,000 to $149,999 | 98 | 21.7% |
| $150,000 to $199,999 | 88 | 19.5% |
| $200,000+ | 0 | 0.0% |
Family Income by Famaliy Size in South Oroville
4-person families (38 | 8.4%) account for the highest median family income in South Oroville with $154,545 per family, while 2-person families (220 | 48.8%) have the highest median income of $48,978 per family member.
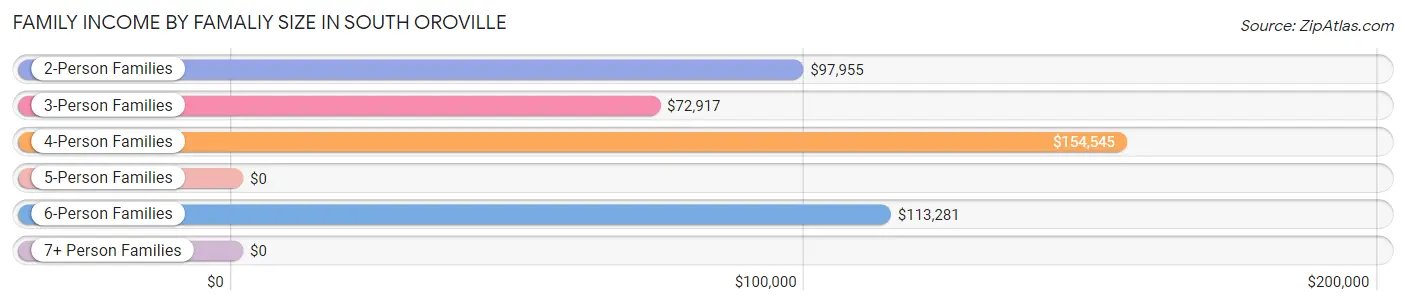
| Income Bracket | # Families | Median Income |
| 2-Person Families | 220 (48.8%) | $97,955 |
| 3-Person Families | 75 (16.6%) | $72,917 |
| 4-Person Families | 38 (8.4%) | $154,545 |
| 5-Person Families | 93 (20.6%) | $0 |
| 6-Person Families | 25 (5.5%) | $113,281 |
| 7+ Person Families | 0 (0.0%) | $0 |
| Total | 451 (100.0%) | $78,250 |
Family Income by Number of Earners in South Oroville
The median family income in South Oroville is $78,250, with families comprising 2 earners (199) having the highest median family income of $123,482, while families with no earners (42) have the lowest median family income of $61,000, accounting for 44.1% and 9.3% of families, respectively.
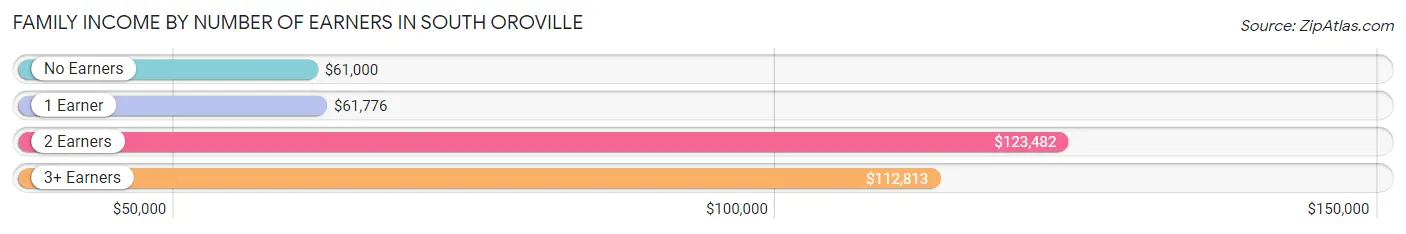
| Number of Earners | # Families | Median Income |
| No Earners | 42 (9.3%) | $61,000 |
| 1 Earner | 166 (36.8%) | $61,776 |
| 2 Earners | 199 (44.1%) | $123,482 |
| 3+ Earners | 44 (9.8%) | $112,813 |
| Total | 451 (100.0%) | $78,250 |
Household Income in South Oroville
Household Income Brackets in South Oroville
With 226 households falling in the category, the $50,000 to $74,999 income range is the most frequent in South Oroville, accounting for 25.3% of all households.
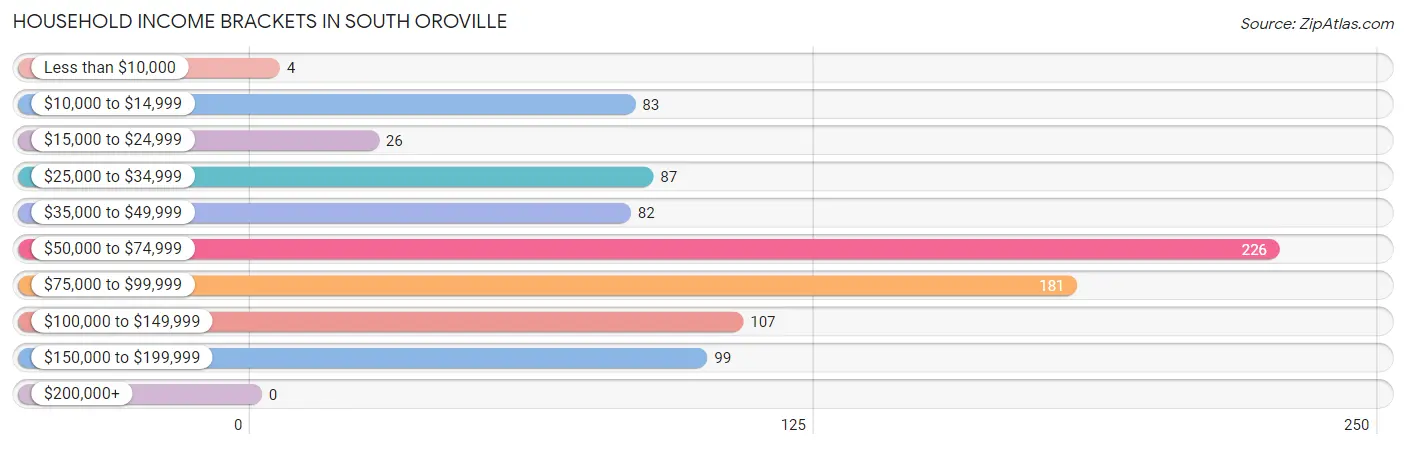
| Income Bracket | # Households | % Households |
| Less than $10,000 | 4 | 0.4% |
| $10,000 to $14,999 | 83 | 9.3% |
| $15,000 to $24,999 | 26 | 2.9% |
| $25,000 to $34,999 | 87 | 9.7% |
| $35,000 to $49,999 | 82 | 9.2% |
| $50,000 to $74,999 | 226 | 25.3% |
| $75,000 to $99,999 | 181 | 20.2% |
| $100,000 to $149,999 | 107 | 12.0% |
| $150,000 to $199,999 | 99 | 11.1% |
| $200,000+ | 0 | 0.0% |
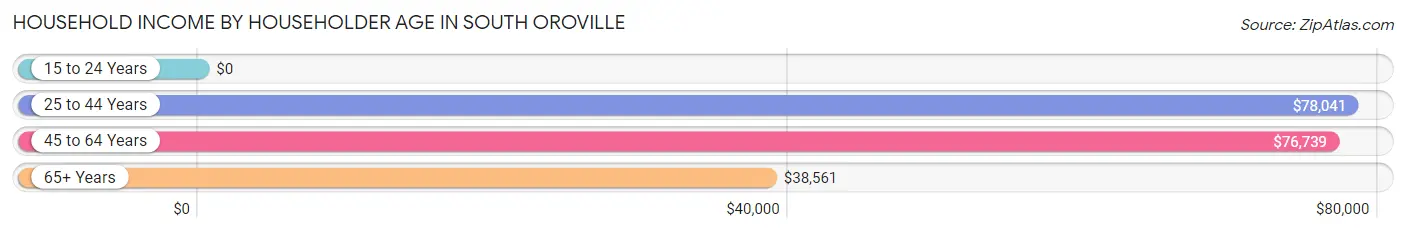
Household Income by Householder Age in South Oroville
The median household income in South Oroville is $66,150, with the highest median household income of $78,041 found in the 25 to 44 years age bracket for the primary householder. A total of 278 households (31.1%) fall into this category. Meanwhile, the 15 to 24 years age bracket for the primary householder has the lowest median household income of $0, with 28 households (3.1%) in this group.
| Income Bracket | # Households | Median Income |
| 15 to 24 Years | 28 (3.1%) | $0 |
| 25 to 44 Years | 278 (31.1%) | $78,041 |
| 45 to 64 Years | 326 (36.4%) | $76,739 |
| 65+ Years | 263 (29.4%) | $38,561 |
| Total | 895 (100.0%) | $66,150 |
Poverty in South Oroville
Income Below Poverty by Sex and Age in South Oroville
With 14.4% poverty level for males and 17.5% for females among the residents of South Oroville, 16 and 17 year old males and 16 and 17 year old females are the most vulnerable to poverty, with 14 males (100.0%) and 16 females (69.6%) in their respective age groups living below the poverty level.
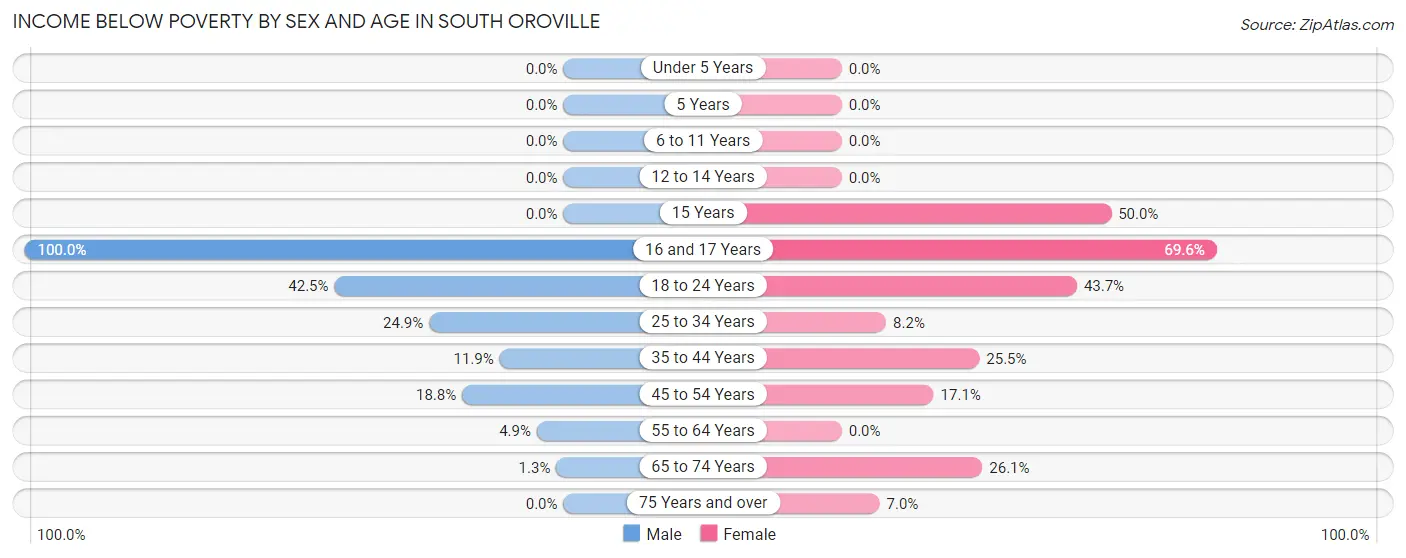
| Age Bracket | Male | Female |
| Under 5 Years | 0 (0.0%) | 0 (0.0%) |
| 5 Years | 0 (0.0%) | 0 (0.0%) |
| 6 to 11 Years | 0 (0.0%) | 0 (0.0%) |
| 12 to 14 Years | 0 (0.0%) | 0 (0.0%) |
| 15 Years | 0 (0.0%) | 7 (50.0%) |
| 16 and 17 Years | 14 (100.0%) | 16 (69.6%) |
| 18 to 24 Years | 34 (42.5%) | 55 (43.6%) |
| 25 to 34 Years | 74 (24.9%) | 13 (8.2%) |
| 35 to 44 Years | 16 (11.8%) | 24 (25.5%) |
| 45 to 54 Years | 25 (18.8%) | 30 (17.1%) |
| 55 to 64 Years | 9 (4.9%) | 0 (0.0%) |
| 65 to 74 Years | 2 (1.3%) | 30 (26.1%) |
| 75 Years and over | 0 (0.0%) | 4 (7.0%) |
| Total | 174 (14.4%) | 179 (17.5%) |
Income Above Poverty by Sex and Age in South Oroville
According to the poverty statistics in South Oroville, males aged under 5 years and females aged under 5 years are the age groups that are most secure financially, with 100.0% of males and 100.0% of females in these age groups living above the poverty line.
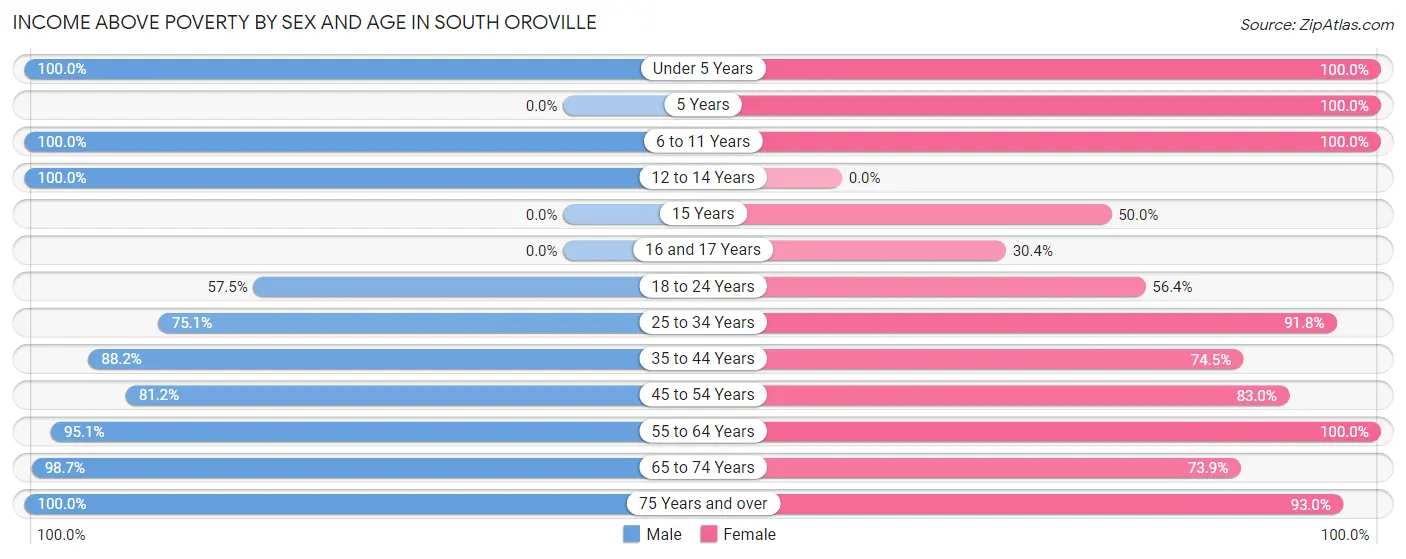
| Age Bracket | Male | Female |
| Under 5 Years | 76 (100.0%) | 64 (100.0%) |
| 5 Years | 0 (0.0%) | 8 (100.0%) |
| 6 to 11 Years | 76 (100.0%) | 50 (100.0%) |
| 12 to 14 Years | 40 (100.0%) | 0 (0.0%) |
| 15 Years | 0 (0.0%) | 7 (50.0%) |
| 16 and 17 Years | 0 (0.0%) | 7 (30.4%) |
| 18 to 24 Years | 46 (57.5%) | 71 (56.4%) |
| 25 to 34 Years | 223 (75.1%) | 145 (91.8%) |
| 35 to 44 Years | 119 (88.1%) | 70 (74.5%) |
| 45 to 54 Years | 108 (81.2%) | 146 (83.0%) |
| 55 to 64 Years | 174 (95.1%) | 139 (100.0%) |
| 65 to 74 Years | 149 (98.7%) | 85 (73.9%) |
| 75 Years and over | 25 (100.0%) | 53 (93.0%) |
| Total | 1,036 (85.6%) | 845 (82.5%) |
Income Below Poverty Among Married-Couple Families in South Oroville
The poverty statistics for married-couple families in South Oroville show that 3.5% or 12 of the total 346 families live below the poverty line. Families with 1 or 2 children have the highest poverty rate of 16.9%, comprising of 12 families. On the other hand, families with no children have the lowest poverty rate of 0.0%, which includes 0 families.
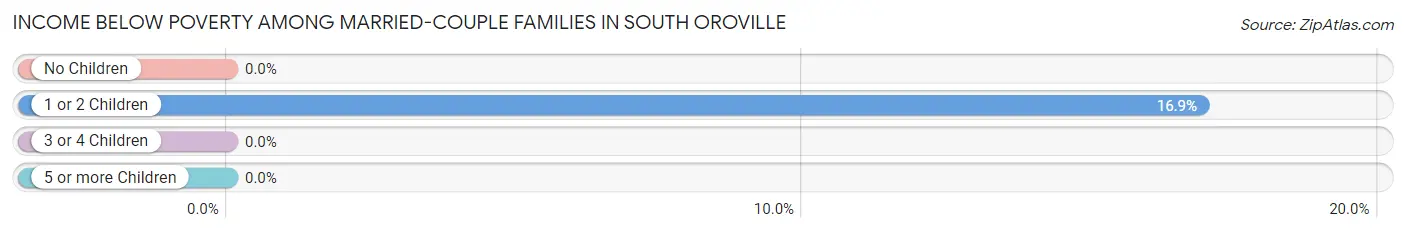
| Children | Above Poverty | Below Poverty |
| No Children | 211 (100.0%) | 0 (0.0%) |
| 1 or 2 Children | 59 (83.1%) | 12 (16.9%) |
| 3 or 4 Children | 64 (100.0%) | 0 (0.0%) |
| 5 or more Children | 0 (0.0%) | 0 (0.0%) |
| Total | 334 (96.5%) | 12 (3.5%) |
Income Below Poverty Among Single-Parent Households in South Oroville
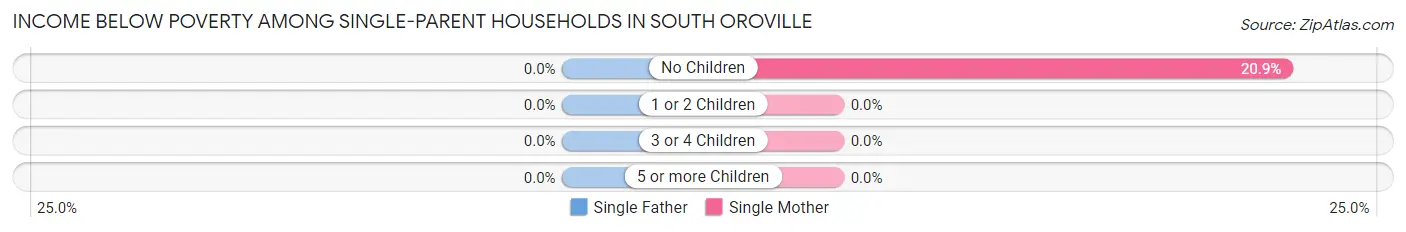
| Children | Single Father | Single Mother |
| No Children | 0 (0.0%) | 9 (20.9%) |
| 1 or 2 Children | 0 (0.0%) | 0 (0.0%) |
| 3 or 4 Children | 0 (0.0%) | 0 (0.0%) |
| 5 or more Children | 0 (0.0%) | 0 (0.0%) |
| Total | 0 (0.0%) | 9 (15.0%) |
Income Below Poverty Among Married-Couple vs Single-Parent Households in South Oroville
The poverty data for South Oroville shows that 12 of the married-couple family households (3.5%) and 9 of the single-parent households (8.6%) are living below the poverty level. Within the married-couple family households, those with 1 or 2 children have the highest poverty rate, with 12 households (16.9%) falling below the poverty line. Among the single-parent households, those with no children have the highest poverty rate, with 9 household (14.3%) living below poverty.
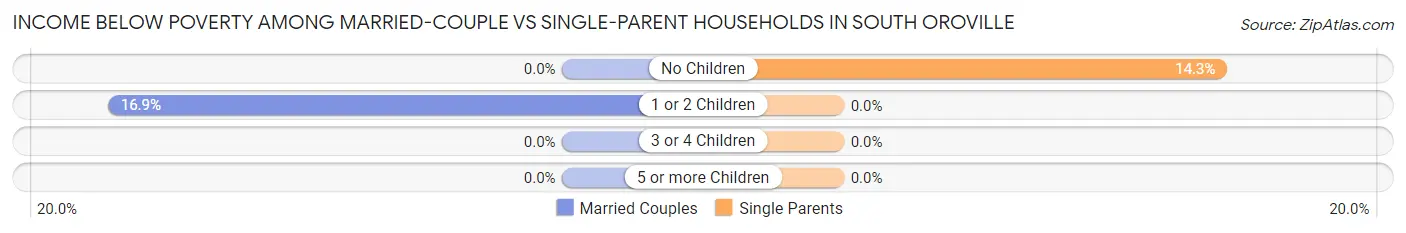
| Children | Married-Couple Families | Single-Parent Households |
| No Children | 0 (0.0%) | 9 (14.3%) |
| 1 or 2 Children | 12 (16.9%) | 0 (0.0%) |
| 3 or 4 Children | 0 (0.0%) | 0 (0.0%) |
| 5 or more Children | 0 (0.0%) | 0 (0.0%) |
| Total | 12 (3.5%) | 9 (8.6%) |
Race in South Oroville
The most populous races in South Oroville are White / Caucasian (1,343 | 58.6%), Hispanic or Latino (581 | 25.4%), and Asian (274 | 12.0%).
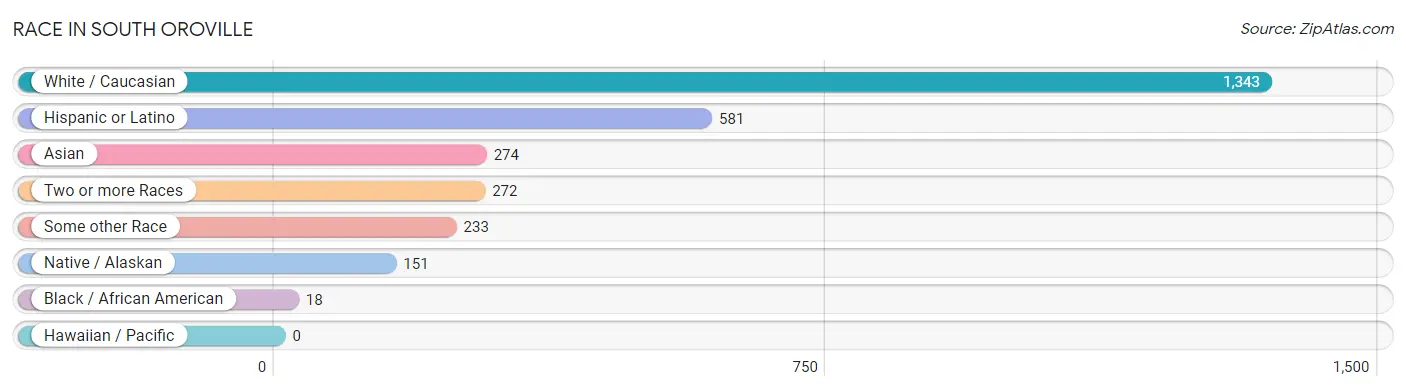
| Race | # Population | % Population |
| Asian | 274 | 12.0% |
| Black / African American | 18 | 0.8% |
| Hawaiian / Pacific | 0 | 0.0% |
| Hispanic or Latino | 581 | 25.4% |
| Native / Alaskan | 151 | 6.6% |
| White / Caucasian | 1,343 | 58.6% |
| Two or more Races | 272 | 11.9% |
| Some other Race | 233 | 10.2% |
| Total | 2,291 | 100.0% |
Ancestry in South Oroville
The most populous ancestries reported in South Oroville are Mexican (514 | 22.4%), American (275 | 12.0%), German (224 | 9.8%), Irish (210 | 9.2%), and English (177 | 7.7%), together accounting for 61.1% of all South Oroville residents.
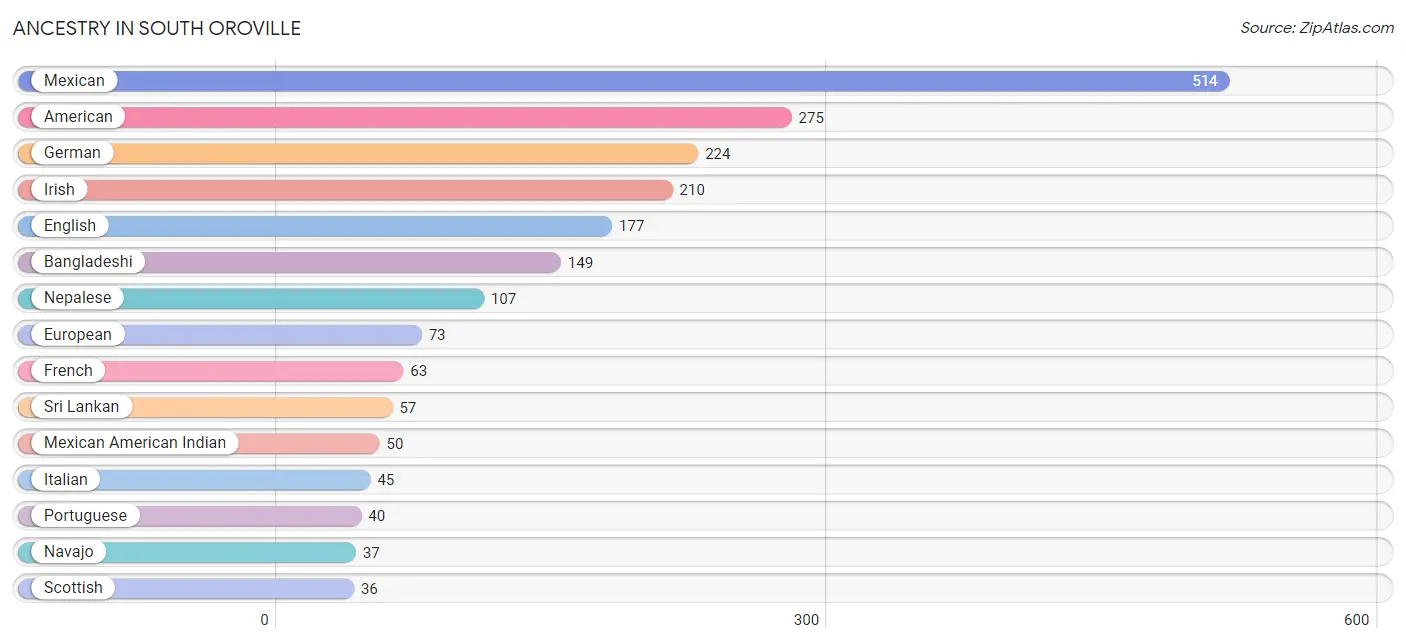
| Ancestry | # Population | % Population |
| American | 275 | 12.0% |
| Bangladeshi | 149 | 6.5% |
| Basque | 12 | 0.5% |
| Bhutanese | 23 | 1.0% |
| British | 11 | 0.5% |
| Canadian | 13 | 0.6% |
| Central American | 5 | 0.2% |
| Cherokee | 18 | 0.8% |
| Choctaw | 17 | 0.7% |
| Dutch | 12 | 0.5% |
| English | 177 | 7.7% |
| European | 73 | 3.2% |
| French | 63 | 2.8% |
| German | 224 | 9.8% |
| Honduran | 5 | 0.2% |
| Irish | 210 | 9.2% |
| Italian | 45 | 2.0% |
| Korean | 11 | 0.5% |
| Mexican | 514 | 22.4% |
| Mexican American Indian | 50 | 2.2% |
| Navajo | 37 | 1.6% |
| Nepalese | 107 | 4.7% |
| Nigerian | 2 | 0.1% |
| Norwegian | 26 | 1.1% |
| Portuguese | 40 | 1.8% |
| Puerto Rican | 29 | 1.3% |
| Scandinavian | 11 | 0.5% |
| Scotch-Irish | 10 | 0.4% |
| Scottish | 36 | 1.6% |
| Spaniard | 33 | 1.4% |
| Sri Lankan | 57 | 2.5% |
| Subsaharan African | 2 | 0.1% |
| Welsh | 13 | 0.6% | View All 33 Rows |
Immigrants in South Oroville
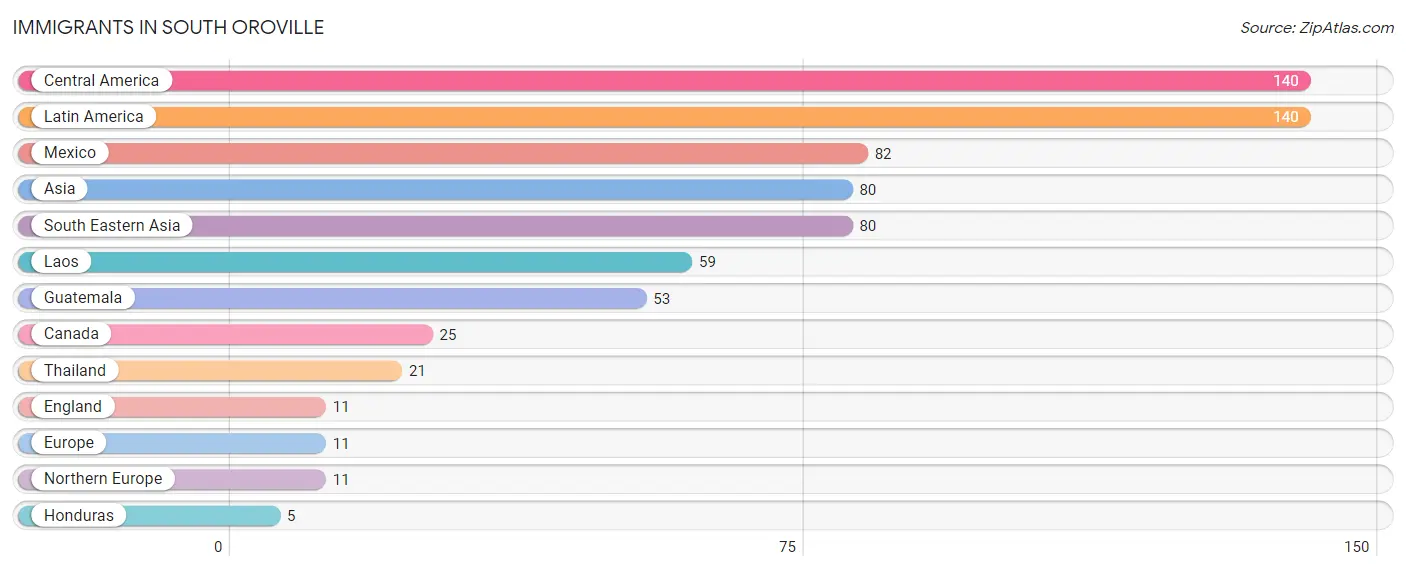
The most numerous immigrant groups reported in South Oroville came from Central America (140 | 6.1%), Latin America (140 | 6.1%), Mexico (82 | 3.6%), Asia (80 | 3.5%), and South Eastern Asia (80 | 3.5%), together accounting for 22.8% of all South Oroville residents.
| Immigration Origin | # Population | % Population |
| Asia | 80 | 3.5% |
| Canada | 25 | 1.1% |
| Central America | 140 | 6.1% |
| England | 11 | 0.5% |
| Europe | 11 | 0.5% |
| Guatemala | 53 | 2.3% |
| Honduras | 5 | 0.2% |
| Laos | 59 | 2.6% |
| Latin America | 140 | 6.1% |
| Mexico | 82 | 3.6% |
| Northern Europe | 11 | 0.5% |
| South Eastern Asia | 80 | 3.5% |
| Thailand | 21 | 0.9% | View All 13 Rows |
Sex and Age in South Oroville
Sex and Age in South Oroville
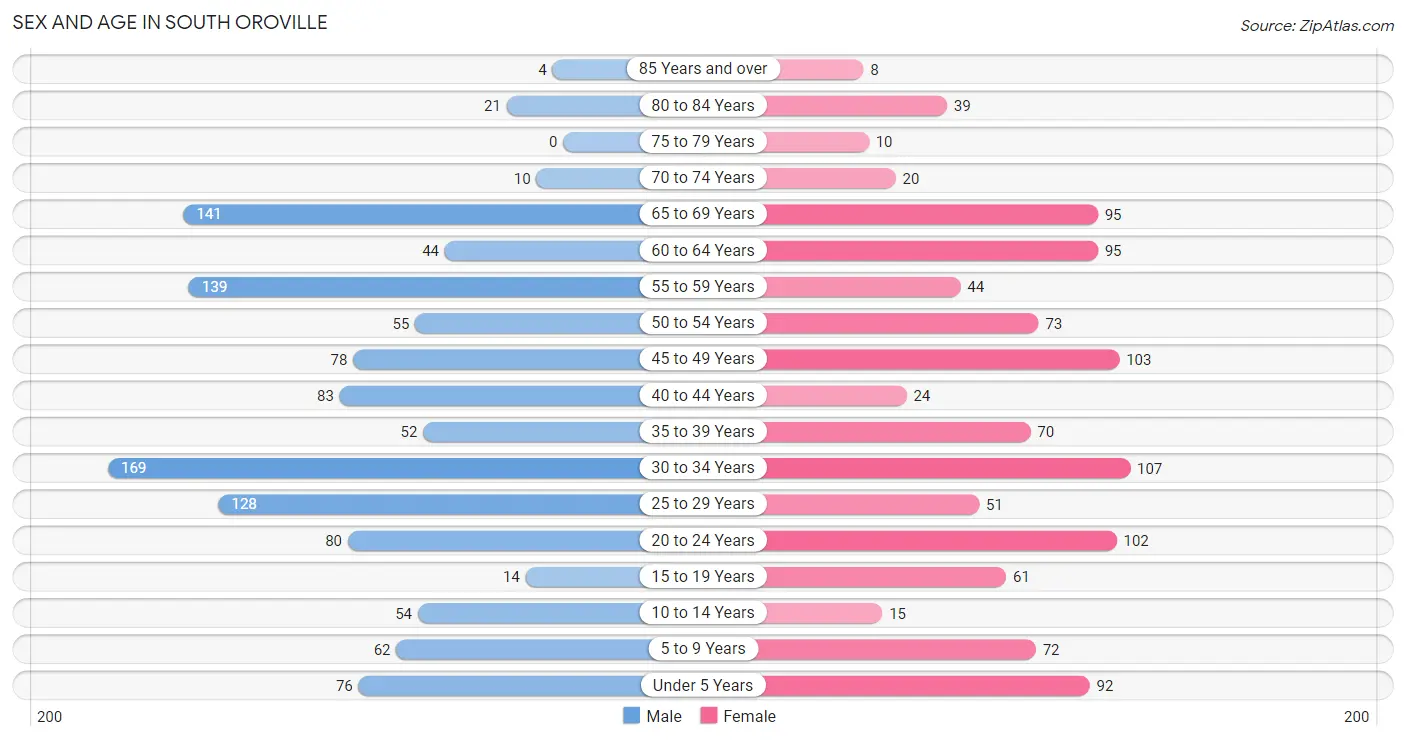
The most populous age groups in South Oroville are 30 to 34 Years (169 | 14.0%) for men and 30 to 34 Years (107 | 9.9%) for women.
| Age Bracket | Male | Female |
| Under 5 Years | 76 (6.3%) | 92 (8.5%) |
| 5 to 9 Years | 62 (5.1%) | 72 (6.7%) |
| 10 to 14 Years | 54 (4.5%) | 15 (1.4%) |
| 15 to 19 Years | 14 (1.2%) | 61 (5.6%) |
| 20 to 24 Years | 80 (6.6%) | 102 (9.4%) |
| 25 to 29 Years | 128 (10.6%) | 51 (4.7%) |
| 30 to 34 Years | 169 (14.0%) | 107 (9.9%) |
| 35 to 39 Years | 52 (4.3%) | 70 (6.5%) |
| 40 to 44 Years | 83 (6.9%) | 24 (2.2%) |
| 45 to 49 Years | 78 (6.5%) | 103 (9.5%) |
| 50 to 54 Years | 55 (4.5%) | 73 (6.8%) |
| 55 to 59 Years | 139 (11.5%) | 44 (4.1%) |
| 60 to 64 Years | 44 (3.6%) | 95 (8.8%) |
| 65 to 69 Years | 141 (11.7%) | 95 (8.8%) |
| 70 to 74 Years | 10 (0.8%) | 20 (1.8%) |
| 75 to 79 Years | 0 (0.0%) | 10 (0.9%) |
| 80 to 84 Years | 21 (1.7%) | 39 (3.6%) |
| 85 Years and over | 4 (0.3%) | 8 (0.7%) |
| Total | 1,210 (100.0%) | 1,081 (100.0%) |
Families and Households in South Oroville
Median Family Size in South Oroville
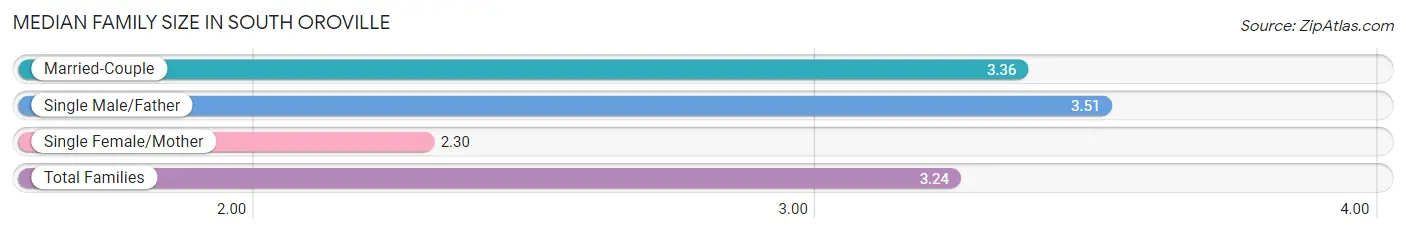
The median family size in South Oroville is 3.24 persons per family, with single male/father families (45 | 10.0%) accounting for the largest median family size of 3.51 persons per family. On the other hand, single female/mother families (60 | 13.3%) represent the smallest median family size with 2.30 persons per family.
| Family Type | # Families | Family Size |
| Married-Couple | 346 (76.7%) | 3.36 |
| Single Male/Father | 45 (10.0%) | 3.51 |
| Single Female/Mother | 60 (13.3%) | 2.30 |
| Total Families | 451 (100.0%) | 3.24 |
Median Household Size in South Oroville
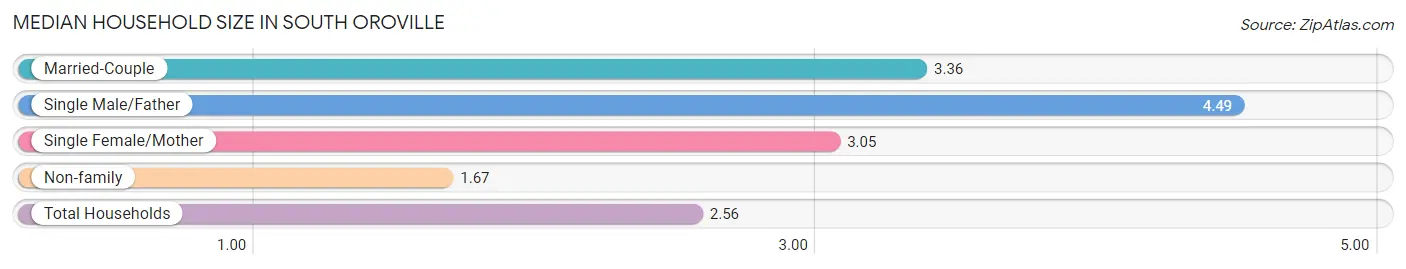
The median household size in South Oroville is 2.56 persons per household, with single male/father households (45 | 5.0%) accounting for the largest median household size of 4.49 persons per household. non-family households (444 | 49.6%) represent the smallest median household size with 1.67 persons per household.
| Household Type | # Households | Household Size |
| Married-Couple | 346 (38.7%) | 3.36 |
| Single Male/Father | 45 (5.0%) | 4.49 |
| Single Female/Mother | 60 (6.7%) | 3.05 |
| Non-family | 444 (49.6%) | 1.67 |
| Total Households | 895 (100.0%) | 2.56 |
Household Size by Marriage Status in South Oroville
Out of a total of 895 households in South Oroville, 451 (50.4%) are family households, while 444 (49.6%) are nonfamily households. The most numerous type of family households are 2-person households, comprising 198, and the most common type of nonfamily households are 1-person households, comprising 299.
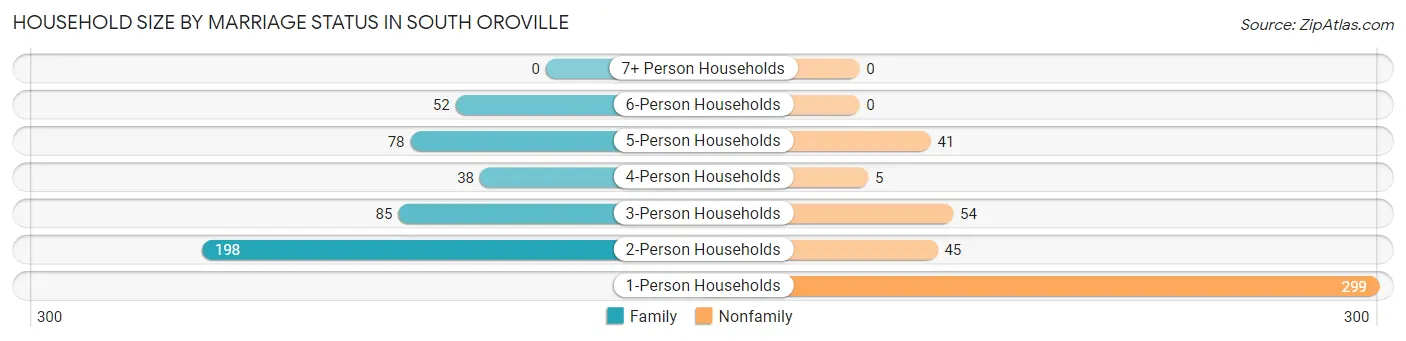
| Household Size | Family Households | Nonfamily Households |
| 1-Person Households | - | 299 (33.4%) |
| 2-Person Households | 198 (22.1%) | 45 (5.0%) |
| 3-Person Households | 85 (9.5%) | 54 (6.0%) |
| 4-Person Households | 38 (4.3%) | 5 (0.6%) |
| 5-Person Households | 78 (8.7%) | 41 (4.6%) |
| 6-Person Households | 52 (5.8%) | 0 (0.0%) |
| 7+ Person Households | 0 (0.0%) | 0 (0.0%) |
| Total | 451 (50.4%) | 444 (49.6%) |
Female Fertility in South Oroville
Fertility by Age in South Oroville
Average fertility rate in South Oroville is 104.0 births per 1,000 women. Women in the age bracket of 20 to 34 years have the highest fertility rate with 208.0 births per 1,000 women. Women in the age bracket of 20 to 34 years acount for 100.0% of all women with births.
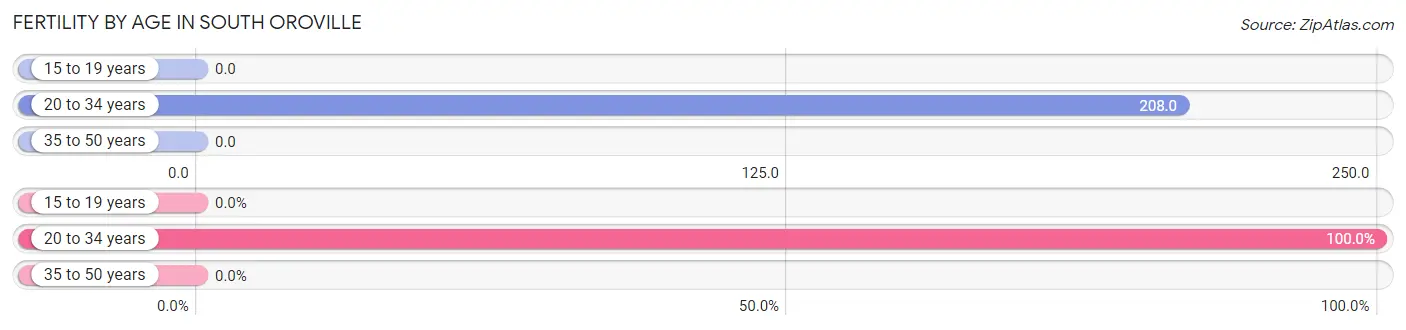
| Age Bracket | Women with Births | Births / 1,000 Women |
| 15 to 19 years | 0 (0.0%) | 0.0 |
| 20 to 34 years | 54 (100.0%) | 208.0 |
| 35 to 50 years | 0 (0.0%) | 0.0 |
| Total | 54 (100.0%) | 104.0 |
Fertility by Age by Marriage Status in South Oroville
90.7% of women with births (54) in South Oroville are married. The highest percentage of unmarried women with births falls into 20 to 34 years age bracket with 9.3% of them unmarried at the time of birth, while the lowest percentage of unmarried women with births belong to 20 to 34 years age bracket with 9.3% of them unmarried.
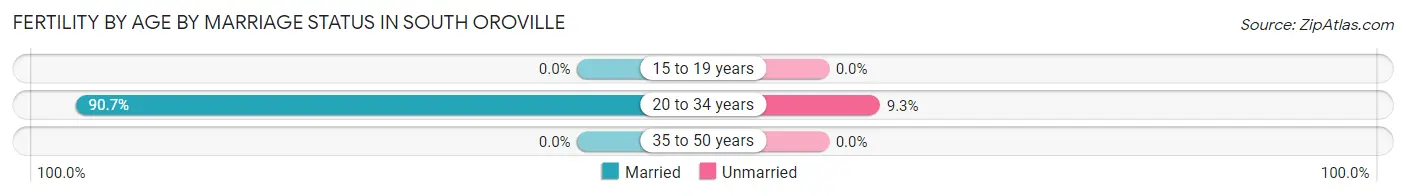
| Age Bracket | Married | Unmarried |
| 15 to 19 years | 0 (0.0%) | 0 (0.0%) |
| 20 to 34 years | 49 (90.7%) | 5 (9.3%) |
| 35 to 50 years | 0 (0.0%) | 0 (0.0%) |
| Total | 49 (90.7%) | 5 (9.3%) |
Fertility by Education in South Oroville
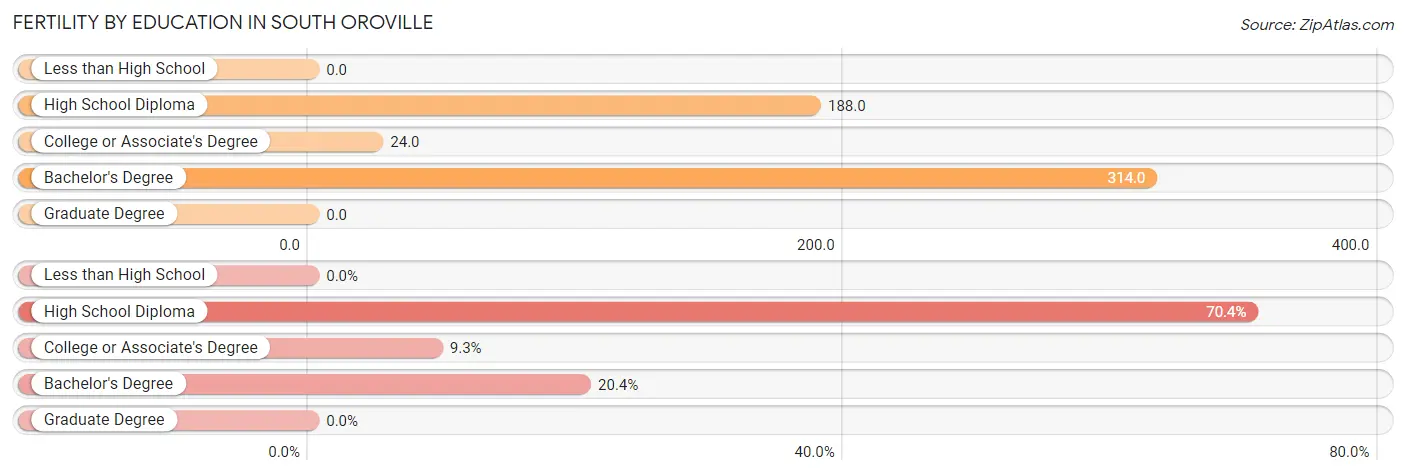
| Educational Attainment | Women with Births | Births / 1,000 Women |
| Less than High School | 0 (0.0%) | 0.0 |
| High School Diploma | 38 (70.4%) | 188.0 |
| College or Associate's Degree | 5 (9.3%) | 24.0 |
| Bachelor's Degree | 11 (20.4%) | 314.0 |
| Graduate Degree | 0 (0.0%) | 0.0 |
| Total | 54 (100.0%) | 104.0 |
Fertility by Education by Marriage Status in South Oroville
9.3% of women with births in South Oroville are unmarried. Women with the educational attainment of high school diploma are most likely to be married with 100.0% of them married at childbirth, while women with the educational attainment of college or associate's degree are least likely to be married with 100.0% of them unmarried at childbirth.
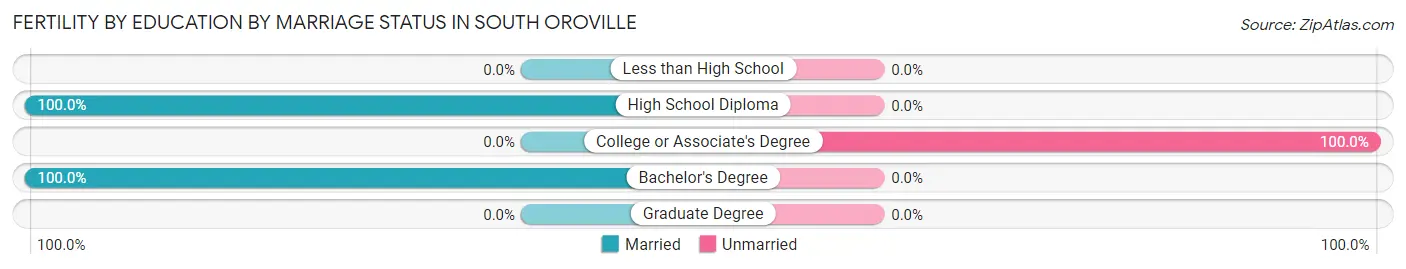
| Educational Attainment | Married | Unmarried |
| Less than High School | 0 (0.0%) | 0 (0.0%) |
| High School Diploma | 38 (100.0%) | 0 (0.0%) |
| College or Associate's Degree | 0 (0.0%) | 5 (100.0%) |
| Bachelor's Degree | 11 (100.0%) | 0 (0.0%) |
| Graduate Degree | 0 (0.0%) | 0 (0.0%) |
| Total | 49 (90.7%) | 5 (9.3%) |
Employment Characteristics in South Oroville
Employment by Class of Employer in South Oroville
Among the 1,181 employed individuals in South Oroville, private company employees (727 | 61.6%), local government employees (141 | 11.9%), and not-for-profit organizations (107 | 9.1%) make up the most common classes of employment.
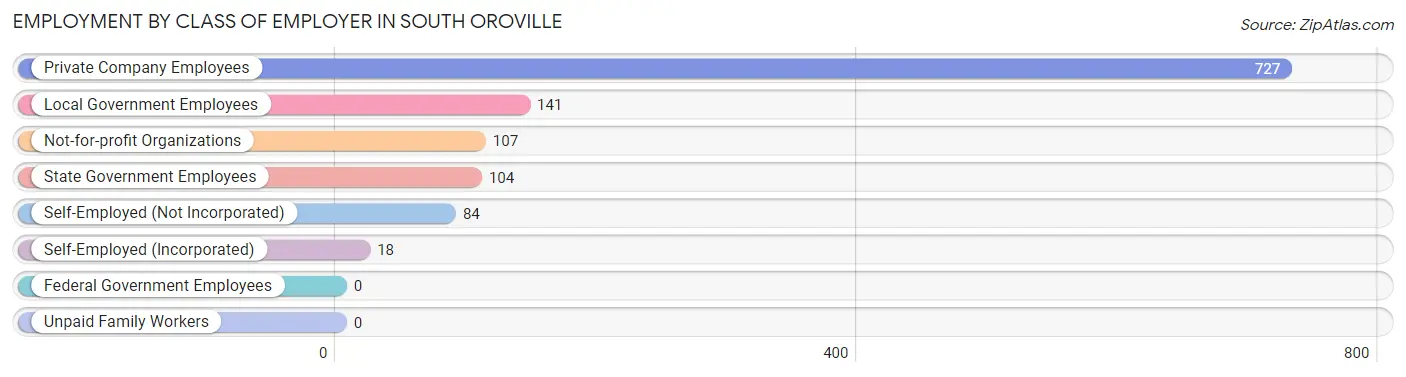
| Employer Class | # Employees | % Employees |
| Private Company Employees | 727 | 61.6% |
| Self-Employed (Incorporated) | 18 | 1.5% |
| Self-Employed (Not Incorporated) | 84 | 7.1% |
| Not-for-profit Organizations | 107 | 9.1% |
| Local Government Employees | 141 | 11.9% |
| State Government Employees | 104 | 8.8% |
| Federal Government Employees | 0 | 0.0% |
| Unpaid Family Workers | 0 | 0.0% |
| Total | 1,181 | 100.0% |
Employment Status by Age in South Oroville
According to the labor force statistics for South Oroville, out of the total population over 16 years of age (1,906), 65.1% or 1,241 individuals are in the labor force, with 4.8% or 60 of them unemployed. The age group with the highest labor force participation rate is 25 to 29 years, with 97.8% or 175 individuals in the labor force. Within the labor force, the 55 to 59 years age range has the highest percentage of unemployed individuals, with 27.8% or 40 of them being unemployed.
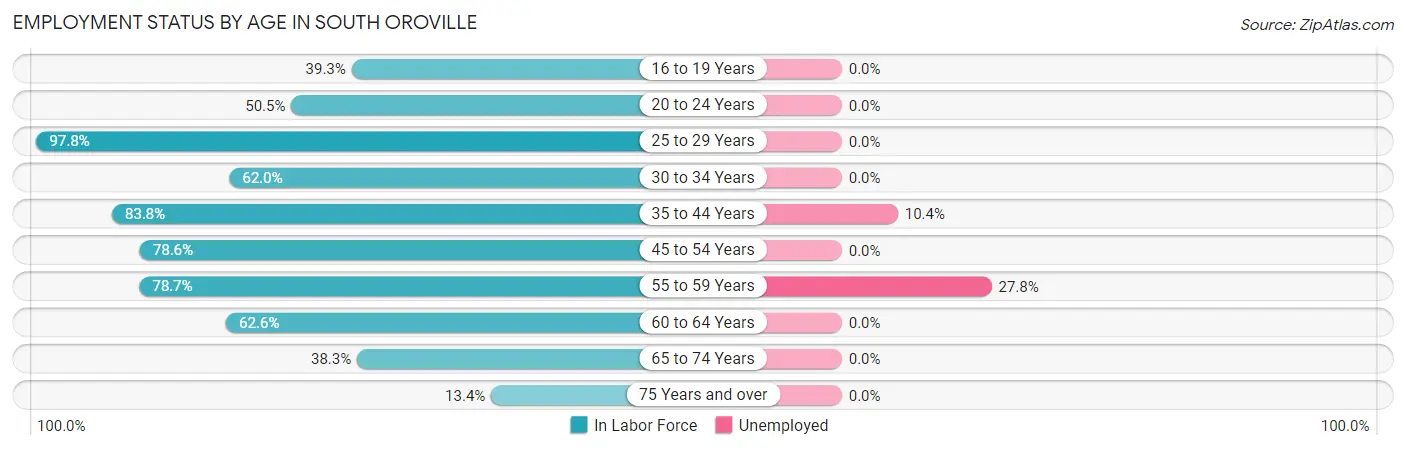
| Age Bracket | In Labor Force | Unemployed |
| 16 to 19 Years | 24 (39.3%) | 0 (0.0%) |
| 20 to 24 Years | 92 (50.5%) | 0 (0.0%) |
| 25 to 29 Years | 175 (97.8%) | 0 (0.0%) |
| 30 to 34 Years | 171 (62.0%) | 0 (0.0%) |
| 35 to 44 Years | 192 (83.8%) | 20 (10.4%) |
| 45 to 54 Years | 243 (78.6%) | 0 (0.0%) |
| 55 to 59 Years | 144 (78.7%) | 40 (27.8%) |
| 60 to 64 Years | 87 (62.6%) | 0 (0.0%) |
| 65 to 74 Years | 102 (38.3%) | 0 (0.0%) |
| 75 Years and over | 11 (13.4%) | 0 (0.0%) |
| Total | 1,241 (65.1%) | 60 (4.8%) |
Employment Status by Educational Attainment in South Oroville
According to labor force statistics for South Oroville, 77.0% of individuals (1,013) out of the total population between 25 and 64 years of age (1,315) are in the labor force, with 5.9% or 60 of them being unemployed. The group with the highest labor force participation rate are those with the educational attainment of bachelor's degree or higher, with 86.9% or 73 individuals in the labor force. Within the labor force, individuals with less than high school education have the highest percentage of unemployment, with 25.6% or 10 of them being unemployed.
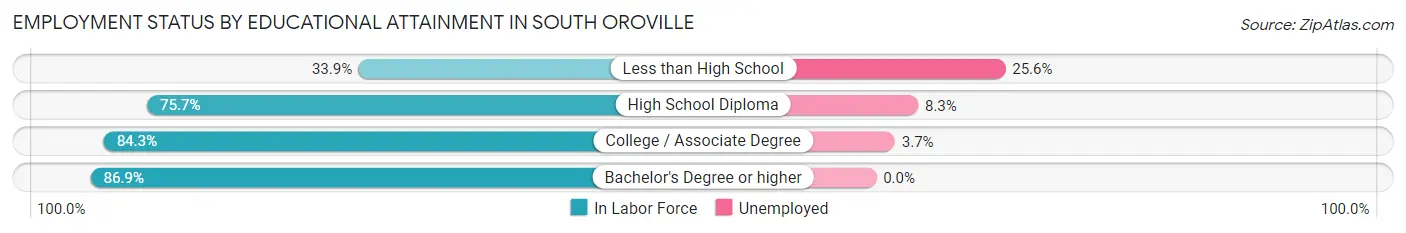
| Educational Attainment | In Labor Force | Unemployed |
| Less than High School | 39 (33.9%) | 29 (25.6%) |
| High School Diploma | 362 (75.7%) | 40 (8.3%) |
| College / Associate Degree | 538 (84.3%) | 24 (3.7%) |
| Bachelor's Degree or higher | 73 (86.9%) | 0 (0.0%) |
| Total | 1,013 (77.0%) | 78 (5.9%) |
Employment Occupations by Sex in South Oroville
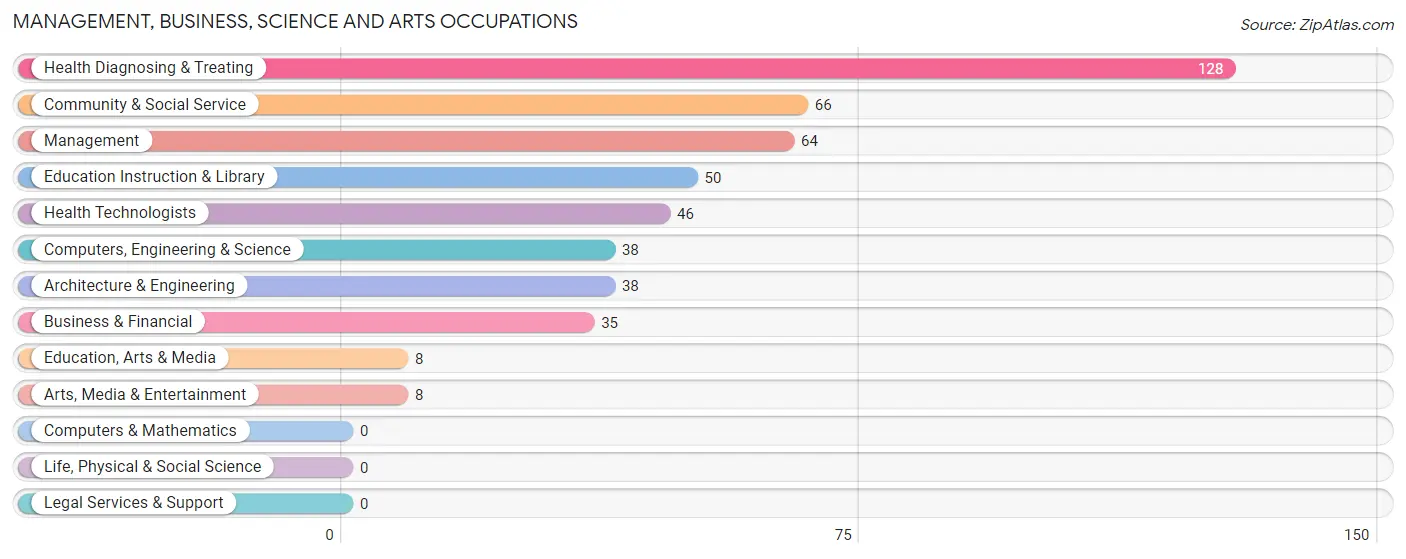
Management, Business, Science and Arts Occupations
The most common Management, Business, Science and Arts occupations in South Oroville are Health Diagnosing & Treating (128 | 10.8%), Community & Social Service (66 | 5.6%), Management (64 | 5.4%), Education Instruction & Library (50 | 4.2%), and Health Technologists (46 | 3.9%).
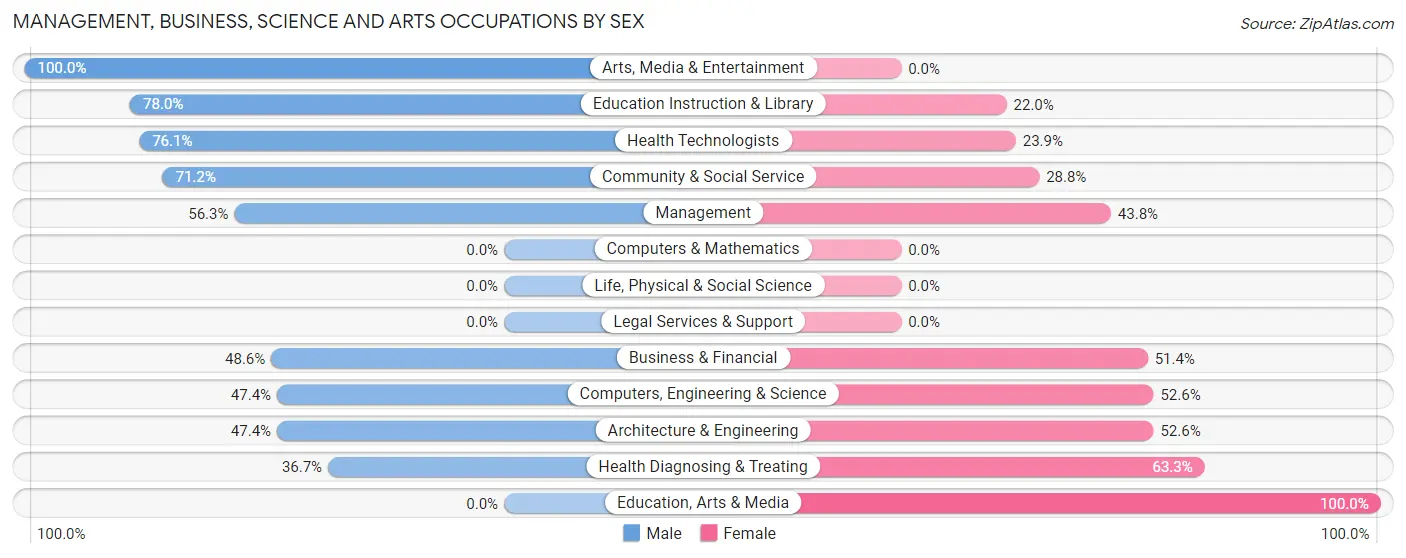
Management, Business, Science and Arts Occupations by Sex
Within the Management, Business, Science and Arts occupations in South Oroville, the most male-oriented occupations are Arts, Media & Entertainment (100.0%), Education Instruction & Library (78.0%), and Health Technologists (76.1%), while the most female-oriented occupations are Education, Arts & Media (100.0%), Health Diagnosing & Treating (63.3%), and Computers, Engineering & Science (52.6%).
| Occupation | Male | Female |
| Management | 36 (56.2%) | 28 (43.8%) |
| Business & Financial | 17 (48.6%) | 18 (51.4%) |
| Computers, Engineering & Science | 18 (47.4%) | 20 (52.6%) |
| Computers & Mathematics | 0 (0.0%) | 0 (0.0%) |
| Architecture & Engineering | 18 (47.4%) | 20 (52.6%) |
| Life, Physical & Social Science | 0 (0.0%) | 0 (0.0%) |
| Community & Social Service | 47 (71.2%) | 19 (28.8%) |
| Education, Arts & Media | 0 (0.0%) | 8 (100.0%) |
| Legal Services & Support | 0 (0.0%) | 0 (0.0%) |
| Education Instruction & Library | 39 (78.0%) | 11 (22.0%) |
| Arts, Media & Entertainment | 8 (100.0%) | 0 (0.0%) |
| Health Diagnosing & Treating | 47 (36.7%) | 81 (63.3%) |
| Health Technologists | 35 (76.1%) | 11 (23.9%) |
| Total (Category) | 165 (49.8%) | 166 (50.1%) |
| Total (Overall) | 705 (59.7%) | 476 (40.3%) |
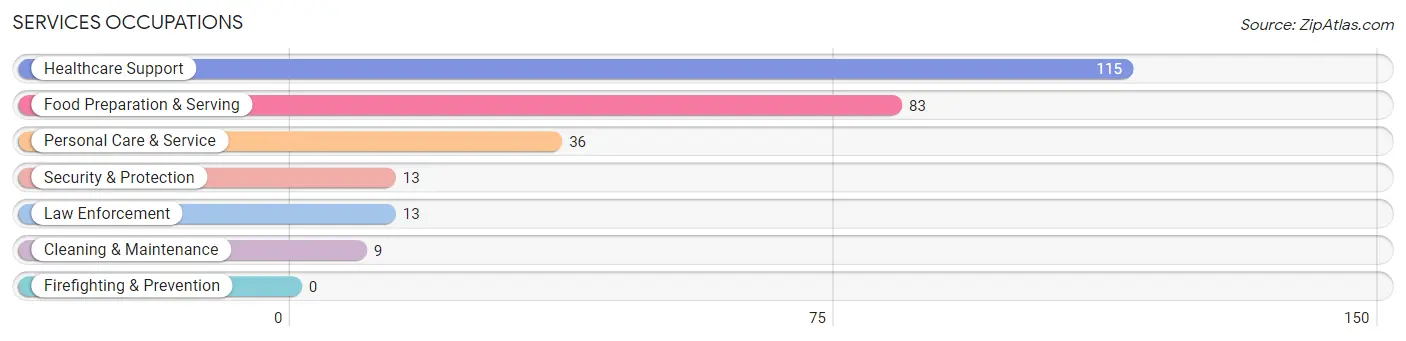
Services Occupations
The most common Services occupations in South Oroville are Healthcare Support (115 | 9.7%), Food Preparation & Serving (83 | 7.0%), Personal Care & Service (36 | 3.0%), Security & Protection (13 | 1.1%), and Law Enforcement (13 | 1.1%).
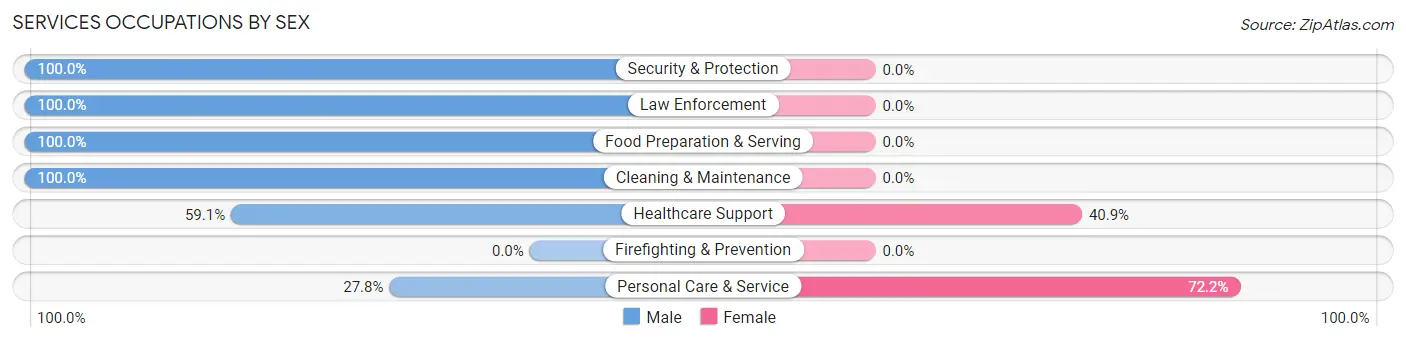
Services Occupations by Sex
Within the Services occupations in South Oroville, the most male-oriented occupations are Security & Protection (100.0%), Law Enforcement (100.0%), and Food Preparation & Serving (100.0%), while the most female-oriented occupations are Personal Care & Service (72.2%), and Healthcare Support (40.9%).
| Occupation | Male | Female |
| Healthcare Support | 68 (59.1%) | 47 (40.9%) |
| Security & Protection | 13 (100.0%) | 0 (0.0%) |
| Firefighting & Prevention | 0 (0.0%) | 0 (0.0%) |
| Law Enforcement | 13 (100.0%) | 0 (0.0%) |
| Food Preparation & Serving | 83 (100.0%) | 0 (0.0%) |
| Cleaning & Maintenance | 9 (100.0%) | 0 (0.0%) |
| Personal Care & Service | 10 (27.8%) | 26 (72.2%) |
| Total (Category) | 183 (71.5%) | 73 (28.5%) |
| Total (Overall) | 705 (59.7%) | 476 (40.3%) |
Sales and Office Occupations
The most common Sales and Office occupations in South Oroville are Office & Administration (123 | 10.4%), and Sales & Related (92 | 7.8%).

Sales and Office Occupations by Sex
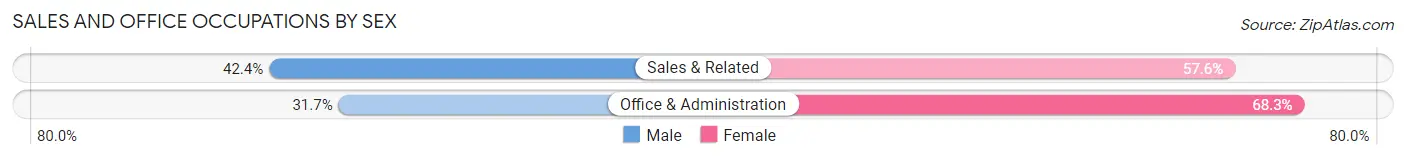
| Occupation | Male | Female |
| Sales & Related | 39 (42.4%) | 53 (57.6%) |
| Office & Administration | 39 (31.7%) | 84 (68.3%) |
| Total (Category) | 78 (36.3%) | 137 (63.7%) |
| Total (Overall) | 705 (59.7%) | 476 (40.3%) |
Natural Resources, Construction and Maintenance Occupations
The most common Natural Resources, Construction and Maintenance occupations in South Oroville are Installation, Maintenance & Repair (78 | 6.6%), Construction & Extraction (72 | 6.1%), and Farming, Fishing & Forestry (12 | 1.0%).
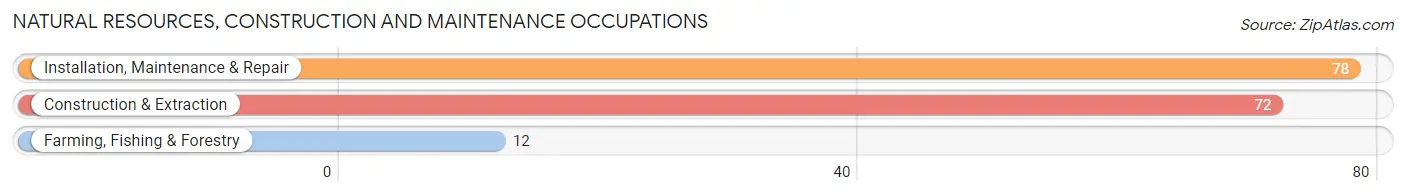
Natural Resources, Construction and Maintenance Occupations by Sex

| Occupation | Male | Female |
| Farming, Fishing & Forestry | 12 (100.0%) | 0 (0.0%) |
| Construction & Extraction | 39 (54.2%) | 33 (45.8%) |
| Installation, Maintenance & Repair | 78 (100.0%) | 0 (0.0%) |
| Total (Category) | 129 (79.6%) | 33 (20.4%) |
| Total (Overall) | 705 (59.7%) | 476 (40.3%) |
Production, Transportation and Moving Occupations
The most common Production, Transportation and Moving occupations in South Oroville are Material Moving (107 | 9.1%), Production (80 | 6.8%), and Transportation (30 | 2.5%).
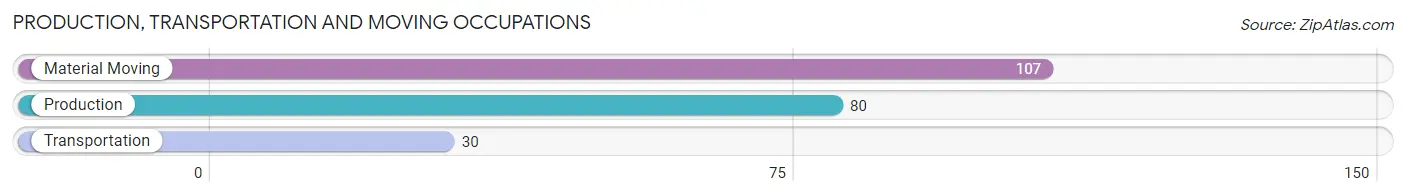
Production, Transportation and Moving Occupations by Sex
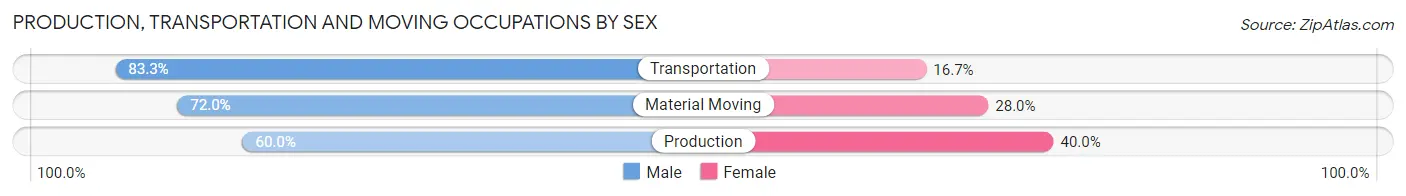
| Occupation | Male | Female |
| Production | 48 (60.0%) | 32 (40.0%) |
| Transportation | 25 (83.3%) | 5 (16.7%) |
| Material Moving | 77 (72.0%) | 30 (28.0%) |
| Total (Category) | 150 (69.1%) | 67 (30.9%) |
| Total (Overall) | 705 (59.7%) | 476 (40.3%) |
Employment Industries by Sex in South Oroville
Employment Industries in South Oroville
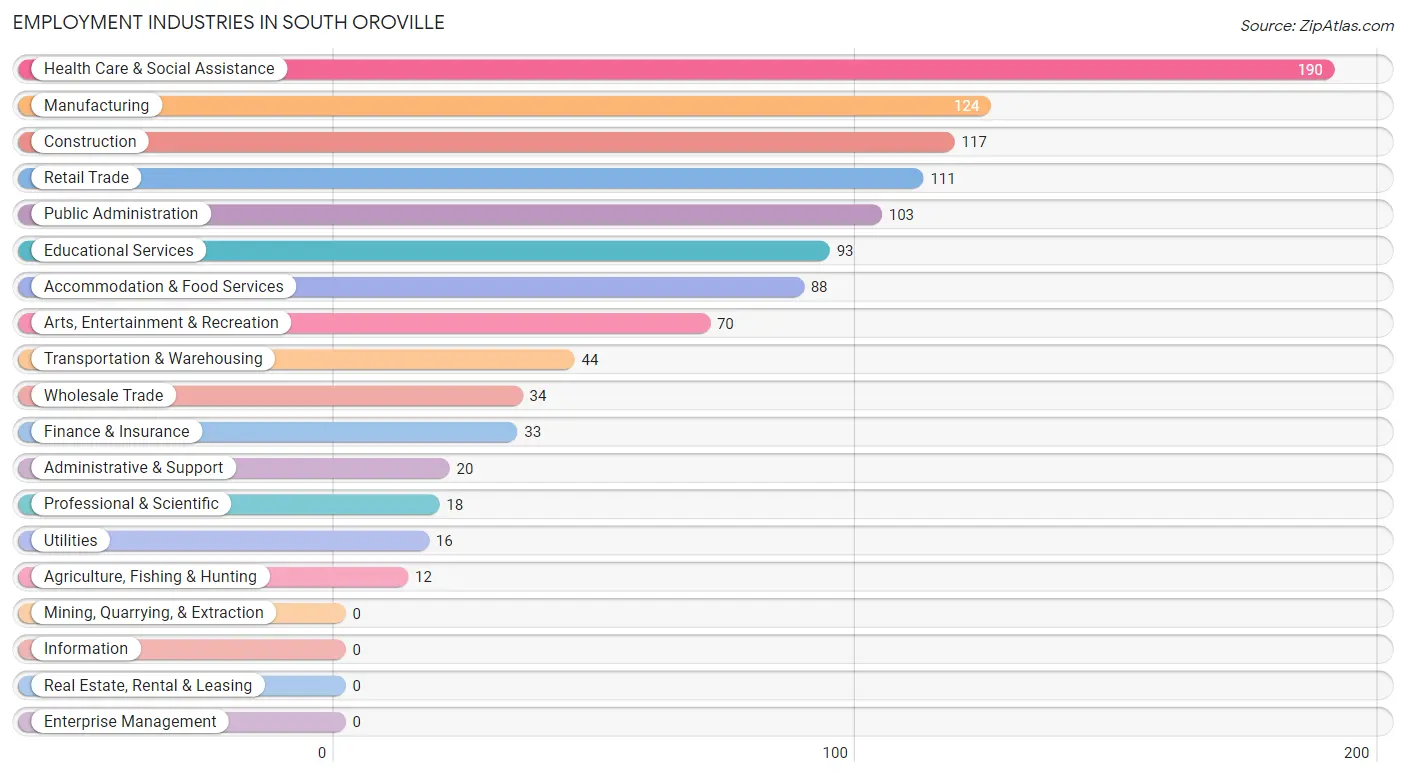
The major employment industries in South Oroville include Health Care & Social Assistance (190 | 16.1%), Manufacturing (124 | 10.5%), Construction (117 | 9.9%), Retail Trade (111 | 9.4%), and Public Administration (103 | 8.7%).
Employment Industries by Sex in South Oroville
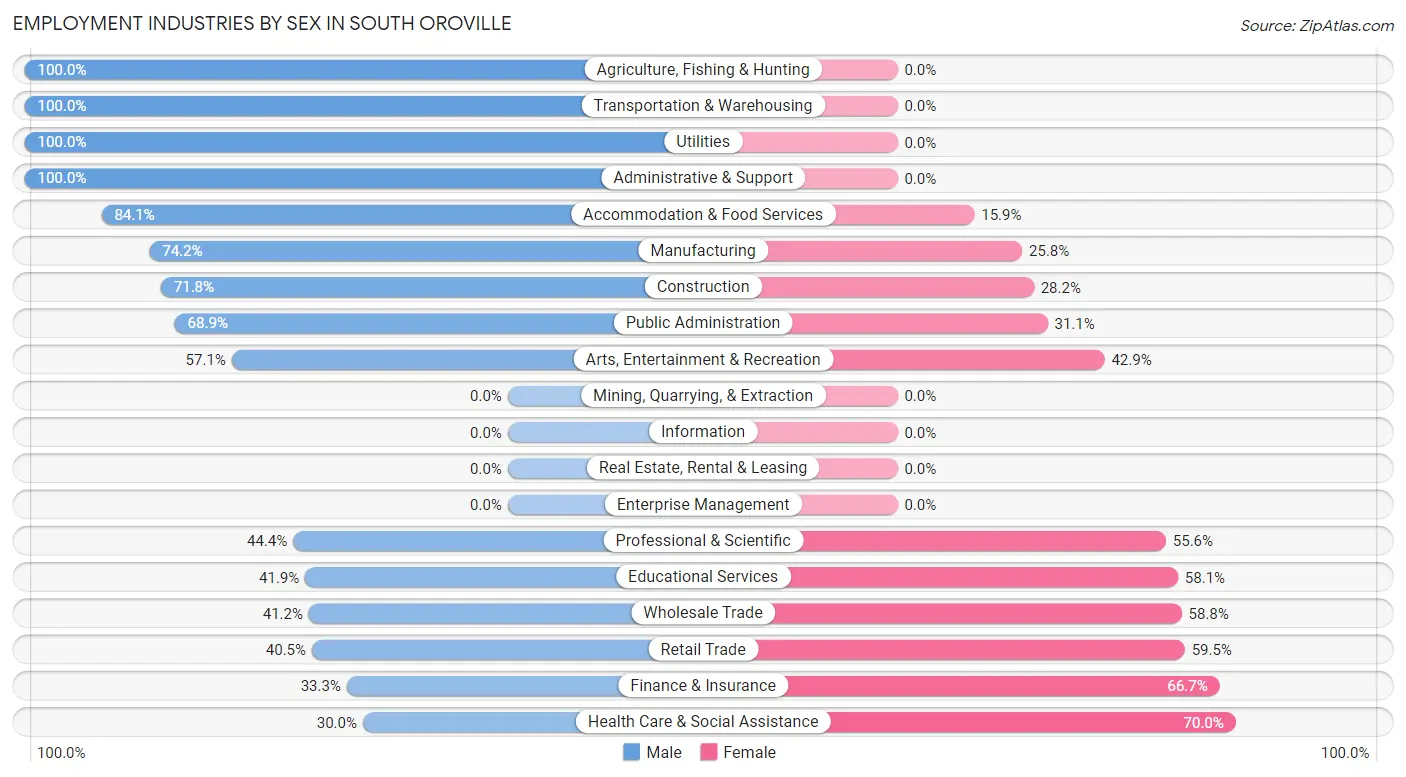
The South Oroville industries that see more men than women are Agriculture, Fishing & Hunting (100.0%), Transportation & Warehousing (100.0%), and Utilities (100.0%), whereas the industries that tend to have a higher number of women are Health Care & Social Assistance (70.0%), Finance & Insurance (66.7%), and Retail Trade (59.5%).
| Industry | Male | Female |
| Agriculture, Fishing & Hunting | 12 (100.0%) | 0 (0.0%) |
| Mining, Quarrying, & Extraction | 0 (0.0%) | 0 (0.0%) |
| Construction | 84 (71.8%) | 33 (28.2%) |
| Manufacturing | 92 (74.2%) | 32 (25.8%) |
| Wholesale Trade | 14 (41.2%) | 20 (58.8%) |
| Retail Trade | 45 (40.5%) | 66 (59.5%) |
| Transportation & Warehousing | 44 (100.0%) | 0 (0.0%) |
| Utilities | 16 (100.0%) | 0 (0.0%) |
| Information | 0 (0.0%) | 0 (0.0%) |
| Finance & Insurance | 11 (33.3%) | 22 (66.7%) |
| Real Estate, Rental & Leasing | 0 (0.0%) | 0 (0.0%) |
| Professional & Scientific | 8 (44.4%) | 10 (55.6%) |
| Enterprise Management | 0 (0.0%) | 0 (0.0%) |
| Administrative & Support | 20 (100.0%) | 0 (0.0%) |
| Educational Services | 39 (41.9%) | 54 (58.1%) |
| Health Care & Social Assistance | 57 (30.0%) | 133 (70.0%) |
| Arts, Entertainment & Recreation | 40 (57.1%) | 30 (42.9%) |
| Accommodation & Food Services | 74 (84.1%) | 14 (15.9%) |
| Public Administration | 71 (68.9%) | 32 (31.1%) |
| Total | 705 (59.7%) | 476 (40.3%) |
Education in South Oroville
School Enrollment in South Oroville
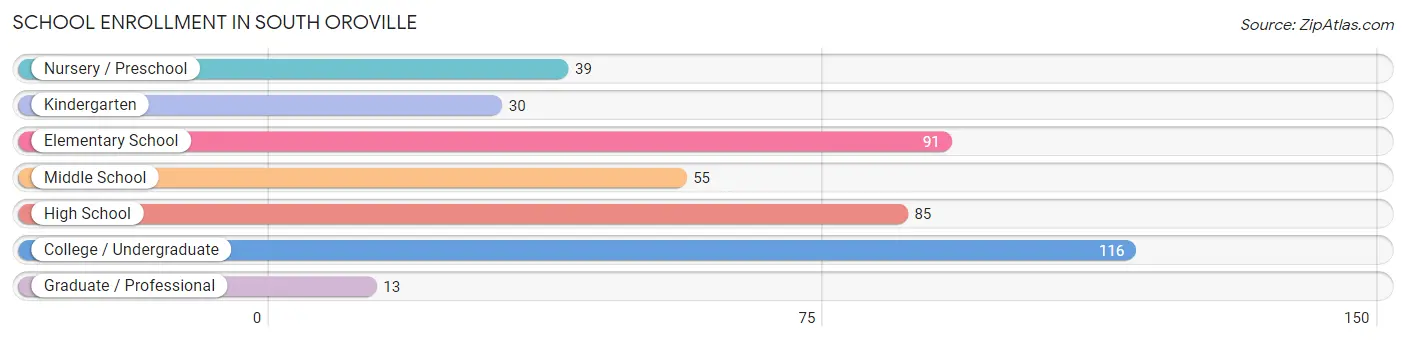
The most common levels of schooling among the 429 students in South Oroville are college / undergraduate (116 | 27.0%), elementary school (91 | 21.2%), and high school (85 | 19.8%).
| School Level | # Students | % Students |
| Nursery / Preschool | 39 | 9.1% |
| Kindergarten | 30 | 7.0% |
| Elementary School | 91 | 21.2% |
| Middle School | 55 | 12.8% |
| High School | 85 | 19.8% |
| College / Undergraduate | 116 | 27.0% |
| Graduate / Professional | 13 | 3.0% |
| Total | 429 | 100.0% |
School Enrollment by Age by Funding Source in South Oroville
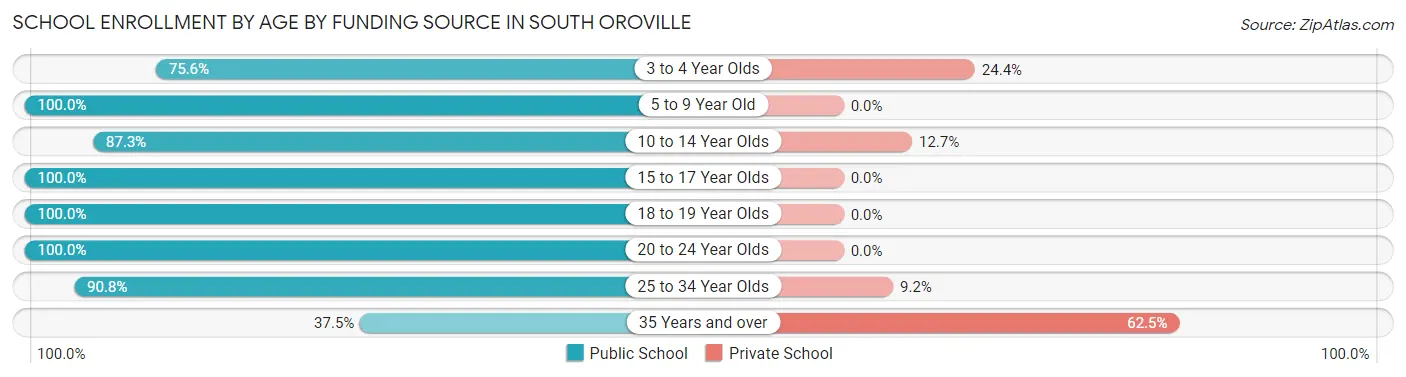
Out of a total of 429 students who are enrolled in schools in South Oroville, 35 (8.2%) attend a private institution, while the remaining 394 (91.8%) are enrolled in public schools. The age group of 35 years and over has the highest likelihood of being enrolled in private schools, with 10 (62.5% in the age bracket) enrolled. Conversely, the age group of 5 to 9 year old has the lowest likelihood of being enrolled in a private school, with 115 (100.0% in the age bracket) attending a public institution.
| Age Bracket | Public School | Private School |
| 3 to 4 Year Olds | 34 (75.6%) | 11 (24.4%) |
| 5 to 9 Year Old | 115 (100.0%) | 0 (0.0%) |
| 10 to 14 Year Olds | 48 (87.3%) | 7 (12.7%) |
| 15 to 17 Year Olds | 51 (100.0%) | 0 (0.0%) |
| 18 to 19 Year Olds | 24 (100.0%) | 0 (0.0%) |
| 20 to 24 Year Olds | 47 (100.0%) | 0 (0.0%) |
| 25 to 34 Year Olds | 69 (90.8%) | 7 (9.2%) |
| 35 Years and over | 6 (37.5%) | 10 (62.5%) |
| Total | 394 (91.8%) | 35 (8.2%) |
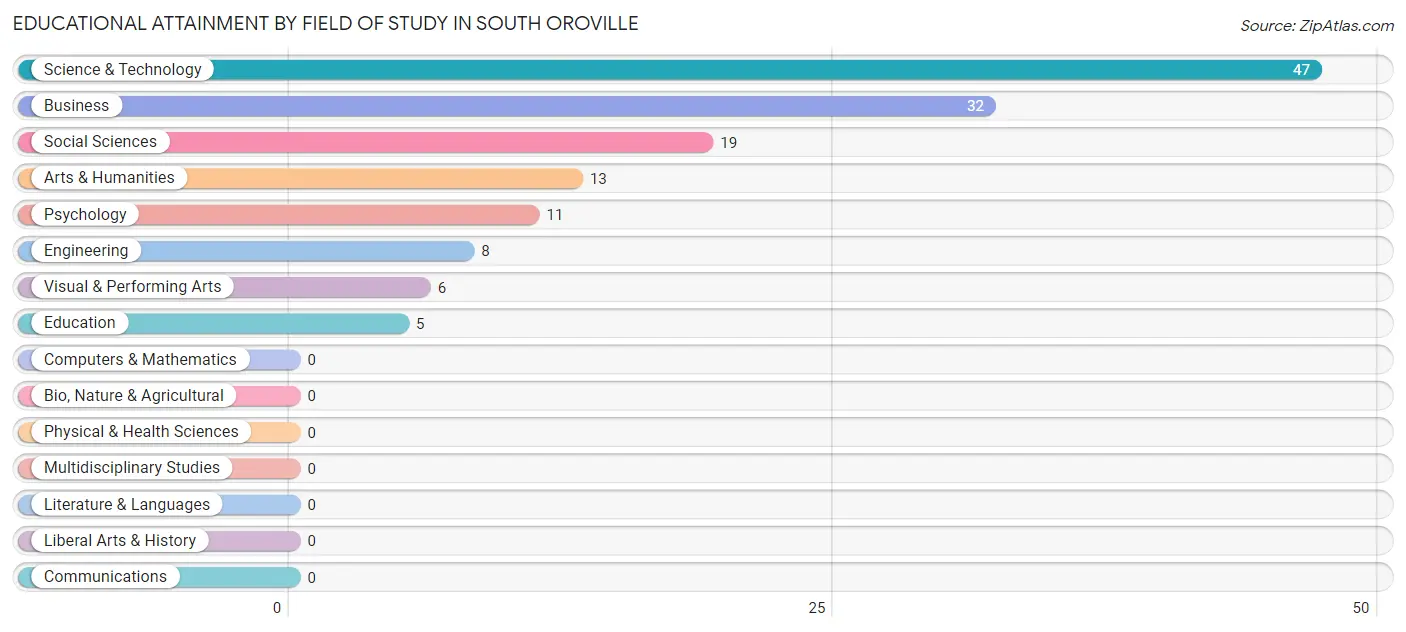
Educational Attainment by Field of Study in South Oroville
Science & technology (47 | 33.3%), business (32 | 22.7%), social sciences (19 | 13.5%), arts & humanities (13 | 9.2%), and psychology (11 | 7.8%) are the most common fields of study among 141 individuals in South Oroville who have obtained a bachelor's degree or higher.
| Field of Study | # Graduates | % Graduates |
| Computers & Mathematics | 0 | 0.0% |
| Bio, Nature & Agricultural | 0 | 0.0% |
| Physical & Health Sciences | 0 | 0.0% |
| Psychology | 11 | 7.8% |
| Social Sciences | 19 | 13.5% |
| Engineering | 8 | 5.7% |
| Multidisciplinary Studies | 0 | 0.0% |
| Science & Technology | 47 | 33.3% |
| Business | 32 | 22.7% |
| Education | 5 | 3.5% |
| Literature & Languages | 0 | 0.0% |
| Liberal Arts & History | 0 | 0.0% |
| Visual & Performing Arts | 6 | 4.3% |
| Communications | 0 | 0.0% |
| Arts & Humanities | 13 | 9.2% |
| Total | 141 | 100.0% |
Transportation & Commute in South Oroville
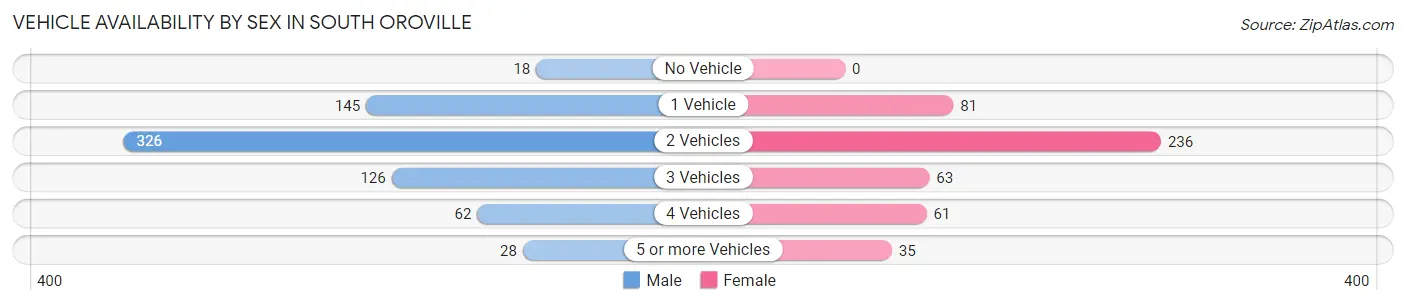
Vehicle Availability by Sex in South Oroville
The most prevalent vehicle ownership categories in South Oroville are males with 2 vehicles (326, accounting for 46.2%) and females with 2 vehicles (236, making up 68.5%).
| Vehicles Available | Male | Female |
| No Vehicle | 18 (2.5%) | 0 (0.0%) |
| 1 Vehicle | 145 (20.6%) | 81 (17.0%) |
| 2 Vehicles | 326 (46.2%) | 236 (49.6%) |
| 3 Vehicles | 126 (17.9%) | 63 (13.2%) |
| 4 Vehicles | 62 (8.8%) | 61 (12.8%) |
| 5 or more Vehicles | 28 (4.0%) | 35 (7.3%) |
| Total | 705 (100.0%) | 476 (100.0%) |
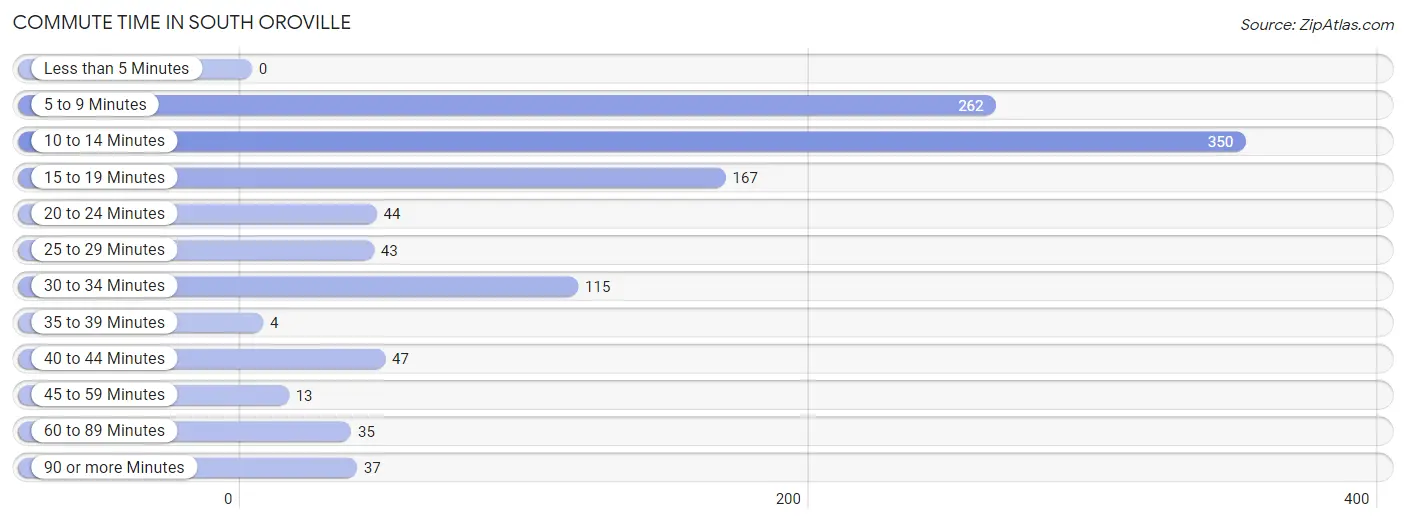
Commute Time in South Oroville
The most frequently occuring commute durations in South Oroville are 10 to 14 minutes (350 commuters, 31.3%), 5 to 9 minutes (262 commuters, 23.5%), and 15 to 19 minutes (167 commuters, 14.9%).
| Commute Time | # Commuters | % Commuters |
| Less than 5 Minutes | 0 | 0.0% |
| 5 to 9 Minutes | 262 | 23.5% |
| 10 to 14 Minutes | 350 | 31.3% |
| 15 to 19 Minutes | 167 | 14.9% |
| 20 to 24 Minutes | 44 | 3.9% |
| 25 to 29 Minutes | 43 | 3.8% |
| 30 to 34 Minutes | 115 | 10.3% |
| 35 to 39 Minutes | 4 | 0.4% |
| 40 to 44 Minutes | 47 | 4.2% |
| 45 to 59 Minutes | 13 | 1.2% |
| 60 to 89 Minutes | 35 | 3.1% |
| 90 or more Minutes | 37 | 3.3% |
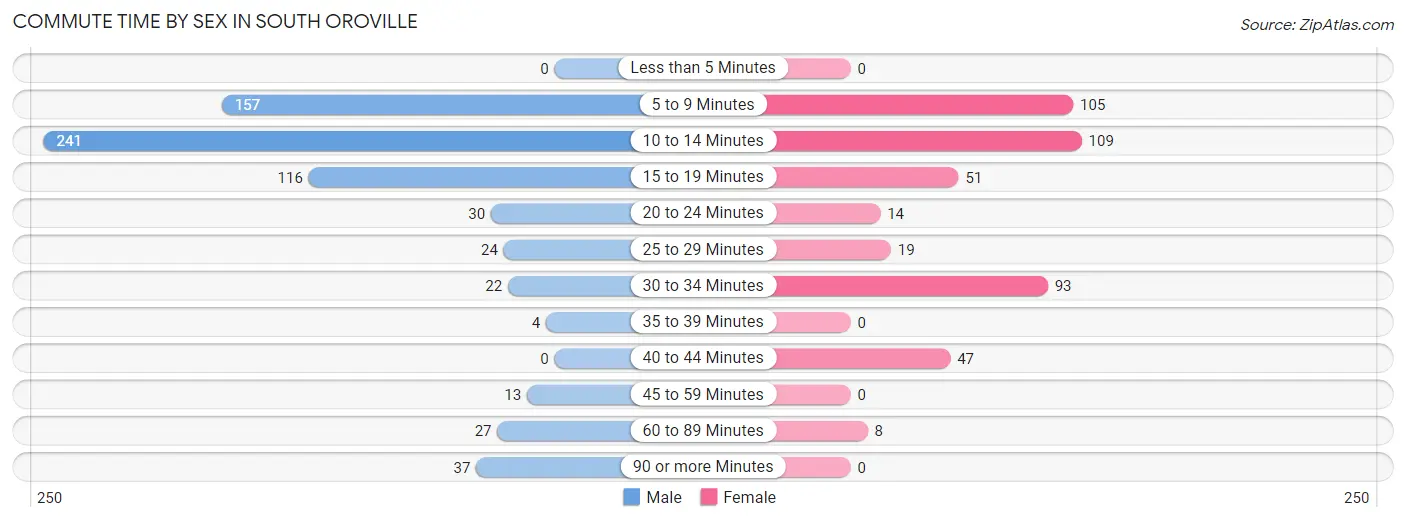
Commute Time by Sex in South Oroville
The most common commute times in South Oroville are 10 to 14 minutes (241 commuters, 35.9%) for males and 10 to 14 minutes (109 commuters, 24.4%) for females.
| Commute Time | Male | Female |
| Less than 5 Minutes | 0 (0.0%) | 0 (0.0%) |
| 5 to 9 Minutes | 157 (23.4%) | 105 (23.5%) |
| 10 to 14 Minutes | 241 (35.9%) | 109 (24.4%) |
| 15 to 19 Minutes | 116 (17.3%) | 51 (11.4%) |
| 20 to 24 Minutes | 30 (4.5%) | 14 (3.1%) |
| 25 to 29 Minutes | 24 (3.6%) | 19 (4.3%) |
| 30 to 34 Minutes | 22 (3.3%) | 93 (20.8%) |
| 35 to 39 Minutes | 4 (0.6%) | 0 (0.0%) |
| 40 to 44 Minutes | 0 (0.0%) | 47 (10.5%) |
| 45 to 59 Minutes | 13 (1.9%) | 0 (0.0%) |
| 60 to 89 Minutes | 27 (4.0%) | 8 (1.8%) |
| 90 or more Minutes | 37 (5.5%) | 0 (0.0%) |
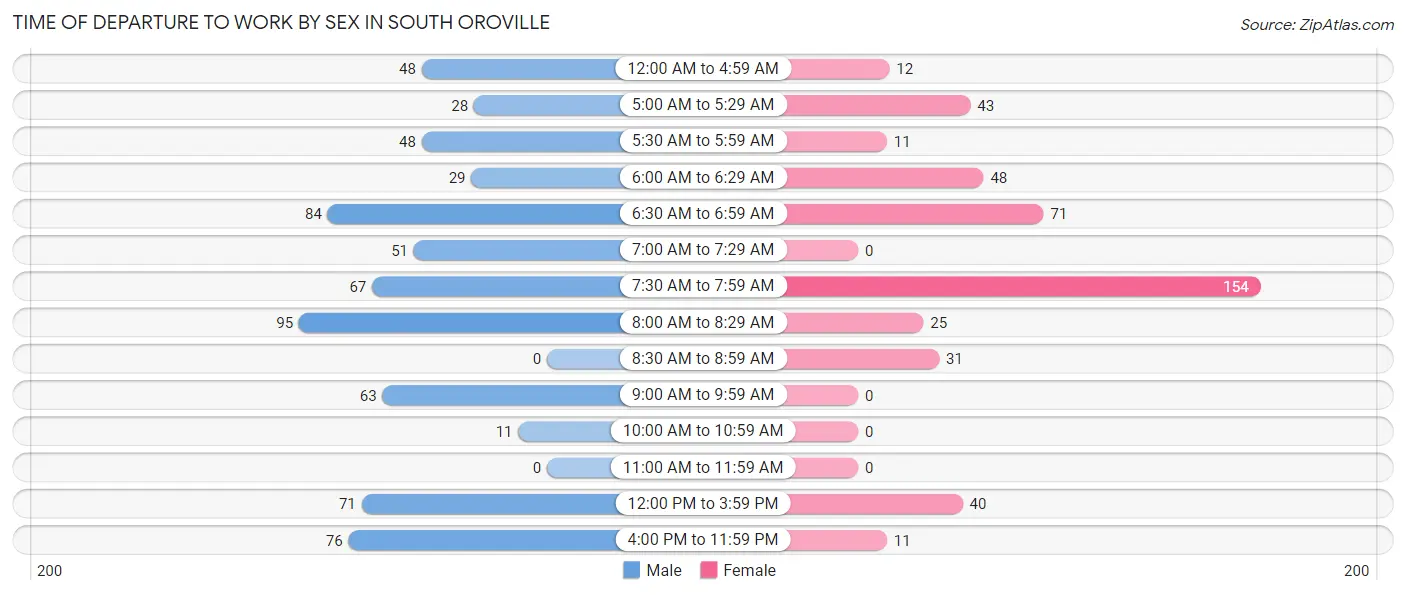
Time of Departure to Work by Sex in South Oroville
The most frequent times of departure to work in South Oroville are 8:00 AM to 8:29 AM (95, 14.2%) for males and 7:30 AM to 7:59 AM (154, 34.5%) for females.
| Time of Departure | Male | Female |
| 12:00 AM to 4:59 AM | 48 (7.1%) | 12 (2.7%) |
| 5:00 AM to 5:29 AM | 28 (4.2%) | 43 (9.6%) |
| 5:30 AM to 5:59 AM | 48 (7.1%) | 11 (2.5%) |
| 6:00 AM to 6:29 AM | 29 (4.3%) | 48 (10.8%) |
| 6:30 AM to 6:59 AM | 84 (12.5%) | 71 (15.9%) |
| 7:00 AM to 7:29 AM | 51 (7.6%) | 0 (0.0%) |
| 7:30 AM to 7:59 AM | 67 (10.0%) | 154 (34.5%) |
| 8:00 AM to 8:29 AM | 95 (14.2%) | 25 (5.6%) |
| 8:30 AM to 8:59 AM | 0 (0.0%) | 31 (7.0%) |
| 9:00 AM to 9:59 AM | 63 (9.4%) | 0 (0.0%) |
| 10:00 AM to 10:59 AM | 11 (1.6%) | 0 (0.0%) |
| 11:00 AM to 11:59 AM | 0 (0.0%) | 0 (0.0%) |
| 12:00 PM to 3:59 PM | 71 (10.6%) | 40 (9.0%) |
| 4:00 PM to 11:59 PM | 76 (11.3%) | 11 (2.5%) |
| Total | 671 (100.0%) | 446 (100.0%) |
Housing Occupancy in South Oroville
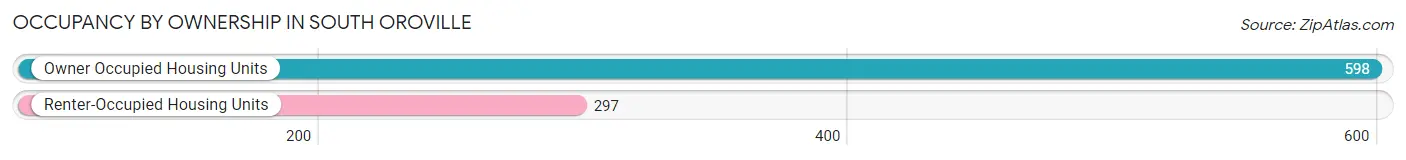
Occupancy by Ownership in South Oroville
Of the total 895 dwellings in South Oroville, owner-occupied units account for 598 (66.8%), while renter-occupied units make up 297 (33.2%).
| Occupancy | # Housing Units | % Housing Units |
| Owner Occupied Housing Units | 598 | 66.8% |
| Renter-Occupied Housing Units | 297 | 33.2% |
| Total Occupied Housing Units | 895 | 100.0% |
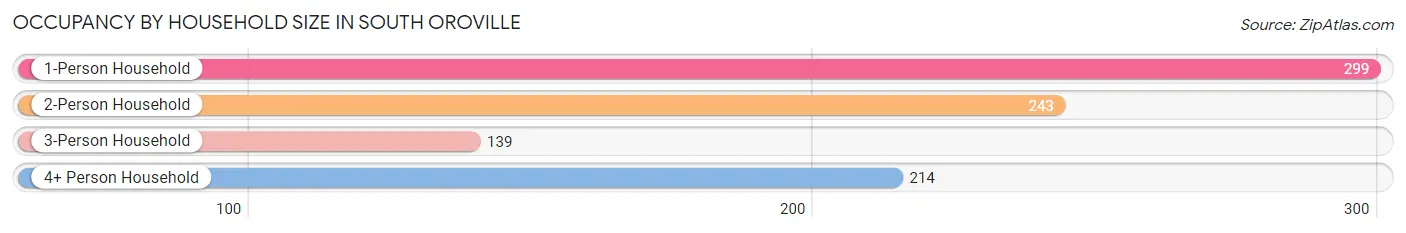
Occupancy by Household Size in South Oroville
| Household Size | # Housing Units | % Housing Units |
| 1-Person Household | 299 | 33.4% |
| 2-Person Household | 243 | 27.2% |
| 3-Person Household | 139 | 15.5% |
| 4+ Person Household | 214 | 23.9% |
| Total Housing Units | 895 | 100.0% |
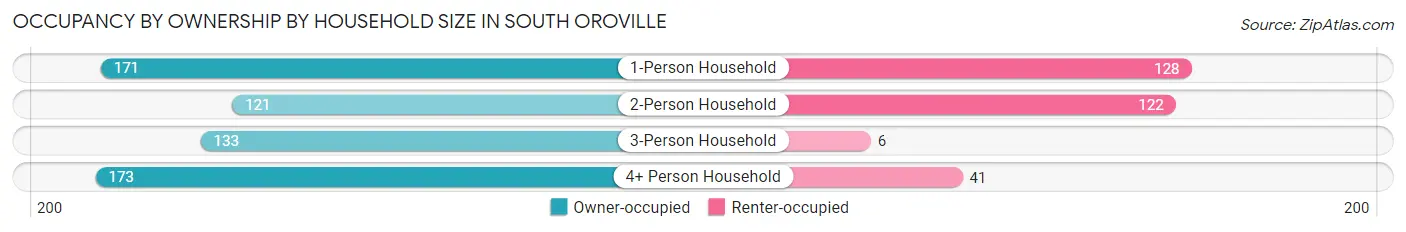
Occupancy by Ownership by Household Size in South Oroville
| Household Size | Owner-occupied | Renter-occupied |
| 1-Person Household | 171 (57.2%) | 128 (42.8%) |
| 2-Person Household | 121 (49.8%) | 122 (50.2%) |
| 3-Person Household | 133 (95.7%) | 6 (4.3%) |
| 4+ Person Household | 173 (80.8%) | 41 (19.2%) |
| Total Housing Units | 598 (66.8%) | 297 (33.2%) |
Occupancy by Educational Attainment in South Oroville
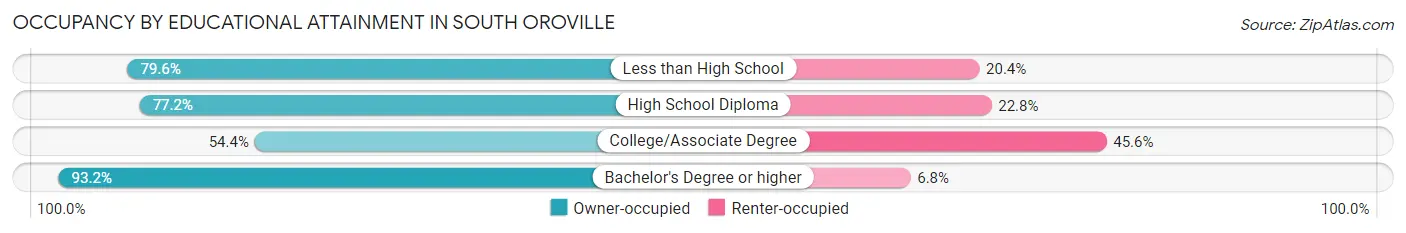
| Household Size | Owner-occupied | Renter-occupied |
| Less than High School | 78 (79.6%) | 20 (20.4%) |
| High School Diploma | 196 (77.2%) | 58 (22.8%) |
| College/Associate Degree | 255 (54.4%) | 214 (45.6%) |
| Bachelor's Degree or higher | 69 (93.2%) | 5 (6.8%) |
Occupancy by Age of Householder in South Oroville
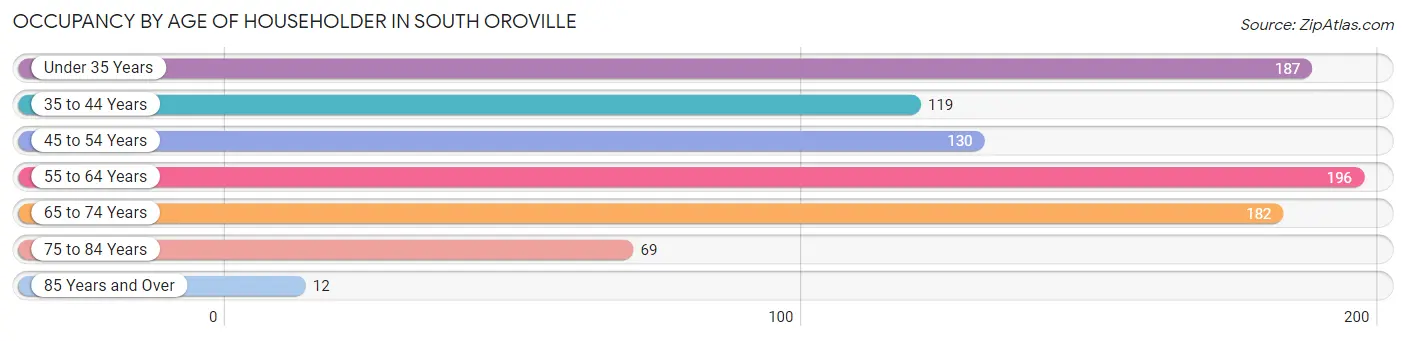
| Age Bracket | # Households | % Households |
| Under 35 Years | 187 | 20.9% |
| 35 to 44 Years | 119 | 13.3% |
| 45 to 54 Years | 130 | 14.5% |
| 55 to 64 Years | 196 | 21.9% |
| 65 to 74 Years | 182 | 20.3% |
| 75 to 84 Years | 69 | 7.7% |
| 85 Years and Over | 12 | 1.3% |
| Total | 895 | 100.0% |
Housing Finances in South Oroville
Median Income by Occupancy in South Oroville
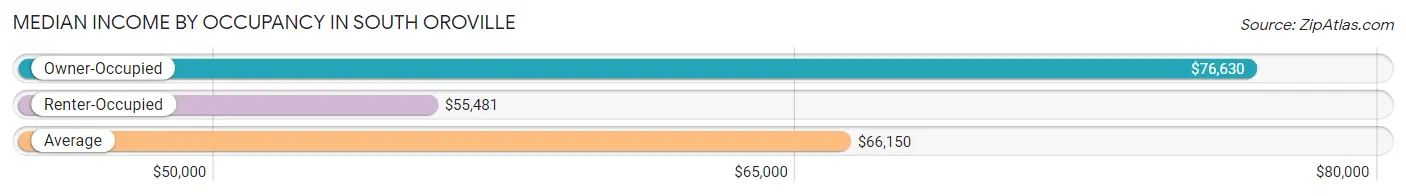
| Occupancy Type | # Households | Median Income |
| Owner-Occupied | 598 (66.8%) | $76,630 |
| Renter-Occupied | 297 (33.2%) | $55,481 |
| Average | 895 (100.0%) | $66,150 |
Occupancy by Householder Income Bracket in South Oroville
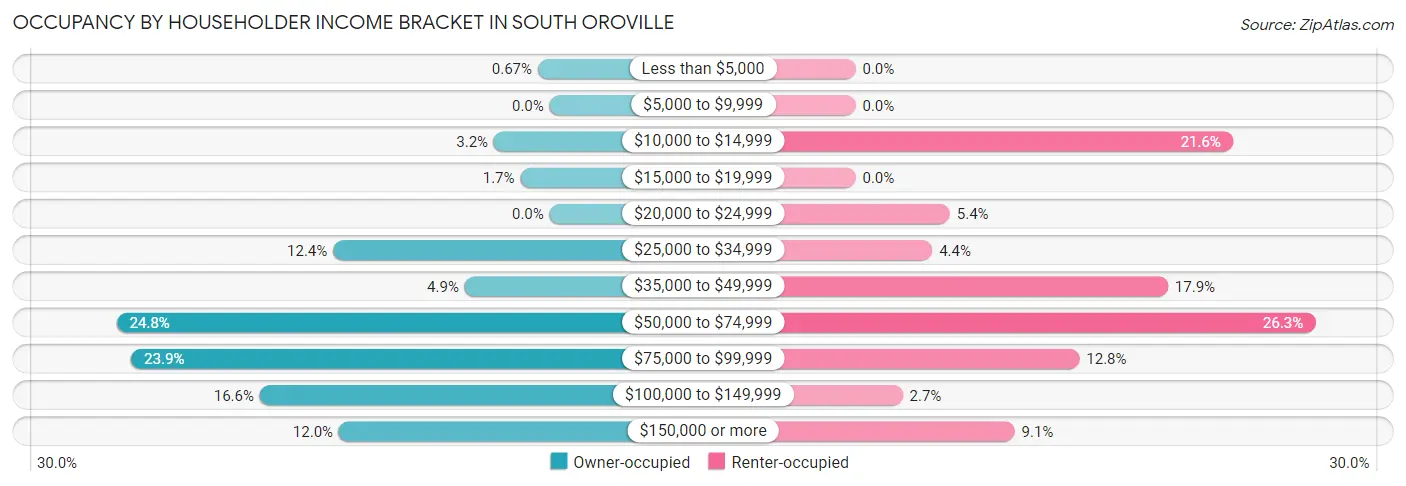
| Income Bracket | Owner-occupied | Renter-occupied |
| Less than $5,000 | 4 (0.7%) | 0 (0.0%) |
| $5,000 to $9,999 | 0 (0.0%) | 0 (0.0%) |
| $10,000 to $14,999 | 19 (3.2%) | 64 (21.5%) |
| $15,000 to $19,999 | 10 (1.7%) | 0 (0.0%) |
| $20,000 to $24,999 | 0 (0.0%) | 16 (5.4%) |
| $25,000 to $34,999 | 74 (12.4%) | 13 (4.4%) |
| $35,000 to $49,999 | 29 (4.9%) | 53 (17.8%) |
| $50,000 to $74,999 | 148 (24.7%) | 78 (26.3%) |
| $75,000 to $99,999 | 143 (23.9%) | 38 (12.8%) |
| $100,000 to $149,999 | 99 (16.6%) | 8 (2.7%) |
| $150,000 or more | 72 (12.0%) | 27 (9.1%) |
| Total | 598 (100.0%) | 297 (100.0%) |
Monthly Housing Cost Tiers in South Oroville
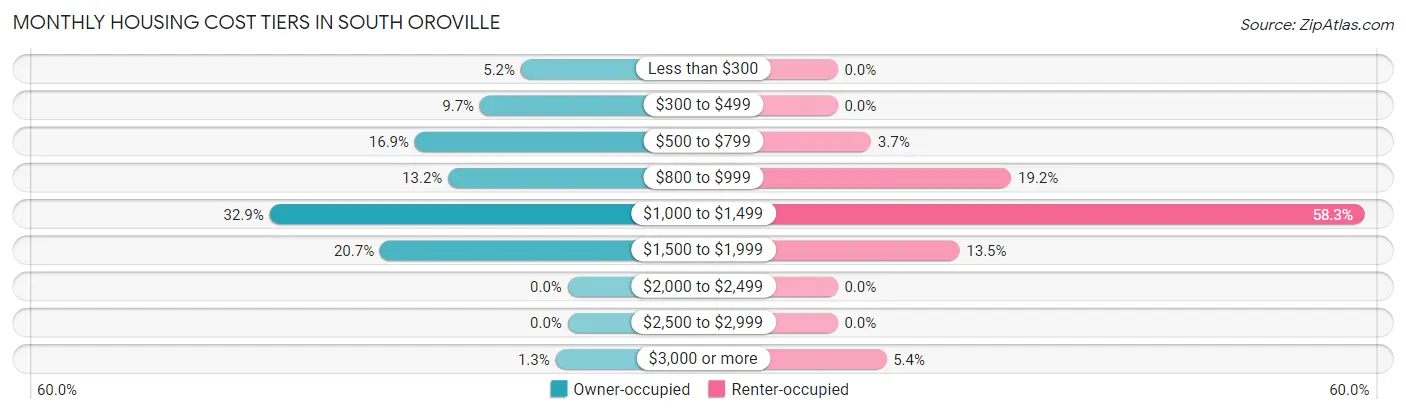
| Monthly Cost | Owner-occupied | Renter-occupied |
| Less than $300 | 31 (5.2%) | 0 (0.0%) |
| $300 to $499 | 58 (9.7%) | 0 (0.0%) |
| $500 to $799 | 101 (16.9%) | 11 (3.7%) |
| $800 to $999 | 79 (13.2%) | 57 (19.2%) |
| $1,000 to $1,499 | 197 (32.9%) | 173 (58.3%) |
| $1,500 to $1,999 | 124 (20.7%) | 40 (13.5%) |
| $2,000 to $2,499 | 0 (0.0%) | 0 (0.0%) |
| $2,500 to $2,999 | 0 (0.0%) | 0 (0.0%) |
| $3,000 or more | 8 (1.3%) | 16 (5.4%) |
| Total | 598 (100.0%) | 297 (100.0%) |
Physical Housing Characteristics in South Oroville
Housing Structures in South Oroville
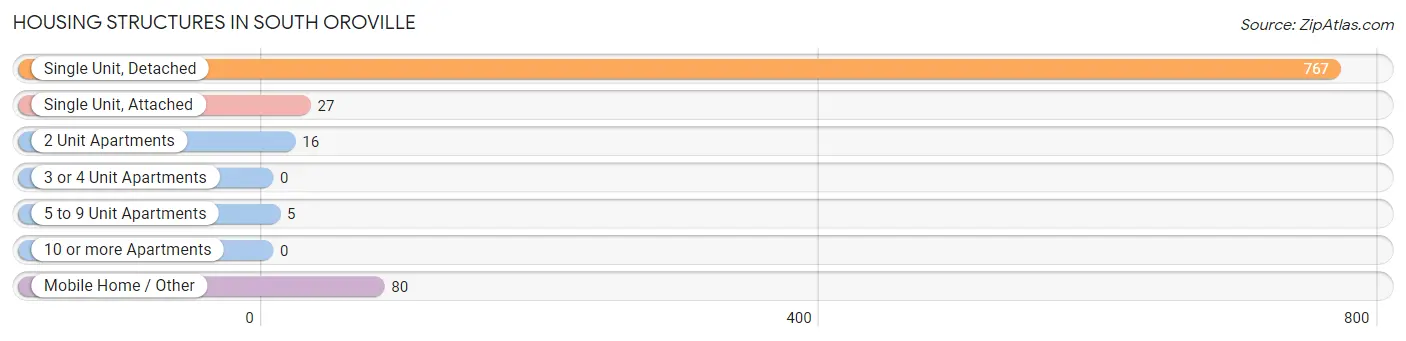
| Structure Type | # Housing Units | % Housing Units |
| Single Unit, Detached | 767 | 85.7% |
| Single Unit, Attached | 27 | 3.0% |
| 2 Unit Apartments | 16 | 1.8% |
| 3 or 4 Unit Apartments | 0 | 0.0% |
| 5 to 9 Unit Apartments | 5 | 0.6% |
| 10 or more Apartments | 0 | 0.0% |
| Mobile Home / Other | 80 | 8.9% |
| Total | 895 | 100.0% |
Housing Structures by Occupancy in South Oroville
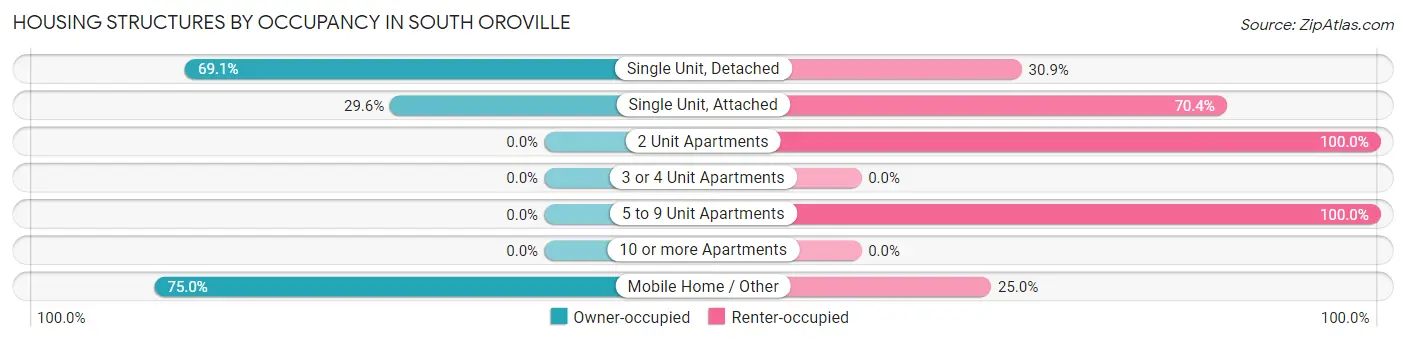
| Structure Type | Owner-occupied | Renter-occupied |
| Single Unit, Detached | 530 (69.1%) | 237 (30.9%) |
| Single Unit, Attached | 8 (29.6%) | 19 (70.4%) |
| 2 Unit Apartments | 0 (0.0%) | 16 (100.0%) |
| 3 or 4 Unit Apartments | 0 (0.0%) | 0 (0.0%) |
| 5 to 9 Unit Apartments | 0 (0.0%) | 5 (100.0%) |
| 10 or more Apartments | 0 (0.0%) | 0 (0.0%) |
| Mobile Home / Other | 60 (75.0%) | 20 (25.0%) |
| Total | 598 (66.8%) | 297 (33.2%) |
Housing Structures by Number of Rooms in South Oroville
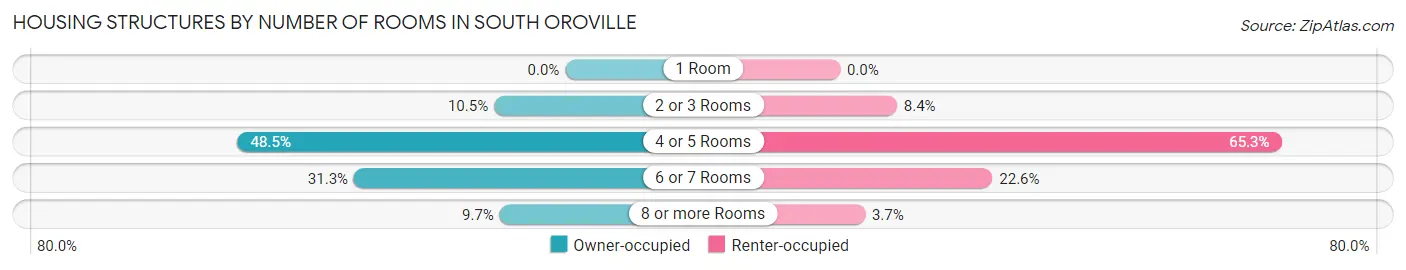
| Number of Rooms | Owner-occupied | Renter-occupied |
| 1 Room | 0 (0.0%) | 0 (0.0%) |
| 2 or 3 Rooms | 63 (10.5%) | 25 (8.4%) |
| 4 or 5 Rooms | 290 (48.5%) | 194 (65.3%) |
| 6 or 7 Rooms | 187 (31.3%) | 67 (22.6%) |
| 8 or more Rooms | 58 (9.7%) | 11 (3.7%) |
| Total | 598 (100.0%) | 297 (100.0%) |
Housing Structure by Heating Type in South Oroville
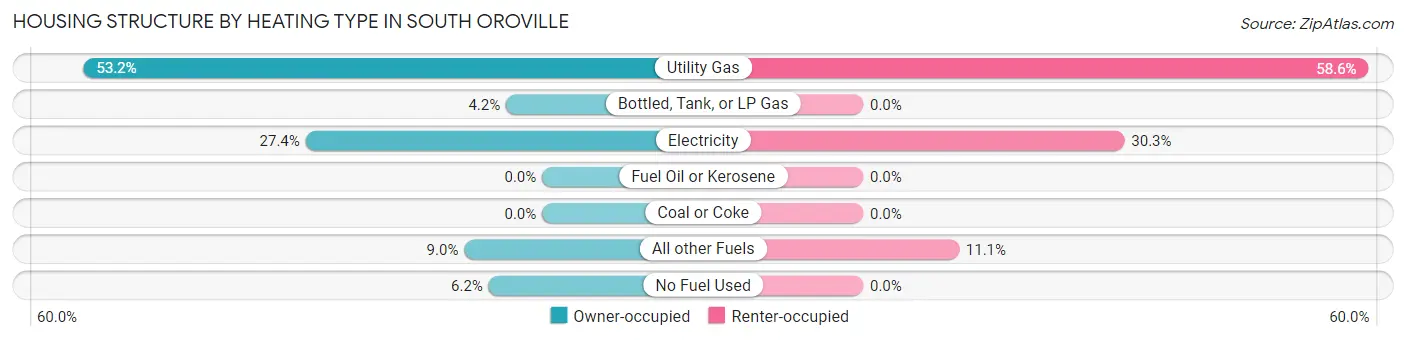
| Heating Type | Owner-occupied | Renter-occupied |
| Utility Gas | 318 (53.2%) | 174 (58.6%) |
| Bottled, Tank, or LP Gas | 25 (4.2%) | 0 (0.0%) |
| Electricity | 164 (27.4%) | 90 (30.3%) |
| Fuel Oil or Kerosene | 0 (0.0%) | 0 (0.0%) |
| Coal or Coke | 0 (0.0%) | 0 (0.0%) |
| All other Fuels | 54 (9.0%) | 33 (11.1%) |
| No Fuel Used | 37 (6.2%) | 0 (0.0%) |
| Total | 598 (100.0%) | 297 (100.0%) |
Household Vehicle Usage in South Oroville
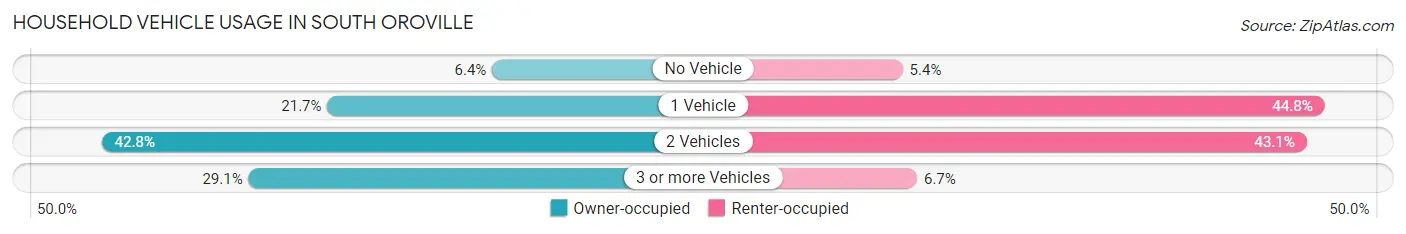
| Vehicles per Household | Owner-occupied | Renter-occupied |
| No Vehicle | 38 (6.4%) | 16 (5.4%) |
| 1 Vehicle | 130 (21.7%) | 133 (44.8%) |
| 2 Vehicles | 256 (42.8%) | 128 (43.1%) |
| 3 or more Vehicles | 174 (29.1%) | 20 (6.7%) |
| Total | 598 (100.0%) | 297 (100.0%) |
Real Estate & Mortgages in South Oroville
Real Estate and Mortgage Overview in South Oroville
| Characteristic | Without Mortgage | With Mortgage |
| Housing Units | 188 | 410 |
| Median Property Value | $181,300 | $235,100 |
| Median Household Income | $78,200 | $61 |
| Monthly Housing Costs | $664 | $8 |
| Real Estate Taxes | - | - |
Property Value by Mortgage Status in South Oroville
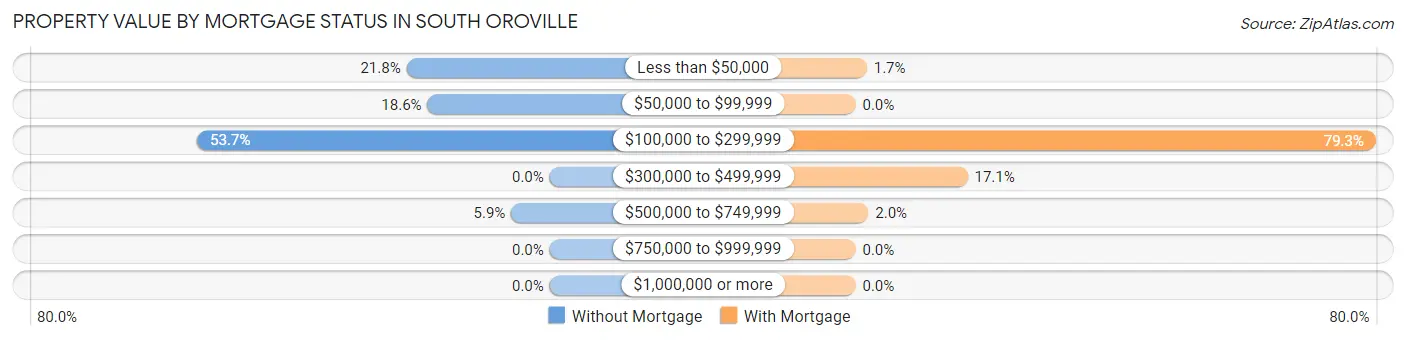
| Property Value | Without Mortgage | With Mortgage |
| Less than $50,000 | 41 (21.8%) | 7 (1.7%) |
| $50,000 to $99,999 | 35 (18.6%) | 0 (0.0%) |
| $100,000 to $299,999 | 101 (53.7%) | 325 (79.3%) |
| $300,000 to $499,999 | 0 (0.0%) | 70 (17.1%) |
| $500,000 to $749,999 | 11 (5.9%) | 8 (1.9%) |
| $750,000 to $999,999 | 0 (0.0%) | 0 (0.0%) |
| $1,000,000 or more | 0 (0.0%) | 0 (0.0%) |
| Total | 188 (100.0%) | 410 (100.0%) |
Household Income by Mortgage Status in South Oroville
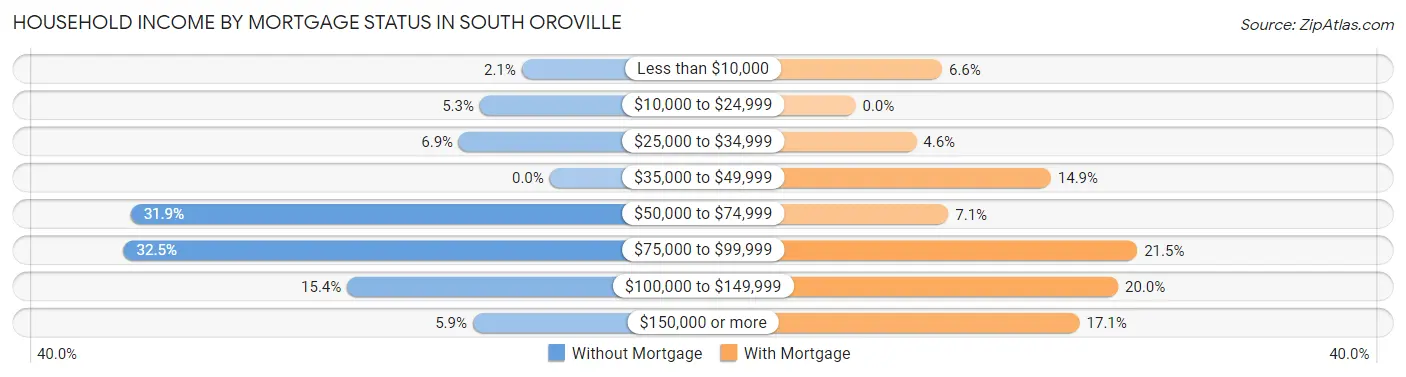
| Household Income | Without Mortgage | With Mortgage |
| Less than $10,000 | 4 (2.1%) | 27 (6.6%) |
| $10,000 to $24,999 | 10 (5.3%) | 0 (0.0%) |
| $25,000 to $34,999 | 13 (6.9%) | 19 (4.6%) |
| $35,000 to $49,999 | 0 (0.0%) | 61 (14.9%) |
| $50,000 to $74,999 | 60 (31.9%) | 29 (7.1%) |
| $75,000 to $99,999 | 61 (32.5%) | 88 (21.5%) |
| $100,000 to $149,999 | 29 (15.4%) | 82 (20.0%) |
| $150,000 or more | 11 (5.9%) | 70 (17.1%) |
| Total | 188 (100.0%) | 410 (100.0%) |
Property Value to Household Income Ratio in South Oroville
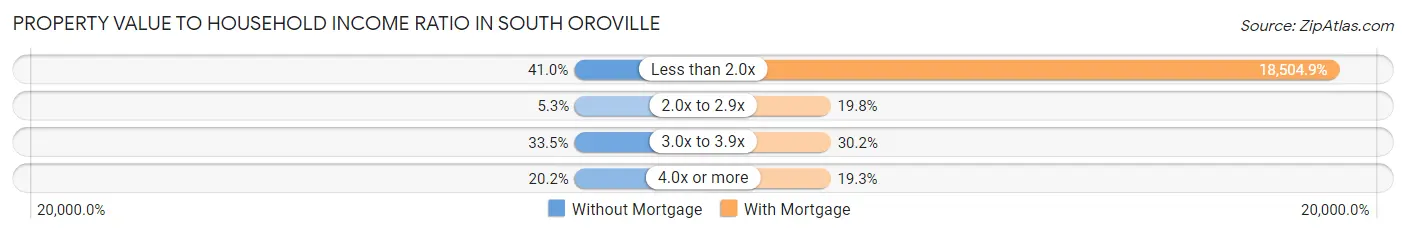
| Value-to-Income Ratio | Without Mortgage | With Mortgage |
| Less than 2.0x | 77 (41.0%) | 75,870 (18,504.9%) |
| 2.0x to 2.9x | 10 (5.3%) | 81 (19.8%) |
| 3.0x to 3.9x | 63 (33.5%) | 124 (30.2%) |
| 4.0x or more | 38 (20.2%) | 79 (19.3%) |
| Total | 188 (100.0%) | 410 (100.0%) |
Real Estate Taxes by Mortgage Status in South Oroville
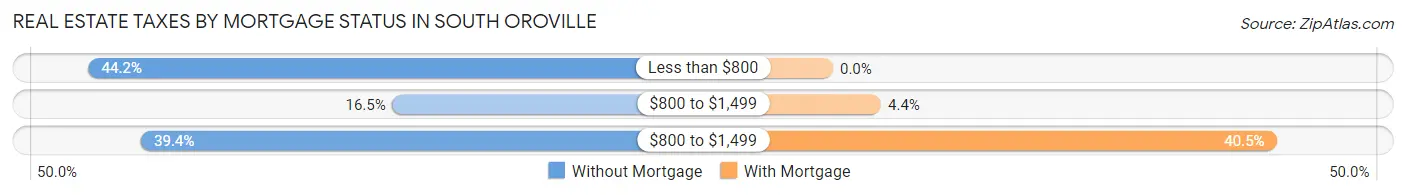
| Property Taxes | Without Mortgage | With Mortgage |
| Less than $800 | 83 (44.2%) | 0 (0.0%) |
| $800 to $1,499 | 31 (16.5%) | 18 (4.4%) |
| $800 to $1,499 | 74 (39.4%) | 166 (40.5%) |
| Total | 188 (100.0%) | 410 (100.0%) |
Health & Disability in South Oroville
Health Insurance Coverage by Age in South Oroville
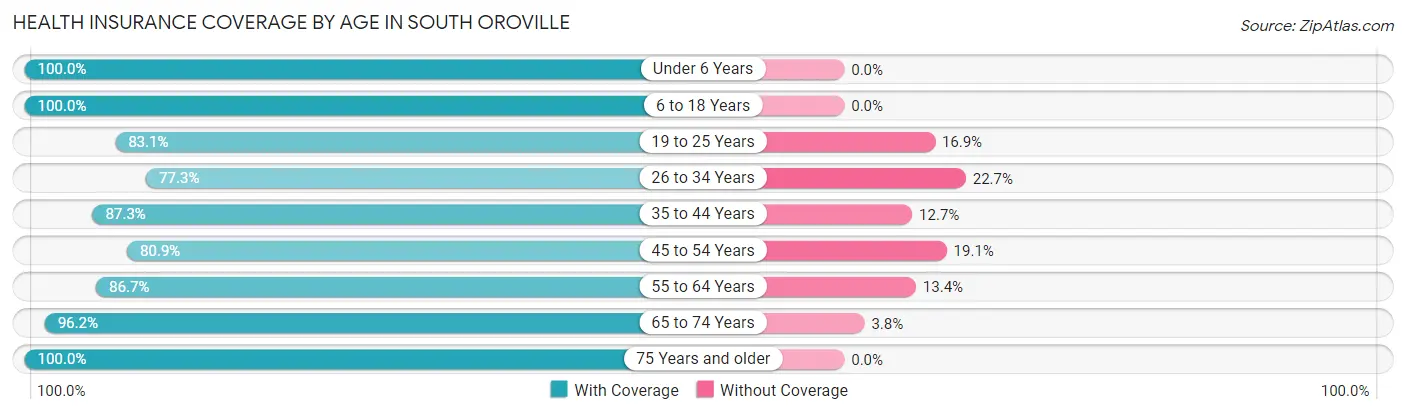
| Age Bracket | With Coverage | Without Coverage |
| Under 6 Years | 176 (100.0%) | 0 (0.0%) |
| 6 to 18 Years | 270 (100.0%) | 0 (0.0%) |
| 19 to 25 Years | 236 (83.1%) | 48 (16.9%) |
| 26 to 34 Years | 273 (77.3%) | 80 (22.7%) |
| 35 to 44 Years | 200 (87.3%) | 29 (12.7%) |
| 45 to 54 Years | 250 (80.9%) | 59 (19.1%) |
| 55 to 64 Years | 279 (86.7%) | 43 (13.4%) |
| 65 to 74 Years | 256 (96.2%) | 10 (3.8%) |
| 75 Years and older | 82 (100.0%) | 0 (0.0%) |
| Total | 2,022 (88.3%) | 269 (11.7%) |
Health Insurance Coverage by Citizenship Status in South Oroville
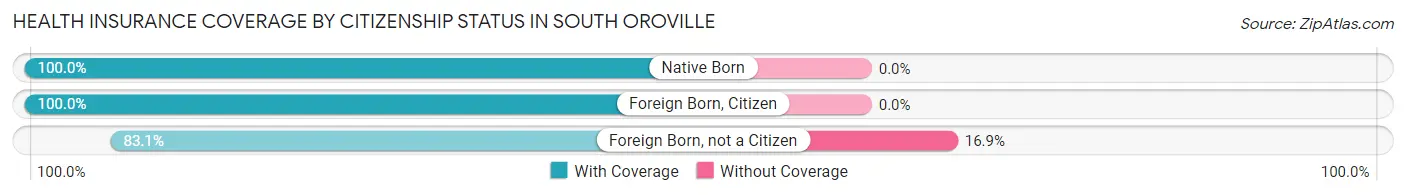
| Citizenship Status | With Coverage | Without Coverage |
| Native Born | 176 (100.0%) | 0 (0.0%) |
| Foreign Born, Citizen | 270 (100.0%) | 0 (0.0%) |
| Foreign Born, not a Citizen | 236 (83.1%) | 48 (16.9%) |
Health Insurance Coverage by Household Income in South Oroville
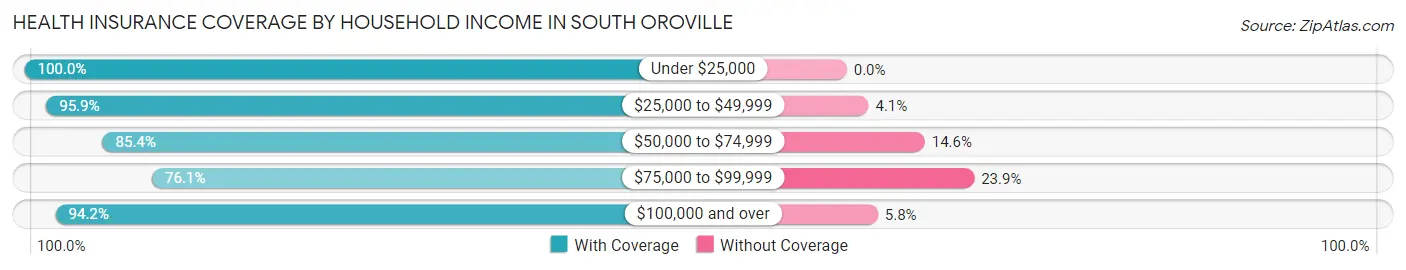
| Household Income | With Coverage | Without Coverage |
| Under $25,000 | 135 (100.0%) | 0 (0.0%) |
| $25,000 to $49,999 | 283 (95.9%) | 12 (4.1%) |
| $50,000 to $74,999 | 584 (85.4%) | 100 (14.6%) |
| $75,000 to $99,999 | 373 (76.1%) | 117 (23.9%) |
| $100,000 and over | 647 (94.2%) | 40 (5.8%) |
Public vs Private Health Insurance Coverage by Age in South Oroville
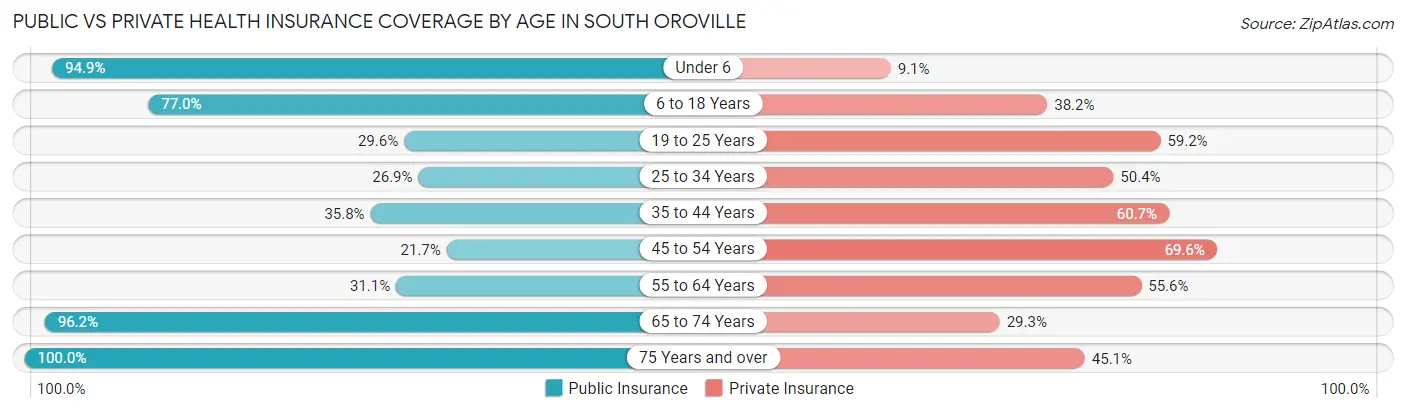
| Age Bracket | Public Insurance | Private Insurance |
| Under 6 | 167 (94.9%) | 16 (9.1%) |
| 6 to 18 Years | 208 (77.0%) | 103 (38.2%) |
| 19 to 25 Years | 84 (29.6%) | 168 (59.2%) |
| 25 to 34 Years | 95 (26.9%) | 178 (50.4%) |
| 35 to 44 Years | 82 (35.8%) | 139 (60.7%) |
| 45 to 54 Years | 67 (21.7%) | 215 (69.6%) |
| 55 to 64 Years | 100 (31.1%) | 179 (55.6%) |
| 65 to 74 Years | 256 (96.2%) | 78 (29.3%) |
| 75 Years and over | 82 (100.0%) | 37 (45.1%) |
| Total | 1,141 (49.8%) | 1,113 (48.6%) |
Disability Status by Sex by Age in South Oroville
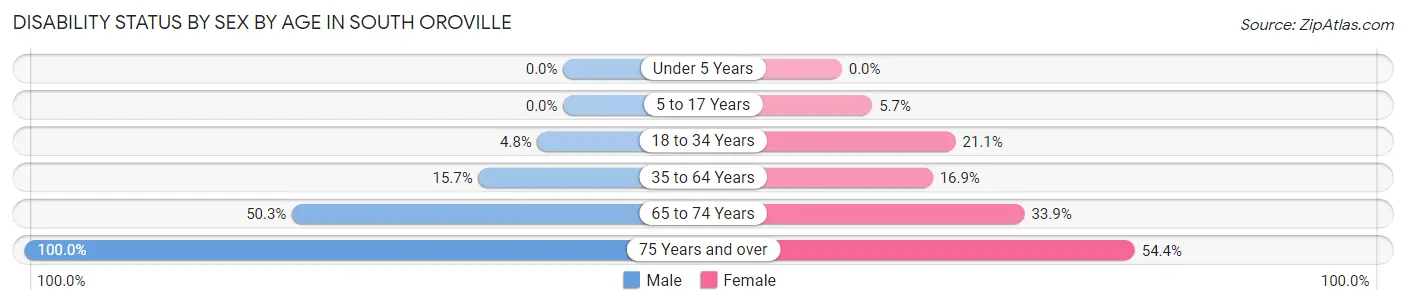
| Age Bracket | Male | Female |
| Under 5 Years | 0 (0.0%) | 0 (0.0%) |
| 5 to 17 Years | 0 (0.0%) | 7 (5.7%) |
| 18 to 34 Years | 18 (4.8%) | 60 (21.1%) |
| 35 to 64 Years | 71 (15.7%) | 69 (16.9%) |
| 65 to 74 Years | 76 (50.3%) | 39 (33.9%) |
| 75 Years and over | 25 (100.0%) | 31 (54.4%) |
Disability Class by Sex by Age in South Oroville
Disability Class: Hearing Difficulty
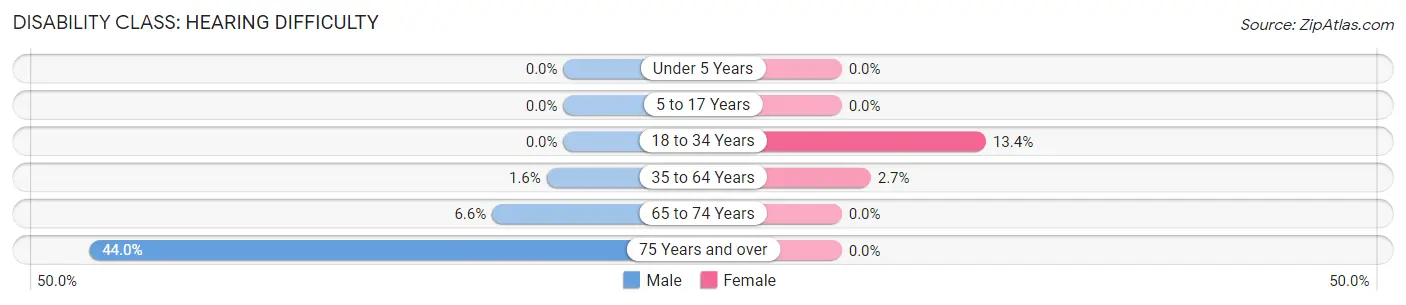
| Age Bracket | Male | Female |
| Under 5 Years | 0 (0.0%) | 0 (0.0%) |
| 5 to 17 Years | 0 (0.0%) | 0 (0.0%) |
| 18 to 34 Years | 0 (0.0%) | 38 (13.4%) |
| 35 to 64 Years | 7 (1.5%) | 11 (2.7%) |
| 65 to 74 Years | 10 (6.6%) | 0 (0.0%) |
| 75 Years and over | 11 (44.0%) | 0 (0.0%) |
Disability Class: Vision Difficulty
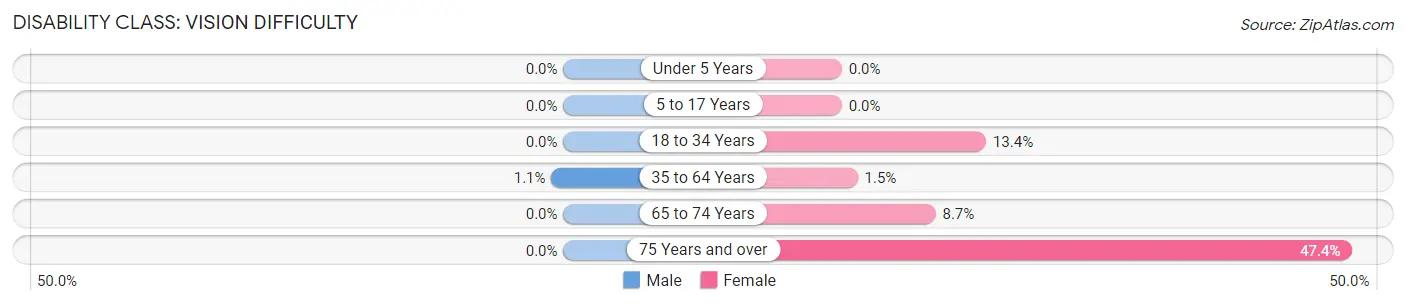
| Age Bracket | Male | Female |
| Under 5 Years | 0 (0.0%) | 0 (0.0%) |
| 5 to 17 Years | 0 (0.0%) | 0 (0.0%) |
| 18 to 34 Years | 0 (0.0%) | 38 (13.4%) |
| 35 to 64 Years | 5 (1.1%) | 6 (1.5%) |
| 65 to 74 Years | 0 (0.0%) | 10 (8.7%) |
| 75 Years and over | 0 (0.0%) | 27 (47.4%) |
Disability Class: Cognitive Difficulty
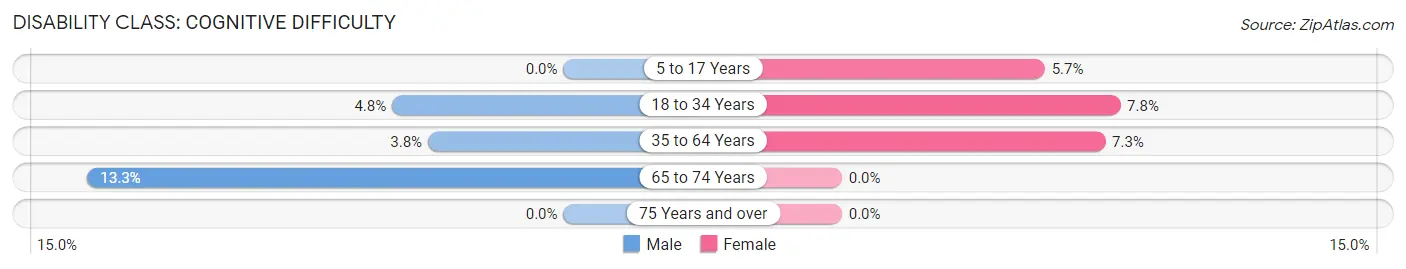
| Age Bracket | Male | Female |
| 5 to 17 Years | 0 (0.0%) | 7 (5.7%) |
| 18 to 34 Years | 18 (4.8%) | 22 (7.7%) |
| 35 to 64 Years | 17 (3.8%) | 30 (7.3%) |
| 65 to 74 Years | 20 (13.3%) | 0 (0.0%) |
| 75 Years and over | 0 (0.0%) | 0 (0.0%) |
Disability Class: Ambulatory Difficulty
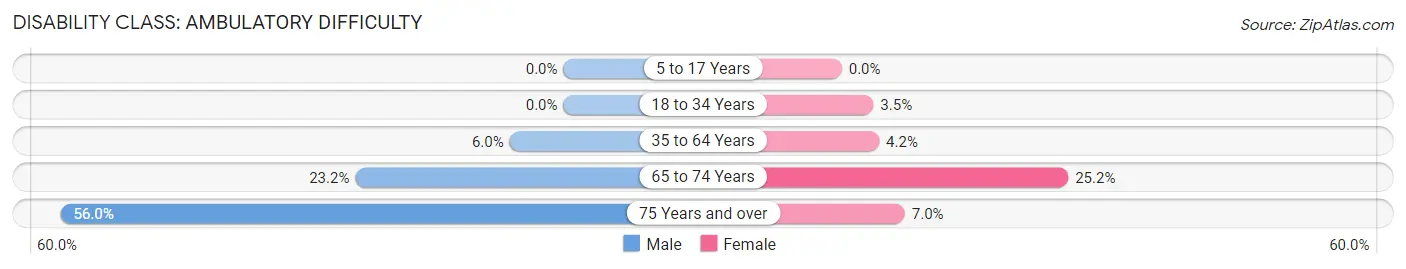
| Age Bracket | Male | Female |
| 5 to 17 Years | 0 (0.0%) | 0 (0.0%) |
| 18 to 34 Years | 0 (0.0%) | 10 (3.5%) |
| 35 to 64 Years | 27 (6.0%) | 17 (4.2%) |
| 65 to 74 Years | 35 (23.2%) | 29 (25.2%) |
| 75 Years and over | 14 (56.0%) | 4 (7.0%) |
Disability Class: Self-Care Difficulty
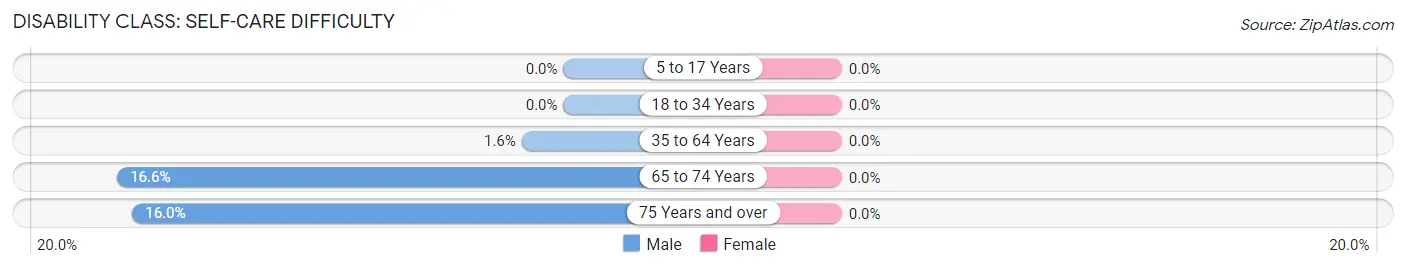
| Age Bracket | Male | Female |
| 5 to 17 Years | 0 (0.0%) | 0 (0.0%) |
| 18 to 34 Years | 0 (0.0%) | 0 (0.0%) |
| 35 to 64 Years | 7 (1.5%) | 0 (0.0%) |
| 65 to 74 Years | 25 (16.6%) | 0 (0.0%) |
| 75 Years and over | 4 (16.0%) | 0 (0.0%) |
Technology Access in South Oroville
Computing Device Access in South Oroville
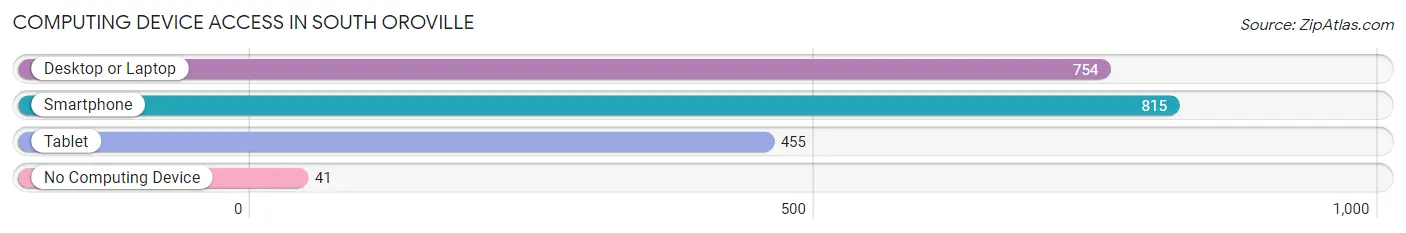
| Device Type | # Households | % Households |
| Desktop or Laptop | 754 | 84.3% |
| Smartphone | 815 | 91.1% |
| Tablet | 455 | 50.8% |
| No Computing Device | 41 | 4.6% |
| Total | 895 | 100.0% |
Internet Access in South Oroville
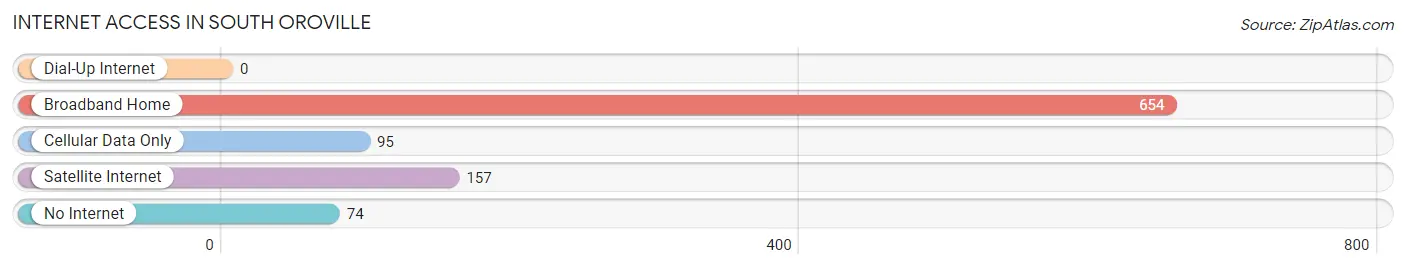
| Internet Type | # Households | % Households |
| Dial-Up Internet | 0 | 0.0% |
| Broadband Home | 654 | 73.1% |
| Cellular Data Only | 95 | 10.6% |
| Satellite Internet | 157 | 17.5% |
| No Internet | 74 | 8.3% |
| Total | 895 | 100.0% |
South Oroville Summary
Oroville is a city located in Butte County, California, United States. It is situated in the foothills of the Sierra Nevada Mountains, about 80 miles north of Sacramento. The city is the county seat of Butte County and is the largest city in the county. The population of Oroville was 15,546 at the 2010 census, up from 13,004 at the 2000 census.
History
The area around Oroville was originally inhabited by the Maidu Native American tribe. The first European settlers arrived in the area in the 1850s, and the city was officially founded in 1861. The city was named after the gold rush town of Oroville, which was located nearby.
The city grew rapidly during the gold rush, and by the late 1860s, it had become a major trading center for the region. The city was incorporated in 1906, and the population continued to grow throughout the 20th century.
Geography
Oroville is located in the foothills of the Sierra Nevada Mountains, about 80 miles north of Sacramento. The city is situated at an elevation of 890 feet above sea level. The city is located on the banks of the Feather River, which is a major tributary of the Sacramento River.
The city covers an area of 11.2 square miles, of which 11.1 square miles is land and 0.1 square miles is water. The city is surrounded by several smaller communities, including South Oroville, Palermo, and Thermalito.
Economy
Oroville is a major agricultural center for the region, and the city is home to several large agricultural companies. The city is also home to several manufacturing companies, including a paper mill and a cement plant.
The city is also a popular tourist destination, and the Feather River is a popular spot for fishing, boating, and other recreational activities. The city is also home to several casinos, which attract visitors from all over the region.
Demographics
As of the 2010 census, the population of Oroville was 15,546. The racial makeup of the city was 68.2% White, 1.3% African American, 1.2% Native American, 0.7% Asian, 0.2% Pacific Islander, 25.2% from other races, and 3.2% from two or more races. Hispanic or Latino of any race were 44.2% of the population.
The median income for a household in the city was $35,945, and the median income for a family was $41,945. The per capita income for the city was $17,845. About 17.2% of families and 21.3% of the population were below the poverty line, including 28.3% of those under age 18 and 8.2% of those age 65 or over.
Conclusion
Oroville is a city located in Butte County, California, United States. It is situated in the foothills of the Sierra Nevada Mountains, about 80 miles north of Sacramento. The city is the county seat of Butte County and is the largest city in the county. The population of Oroville was 15,546 at the 2010 census, up from 13,004 at the 2000 census. The city is a major agricultural center for the region, and the city is home to several large agricultural companies. The city is also a popular tourist destination, and the Feather River is a popular spot for fishing, boating, and other recreational activities. The racial makeup of the city was 68.2% White, 1.3% African American, 1.2% Native American, 0.7% Asian, 0.2% Pacific Islander, 25.2% from other races, and 3.2% from two or more races. The median income for a household in the city was $35,945, and the median income for a family was $41,945.
Common Questions
What is Per Capita Income in South Oroville?
Per Capita income in South Oroville is $28,905.
What is the Median Family Income in South Oroville?
Median Family Income in South Oroville is $78,250.
What is the Median Household income in South Oroville?
Median Household Income in South Oroville is $66,150.
What is Income or Wage Gap in South Oroville?
Income or Wage Gap in South Oroville is 16.4%.
Women in South Oroville earn 83.6 cents for every dollar earned by a man.
What is Inequality or Gini Index in South Oroville?
Inequality or Gini Index in South Oroville is 0.34.
What is the Total Population of South Oroville?
Total Population of South Oroville is 2,291.
What is the Total Male Population of South Oroville?
Total Male Population of South Oroville is 1,210.
What is the Total Female Population of South Oroville?
Total Female Population of South Oroville is 1,081.
What is the Ratio of Males per 100 Females in South Oroville?
There are 111.93 Males per 100 Females in South Oroville.
What is the Ratio of Females per 100 Males in South Oroville?
There are 89.34 Females per 100 Males in South Oroville.
What is the Median Population Age in South Oroville?
Median Population Age in South Oroville is 37.0 Years.
What is the Average Family Size in South Oroville
Average Family Size in South Oroville is 3.2 People.
What is the Average Household Size in South Oroville
Average Household Size in South Oroville is 2.6 People.
How Large is the Labor Force in South Oroville?
There are 1,241 People in the Labor Forcein in South Oroville.
What is the Percentage of People in the Labor Force in South Oroville?
65.1% of People are in the Labor Force in South Oroville.
What is the Unemployment Rate in South Oroville?
Unemployment Rate in South Oroville is 4.8%.