Cities with the Highest Percentage of Population with a Degree in Science and Engineering in Minnesota
RELATED REPORTS & OPTIONS
Science and Engineering
Minnesota
Compare Cities
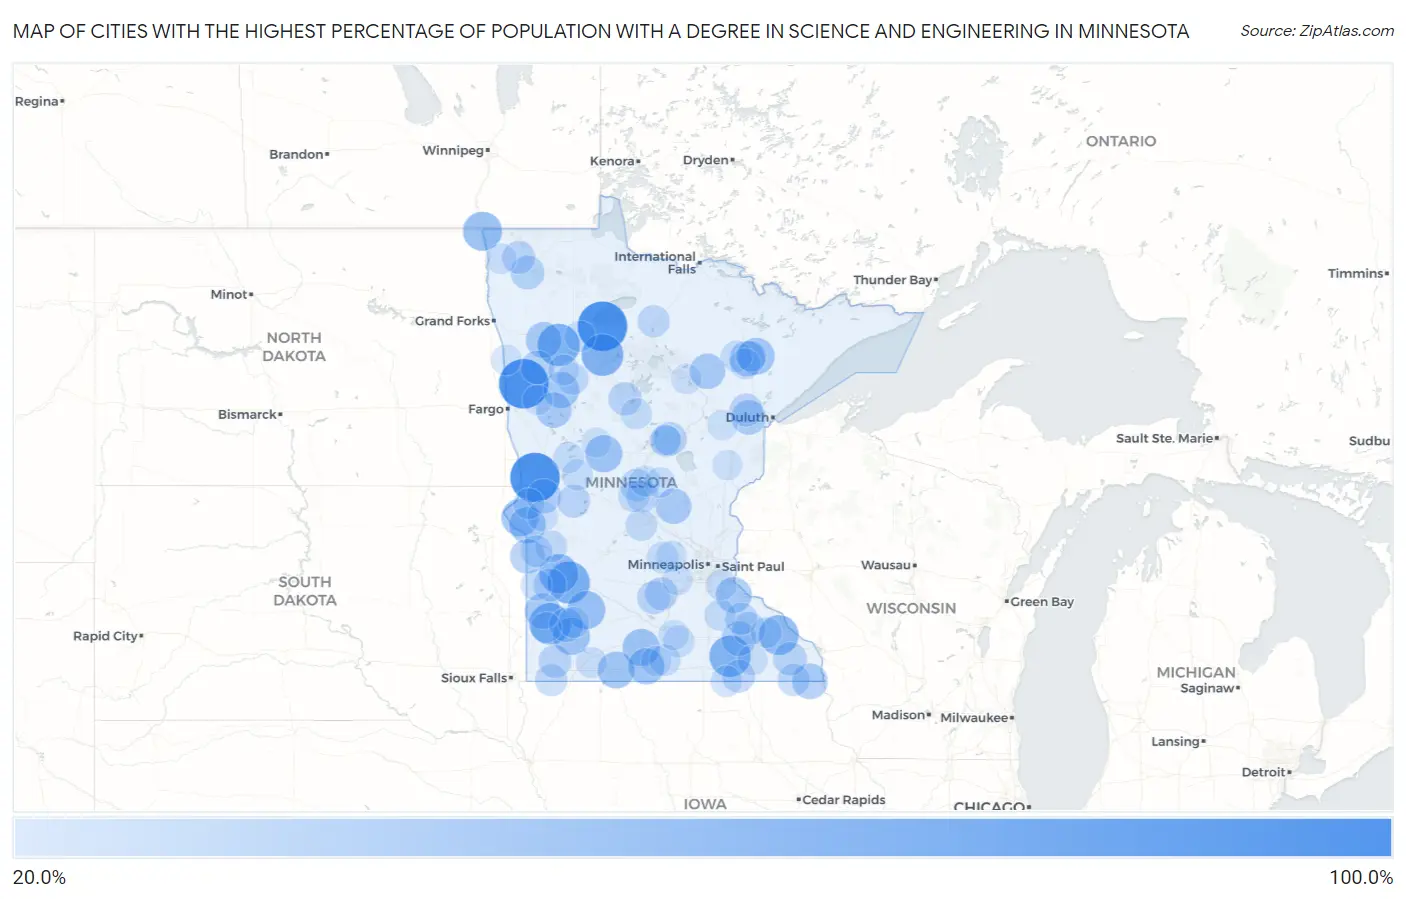
Map of Cities with the Highest Percentage of Population with a Degree in Science and Engineering in Minnesota
0.0%
100.0%
Cities with the Highest Percentage of Population with a Degree in Science and Engineering in Minnesota
| City | % Graduates | vs State | vs National | |
| 1. | Little Rock | 100.0% | 9.8%(+90.2)#1 | 9.8%(+90.2)#6 |
| 2. | Borup | 100.0% | 9.8%(+90.2)#2 | 9.8%(+90.2)#103 |
| 3. | Nashua | 100.0% | 9.8%(+90.2)#3 | 9.8%(+90.2)#168 |
| 4. | Mcintosh | 70.2% | 9.8%(+60.4)#4 | 9.8%(+60.4)#303 |
| 5. | Hazel Run | 70.0% | 9.8%(+60.2)#5 | 9.8%(+60.2)#305 |
| 6. | Solway | 68.0% | 9.8%(+58.2)#6 | 9.8%(+58.2)#318 |
| 7. | Waltham | 66.7% | 9.8%(+56.9)#7 | 9.8%(+56.9)#330 |
| 8. | Florence | 66.7% | 9.8%(+56.9)#8 | 9.8%(+56.9)#349 |
| 9. | Knife River | 61.5% | 9.8%(+51.7)#9 | 9.8%(+51.8)#385 |
| 10. | Elba | 60.0% | 9.8%(+50.2)#10 | 9.8%(+50.2)#414 |
| 11. | Boyd | 58.3% | 9.8%(+48.5)#11 | 9.8%(+48.6)#436 |
| 12. | St Vincent | 57.1% | 9.8%(+47.3)#12 | 9.8%(+47.4)#447 |
| 13. | Lucan | 53.3% | 9.8%(+43.5)#13 | 9.8%(+43.6)#501 |
| 14. | Marion | 50.6% | 9.8%(+40.8)#14 | 9.8%(+40.8)#540 |
| 15. | Hewitt | 50.0% | 9.8%(+40.2)#15 | 9.8%(+40.2)#561 |
| 16. | Lewisville | 50.0% | 9.8%(+40.2)#16 | 9.8%(+40.2)#562 |
| 17. | Currie | 50.0% | 9.8%(+40.2)#17 | 9.8%(+40.2)#576 |
| 18. | Barry | 50.0% | 9.8%(+40.2)#18 | 9.8%(+40.2)#637 |
| 19. | Goodland | 50.0% | 9.8%(+40.2)#19 | 9.8%(+40.2)#638 |
| 20. | Alpha | 48.5% | 9.8%(+38.7)#20 | 9.8%(+38.8)#653 |
| 21. | Clinton | 48.3% | 9.8%(+38.5)#21 | 9.8%(+38.5)#659 |
| 22. | Mckinley | 48.1% | 9.8%(+38.3)#22 | 9.8%(+38.4)#670 |
| 23. | Granada | 46.7% | 9.8%(+36.9)#23 | 9.8%(+36.9)#709 |
| 24. | Pickwick | 45.2% | 9.8%(+35.4)#24 | 9.8%(+35.4)#742 |
| 25. | White Earth | 44.8% | 9.8%(+35.0)#25 | 9.8%(+35.0)#747 |
| 26. | Mentor | 44.4% | 9.8%(+34.6)#26 | 9.8%(+34.7)#768 |
| 27. | Miesville | 44.4% | 9.8%(+34.6)#27 | 9.8%(+34.7)#770 |
| 28. | Audubon | 43.8% | 9.8%(+33.9)#28 | 9.8%(+34.0)#791 |
| 29. | Eitzen | 43.6% | 9.8%(+33.8)#29 | 9.8%(+33.9)#799 |
| 30. | Calumet | 42.9% | 9.8%(+33.0)#30 | 9.8%(+33.1)#832 |
| 31. | Arco | 42.9% | 9.8%(+33.0)#31 | 9.8%(+33.1)#842 |
| 32. | Leonidas | 42.9% | 9.8%(+33.0)#32 | 9.8%(+33.1)#843 |
| 33. | Ronneby | 42.9% | 9.8%(+33.0)#33 | 9.8%(+33.1)#844 |
| 34. | Mahnomen | 40.0% | 9.8%(+30.2)#34 | 9.8%(+30.2)#962 |
| 35. | Nassau | 40.0% | 9.8%(+30.2)#35 | 9.8%(+30.2)#977 |
| 36. | Kasson | 39.6% | 9.8%(+29.8)#36 | 9.8%(+29.8)#988 |
| 37. | Herman | 39.1% | 9.8%(+29.3)#37 | 9.8%(+29.3)#1,001 |
| 38. | Garvin | 37.5% | 9.8%(+27.7)#38 | 9.8%(+27.7)#1,109 |
| 39. | Gary | 36.4% | 9.8%(+26.6)#39 | 9.8%(+26.6)#1,150 |
| 40. | Strandquist | 36.4% | 9.8%(+26.6)#40 | 9.8%(+26.6)#1,155 |
| 41. | Oronoco | 35.8% | 9.8%(+26.0)#41 | 9.8%(+26.0)#1,184 |
| 42. | Cuyuna | 35.6% | 9.8%(+25.7)#42 | 9.8%(+25.8)#1,202 |
| 43. | Peterson | 34.8% | 9.8%(+25.0)#43 | 9.8%(+25.0)#1,254 |
| 44. | Gaylord | 34.6% | 9.8%(+24.8)#44 | 9.8%(+24.8)#1,264 |
| 45. | Akeley | 34.1% | 9.8%(+24.3)#45 | 9.8%(+24.3)#1,291 |
| 46. | Lismore | 33.3% | 9.8%(+23.5)#46 | 9.8%(+23.6)#1,340 |
| 47. | St Leo | 33.3% | 9.8%(+23.5)#47 | 9.8%(+23.6)#1,368 |
| 48. | Brookston | 33.3% | 9.8%(+23.5)#48 | 9.8%(+23.6)#1,389 |
| 49. | Halma | 33.3% | 9.8%(+23.5)#49 | 9.8%(+23.6)#1,409 |
| 50. | Farwell | 33.3% | 9.8%(+23.5)#50 | 9.8%(+23.6)#1,410 |
| 51. | Arlington | 33.2% | 9.8%(+23.4)#51 | 9.8%(+23.4)#1,418 |
| 52. | Adams | 32.2% | 9.8%(+22.4)#52 | 9.8%(+22.4)#1,468 |
| 53. | Flensburg | 31.2% | 9.8%(+21.4)#53 | 9.8%(+21.5)#1,549 |
| 54. | Bowlus | 30.8% | 9.8%(+21.0)#54 | 9.8%(+21.0)#1,597 |
| 55. | Ellsworth | 30.6% | 9.8%(+20.8)#55 | 9.8%(+20.9)#1,612 |
| 56. | Mabel | 30.4% | 9.8%(+20.6)#56 | 9.8%(+20.7)#1,627 |
| 57. | Zumbrota | 30.2% | 9.8%(+20.4)#57 | 9.8%(+20.4)#1,649 |
| 58. | Mizpah | 30.0% | 9.8%(+20.2)#58 | 9.8%(+20.2)#1,688 |
| 59. | Twin Lakes | 29.2% | 9.8%(+19.4)#59 | 9.8%(+19.4)#1,790 |
| 60. | Appleton | 28.8% | 9.8%(+19.0)#60 | 9.8%(+19.1)#1,829 |
| 61. | Bellingham | 28.6% | 9.8%(+18.8)#61 | 9.8%(+18.8)#1,880 |
| 62. | Cold Spring | 28.4% | 9.8%(+18.6)#62 | 9.8%(+18.7)#1,911 |
| 63. | Howard Lake | 27.9% | 9.8%(+18.1)#63 | 9.8%(+18.1)#1,965 |
| 64. | Pemberton | 27.8% | 9.8%(+18.0)#64 | 9.8%(+18.0)#1,987 |
| 65. | Ironton | 27.7% | 9.8%(+17.9)#65 | 9.8%(+17.9)#1,995 |
| 66. | Upsala | 27.7% | 9.8%(+17.9)#66 | 9.8%(+17.9)#1,998 |
| 67. | Lyle | 27.3% | 9.8%(+17.5)#67 | 9.8%(+17.5)#2,046 |
| 68. | Delavan | 27.3% | 9.8%(+17.5)#68 | 9.8%(+17.5)#2,060 |
| 69. | Buhl | 26.9% | 9.8%(+17.1)#69 | 9.8%(+17.1)#2,103 |
| 70. | Nerstrand | 26.9% | 9.8%(+17.1)#70 | 9.8%(+17.1)#2,110 |
| 71. | Gonvick | 26.7% | 9.8%(+16.9)#71 | 9.8%(+16.9)#2,138 |
| 72. | Millerville | 26.7% | 9.8%(+16.9)#72 | 9.8%(+16.9)#2,144 |
| 73. | Tracy | 26.3% | 9.8%(+16.5)#73 | 9.8%(+16.6)#2,174 |
| 74. | Backus | 26.3% | 9.8%(+16.5)#74 | 9.8%(+16.5)#2,186 |
| 75. | Dumont | 26.3% | 9.8%(+16.5)#75 | 9.8%(+16.5)#2,196 |
| 76. | Battle Lake | 25.8% | 9.8%(+16.0)#76 | 9.8%(+16.0)#2,278 |
| 77. | Little Falls | 25.8% | 9.8%(+16.0)#77 | 9.8%(+16.0)#2,280 |
| 78. | Canby | 25.7% | 9.8%(+15.9)#78 | 9.8%(+15.9)#2,292 |
| 79. | Okabena | 25.5% | 9.8%(+15.6)#79 | 9.8%(+15.7)#2,330 |
| 80. | Montrose | 25.4% | 9.8%(+15.6)#80 | 9.8%(+15.7)#2,331 |
| 81. | Elgin | 25.4% | 9.8%(+15.5)#81 | 9.8%(+15.6)#2,339 |
| 82. | Ruthton | 25.0% | 9.8%(+15.2)#82 | 9.8%(+15.2)#2,442 |
| 83. | Coates | 25.0% | 9.8%(+15.2)#83 | 9.8%(+15.2)#2,462 |
| 84. | Trommald | 25.0% | 9.8%(+15.2)#84 | 9.8%(+15.2)#2,467 |
| 85. | Iron Junction | 25.0% | 9.8%(+15.2)#85 | 9.8%(+15.2)#2,480 |
| 86. | Beaulieu | 25.0% | 9.8%(+15.2)#86 | 9.8%(+15.2)#2,493 |
| 87. | Pierz | 24.8% | 9.8%(+14.9)#87 | 9.8%(+15.0)#2,522 |
| 88. | Virginia | 24.4% | 9.8%(+14.6)#88 | 9.8%(+14.6)#2,574 |
| 89. | Chokio | 24.1% | 9.8%(+14.3)#89 | 9.8%(+14.4)#2,619 |
| 90. | Shelly | 24.1% | 9.8%(+14.3)#90 | 9.8%(+14.4)#2,621 |
| 91. | Kennedy | 24.1% | 9.8%(+14.3)#91 | 9.8%(+14.4)#2,623 |
| 92. | Cohasset | 24.1% | 9.8%(+14.3)#92 | 9.8%(+14.3)#2,627 |
| 93. | Winnebago | 24.1% | 9.8%(+14.3)#93 | 9.8%(+14.3)#2,639 |
| 94. | Cologne | 23.9% | 9.8%(+14.1)#94 | 9.8%(+14.1)#2,669 |
| 95. | Racine | 23.5% | 9.8%(+13.7)#95 | 9.8%(+13.7)#2,751 |
| 96. | St Clair | 23.5% | 9.8%(+13.7)#96 | 9.8%(+13.7)#2,768 |
| 97. | Bluffton | 23.1% | 9.8%(+13.3)#97 | 9.8%(+13.3)#2,887 |
| 98. | Wright | 23.1% | 9.8%(+13.3)#98 | 9.8%(+13.3)#2,894 |
| 99. | Finlayson | 22.7% | 9.8%(+12.9)#99 | 9.8%(+12.9)#2,973 |
| 100. | Hitterdal | 22.5% | 9.8%(+12.7)#100 | 9.8%(+12.7)#3,035 |
Common Questions
What are the Top 10 Cities with the Highest Percentage of Population with a Degree in Science and Engineering in Minnesota?
Top 10 Cities with the Highest Percentage of Population with a Degree in Science and Engineering in Minnesota are:
What city has the Highest Percentage of Population with a Degree in Science and Engineering in Minnesota?
Little Rock has the Highest Percentage of Population with a Degree in Science and Engineering in Minnesota with 100.0%.
What is the Percentage of Population with a Degree in Science and Engineering in the State of Minnesota?
Percentage of Population with a Degree in Science and Engineering in Minnesota is 9.8%.
What is the Percentage of Population with a Degree in Science and Engineering in the United States?
Percentage of Population with a Degree in Science and Engineering in the United States is 9.8%.