Cities with the Highest Percentage of Population with a Degree in Science and Engineering in Arkansas
RELATED REPORTS & OPTIONS
Science and Engineering
Arkansas
Compare Cities
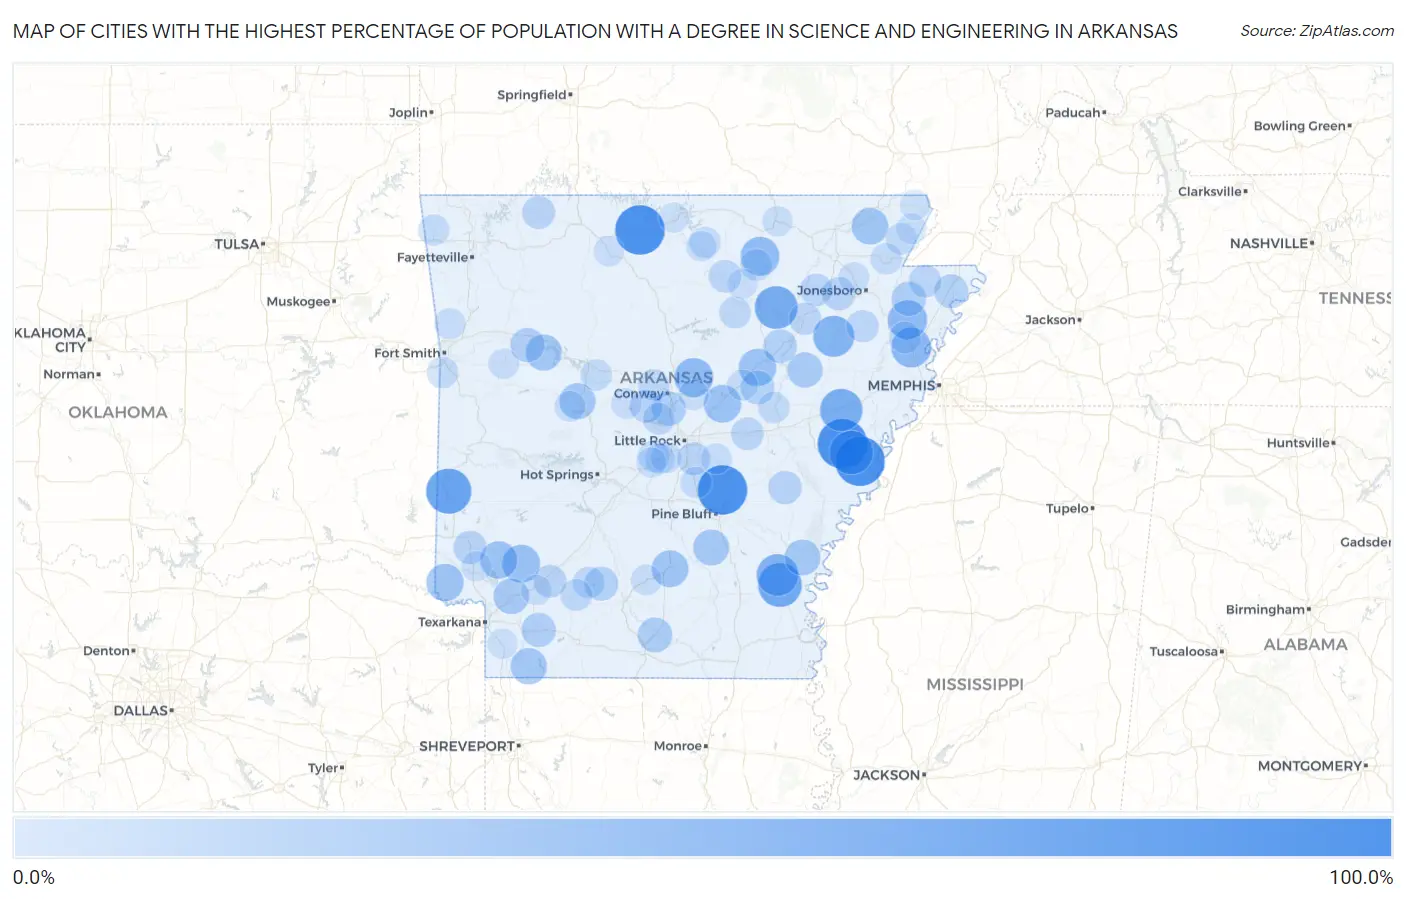
Map of Cities with the Highest Percentage of Population with a Degree in Science and Engineering in Arkansas
0.0%
100.0%
Cities with the Highest Percentage of Population with a Degree in Science and Engineering in Arkansas
| City | % Graduates | vs State | vs National | |
| 1. | Summit | 100.0% | 12.0%(+88.0)#1 | 9.8%(+90.2)#27 |
| 2. | Sherrill | 100.0% | 12.0%(+88.0)#2 | 9.8%(+90.2)#88 |
| 3. | Aubrey | 100.0% | 12.0%(+88.0)#3 | 9.8%(+90.2)#132 |
| 4. | Bee Branch | 100.0% | 12.0%(+88.0)#4 | 9.8%(+90.2)#134 |
| 5. | Lexa | 100.0% | 12.0%(+88.0)#5 | 9.8%(+90.2)#140 |
| 6. | Armorel | 90.1% | 12.0%(+78.2)#6 | 9.8%(+80.3)#218 |
| 7. | Vandervoort | 81.2% | 12.0%(+69.3)#7 | 9.8%(+71.5)#239 |
| 8. | Wilburn | 80.8% | 12.0%(+68.8)#8 | 9.8%(+71.0)#242 |
| 9. | Reed | 75.0% | 12.0%(+63.0)#9 | 9.8%(+65.2)#271 |
| 10. | Rondo | 75.0% | 12.0%(+63.0)#10 | 9.8%(+65.2)#275 |
| 11. | Magness | 71.4% | 12.0%(+59.5)#11 | 9.8%(+61.6)#297 |
| 12. | Palestine | 69.6% | 12.0%(+57.6)#12 | 9.8%(+59.8)#307 |
| 13. | Winchester | 66.7% | 12.0%(+54.7)#13 | 9.8%(+56.9)#340 |
| 14. | Fisher | 63.6% | 12.0%(+51.7)#14 | 9.8%(+53.9)#359 |
| 15. | Gilmore | 58.3% | 12.0%(+46.4)#15 | 9.8%(+48.6)#435 |
| 16. | Lepanto | 56.3% | 12.0%(+44.3)#16 | 9.8%(+46.5)#452 |
| 17. | Enola | 54.5% | 12.0%(+42.6)#17 | 9.8%(+44.8)#485 |
| 18. | Evening Shade | 54.1% | 12.0%(+42.1)#18 | 9.8%(+44.3)#490 |
| 19. | Center Point | 53.3% | 12.0%(+41.4)#19 | 9.8%(+43.6)#504 |
| 20. | Lawson | 50.0% | 12.0%(+38.0)#20 | 9.8%(+40.2)#594 |
| 21. | Ozan | 50.0% | 12.0%(+38.0)#21 | 9.8%(+40.2)#607 |
| 22. | Ward | 49.0% | 12.0%(+37.0)#22 | 9.8%(+39.2)#644 |
| 23. | Judsonia | 48.2% | 12.0%(+36.2)#23 | 9.8%(+38.4)#665 |
| 24. | Mineral Springs | 47.9% | 12.0%(+35.9)#24 | 9.8%(+38.1)#679 |
| 25. | Foreman | 47.6% | 12.0%(+35.7)#25 | 9.8%(+37.8)#684 |
| 26. | Fordyce | 45.7% | 12.0%(+33.8)#26 | 9.8%(+35.9)#726 |
| 27. | Peach Orchard | 44.4% | 12.0%(+32.5)#27 | 9.8%(+34.7)#774 |
| 28. | Bradley | 43.5% | 12.0%(+31.5)#28 | 9.8%(+33.7)#805 |
| 29. | Ola | 42.9% | 12.0%(+30.9)#29 | 9.8%(+33.1)#822 |
| 30. | Morrison Bluff | 42.9% | 12.0%(+30.9)#30 | 9.8%(+33.1)#846 |
| 31. | Jones Mills | 42.1% | 12.0%(+30.1)#31 | 9.8%(+32.3)#868 |
| 32. | Woodlawn | 41.7% | 12.0%(+29.7)#32 | 9.8%(+31.9)#889 |
| 33. | Watson | 41.7% | 12.0%(+29.7)#33 | 9.8%(+31.9)#890 |
| 34. | Fulton | 40.7% | 12.0%(+28.8)#34 | 9.8%(+31.0)#921 |
| 35. | Patterson | 39.1% | 12.0%(+27.2)#35 | 9.8%(+29.3)#1,003 |
| 36. | Collins | 37.5% | 12.0%(+25.5)#36 | 9.8%(+27.7)#1,101 |
| 37. | Calion | 37.2% | 12.0%(+25.2)#37 | 9.8%(+27.4)#1,118 |
| 38. | Caraway | 35.8% | 12.0%(+23.8)#38 | 9.8%(+26.0)#1,185 |
| 39. | Mayflower | 35.6% | 12.0%(+23.7)#39 | 9.8%(+25.8)#1,196 |
| 40. | Lewisville | 35.0% | 12.0%(+23.0)#40 | 9.8%(+25.2)#1,237 |
| 41. | Coal Hill | 35.0% | 12.0%(+23.0)#41 | 9.8%(+25.2)#1,238 |
| 42. | Bradford | 33.3% | 12.0%(+21.4)#42 | 9.8%(+23.6)#1,319 |
| 43. | Chidester | 33.3% | 12.0%(+21.4)#43 | 9.8%(+23.6)#1,326 |
| 44. | Griffithville | 33.3% | 12.0%(+21.4)#44 | 9.8%(+23.6)#1,333 |
| 45. | Burdette | 33.3% | 12.0%(+21.4)#45 | 9.8%(+23.6)#1,361 |
| 46. | Wayton | 32.0% | 12.0%(+20.0)#46 | 9.8%(+22.2)#1,480 |
| 47. | Almyra | 31.2% | 12.0%(+19.3)#47 | 9.8%(+21.5)#1,550 |
| 48. | Lockesburg | 31.0% | 12.0%(+19.1)#48 | 9.8%(+21.3)#1,568 |
| 49. | Genoa | 30.8% | 12.0%(+18.9)#49 | 9.8%(+21.1)#1,586 |
| 50. | Cash | 30.0% | 12.0%(+18.0)#50 | 9.8%(+20.2)#1,673 |
| 51. | Berryville | 29.7% | 12.0%(+17.8)#51 | 9.8%(+20.0)#1,707 |
| 52. | Emmet | 29.4% | 12.0%(+17.4)#52 | 9.8%(+19.6)#1,749 |
| 53. | Wrightsville | 29.2% | 12.0%(+17.2)#53 | 9.8%(+19.4)#1,778 |
| 54. | Bigelow | 28.8% | 12.0%(+16.9)#54 | 9.8%(+19.0)#1,832 |
| 55. | Guion | 28.6% | 12.0%(+16.6)#55 | 9.8%(+18.8)#1,890 |
| 56. | Carlisle | 28.3% | 12.0%(+16.3)#56 | 9.8%(+18.5)#1,935 |
| 57. | Manila | 28.2% | 12.0%(+16.3)#57 | 9.8%(+18.5)#1,936 |
| 58. | Swifton | 28.1% | 12.0%(+16.2)#58 | 9.8%(+18.3)#1,943 |
| 59. | Harrisburg | 27.1% | 12.0%(+15.1)#59 | 9.8%(+17.3)#2,081 |
| 60. | Newport | 26.9% | 12.0%(+15.0)#60 | 9.8%(+17.1)#2,102 |
| 61. | Tyronza | 25.3% | 12.0%(+13.4)#61 | 9.8%(+15.5)#2,347 |
| 62. | Roland | 25.1% | 12.0%(+13.1)#62 | 9.8%(+15.3)#2,375 |
| 63. | Bluff City | 25.0% | 12.0%(+13.0)#63 | 9.8%(+15.2)#2,420 |
| 64. | Menifee | 25.0% | 12.0%(+13.0)#64 | 9.8%(+15.2)#2,431 |
| 65. | Sidney | 25.0% | 12.0%(+13.0)#65 | 9.8%(+15.2)#2,455 |
| 66. | Concord | 25.0% | 12.0%(+13.0)#66 | 9.8%(+15.2)#2,464 |
| 67. | Cale | 25.0% | 12.0%(+13.0)#67 | 9.8%(+15.2)#2,489 |
| 68. | Henderson | 24.4% | 12.0%(+12.4)#68 | 9.8%(+14.6)#2,578 |
| 69. | Pottsville | 23.9% | 12.0%(+11.9)#69 | 9.8%(+14.1)#2,675 |
| 70. | Salem | 23.7% | 12.0%(+11.8)#70 | 9.8%(+14.0)#2,709 |
| 71. | Des Arc | 23.7% | 12.0%(+11.7)#71 | 9.8%(+13.9)#2,716 |
| 72. | Redfield | 23.4% | 12.0%(+11.5)#72 | 9.8%(+13.7)#2,772 |
| 73. | Marmaduke | 23.4% | 12.0%(+11.4)#73 | 9.8%(+13.6)#2,801 |
| 74. | Bonanza | 23.3% | 12.0%(+11.4)#74 | 9.8%(+13.6)#2,804 |
| 75. | Paragould | 23.1% | 12.0%(+11.2)#75 | 9.8%(+13.3)#2,860 |
| 76. | Pineville | 23.1% | 12.0%(+11.1)#76 | 9.8%(+13.3)#2,892 |
| 77. | Aplin | 22.7% | 12.0%(+10.8)#77 | 9.8%(+12.9)#2,974 |
| 78. | Gentry | 22.6% | 12.0%(+10.6)#78 | 9.8%(+12.8)#3,023 |
| 79. | Alexander | 22.0% | 12.0%(+10.1)#79 | 9.8%(+12.2)#3,171 |
| 80. | Keo | 21.5% | 12.0%(+9.58)#80 | 9.8%(+11.8)#3,318 |
| 81. | Cedarville | 21.4% | 12.0%(+9.41)#81 | 9.8%(+11.6)#3,382 |
| 82. | Plainview | 21.1% | 12.0%(+9.09)#82 | 9.8%(+11.3)#3,471 |
| 83. | Garner | 21.1% | 12.0%(+9.09)#83 | 9.8%(+11.3)#3,478 |
| 84. | Bono | 21.0% | 12.0%(+9.05)#84 | 9.8%(+11.2)#3,484 |
| 85. | Bearden | 20.9% | 12.0%(+8.97)#85 | 9.8%(+11.1)#3,506 |
| 86. | Perryville | 20.3% | 12.0%(+8.36)#86 | 9.8%(+10.5)#3,698 |
| 87. | Western Grove | 20.0% | 12.0%(+8.04)#87 | 9.8%(+10.2)#3,818 |
| 88. | Caulksville | 20.0% | 12.0%(+8.04)#88 | 9.8%(+10.2)#3,870 |
| 89. | Hope | 19.6% | 12.0%(+7.59)#89 | 9.8%(+9.77)#4,014 |
| 90. | Calico Rock | 19.5% | 12.0%(+7.56)#90 | 9.8%(+9.75)#4,023 |
| 91. | Hardy | 19.5% | 12.0%(+7.55)#91 | 9.8%(+9.73)#4,031 |
| 92. | Bryant | 19.5% | 12.0%(+7.50)#92 | 9.8%(+9.68)#4,051 |
| 93. | Vilonia | 19.4% | 12.0%(+7.45)#93 | 9.8%(+9.63)#4,066 |
| 94. | Rector | 19.3% | 12.0%(+7.34)#94 | 9.8%(+9.52)#4,109 |
| 95. | Fouke | 18.8% | 12.0%(+6.79)#95 | 9.8%(+8.97)#4,336 |
| 96. | Ben Lomond | 18.8% | 12.0%(+6.79)#96 | 9.8%(+8.97)#4,355 |
| 97. | Pollard | 18.8% | 12.0%(+6.79)#97 | 9.8%(+8.97)#4,359 |
| 98. | Benton | 18.6% | 12.0%(+6.65)#98 | 9.8%(+8.83)#4,410 |
| 99. | Mountain Home | 18.6% | 12.0%(+6.62)#99 | 9.8%(+8.80)#4,424 |
| 100. | Cushman | 18.5% | 12.0%(+6.56)#100 | 9.8%(+8.74)#4,463 |
Common Questions
What are the Top 10 Cities with the Highest Percentage of Population with a Degree in Science and Engineering in Arkansas?
Top 10 Cities with the Highest Percentage of Population with a Degree in Science and Engineering in Arkansas are:
#1
100.0%
#2
100.0%
#3
100.0%
#4
100.0%
#5
81.2%
#6
75.0%
#7
75.0%
#8
71.4%
#9
69.6%
#10
66.7%
What city has the Highest Percentage of Population with a Degree in Science and Engineering in Arkansas?
Summit has the Highest Percentage of Population with a Degree in Science and Engineering in Arkansas with 100.0%.
What is the Percentage of Population with a Degree in Science and Engineering in the State of Arkansas?
Percentage of Population with a Degree in Science and Engineering in Arkansas is 12.0%.
What is the Percentage of Population with a Degree in Science and Engineering in the United States?
Percentage of Population with a Degree in Science and Engineering in the United States is 9.8%.