Cities with the Highest Percentage of Population with a Degree in Science and Engineering in Mississippi
RELATED REPORTS & OPTIONS
Science and Engineering
Mississippi
Compare Cities
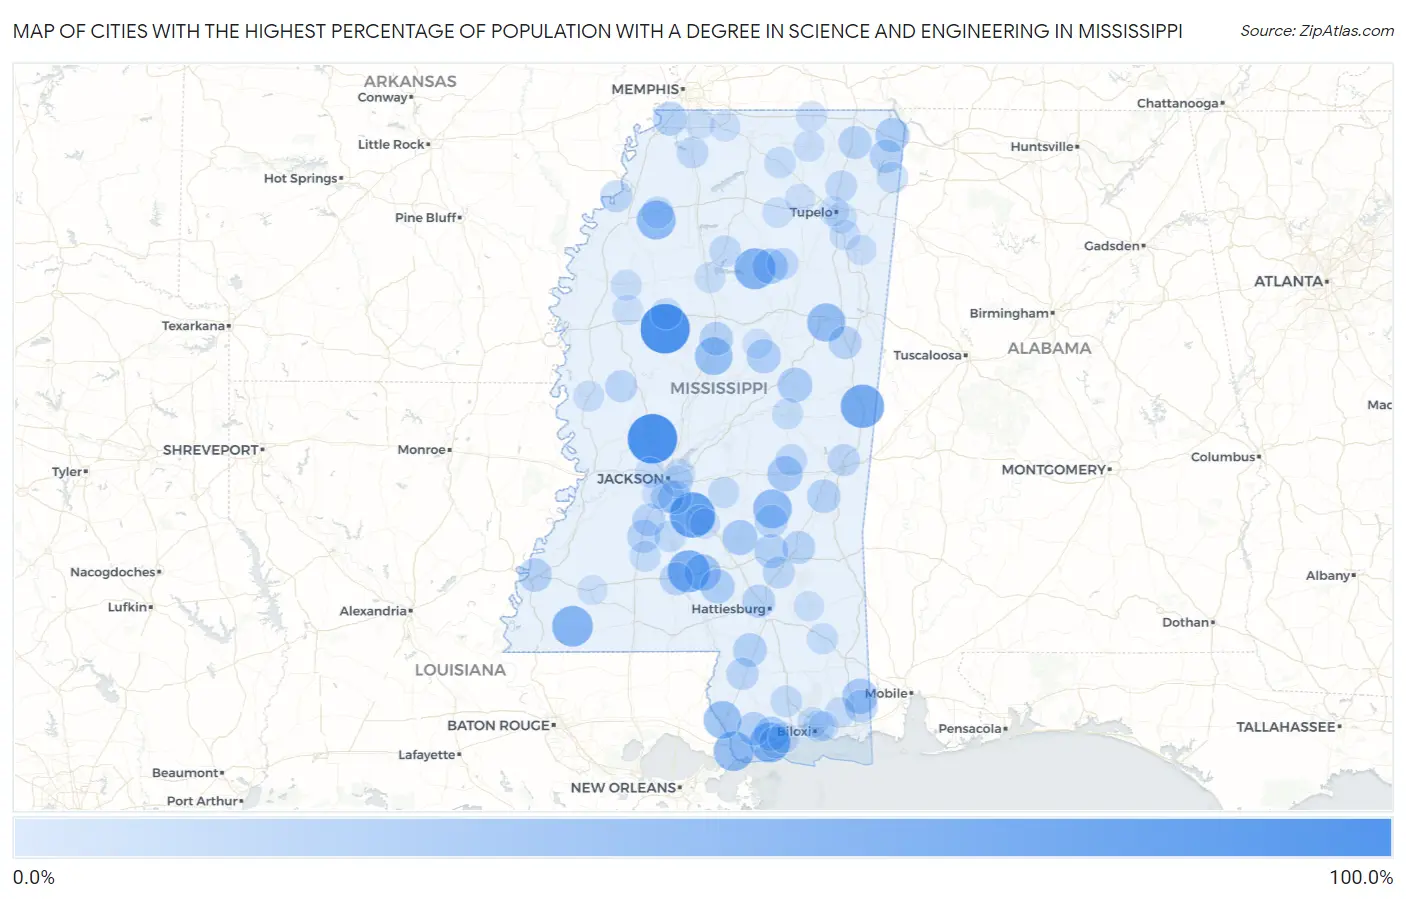
Map of Cities with the Highest Percentage of Population with a Degree in Science and Engineering in Mississippi
0.0%
100.0%
Cities with the Highest Percentage of Population with a Degree in Science and Engineering in Mississippi
| City | % Graduates | vs State | vs National | |
| 1. | Kearney Park | 100.0% | 13.2%(+86.8)#1 | 9.8%(+90.2)#12 |
| 2. | Randolph | 100.0% | 13.2%(+86.8)#2 | 9.8%(+90.2)#25 |
| 3. | Sidon | 100.0% | 13.2%(+86.8)#3 | 9.8%(+90.2)#93 |
| 4. | Panther Burn | 100.0% | 13.2%(+86.8)#4 | 9.8%(+90.2)#157 |
| 5. | Leaf | 100.0% | 13.2%(+86.8)#5 | 9.8%(+90.2)#205 |
| 6. | Glen Allan | 88.9% | 13.2%(+75.7)#6 | 9.8%(+79.1)#222 |
| 7. | Braxton | 81.8% | 13.2%(+68.6)#7 | 9.8%(+72.0)#238 |
| 8. | Scooba | 72.7% | 13.2%(+59.5)#8 | 9.8%(+62.9)#288 |
| 9. | Silver Creek | 66.7% | 13.2%(+53.5)#9 | 9.8%(+56.9)#328 |
| 10. | Big Creek | 62.5% | 13.2%(+49.3)#10 | 9.8%(+52.7)#375 |
| 11. | Gloster | 61.4% | 13.2%(+48.1)#11 | 9.8%(+51.6)#386 |
| 12. | Henderson Point | 58.6% | 13.2%(+45.4)#12 | 9.8%(+48.8)#431 |
| 13. | Pearlington | 56.9% | 13.2%(+43.6)#13 | 9.8%(+47.1)#449 |
| 14. | Lambert | 53.8% | 13.2%(+40.6)#14 | 9.8%(+44.1)#491 |
| 15. | Louin | 52.6% | 13.2%(+39.4)#15 | 9.8%(+42.9)#511 |
| 16. | Mississippi State | 50.8% | 13.2%(+37.5)#16 | 9.8%(+41.0)#537 |
| 17. | West | 48.5% | 13.2%(+35.3)#17 | 9.8%(+38.7)#655 |
| 18. | Nicholson | 48.4% | 13.2%(+35.2)#18 | 9.8%(+38.6)#657 |
| 19. | Prentiss | 42.9% | 13.2%(+29.6)#19 | 9.8%(+33.1)#821 |
| 20. | Hurley | 38.8% | 13.2%(+25.6)#20 | 9.8%(+29.1)#1,027 |
| 21. | Derma | 38.5% | 13.2%(+25.2)#21 | 9.8%(+28.7)#1,040 |
| 22. | Newton | 38.3% | 13.2%(+25.1)#22 | 9.8%(+28.6)#1,056 |
| 23. | Mize | 37.5% | 13.2%(+24.3)#23 | 9.8%(+27.7)#1,096 |
| 24. | Noxapater | 36.4% | 13.2%(+23.1)#24 | 9.8%(+26.6)#1,148 |
| 25. | Arkabutla | 35.1% | 13.2%(+21.9)#25 | 9.8%(+25.4)#1,231 |
| 26. | Bassfield | 34.5% | 13.2%(+21.3)#26 | 9.8%(+24.7)#1,268 |
| 27. | Oak Grove | 34.4% | 13.2%(+21.2)#27 | 9.8%(+24.6)#1,271 |
| 28. | Delisle | 34.3% | 13.2%(+21.1)#28 | 9.8%(+24.5)#1,275 |
| 29. | Iuka | 34.2% | 13.2%(+21.0)#29 | 9.8%(+24.4)#1,285 |
| 30. | Mccool | 33.3% | 13.2%(+20.1)#30 | 9.8%(+23.6)#1,405 |
| 31. | Soso | 32.5% | 13.2%(+19.3)#31 | 9.8%(+22.7)#1,447 |
| 32. | Walls | 32.2% | 13.2%(+19.0)#32 | 9.8%(+22.4)#1,466 |
| 33. | Lumberton | 31.9% | 13.2%(+18.7)#33 | 9.8%(+22.1)#1,485 |
| 34. | Enterprise | 31.1% | 13.2%(+17.9)#34 | 9.8%(+21.3)#1,560 |
| 35. | Vaiden | 31.0% | 13.2%(+17.8)#35 | 9.8%(+21.3)#1,566 |
| 36. | Kiln | 30.2% | 13.2%(+17.0)#36 | 9.8%(+20.5)#1,644 |
| 37. | Florence | 30.2% | 13.2%(+17.0)#37 | 9.8%(+20.4)#1,650 |
| 38. | Morgantown | 30.1% | 13.2%(+16.9)#38 | 9.8%(+20.3)#1,656 |
| 39. | Paden | 30.0% | 13.2%(+16.8)#39 | 9.8%(+20.2)#1,686 |
| 40. | Cleary | 29.7% | 13.2%(+16.5)#40 | 9.8%(+19.9)#1,722 |
| 41. | Hazlehurst | 29.5% | 13.2%(+16.3)#41 | 9.8%(+19.7)#1,740 |
| 42. | Monticello | 29.4% | 13.2%(+16.2)#42 | 9.8%(+19.6)#1,760 |
| 43. | Rawls Springs | 29.3% | 13.2%(+16.1)#43 | 9.8%(+19.5)#1,763 |
| 44. | Rienzi | 29.2% | 13.2%(+16.0)#44 | 9.8%(+19.4)#1,785 |
| 45. | Sandersville | 29.0% | 13.2%(+15.8)#45 | 9.8%(+19.2)#1,812 |
| 46. | Crawford | 28.6% | 13.2%(+15.4)#46 | 9.8%(+18.8)#1,860 |
| 47. | Bay Springs | 28.3% | 13.2%(+15.1)#47 | 9.8%(+18.5)#1,925 |
| 48. | Big Point | 27.6% | 13.2%(+14.4)#48 | 9.8%(+17.8)#2,004 |
| 49. | Crystal Springs | 27.5% | 13.2%(+14.3)#49 | 9.8%(+17.8)#2,010 |
| 50. | Poplarville | 25.9% | 13.2%(+12.7)#50 | 9.8%(+16.2)#2,242 |
| 51. | Marion | 25.2% | 13.2%(+12.0)#51 | 9.8%(+15.4)#2,360 |
| 52. | Friars Point | 25.0% | 13.2%(+11.8)#52 | 9.8%(+15.2)#2,383 |
| 53. | Louise | 25.0% | 13.2%(+11.8)#53 | 9.8%(+15.2)#2,456 |
| 54. | Ellisville | 24.9% | 13.2%(+11.7)#54 | 9.8%(+15.1)#2,502 |
| 55. | Gluckstadt | 24.6% | 13.2%(+11.4)#55 | 9.8%(+14.8)#2,539 |
| 56. | Marks | 24.2% | 13.2%(+11.0)#56 | 9.8%(+14.4)#2,603 |
| 57. | Coldwater | 23.5% | 13.2%(+10.3)#57 | 9.8%(+13.7)#2,770 |
| 58. | Coffeeville | 23.4% | 13.2%(+10.2)#58 | 9.8%(+13.7)#2,774 |
| 59. | Vardaman | 23.4% | 13.2%(+10.2)#59 | 9.8%(+13.6)#2,784 |
| 60. | Decatur | 23.3% | 13.2%(+10.1)#60 | 9.8%(+13.5)#2,818 |
| 61. | Guntown | 23.2% | 13.2%(+9.99)#61 | 9.8%(+13.4)#2,839 |
| 62. | Pass Christian | 23.1% | 13.2%(+9.87)#62 | 9.8%(+13.3)#2,868 |
| 63. | Saucier | 22.9% | 13.2%(+9.72)#63 | 9.8%(+13.2)#2,920 |
| 64. | Bovina | 22.8% | 13.2%(+9.55)#64 | 9.8%(+13.0)#2,956 |
| 65. | St Martin | 22.7% | 13.2%(+9.46)#65 | 9.8%(+12.9)#2,986 |
| 66. | Belmont | 22.5% | 13.2%(+9.30)#66 | 9.8%(+12.7)#3,027 |
| 67. | Polkville | 22.2% | 13.2%(+9.01)#67 | 9.8%(+12.4)#3,090 |
| 68. | Georgetown | 22.2% | 13.2%(+9.01)#68 | 9.8%(+12.4)#3,108 |
| 69. | Greenwood | 21.9% | 13.2%(+8.69)#69 | 9.8%(+12.1)#3,198 |
| 70. | Pearl | 21.7% | 13.2%(+8.47)#70 | 9.8%(+11.9)#3,267 |
| 71. | Hickory Flat | 21.6% | 13.2%(+8.41)#71 | 9.8%(+11.8)#3,285 |
| 72. | Philadelphia | 20.7% | 13.2%(+7.48)#72 | 9.8%(+10.9)#3,575 |
| 73. | Mclain | 20.7% | 13.2%(+7.48)#73 | 9.8%(+10.9)#3,579 |
| 74. | Beauregard | 20.6% | 13.2%(+7.37)#74 | 9.8%(+10.8)#3,621 |
| 75. | Long Beach | 20.5% | 13.2%(+7.32)#75 | 9.8%(+10.8)#3,641 |
| 76. | Plantersville | 20.3% | 13.2%(+7.08)#76 | 9.8%(+10.5)#3,706 |
| 77. | Ripley | 20.1% | 13.2%(+6.84)#77 | 9.8%(+10.3)#3,768 |
| 78. | Rolling Fork | 20.0% | 13.2%(+6.79)#78 | 9.8%(+10.2)#3,778 |
| 79. | Grenada | 19.9% | 13.2%(+6.68)#79 | 9.8%(+10.1)#3,918 |
| 80. | Ruleville | 19.8% | 13.2%(+6.57)#80 | 9.8%(+10.0)#3,949 |
| 81. | Byram | 19.7% | 13.2%(+6.46)#81 | 9.8%(+9.89)#3,978 |
| 82. | D Iberville | 19.4% | 13.2%(+6.14)#82 | 9.8%(+9.58)#4,085 |
| 83. | Vancleave | 18.9% | 13.2%(+5.72)#83 | 9.8%(+9.15)#4,250 |
| 84. | Nettleton | 18.9% | 13.2%(+5.64)#84 | 9.8%(+9.07)#4,289 |
| 85. | Flowood | 18.7% | 13.2%(+5.47)#85 | 9.8%(+8.90)#4,381 |
| 86. | Byhalia | 18.7% | 13.2%(+5.46)#86 | 9.8%(+8.89)#4,387 |
| 87. | Walnut | 18.5% | 13.2%(+5.30)#87 | 9.8%(+8.74)#4,458 |
| 88. | Sunflower | 18.5% | 13.2%(+5.28)#88 | 9.8%(+8.71)#4,480 |
| 89. | Amory | 18.3% | 13.2%(+5.05)#89 | 9.8%(+8.49)#4,569 |
| 90. | D Lo | 18.2% | 13.2%(+4.97)#90 | 9.8%(+8.40)#4,610 |
| 91. | Clinton | 18.2% | 13.2%(+4.95)#91 | 9.8%(+8.38)#4,645 |
| 92. | Toccopola | 17.6% | 13.2%(+4.43)#92 | 9.8%(+7.87)#4,881 |
| 93. | Richton | 17.5% | 13.2%(+4.30)#93 | 9.8%(+7.74)#4,944 |
| 94. | Mendenhall | 17.5% | 13.2%(+4.29)#94 | 9.8%(+7.72)#4,952 |
| 95. | Ecru | 17.4% | 13.2%(+4.18)#95 | 9.8%(+7.61)#4,997 |
| 96. | Tupelo | 17.3% | 13.2%(+4.13)#96 | 9.8%(+7.56)#5,031 |
| 97. | Bridgetown | 17.1% | 13.2%(+3.93)#97 | 9.8%(+7.37)#5,128 |
| 98. | French Camp | 17.1% | 13.2%(+3.89)#98 | 9.8%(+7.32)#5,155 |
| 99. | Bude | 17.0% | 13.2%(+3.81)#99 | 9.8%(+7.24)#5,212 |
| 100. | Gulf Hills | 16.7% | 13.2%(+3.49)#100 | 9.8%(+6.92)#5,355 |
Common Questions
What are the Top 10 Cities with the Highest Percentage of Population with a Degree in Science and Engineering in Mississippi?
Top 10 Cities with the Highest Percentage of Population with a Degree in Science and Engineering in Mississippi are:
#1
100.0%
#2
100.0%
#3
81.8%
#4
72.7%
#5
66.7%
#6
62.5%
#7
61.4%
#8
58.6%
#9
56.9%
#10
53.8%
What city has the Highest Percentage of Population with a Degree in Science and Engineering in Mississippi?
Kearney Park has the Highest Percentage of Population with a Degree in Science and Engineering in Mississippi with 100.0%.
What is the Percentage of Population with a Degree in Science and Engineering in the State of Mississippi?
Percentage of Population with a Degree in Science and Engineering in Mississippi is 13.2%.
What is the Percentage of Population with a Degree in Science and Engineering in the United States?
Percentage of Population with a Degree in Science and Engineering in the United States is 9.8%.