Cities with the Highest Percentage of Population with a Degree in Science and Engineering in Georgia
RELATED REPORTS & OPTIONS
Science and Engineering
Georgia
Compare Cities
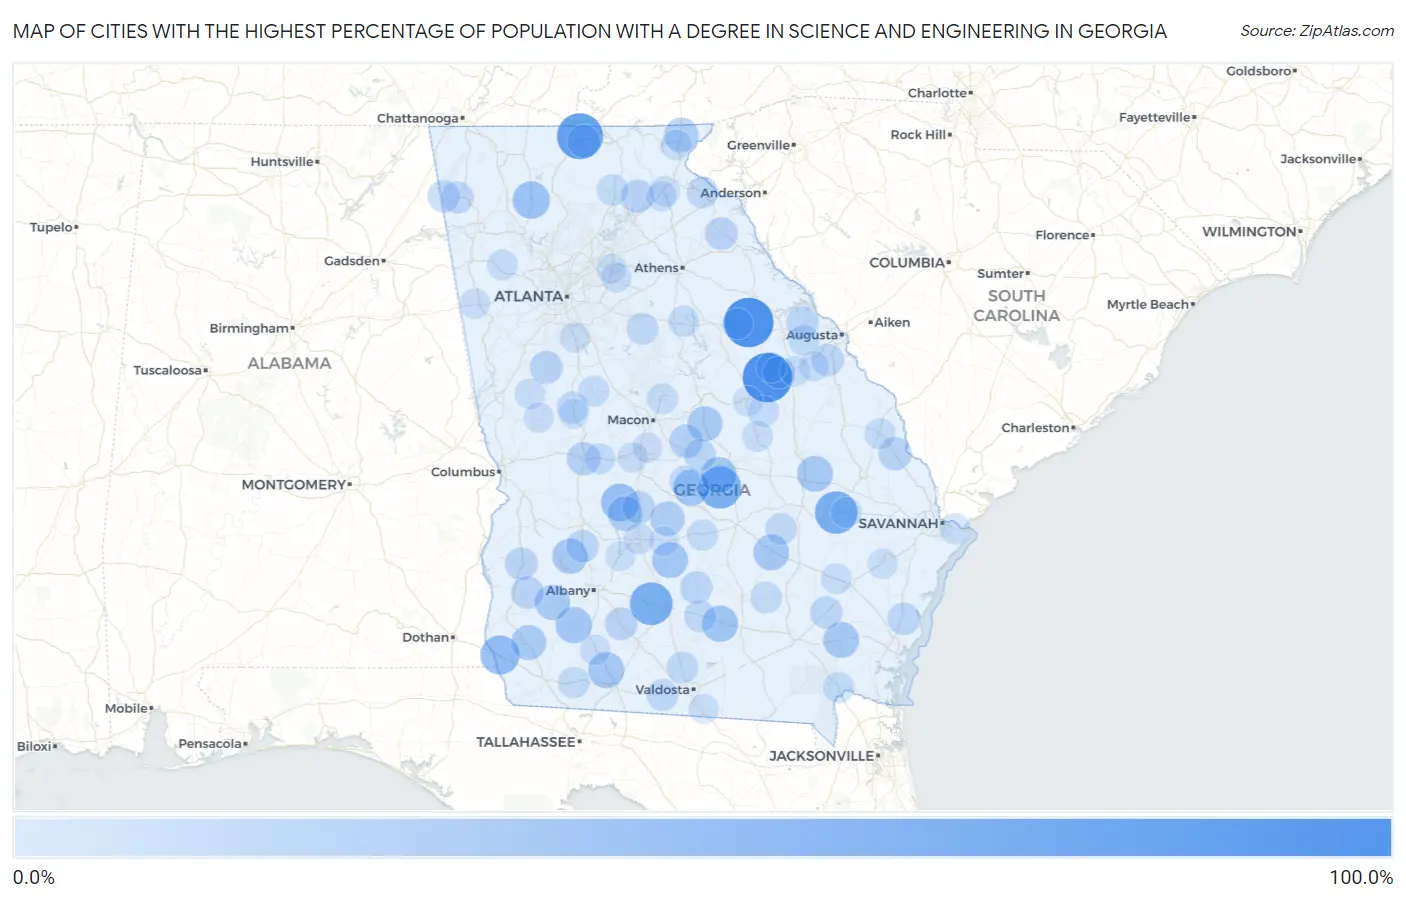
Map of Cities with the Highest Percentage of Population with a Degree in Science and Engineering in Georgia
0.0%
100.0%
Cities with the Highest Percentage of Population with a Degree in Science and Engineering in Georgia
| City | % Graduates | vs State | vs National | |
| 1. | Sharon | 100.0% | 9.5%(+90.5)#1 | 9.8%(+90.2)#174 |
| 2. | Edge Hill | 100.0% | 9.5%(+90.5)#2 | 9.8%(+90.2)#200 |
| 3. | Mineral Bluff | 84.6% | 9.5%(+75.1)#3 | 9.8%(+74.8)#229 |
| 4. | Ty Ty | 70.8% | 9.5%(+61.3)#4 | 9.8%(+61.1)#298 |
| 5. | Manassas | 70.0% | 9.5%(+60.5)#5 | 9.8%(+60.2)#304 |
| 6. | Cadwell | 69.4% | 9.5%(+59.9)#6 | 9.8%(+59.7)#309 |
| 7. | Jakin | 55.6% | 9.5%(+46.1)#7 | 9.8%(+45.8)#468 |
| 8. | Hickox | 51.0% | 9.5%(+41.4)#8 | 9.8%(+41.2)#534 |
| 9. | Dooling | 50.0% | 9.5%(+40.5)#9 | 9.8%(+40.2)#623 |
| 10. | Fairmount | 48.1% | 9.5%(+38.6)#10 | 9.8%(+38.4)#667 |
| 11. | Hortense | 47.1% | 9.5%(+37.6)#11 | 9.8%(+37.3)#698 |
| 12. | Willacoochee | 44.4% | 9.5%(+34.9)#12 | 9.8%(+34.7)#754 |
| 13. | Empire | 43.7% | 9.5%(+34.2)#13 | 9.8%(+33.9)#796 |
| 14. | Newton | 43.6% | 9.5%(+34.1)#14 | 9.8%(+33.9)#798 |
| 15. | Ochlocknee | 42.9% | 9.5%(+33.4)#15 | 9.8%(+33.1)#824 |
| 16. | Rebecca | 42.9% | 9.5%(+33.4)#16 | 9.8%(+33.1)#830 |
| 17. | Nahunta | 42.3% | 9.5%(+32.8)#17 | 9.8%(+32.5)#862 |
| 18. | Dexter | 42.0% | 9.5%(+32.5)#18 | 9.8%(+32.2)#872 |
| 19. | Hazlehurst | 41.9% | 9.5%(+32.3)#19 | 9.8%(+32.1)#878 |
| 20. | Stillmore | 41.7% | 9.5%(+32.2)#20 | 9.8%(+31.9)#881 |
| 21. | Bronwood | 40.0% | 9.5%(+30.5)#21 | 9.8%(+30.2)#952 |
| 22. | Irwinton | 39.0% | 9.5%(+29.5)#22 | 9.8%(+29.2)#1,008 |
| 23. | Leary | 38.7% | 9.5%(+29.2)#23 | 9.8%(+28.9)#1,032 |
| 24. | Colquitt | 38.3% | 9.5%(+28.8)#24 | 9.8%(+28.6)#1,057 |
| 25. | Lilly | 37.5% | 9.5%(+28.0)#25 | 9.8%(+27.7)#1,106 |
| 26. | Mountain City | 36.7% | 9.5%(+27.2)#26 | 9.8%(+26.9)#1,133 |
| 27. | Pineview | 36.6% | 9.5%(+27.1)#27 | 9.8%(+26.8)#1,137 |
| 28. | Waverly | 34.2% | 9.5%(+24.7)#28 | 9.8%(+24.4)#1,281 |
| 29. | Jeffersonville | 33.3% | 9.5%(+23.8)#29 | 9.8%(+23.6)#1,317 |
| 30. | Butler | 32.5% | 9.5%(+23.0)#30 | 9.8%(+22.7)#1,444 |
| 31. | Smarr | 31.8% | 9.5%(+22.3)#31 | 9.8%(+22.0)#1,492 |
| 32. | Newington | 31.5% | 9.5%(+22.0)#32 | 9.8%(+21.7)#1,525 |
| 33. | Haralson | 30.8% | 9.5%(+21.3)#33 | 9.8%(+21.0)#1,599 |
| 34. | Axson | 30.6% | 9.5%(+21.1)#34 | 9.8%(+20.8)#1,615 |
| 35. | Clermont | 30.3% | 9.5%(+20.8)#35 | 9.8%(+20.5)#1,639 |
| 36. | Morganton | 30.0% | 9.5%(+20.5)#36 | 9.8%(+20.2)#1,672 |
| 37. | Doerun | 29.7% | 9.5%(+20.2)#37 | 9.8%(+19.9)#1,711 |
| 38. | Bowman | 29.5% | 9.5%(+20.0)#38 | 9.8%(+19.7)#1,737 |
| 39. | Cuthbert | 29.4% | 9.5%(+19.9)#39 | 9.8%(+19.7)#1,745 |
| 40. | Pinehurst | 29.0% | 9.5%(+19.5)#40 | 9.8%(+19.3)#1,807 |
| 41. | Edison | 28.9% | 9.5%(+19.4)#41 | 9.8%(+19.1)#1,825 |
| 42. | Sterling | 28.8% | 9.5%(+19.3)#42 | 9.8%(+19.0)#1,836 |
| 43. | Smithville | 28.6% | 9.5%(+19.1)#43 | 9.8%(+18.8)#1,866 |
| 44. | Darien | 28.3% | 9.5%(+18.8)#44 | 9.8%(+18.6)#1,920 |
| 45. | Ocilla | 28.1% | 9.5%(+18.6)#45 | 9.8%(+18.3)#1,948 |
| 46. | Offerman | 27.8% | 9.5%(+18.3)#46 | 9.8%(+18.0)#1,980 |
| 47. | Hephzibah | 27.8% | 9.5%(+18.3)#47 | 9.8%(+18.0)#1,989 |
| 48. | Appling | 27.7% | 9.5%(+18.2)#48 | 9.8%(+18.0)#1,990 |
| 49. | Summerville | 27.3% | 9.5%(+17.8)#49 | 9.8%(+17.5)#2,036 |
| 50. | Menlo | 27.1% | 9.5%(+17.6)#50 | 9.8%(+17.3)#2,086 |
| 51. | Avera | 26.3% | 9.5%(+16.8)#51 | 9.8%(+16.5)#2,188 |
| 52. | Allentown | 26.3% | 9.5%(+16.8)#52 | 9.8%(+16.5)#2,191 |
| 53. | Hannahs Mill | 25.9% | 9.5%(+16.4)#53 | 9.8%(+16.1)#2,244 |
| 54. | Alapaha | 25.9% | 9.5%(+16.4)#54 | 9.8%(+16.1)#2,255 |
| 55. | Quitman | 25.8% | 9.5%(+16.3)#55 | 9.8%(+16.1)#2,265 |
| 56. | Uvalda | 25.7% | 9.5%(+16.2)#56 | 9.8%(+15.9)#2,294 |
| 57. | Mansfield | 25.5% | 9.5%(+16.0)#57 | 9.8%(+15.8)#2,313 |
| 58. | Hahira | 25.2% | 9.5%(+15.7)#58 | 9.8%(+15.4)#2,363 |
| 59. | Avalon | 25.0% | 9.5%(+15.5)#59 | 9.8%(+15.2)#2,419 |
| 60. | Whigham | 24.7% | 9.5%(+15.2)#60 | 9.8%(+15.0)#2,526 |
| 61. | Dahlonega | 24.6% | 9.5%(+15.1)#61 | 9.8%(+14.9)#2,537 |
| 62. | Nicholls | 24.5% | 9.5%(+15.0)#62 | 9.8%(+14.7)#2,557 |
| 63. | Cochran | 23.8% | 9.5%(+14.3)#63 | 9.8%(+14.0)#2,699 |
| 64. | Rhine | 23.5% | 9.5%(+14.0)#64 | 9.8%(+13.7)#2,749 |
| 65. | Sylvania | 23.3% | 9.5%(+13.8)#65 | 9.8%(+13.5)#2,819 |
| 66. | Folkston | 23.2% | 9.5%(+13.7)#66 | 9.8%(+13.4)#2,848 |
| 67. | Buckhead | 23.1% | 9.5%(+13.6)#67 | 9.8%(+13.3)#2,891 |
| 68. | Barnesville | 22.6% | 9.5%(+13.1)#68 | 9.8%(+12.8)#3,006 |
| 69. | Harlem | 22.5% | 9.5%(+13.0)#69 | 9.8%(+12.7)#3,038 |
| 70. | Riddleville | 22.2% | 9.5%(+12.7)#70 | 9.8%(+12.4)#3,131 |
| 71. | Reynolds | 22.1% | 9.5%(+12.6)#71 | 9.8%(+12.3)#3,151 |
| 72. | Wrightsville | 22.0% | 9.5%(+12.5)#72 | 9.8%(+12.2)#3,174 |
| 73. | Odum | 21.9% | 9.5%(+12.4)#73 | 9.8%(+12.1)#3,210 |
| 74. | Cordele | 21.6% | 9.5%(+12.1)#74 | 9.8%(+11.8)#3,294 |
| 75. | Hagan | 21.6% | 9.5%(+12.0)#75 | 9.8%(+11.8)#3,310 |
| 76. | Crawfordville | 21.5% | 9.5%(+12.0)#76 | 9.8%(+11.8)#3,315 |
| 77. | Greenville | 21.3% | 9.5%(+11.8)#77 | 9.8%(+11.6)#3,386 |
| 78. | Gray | 21.3% | 9.5%(+11.8)#78 | 9.8%(+11.5)#3,416 |
| 79. | Braswell | 21.1% | 9.5%(+11.5)#79 | 9.8%(+11.3)#3,472 |
| 80. | Talahi Island | 20.9% | 9.5%(+11.4)#80 | 9.8%(+11.1)#3,503 |
| 81. | Tiger | 20.9% | 9.5%(+11.4)#81 | 9.8%(+11.1)#3,518 |
| 82. | Fort Valley | 20.3% | 9.5%(+10.8)#82 | 9.8%(+10.6)#3,691 |
| 83. | Pelham | 20.2% | 9.5%(+10.7)#83 | 9.8%(+10.4)#3,731 |
| 84. | Manchester | 20.2% | 9.5%(+10.7)#84 | 9.8%(+10.4)#3,743 |
| 85. | Cornelia | 20.1% | 9.5%(+10.6)#85 | 9.8%(+10.4)#3,751 |
| 86. | Waco | 20.0% | 9.5%(+10.5)#86 | 9.8%(+10.2)#3,795 |
| 87. | Grayson | 19.9% | 9.5%(+10.4)#87 | 9.8%(+10.2)#3,911 |
| 88. | Baldwin | 19.8% | 9.5%(+10.3)#88 | 9.8%(+10.0)#3,939 |
| 89. | Walthourville | 19.6% | 9.5%(+10.1)#89 | 9.8%(+9.81)#3,998 |
| 90. | Centerville | 19.6% | 9.5%(+10.1)#90 | 9.8%(+9.80)#4,000 |
| 91. | Wrens | 19.6% | 9.5%(+10.1)#91 | 9.8%(+9.78)#4,003 |
| 92. | Lovejoy | 19.5% | 9.5%(+10.0)#92 | 9.8%(+9.75)#4,020 |
| 93. | Keysville | 19.4% | 9.5%(+9.85)#93 | 9.8%(+9.57)#4,093 |
| 94. | Sandersville | 19.3% | 9.5%(+9.75)#94 | 9.8%(+9.47)#4,121 |
| 95. | Lake Park | 19.0% | 9.5%(+9.54)#95 | 9.8%(+9.27)#4,198 |
| 96. | Gibson | 18.9% | 9.5%(+9.36)#96 | 9.8%(+9.09)#4,282 |
| 97. | Warwick | 18.8% | 9.5%(+9.25)#97 | 9.8%(+8.97)#4,338 |
| 98. | Pitts | 18.8% | 9.5%(+9.25)#98 | 9.8%(+8.97)#4,343 |
| 99. | Thomaston | 18.7% | 9.5%(+9.18)#99 | 9.8%(+8.91)#4,379 |
| 100. | Lawrenceville | 18.7% | 9.5%(+9.16)#100 | 9.8%(+8.89)#4,389 |
Common Questions
What are the Top 10 Cities with the Highest Percentage of Population with a Degree in Science and Engineering in Georgia?
Top 10 Cities with the Highest Percentage of Population with a Degree in Science and Engineering in Georgia are:
#1
100.0%
#2
100.0%
#3
84.6%
#4
70.8%
#5
70.0%
#6
69.4%
#7
55.6%
#8
50.0%
#9
48.1%
#10
44.4%
What city has the Highest Percentage of Population with a Degree in Science and Engineering in Georgia?
Sharon has the Highest Percentage of Population with a Degree in Science and Engineering in Georgia with 100.0%.
What is the Percentage of Population with a Degree in Science and Engineering in the State of Georgia?
Percentage of Population with a Degree in Science and Engineering in Georgia is 9.5%.
What is the Percentage of Population with a Degree in Science and Engineering in the United States?
Percentage of Population with a Degree in Science and Engineering in the United States is 9.8%.