Cities with the Highest Percentage of Population with a Degree in Science and Engineering in New Hampshire
RELATED REPORTS & OPTIONS
Science and Engineering
New Hampshire
Compare Cities
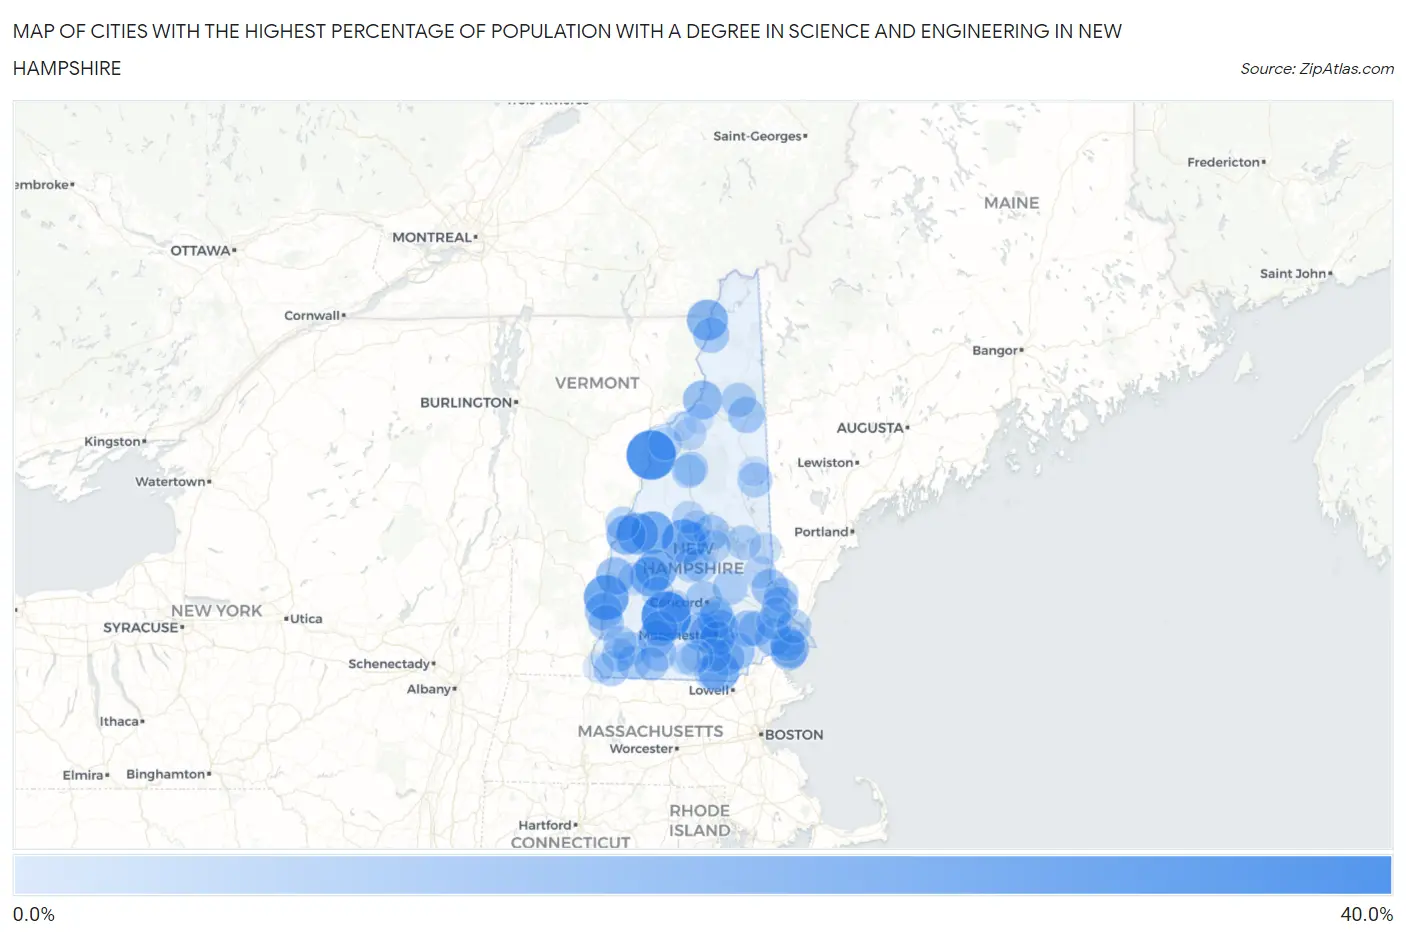
Map of Cities with the Highest Percentage of Population with a Degree in Science and Engineering in New Hampshire
0.0%
40.0%
Cities with the Highest Percentage of Population with a Degree in Science and Engineering in New Hampshire
| City | % Graduates | vs State | vs National | |
| 1. | Woodsville | 31.5% | 9.5%(+22.0)#1 | 9.8%(+21.7)#1,522 |
| 2. | Hillsborough | 31.4% | 9.5%(+21.9)#2 | 9.8%(+21.6)#1,537 |
| 3. | Charlestown | 23.7% | 9.5%(+14.3)#3 | 9.8%(+14.0)#2,705 |
| 4. | Bristol | 21.8% | 9.5%(+12.3)#4 | 9.8%(+12.0)#3,232 |
| 5. | Canaan | 20.0% | 9.5%(+10.5)#5 | 9.8%(+10.2)#3,856 |
| 6. | Enfield | 18.4% | 9.5%(+8.90)#6 | 9.8%(+8.61)#4,519 |
| 7. | New London | 18.1% | 9.5%(+8.63)#7 | 9.8%(+8.34)#4,656 |
| 8. | West Stewartstown | 17.6% | 9.5%(+8.16)#8 | 9.8%(+7.87)#4,874 |
| 9. | Hudson | 17.4% | 9.5%(+7.91)#9 | 9.8%(+7.62)#4,992 |
| 10. | Blodgett Landing | 15.7% | 9.5%(+6.22)#10 | 9.8%(+5.93)#6,058 |
| 11. | Lebanon | 14.8% | 9.5%(+5.30)#11 | 9.8%(+5.01)#6,773 |
| 12. | Lancaster | 14.3% | 9.5%(+4.84)#12 | 9.8%(+4.55)#7,111 |
| 13. | Pinardville | 13.8% | 9.5%(+4.32)#13 | 9.8%(+4.03)#7,615 |
| 14. | Klondike Corner | 13.1% | 9.5%(+3.60)#14 | 9.8%(+3.31)#8,342 |
| 15. | South Hooksett | 13.0% | 9.5%(+3.49)#15 | 9.8%(+3.20)#8,492 |
| 16. | Hampton Beach | 12.8% | 9.5%(+3.30)#16 | 9.8%(+3.01)#8,706 |
| 17. | Claremont | 12.7% | 9.5%(+3.24)#17 | 9.8%(+2.95)#8,770 |
| 18. | Hooksett | 12.2% | 9.5%(+2.73)#18 | 9.8%(+2.44)#9,366 |
| 19. | North Walpole | 11.9% | 9.5%(+2.45)#19 | 9.8%(+2.16)#9,740 |
| 20. | Goffstown | 11.9% | 9.5%(+2.41)#20 | 9.8%(+2.12)#9,798 |
| 21. | Derry | 11.5% | 9.5%(+1.97)#21 | 9.8%(+1.68)#10,384 |
| 22. | Hancock | 11.3% | 9.5%(+1.79)#22 | 9.8%(+1.50)#10,653 |
| 23. | Rochester | 11.2% | 9.5%(+1.75)#23 | 9.8%(+1.46)#10,707 |
| 24. | Exeter | 11.1% | 9.5%(+1.64)#24 | 9.8%(+1.35)#10,850 |
| 25. | Londonderry | 10.6% | 9.5%(+1.14)#25 | 9.8%(+0.854)#11,666 |
| 26. | Dover | 10.1% | 9.5%(+0.646)#26 | 9.8%(+0.356)#12,468 |
| 27. | Raymond | 10.0% | 9.5%(+0.492)#27 | 9.8%(+0.202)#12,751 |
| 28. | Gorham | 9.7% | 9.5%(+0.255)#28 | 9.8%(-0.035)#13,087 |
| 29. | Francestown | 9.7% | 9.5%(+0.231)#29 | 9.8%(-0.059)#13,123 |
| 30. | Concord | 9.4% | 9.5%(-0.079)#30 | 9.8%(-0.369)#13,634 |
| 31. | Seabrook Beach | 9.4% | 9.5%(-0.135)#31 | 9.8%(-0.425)#13,734 |
| 32. | Antrim | 9.1% | 9.5%(-0.401)#32 | 9.8%(-0.691)#14,142 |
| 33. | Meredith | 9.0% | 9.5%(-0.517)#33 | 9.8%(-0.807)#14,381 |
| 34. | Colebrook | 9.0% | 9.5%(-0.536)#34 | 9.8%(-0.826)#14,421 |
| 35. | Epping | 8.8% | 9.5%(-0.648)#35 | 9.8%(-0.938)#14,600 |
| 36. | Walpole | 8.7% | 9.5%(-0.776)#36 | 9.8%(-1.07)#14,792 |
| 37. | Peterborough | 8.5% | 9.5%(-1.03)#37 | 9.8%(-1.32)#15,201 |
| 38. | Hampton | 8.4% | 9.5%(-1.14)#38 | 9.8%(-1.43)#15,352 |
| 39. | Manchester | 7.8% | 9.5%(-1.68)#39 | 9.8%(-1.97)#16,244 |
| 40. | Winchester | 7.8% | 9.5%(-1.70)#40 | 9.8%(-1.99)#16,269 |
| 41. | Pittsfield | 7.8% | 9.5%(-1.71)#41 | 9.8%(-2.00)#16,283 |
| 42. | Franklin | 7.8% | 9.5%(-1.72)#42 | 9.8%(-2.01)#16,291 |
| 43. | Conway | 7.7% | 9.5%(-1.81)#43 | 9.8%(-2.10)#16,484 |
| 44. | Newmarket | 7.6% | 9.5%(-1.91)#44 | 9.8%(-2.20)#16,620 |
| 45. | Wolfeboro | 7.5% | 9.5%(-1.94)#45 | 9.8%(-2.23)#16,665 |
| 46. | Berlin | 7.2% | 9.5%(-2.31)#46 | 9.8%(-2.60)#17,228 |
| 47. | Somersworth | 7.1% | 9.5%(-2.43)#47 | 9.8%(-2.72)#17,440 |
| 48. | Nashua | 7.0% | 9.5%(-2.46)#48 | 9.8%(-2.75)#17,490 |
| 49. | Portsmouth | 6.9% | 9.5%(-2.58)#49 | 9.8%(-2.87)#17,679 |
| 50. | Marlborough | 6.9% | 9.5%(-2.58)#50 | 9.8%(-2.87)#17,689 |
| 51. | Troy | 6.9% | 9.5%(-2.63)#51 | 9.8%(-2.92)#17,749 |
| 52. | Hanover | 6.6% | 9.5%(-2.90)#52 | 9.8%(-3.19)#18,134 |
| 53. | East Merrimack | 6.4% | 9.5%(-3.05)#53 | 9.8%(-3.34)#18,366 |
| 54. | Jaffrey | 6.4% | 9.5%(-3.10)#54 | 9.8%(-3.39)#18,433 |
| 55. | Lincoln | 6.4% | 9.5%(-3.12)#55 | 9.8%(-3.41)#18,469 |
| 56. | New Hampton | 6.2% | 9.5%(-3.27)#56 | 9.8%(-3.56)#18,698 |
| 57. | Tilton Northfield | 6.2% | 9.5%(-3.29)#57 | 9.8%(-3.58)#18,714 |
| 58. | New Boston | 6.2% | 9.5%(-3.29)#58 | 9.8%(-3.58)#18,720 |
| 59. | West Swanzey | 6.2% | 9.5%(-3.29)#59 | 9.8%(-3.58)#18,723 |
| 60. | North Woodstock | 6.1% | 9.5%(-3.35)#60 | 9.8%(-3.64)#18,803 |
| 61. | Laconia | 5.9% | 9.5%(-3.55)#61 | 9.8%(-3.84)#19,065 |
| 62. | Keene | 5.6% | 9.5%(-3.89)#62 | 9.8%(-4.18)#19,523 |
| 63. | Lisbon | 5.5% | 9.5%(-4.01)#63 | 9.8%(-4.30)#19,669 |
| 64. | Plymouth | 5.2% | 9.5%(-4.33)#64 | 9.8%(-4.62)#20,035 |
| 65. | Henniker | 4.5% | 9.5%(-5.04)#65 | 9.8%(-5.33)#20,773 |
| 66. | Farmington | 4.3% | 9.5%(-5.17)#66 | 9.8%(-5.46)#20,895 |
| 67. | Bethlehem | 4.2% | 9.5%(-5.33)#67 | 9.8%(-5.62)#21,053 |
| 68. | Suncook | 4.1% | 9.5%(-5.40)#68 | 9.8%(-5.69)#21,102 |
| 69. | Newport | 4.0% | 9.5%(-5.48)#69 | 9.8%(-5.77)#21,170 |
| 70. | Amherst | 3.6% | 9.5%(-5.86)#70 | 9.8%(-6.15)#21,510 |
| 71. | Sanbornville | 3.5% | 9.5%(-5.97)#71 | 9.8%(-6.26)#21,598 |
| 72. | Milford | 3.3% | 9.5%(-6.16)#72 | 9.8%(-6.45)#21,766 |
| 73. | Bradford | 3.2% | 9.5%(-6.27)#73 | 9.8%(-6.56)#21,838 |
| 74. | Ashland | 3.0% | 9.5%(-6.54)#74 | 9.8%(-6.83)#22,007 |
| 75. | Wilton | 2.6% | 9.5%(-6.91)#75 | 9.8%(-7.20)#22,270 |
| 76. | Hinsdale | 2.0% | 9.5%(-7.50)#76 | 9.8%(-7.79)#22,599 |
| 77. | Durham | 1.7% | 9.5%(-7.80)#77 | 9.8%(-8.09)#22,739 |
| 78. | Littleton | 1.4% | 9.5%(-8.06)#78 | 9.8%(-8.35)#22,828 |
| 79. | North Conway | 0.89% | 9.5%(-8.60)#79 | 9.8%(-8.89)#22,948 |
| 80. | Whitefield | 0.32% | 9.5%(-9.17)#80 | 9.8%(-9.46)#22,999 |
1
Common Questions
What are the Top 10 Cities with the Highest Percentage of Population with a Degree in Science and Engineering in New Hampshire?
Top 10 Cities with the Highest Percentage of Population with a Degree in Science and Engineering in New Hampshire are:
#1
31.5%
#2
31.4%
#3
23.7%
#4
21.8%
#5
20.0%
#6
18.4%
#7
18.1%
#8
17.6%
#9
17.4%
#10
15.7%
What city has the Highest Percentage of Population with a Degree in Science and Engineering in New Hampshire?
Woodsville has the Highest Percentage of Population with a Degree in Science and Engineering in New Hampshire with 31.5%.
What is the Percentage of Population with a Degree in Science and Engineering in the State of New Hampshire?
Percentage of Population with a Degree in Science and Engineering in New Hampshire is 9.5%.
What is the Percentage of Population with a Degree in Science and Engineering in the United States?
Percentage of Population with a Degree in Science and Engineering in the United States is 9.8%.