Zip Codes with the Highest Percentage of Population with a Degree in Science and Engineering in Danville, CA
RELATED REPORTS & OPTIONS
Science and Engineering
Danville
Compare Zip Codes
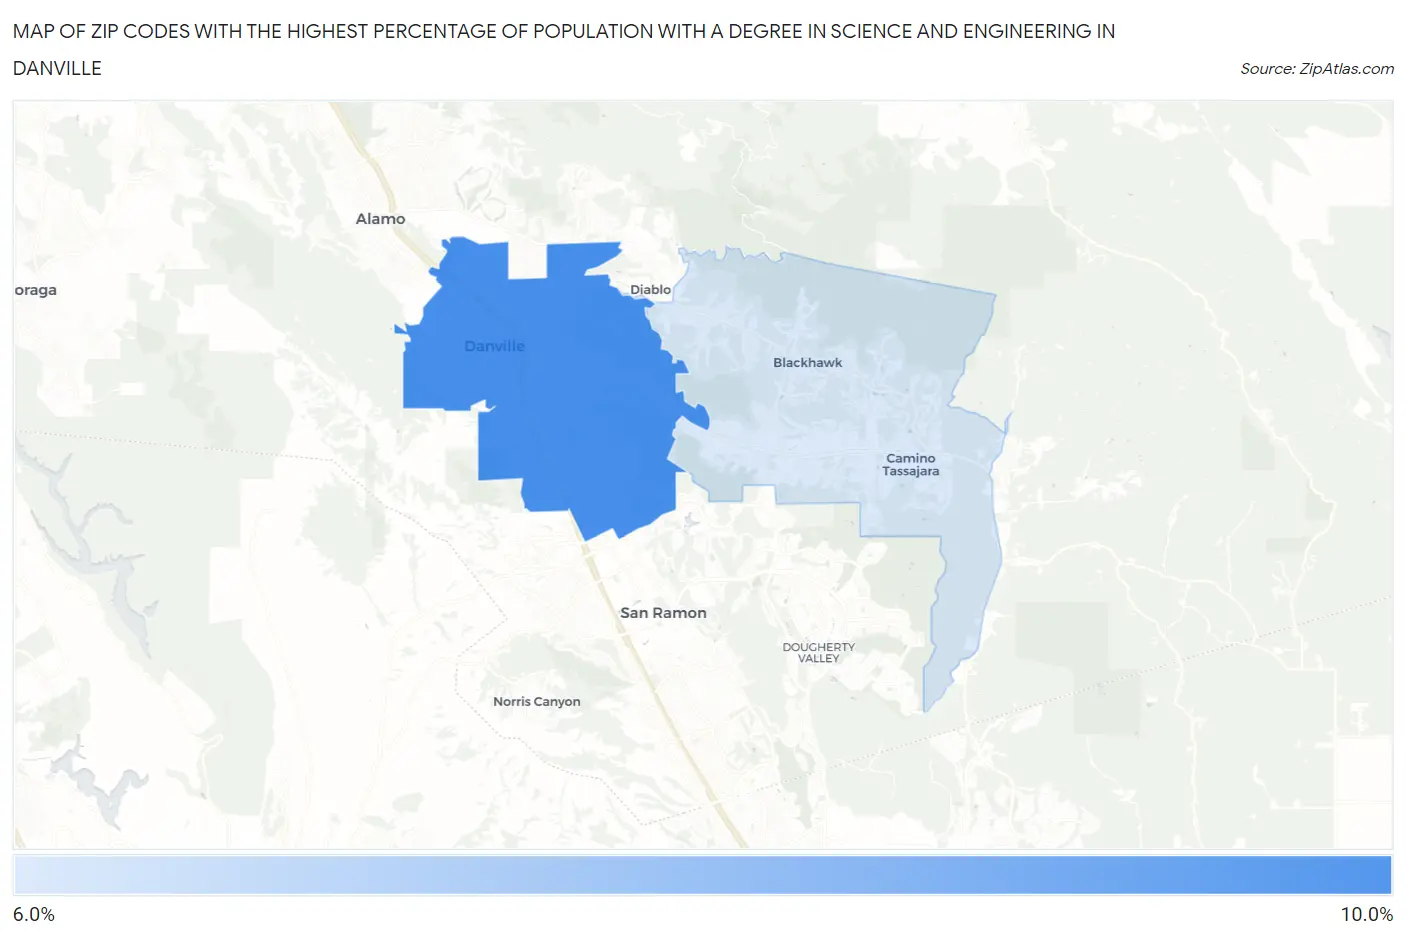
Map of Zip Codes with the Highest Percentage of Population with a Degree in Science and Engineering in Danville
6.2%
8.6%
Zip Codes with the Highest Percentage of Population with a Degree in Science and Engineering in Danville, CA
| Zip Code | % Graduates | vs State | vs National | |
| 1. | 94526 | 8.6% | 8.3%(+0.314)#684 | 9.8%(-1.21)#18,297 |
| 2. | 94506 | 6.2% | 8.3%(-2.06)#1,128 | 9.8%(-3.58)#23,113 |
1
Common Questions
What are the Top Zip Codes with the Highest Percentage of Population with a Degree in Science and Engineering in Danville, CA?
Top Zip Codes with the Highest Percentage of Population with a Degree in Science and Engineering in Danville, CA are:
What zip code has the Highest Percentage of Population with a Degree in Science and Engineering in Danville, CA?
94526 has the Highest Percentage of Population with a Degree in Science and Engineering in Danville, CA with 8.6%.
What is the Percentage of Population with a Degree in Science and Engineering in Danville, CA?
Percentage of Population with a Degree in Science and Engineering in Danville is 8.2%.
What is the Percentage of Population with a Degree in Science and Engineering in California?
Percentage of Population with a Degree in Science and Engineering in California is 8.3%.
What is the Percentage of Population with a Degree in Science and Engineering in the United States?
Percentage of Population with a Degree in Science and Engineering in the United States is 9.8%.