Cities with the Highest Percentage of Population with a Degree in Science and Engineering in Nevada
RELATED REPORTS & OPTIONS
Science and Engineering
Nevada
Compare Cities
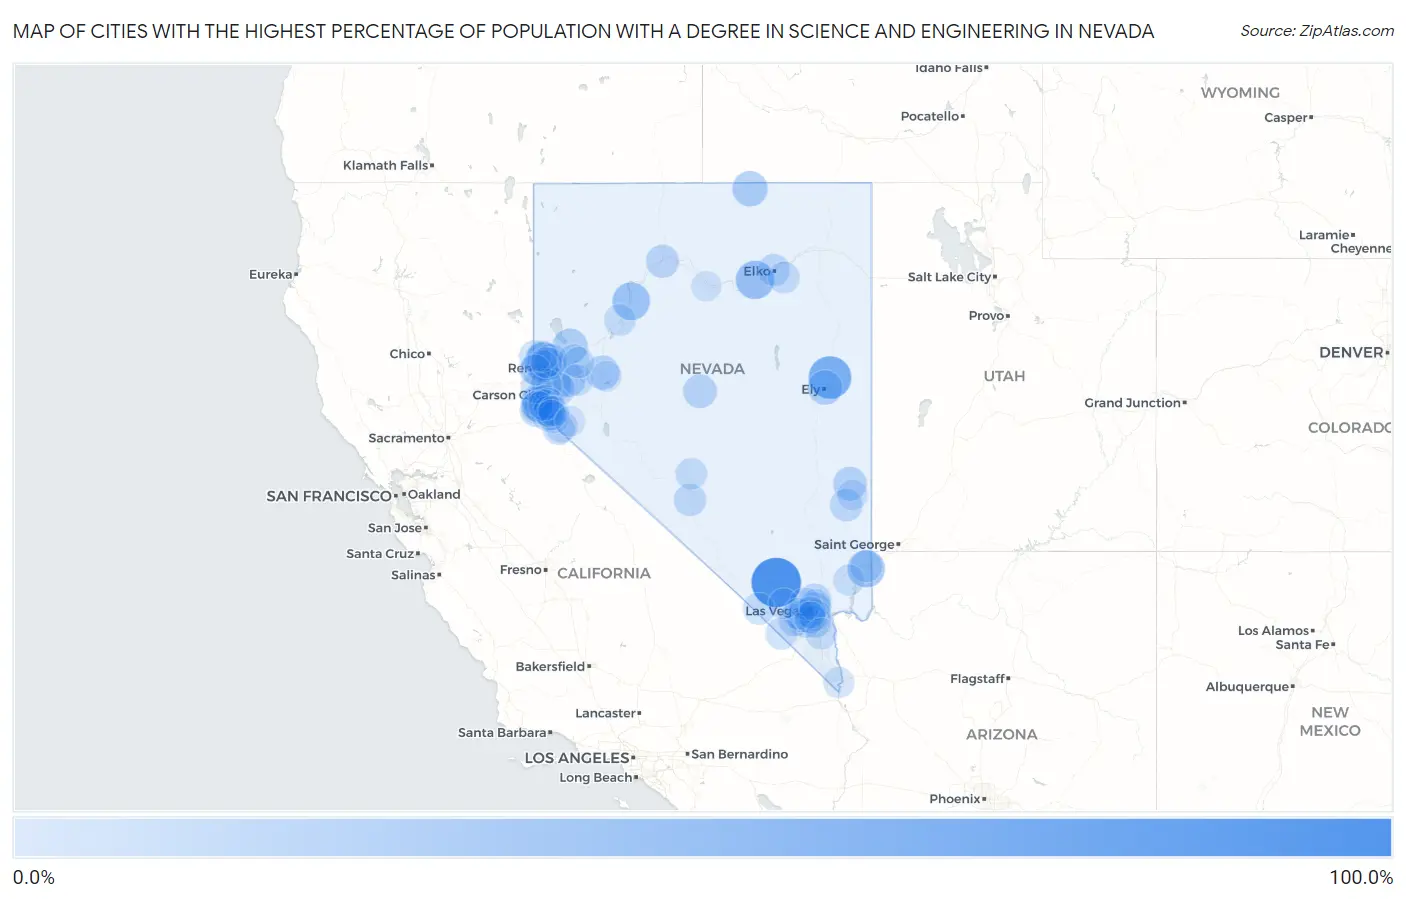
Map of Cities with the Highest Percentage of Population with a Degree in Science and Engineering in Nevada
0.0%
100.0%
Cities with the Highest Percentage of Population with a Degree in Science and Engineering in Nevada
| City | % Graduates | vs State | vs National | |
| 1. | Indian Springs | 100.0% | 10.1%(+89.9)#1 | 9.8%(+90.2)#13 |
| 2. | Mcgill | 63.2% | 10.1%(+53.1)#2 | 9.8%(+53.4)#363 |
| 3. | Carlin | 41.4% | 10.1%(+31.3)#3 | 9.8%(+31.6)#899 |
| 4. | Golden Valley | 38.9% | 10.1%(+28.8)#4 | 9.8%(+29.1)#1,025 |
| 5. | Humboldt River Ranch | 36.7% | 10.1%(+26.6)#5 | 9.8%(+27.0)#1,132 |
| 6. | Bunkerville | 36.2% | 10.1%(+26.1)#6 | 9.8%(+26.4)#1,162 |
| 7. | Owyhee | 25.8% | 10.1%(+15.7)#7 | 9.8%(+16.0)#2,281 |
| 8. | Nixon | 25.0% | 10.1%(+14.9)#8 | 9.8%(+15.2)#2,412 |
| 9. | Virginia City | 23.4% | 10.1%(+13.3)#9 | 9.8%(+13.6)#2,790 |
| 10. | Ely | 22.1% | 10.1%(+12.0)#10 | 9.8%(+12.3)#3,155 |
| 11. | Fallon | 19.7% | 10.1%(+9.60)#11 | 9.8%(+9.91)#3,974 |
| 12. | Pioche | 18.6% | 10.1%(+8.48)#12 | 9.8%(+8.79)#4,430 |
| 13. | Kingston | 17.4% | 10.1%(+7.30)#13 | 9.8%(+7.61)#5,018 |
| 14. | Mogul | 16.3% | 10.1%(+6.26)#14 | 9.8%(+6.57)#5,637 |
| 15. | Stagecoach | 16.2% | 10.1%(+6.08)#15 | 9.8%(+6.39)#5,745 |
| 16. | Stateline | 15.7% | 10.1%(+5.60)#16 | 9.8%(+5.90)#6,072 |
| 17. | Lakeridge | 15.4% | 10.1%(+5.30)#17 | 9.8%(+5.60)#6,298 |
| 18. | Winnemucca | 14.6% | 10.1%(+4.48)#18 | 9.8%(+4.79)#6,932 |
| 19. | Round Hill Village | 13.9% | 10.1%(+3.82)#19 | 9.8%(+4.13)#7,526 |
| 20. | Enterprise | 13.1% | 10.1%(+3.00)#20 | 9.8%(+3.31)#8,344 |
| 21. | Caliente | 12.4% | 10.1%(+2.32)#21 | 9.8%(+2.63)#9,152 |
| 22. | North Las Vegas | 12.3% | 10.1%(+2.25)#22 | 9.8%(+2.56)#9,222 |
| 23. | Blue Diamond | 11.8% | 10.1%(+1.72)#23 | 9.8%(+2.02)#9,920 |
| 24. | Dayton | 11.7% | 10.1%(+1.65)#24 | 9.8%(+1.95)#10,012 |
| 25. | Goldfield | 11.1% | 10.1%(+1.02)#25 | 9.8%(+1.33)#10,954 |
| 26. | Sunrise Manor | 11.1% | 10.1%(+1.00)#26 | 9.8%(+1.31)#10,992 |
| 27. | Indian Hills | 11.0% | 10.1%(+0.917)#27 | 9.8%(+1.22)#11,098 |
| 28. | Gardnerville Ranchos | 10.9% | 10.1%(+0.816)#28 | 9.8%(+1.12)#11,228 |
| 29. | Spanish Springs | 10.8% | 10.1%(+0.708)#29 | 9.8%(+1.02)#11,391 |
| 30. | Sparks | 10.6% | 10.1%(+0.492)#30 | 9.8%(+0.800)#11,743 |
| 31. | Elko | 10.4% | 10.1%(+0.355)#31 | 9.8%(+0.663)#11,943 |
| 32. | Henderson | 10.4% | 10.1%(+0.315)#32 | 9.8%(+0.623)#12,021 |
| 33. | Spring Valley | 10.2% | 10.1%(+0.085)#33 | 9.8%(+0.393)#12,414 |
| 34. | Reno | 10.0% | 10.1%(-0.048)#34 | 9.8%(+0.260)#12,595 |
| 35. | Topaz Ranch Estates | 10.0% | 10.1%(-0.089)#35 | 9.8%(+0.219)#12,657 |
| 36. | Whitney | 9.8% | 10.1%(-0.301)#36 | 9.8%(+0.007)#13,032 |
| 37. | Las Vegas | 9.4% | 10.1%(-0.659)#37 | 9.8%(-0.351)#13,607 |
| 38. | Washoe Valley | 9.2% | 10.1%(-0.902)#38 | 9.8%(-0.594)#13,998 |
| 39. | Cold Springs | 9.1% | 10.1%(-1.01)#39 | 9.8%(-0.704)#14,244 |
| 40. | East Valley | 8.9% | 10.1%(-1.15)#40 | 9.8%(-0.841)#14,450 |
| 41. | Topaz Lake | 8.7% | 10.1%(-1.39)#41 | 9.8%(-1.09)#14,857 |
| 42. | Summerlin South | 8.6% | 10.1%(-1.45)#42 | 9.8%(-1.14)#14,926 |
| 43. | Lovelock | 8.5% | 10.1%(-1.58)#43 | 9.8%(-1.27)#15,116 |
| 44. | Carson | 8.5% | 10.1%(-1.58)#44 | 9.8%(-1.28)#15,130 |
| 45. | Spring Creek | 8.4% | 10.1%(-1.65)#45 | 9.8%(-1.34)#15,229 |
| 46. | Nellis Afb | 8.4% | 10.1%(-1.70)#46 | 9.8%(-1.39)#15,288 |
| 47. | Winchester | 8.2% | 10.1%(-1.84)#47 | 9.8%(-1.53)#15,594 |
| 48. | Mesquite | 8.2% | 10.1%(-1.85)#48 | 9.8%(-1.55)#15,615 |
| 49. | Tonopah | 8.2% | 10.1%(-1.89)#49 | 9.8%(-1.58)#15,673 |
| 50. | Pahrump | 8.1% | 10.1%(-1.95)#50 | 9.8%(-1.65)#15,766 |
| 51. | Paradise | 8.0% | 10.1%(-2.05)#51 | 9.8%(-1.74)#15,903 |
| 52. | Glenbrook | 8.0% | 10.1%(-2.06)#52 | 9.8%(-1.75)#15,923 |
| 53. | Minden | 7.5% | 10.1%(-2.58)#53 | 9.8%(-2.27)#16,727 |
| 54. | Kingsbury | 7.3% | 10.1%(-2.77)#54 | 9.8%(-2.46)#16,997 |
| 55. | Sandy Valley | 7.2% | 10.1%(-2.92)#55 | 9.8%(-2.61)#17,237 |
| 56. | Johnson Lane | 7.0% | 10.1%(-3.07)#56 | 9.8%(-2.76)#17,509 |
| 57. | Wadsworth | 6.7% | 10.1%(-3.42)#57 | 9.8%(-3.11)#17,995 |
| 58. | Carter Springs | 6.6% | 10.1%(-3.53)#58 | 9.8%(-3.22)#18,170 |
| 59. | Incline Village | 6.5% | 10.1%(-3.54)#59 | 9.8%(-3.24)#18,184 |
| 60. | Boulder City | 6.2% | 10.1%(-3.87)#60 | 9.8%(-3.57)#18,705 |
| 61. | Silver Springs | 5.8% | 10.1%(-4.34)#61 | 9.8%(-4.03)#19,351 |
| 62. | Fernley | 5.2% | 10.1%(-4.86)#62 | 9.8%(-4.55)#19,962 |
| 63. | Gardnerville | 5.2% | 10.1%(-4.92)#63 | 9.8%(-4.61)#20,033 |
| 64. | Laughlin | 5.1% | 10.1%(-4.94)#64 | 9.8%(-4.63)#20,056 |
| 65. | Zephyr Cove | 4.8% | 10.1%(-5.24)#65 | 9.8%(-4.93)#20,374 |
| 66. | Moapa Valley | 4.8% | 10.1%(-5.28)#66 | 9.8%(-4.97)#20,423 |
| 67. | Lemmon Valley | 4.7% | 10.1%(-5.35)#67 | 9.8%(-5.04)#20,502 |
| 68. | Verdi | 4.4% | 10.1%(-5.68)#68 | 9.8%(-5.37)#20,812 |
| 69. | Genoa | 4.1% | 10.1%(-6.03)#69 | 9.8%(-5.72)#21,138 |
| 70. | Sun Valley | 3.9% | 10.1%(-6.18)#70 | 9.8%(-5.87)#21,274 |
| 71. | Panaca | 3.6% | 10.1%(-6.54)#71 | 9.8%(-6.23)#21,583 |
| 72. | Mount Charleston | 3.3% | 10.1%(-6.81)#72 | 9.8%(-6.50)#21,805 |
| 73. | Fallon Station | 2.7% | 10.1%(-7.41)#73 | 9.8%(-7.10)#22,190 |
| 74. | Fish Springs | 2.1% | 10.1%(-7.96)#74 | 9.8%(-7.65)#22,530 |
| 75. | Ruhenstroth | 1.8% | 10.1%(-8.27)#75 | 9.8%(-7.96)#22,674 |
| 76. | Smith Valley | 1.7% | 10.1%(-8.38)#76 | 9.8%(-8.08)#22,729 |
| 77. | Battle Mountain | 1.2% | 10.1%(-8.85)#77 | 9.8%(-8.54)#22,880 |
1
2Common Questions
What are the Top 10 Cities with the Highest Percentage of Population with a Degree in Science and Engineering in Nevada?
Top 10 Cities with the Highest Percentage of Population with a Degree in Science and Engineering in Nevada are:
#1
100.0%
#2
63.2%
#3
41.4%
#4
38.9%
#5
36.7%
#6
36.2%
#7
25.8%
#8
25.0%
#9
23.4%
#10
22.1%
What city has the Highest Percentage of Population with a Degree in Science and Engineering in Nevada?
Indian Springs has the Highest Percentage of Population with a Degree in Science and Engineering in Nevada with 100.0%.
What is the Percentage of Population with a Degree in Science and Engineering in the State of Nevada?
Percentage of Population with a Degree in Science and Engineering in Nevada is 10.1%.
What is the Percentage of Population with a Degree in Science and Engineering in the United States?
Percentage of Population with a Degree in Science and Engineering in the United States is 9.8%.