Cities with the Highest Percentage of Population with a Degree in Science and Engineering in the United States
RELATED REPORTS & OPTIONS
Science and Engineering
United States
Compare Cities
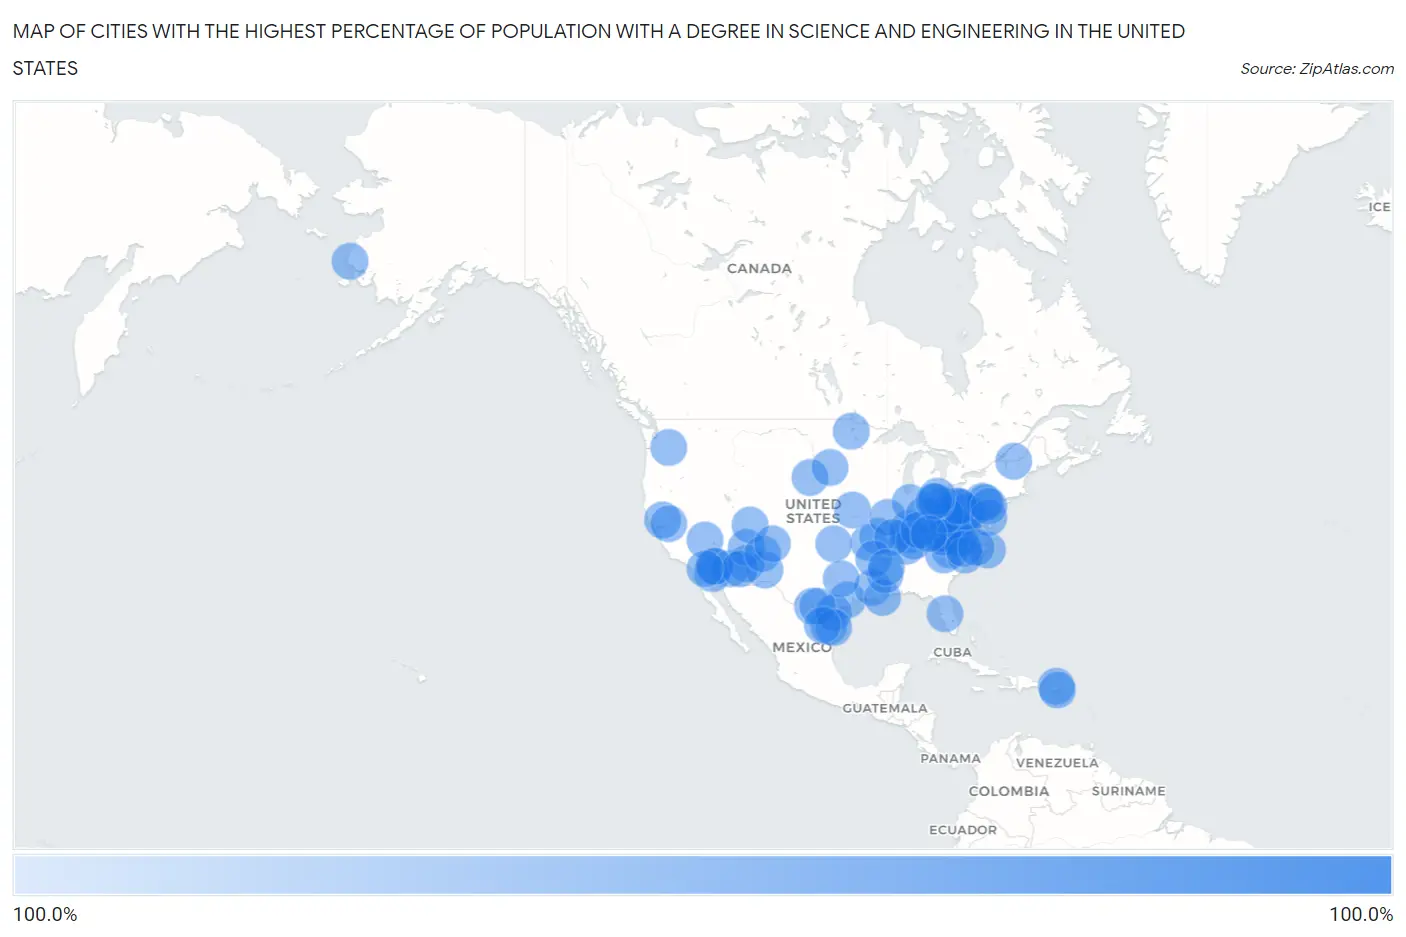
Map of Cities with the Highest Percentage of Population with a Degree in Science and Engineering in the United States
0.0%
100.0%
Cities with the Highest Percentage of Population with a Degree in Science and Engineering in the United States
| City | % Graduates | vs State | vs National | |
| 1. | West Sharyland | 100.0% | 9.5%(+90.5)#1 | 9.8%(+90.2)#1 |
| 2. | Fifth Street | 100.0% | 9.5%(+90.5)#2 | 9.8%(+90.2)#2 |
| 3. | Fifth Ward | 100.0% | 12.6%(+87.4)#1 | 9.8%(+90.2)#3 |
| 4. | Kraemer | 100.0% | 12.6%(+87.4)#2 | 9.8%(+90.2)#4 |
| 5. | Ehrenberg | 100.0% | 10.2%(+89.8)#1 | 9.8%(+90.2)#5 |
| 6. | Little Rock | 100.0% | 9.8%(+90.2)#1 | 9.8%(+90.2)#6 |
| 7. | Knights Landing | 100.0% | 8.3%(+91.7)#1 | 9.8%(+90.2)#7 |
| 8. | Sabana | 100.0% | 12.4%(+87.6)#1 | 9.8%(+90.2)#8 |
| 9. | Gila Crossing | 100.0% | 10.2%(+89.8)#2 | 9.8%(+90.2)#9 |
| 10. | Fabrica | 100.0% | 9.5%(+90.5)#3 | 9.8%(+90.2)#10 |
| 11. | Fowlkes | 100.0% | 10.9%(+89.1)#1 | 9.8%(+90.2)#11 |
| 12. | Kearney Park | 100.0% | 13.2%(+86.8)#1 | 9.8%(+90.2)#12 |
| 13. | Indian Springs | 100.0% | 10.1%(+89.9)#1 | 9.8%(+90.2)#13 |
| 14. | Waverly | 100.0% | 12.7%(+87.3)#1 | 9.8%(+90.2)#14 |
| 15. | Williamsburg | 100.0% | 9.2%(+90.8)#1 | 9.8%(+90.2)#15 |
| 16. | Beechmont | 100.0% | 11.9%(+88.1)#1 | 9.8%(+90.2)#16 |
| 17. | Bradley Junction | 100.0% | 10.9%(+89.1)#1 | 9.8%(+90.2)#17 |
| 18. | Iron Station | 100.0% | 9.8%(+90.2)#1 | 9.8%(+90.2)#18 |
| 19. | Donovan Estates | 100.0% | 10.2%(+89.8)#3 | 9.8%(+90.2)#19 |
| 20. | Raysal | 100.0% | 13.5%(+86.5)#1 | 9.8%(+90.2)#20 |
| 21. | Ivanhoe | 100.0% | 8.0%(+92.0)#1 | 9.8%(+90.2)#21 |
| 22. | Danville | 100.0% | 8.8%(+91.2)#1 | 9.8%(+90.2)#22 |
| 23. | Fairview Crossroads | 100.0% | 10.2%(+89.8)#1 | 9.8%(+90.2)#23 |
| 24. | Valley Bend | 100.0% | 13.5%(+86.5)#2 | 9.8%(+90.2)#24 |
| 25. | Randolph | 100.0% | 13.2%(+86.8)#2 | 9.8%(+90.2)#25 |
| 26. | White Swan | 100.0% | 8.7%(+91.3)#1 | 9.8%(+90.2)#26 |
| 27. | Summit | 100.0% | 12.0%(+88.0)#1 | 9.8%(+90.2)#27 |
| 28. | Maceo | 100.0% | 11.9%(+88.1)#2 | 9.8%(+90.2)#28 |
| 29. | Startex | 100.0% | 10.2%(+89.8)#2 | 9.8%(+90.2)#29 |
| 30. | Villa Heights | 100.0% | 8.0%(+92.0)#2 | 9.8%(+90.2)#30 |
| 31. | Virgie | 100.0% | 11.9%(+88.1)#3 | 9.8%(+90.2)#31 |
| 32. | Slovan | 100.0% | 10.9%(+89.1)#1 | 9.8%(+90.2)#32 |
| 33. | Lenox | 100.0% | 10.9%(+89.1)#2 | 9.8%(+90.2)#33 |
| 34. | Eckhart Mines | 100.0% | 8.8%(+91.2)#2 | 9.8%(+90.2)#34 |
| 35. | Wrigley | 100.0% | 10.9%(+89.1)#3 | 9.8%(+90.2)#35 |
| 36. | La Paz Valley | 100.0% | 10.2%(+89.8)#4 | 9.8%(+90.2)#36 |
| 37. | Howard | 100.0% | 11.8%(+88.2)#1 | 9.8%(+90.2)#37 |
| 38. | Shakertowne | 100.0% | 10.8%(+89.2)#1 | 9.8%(+90.2)#38 |
| 39. | Millers Lake | 100.0% | 11.2%(+88.8)#1 | 9.8%(+90.2)#39 |
| 40. | East Fork | 100.0% | 10.2%(+89.8)#5 | 9.8%(+90.2)#40 |
| 41. | Morgan Farm | 100.0% | 9.5%(+90.5)#4 | 9.8%(+90.2)#41 |
| 42. | Chevak | 100.0% | 10.4%(+89.6)#1 | 9.8%(+90.2)#42 |
| 43. | Steamboat | 100.0% | 10.2%(+89.8)#6 | 9.8%(+90.2)#43 |
| 44. | Birch Tree | 100.0% | 10.8%(+89.2)#2 | 9.8%(+90.2)#44 |
| 45. | Villa De Sabana | 100.0% | 12.4%(+87.6)#2 | 9.8%(+90.2)#45 |
| 46. | Arnold City | 100.0% | 10.9%(+89.1)#2 | 9.8%(+90.2)#46 |
| 47. | Bethel | 100.0% | 12.7%(+87.3)#2 | 9.8%(+90.2)#47 |
| 48. | Vibbard | 100.0% | 10.8%(+89.2)#3 | 9.8%(+90.2)#48 |
| 49. | Tocsin | 100.0% | 12.7%(+87.3)#3 | 9.8%(+90.2)#49 |
| 50. | Bowling Green | 100.0% | 12.7%(+87.3)#4 | 9.8%(+90.2)#50 |
| 51. | Cleveland | 100.0% | 8.0%(+92.0)#3 | 9.8%(+90.2)#51 |
| 52. | Deerfield | 100.0% | 8.0%(+92.0)#4 | 9.8%(+90.2)#52 |
| 53. | Marshall | 100.0% | 10.4%(+89.6)#1 | 9.8%(+90.2)#53 |
| 54. | Stewart | 100.0% | 11.8%(+88.2)#2 | 9.8%(+90.2)#54 |
| 55. | Dundas | 100.0% | 9.8%(+90.2)#1 | 9.8%(+90.2)#55 |
| 56. | Pueblito Del Carmen | 100.0% | 12.4%(+87.6)#3 | 9.8%(+90.2)#56 |
| 57. | Soldier Creek | 100.0% | 12.8%(+87.2)#1 | 9.8%(+90.2)#57 |
| 58. | Amazonia | 100.0% | 10.8%(+89.2)#4 | 9.8%(+90.2)#58 |
| 59. | Bethpage | 100.0% | 10.9%(+89.1)#4 | 9.8%(+90.2)#59 |
| 60. | Royal Lakes | 100.0% | 9.8%(+90.2)#2 | 9.8%(+90.2)#60 |
| 61. | La Sal | 100.0% | 10.4%(+89.6)#1 | 9.8%(+90.2)#61 |
| 62. | Tharptown Uniontown | 100.0% | 10.9%(+89.1)#3 | 9.8%(+90.2)#62 |
| 63. | Norway | 100.0% | 12.7%(+87.3)#5 | 9.8%(+90.2)#63 |
| 64. | Fountain Springs | 100.0% | 10.9%(+89.1)#4 | 9.8%(+90.2)#64 |
| 65. | Shipshewana Lake | 100.0% | 12.7%(+87.3)#6 | 9.8%(+90.2)#65 |
| 66. | New Trenton | 100.0% | 12.7%(+87.3)#7 | 9.8%(+90.2)#66 |
| 67. | Abington | 100.0% | 12.7%(+87.3)#8 | 9.8%(+90.2)#67 |
| 68. | Engelhard | 100.0% | 9.8%(+90.2)#2 | 9.8%(+90.2)#68 |
| 69. | Elrama | 100.0% | 10.9%(+89.1)#5 | 9.8%(+90.2)#69 |
| 70. | Anniston | 100.0% | 10.8%(+89.2)#5 | 9.8%(+90.2)#71 |
| 71. | East Globe | 100.0% | 10.2%(+89.8)#7 | 9.8%(+90.2)#72 |
| 72. | Shannon | 100.0% | 9.8%(+90.2)#3 | 9.8%(+90.2)#73 |
| 73. | Bombay Beach | 100.0% | 8.3%(+91.7)#2 | 9.8%(+90.2)#74 |
| 74. | Vickery | 100.0% | 11.8%(+88.2)#3 | 9.8%(+90.2)#75 |
| 75. | Oceola | 100.0% | 11.8%(+88.2)#4 | 9.8%(+90.2)#76 |
| 76. | North Acomita Village | 100.0% | 9.2%(+90.8)#2 | 9.8%(+90.2)#77 |
| 77. | Chili | 100.0% | 9.2%(+90.8)#3 | 9.8%(+90.2)#78 |
| 78. | Martell | 100.0% | 8.3%(+91.7)#3 | 9.8%(+90.2)#79 |
| 79. | Boston | 100.0% | 11.9%(+88.1)#4 | 9.8%(+90.2)#80 |
| 80. | Casanova | 100.0% | 10.9%(+89.1)#6 | 9.8%(+90.2)#81 |
| 81. | Smithville | 100.0% | 9.8%(+90.2)#3 | 9.8%(+90.2)#82 |
| 82. | Goldsboro | 100.0% | 8.8%(+91.2)#3 | 9.8%(+90.2)#83 |
| 83. | Loma Grande | 100.0% | 9.5%(+90.5)#5 | 9.8%(+90.2)#84 |
| 84. | Villa Del Sol | 100.0% | 9.5%(+90.5)#6 | 9.8%(+90.2)#85 |
| 85. | Lawrence | 100.0% | 9.8%(+90.2)#4 | 9.8%(+90.2)#86 |
| 86. | Newport Center | 100.0% | 8.7%(+91.3)#1 | 9.8%(+90.2)#87 |
| 87. | Groveland | 100.0% | 12.7%(+87.3)#9 | 9.8%(+90.2)#88 |
| 88. | Sherrill | 100.0% | 12.0%(+88.0)#2 | 9.8%(+90.2)#89 |
| 89. | La Minita | 100.0% | 9.5%(+90.5)#7 | 9.8%(+90.2)#90 |
| 90. | Cavour | 100.0% | 12.8%(+87.2)#2 | 9.8%(+90.2)#91 |
| 91. | Breaks | 100.0% | 8.0%(+92.0)#5 | 9.8%(+90.2)#92 |
| 92. | Gulf | 100.0% | 9.8%(+90.2)#4 | 9.8%(+90.2)#93 |
| 93. | Sidon | 100.0% | 13.2%(+86.8)#3 | 9.8%(+90.2)#94 |
| 94. | Whiteside | 100.0% | 10.9%(+89.1)#5 | 9.8%(+90.2)#95 |
| 95. | Patterson | 100.0% | 11.8%(+88.2)#5 | 9.8%(+90.2)#96 |
| 96. | Belvoir | 100.0% | 9.8%(+90.2)#5 | 9.8%(+90.2)#97 |
| 97. | Baumstown | 100.0% | 10.9%(+89.1)#7 | 9.8%(+90.2)#98 |
| 98. | Cory | 100.0% | 12.7%(+87.3)#10 | 9.8%(+90.2)#99 |
| 99. | Emhouse | 100.0% | 9.5%(+90.5)#8 | 9.8%(+90.2)#100 |
| 100. | Livingston | 100.0% | 11.9%(+88.1)#5 | 9.8%(+90.2)#101 |
Common Questions
What are the Top 10 Cities with the Highest Percentage of Population with a Degree in Science and Engineering in the United States?
Top 10 Cities with the Highest Percentage of Population with a Degree in Science and Engineering in the United States are:
#1
100.0%
#2
100.0%
#3
100.0%
#4
100.0%
#5
100.0%
#6
100.0%
#7
100.0%
#8
100.0%
#9
100.0%
#10
100.0%
What city has the Highest Percentage of Population with a Degree in Science and Engineering in the United States?
West Sharyland has the Highest Percentage of Population with a Degree in Science and Engineering in the United States with 100.0%.
What is the Percentage of Population with a Degree in Science and Engineering in the United States?
Percentage of Population with a Degree in Science and Engineering in the United States is 9.8%.