Cities with the Highest Percentage of Population with a Degree in Science and Engineering in Vermont
RELATED REPORTS & OPTIONS
Science and Engineering
Vermont
Compare Cities
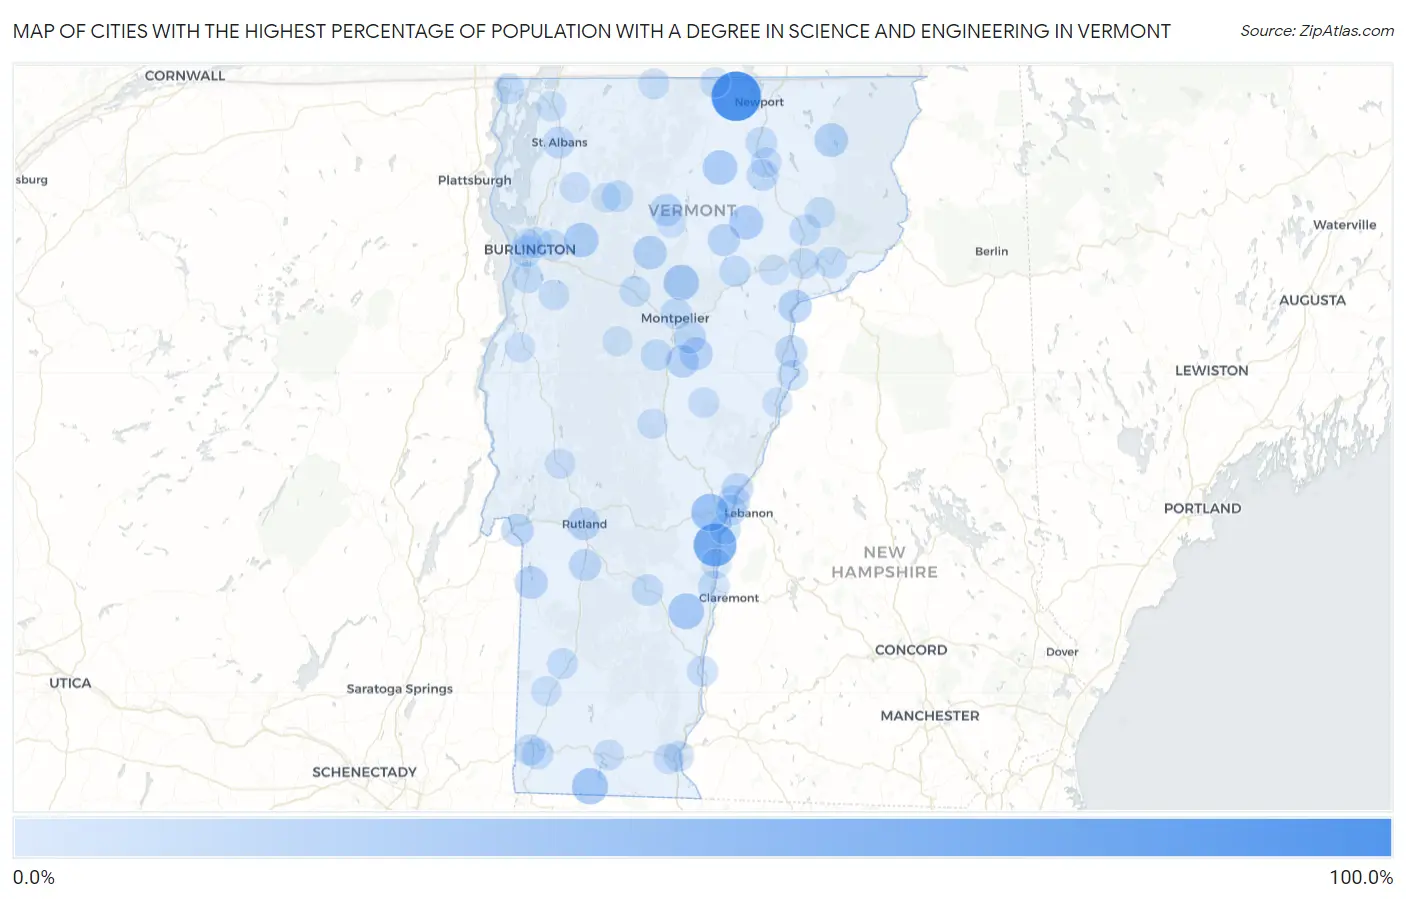
Map of Cities with the Highest Percentage of Population with a Degree in Science and Engineering in Vermont
0.0%
100.0%
Cities with the Highest Percentage of Population with a Degree in Science and Engineering in Vermont
| City | % Graduates | vs State | vs National | |
| 1. | Newport Center | 100.0% | 8.7%(+91.3)#1 | 9.8%(+90.2)#86 |
| 2. | Hartland | 66.2% | 8.7%(+57.5)#2 | 9.8%(+56.4)#351 |
| 3. | North Pownal | 41.0% | 8.7%(+32.3)#3 | 9.8%(+31.2)#912 |
| 4. | Quechee | 38.9% | 8.7%(+30.3)#4 | 9.8%(+29.2)#1,015 |
| 5. | Waterbury Center | 33.7% | 8.7%(+25.0)#5 | 9.8%(+23.9)#1,302 |
| 6. | Readsboro | 33.3% | 8.7%(+24.7)#6 | 9.8%(+23.6)#1,341 |
| 7. | Castleton Four Corners | 31.1% | 8.7%(+22.4)#7 | 9.8%(+21.3)#1,564 |
| 8. | Highgate Center | 31.0% | 8.7%(+22.4)#8 | 9.8%(+21.3)#1,572 |
| 9. | North Springfield | 30.9% | 8.7%(+22.2)#9 | 9.8%(+21.1)#1,581 |
| 10. | North Clarendon | 29.8% | 8.7%(+21.1)#10 | 9.8%(+20.0)#1,703 |
| 11. | Worcester | 29.7% | 8.7%(+21.1)#11 | 9.8%(+19.9)#1,713 |
| 12. | Huntington | 29.7% | 8.7%(+21.0)#12 | 9.8%(+19.9)#1,718 |
| 13. | South Hero | 28.0% | 8.7%(+19.3)#13 | 9.8%(+18.2)#1,956 |
| 14. | West Pawlet | 26.5% | 8.7%(+17.8)#14 | 9.8%(+16.7)#2,163 |
| 15. | Jericho | 25.7% | 8.7%(+17.0)#15 | 9.8%(+15.9)#2,297 |
| 16. | Albany | 25.6% | 8.7%(+17.0)#16 | 9.8%(+15.9)#2,299 |
| 17. | Hartford | 24.8% | 8.7%(+16.1)#17 | 9.8%(+15.0)#2,519 |
| 18. | South Lincoln | 24.5% | 8.7%(+15.9)#18 | 9.8%(+14.7)#2,553 |
| 19. | Greensboro Bend | 23.7% | 8.7%(+15.1)#19 | 9.8%(+13.9)#2,713 |
| 20. | Island Pond | 21.9% | 8.7%(+13.2)#20 | 9.8%(+12.1)#3,197 |
| 21. | Westford | 20.7% | 8.7%(+12.0)#21 | 9.8%(+10.9)#3,599 |
| 22. | Stowe | 20.5% | 8.7%(+11.8)#22 | 9.8%(+10.7)#3,656 |
| 23. | Barnet | 20.0% | 8.7%(+11.3)#23 | 9.8%(+10.2)#3,874 |
| 24. | Jamaica | 20.0% | 8.7%(+11.3)#24 | 9.8%(+10.2)#3,895 |
| 25. | Algiers | 19.6% | 8.7%(+10.9)#25 | 9.8%(+9.83)#3,996 |
| 26. | Townshend | 18.9% | 8.7%(+10.3)#26 | 9.8%(+9.14)#4,266 |
| 27. | Graniteville | 18.1% | 8.7%(+9.45)#27 | 9.8%(+8.33)#4,662 |
| 28. | Rutland | 17.7% | 8.7%(+9.06)#28 | 9.8%(+7.94)#4,826 |
| 29. | Wells | 17.6% | 8.7%(+8.98)#29 | 9.8%(+7.87)#4,879 |
| 30. | Lincoln | 17.2% | 8.7%(+8.57)#30 | 9.8%(+7.46)#5,084 |
| 31. | Williamstown | 17.1% | 8.7%(+8.47)#31 | 9.8%(+7.36)#5,131 |
| 32. | Danby | 15.6% | 8.7%(+6.89)#32 | 9.8%(+5.77)#6,173 |
| 33. | Fair Haven | 15.4% | 8.7%(+6.72)#33 | 9.8%(+5.60)#6,266 |
| 34. | Hyde Park | 15.3% | 8.7%(+6.66)#34 | 9.8%(+5.55)#6,345 |
| 35. | Hardwick | 15.2% | 8.7%(+6.58)#35 | 9.8%(+5.46)#6,411 |
| 36. | Wells River | 15.0% | 8.7%(+6.33)#36 | 9.8%(+5.22)#6,600 |
| 37. | Barre | 14.2% | 8.7%(+5.55)#37 | 9.8%(+4.44)#7,282 |
| 38. | Wallingford | 13.7% | 8.7%(+5.07)#38 | 9.8%(+3.95)#7,697 |
| 39. | Wilder | 13.3% | 8.7%(+4.66)#39 | 9.8%(+3.54)#8,120 |
| 40. | Glover | 13.0% | 8.7%(+4.37)#40 | 9.8%(+3.26)#8,416 |
| 41. | St Albans | 12.5% | 8.7%(+3.88)#41 | 9.8%(+2.77)#8,937 |
| 42. | Norwich | 12.3% | 8.7%(+3.61)#42 | 9.8%(+2.49)#9,302 |
| 43. | Killington | 11.7% | 8.7%(+3.01)#43 | 9.8%(+1.90)#10,086 |
| 44. | Jeffersonville | 11.7% | 8.7%(+2.98)#44 | 9.8%(+1.87)#10,124 |
| 45. | Concord | 11.6% | 8.7%(+2.96)#45 | 9.8%(+1.85)#10,163 |
| 46. | Ludlow | 11.5% | 8.7%(+2.79)#46 | 9.8%(+1.67)#10,401 |
| 47. | Orleans | 11.4% | 8.7%(+2.72)#47 | 9.8%(+1.61)#10,481 |
| 48. | Northfield | 11.4% | 8.7%(+2.69)#48 | 9.8%(+1.58)#10,543 |
| 49. | Stamford | 11.2% | 8.7%(+2.52)#49 | 9.8%(+1.41)#10,786 |
| 50. | Bennington | 10.8% | 8.7%(+2.12)#50 | 9.8%(+1.00)#11,404 |
| 51. | Ascutney | 10.7% | 8.7%(+2.00)#51 | 9.8%(+0.885)#11,607 |
| 52. | Proctor | 10.7% | 8.7%(+1.99)#52 | 9.8%(+0.877)#11,622 |
| 53. | North Hartland | 10.7% | 8.7%(+1.99)#53 | 9.8%(+0.874)#11,626 |
| 54. | Cabot | 10.6% | 8.7%(+1.97)#54 | 9.8%(+0.857)#11,662 |
| 55. | Shelburne | 10.6% | 8.7%(+1.95)#55 | 9.8%(+0.835)#11,696 |
| 56. | South Burlington | 10.6% | 8.7%(+1.95)#56 | 9.8%(+0.833)#11,699 |
| 57. | Lyndonville | 10.4% | 8.7%(+1.76)#57 | 9.8%(+0.645)#11,972 |
| 58. | Chittenden | 10.0% | 8.7%(+1.33)#58 | 9.8%(+0.219)#12,718 |
| 59. | Old Bennington | 9.7% | 8.7%(+1.04)#59 | 9.8%(-0.073)#13,139 |
| 60. | Montpelier | 9.6% | 8.7%(+0.912)#60 | 9.8%(-0.200)#13,350 |
| 61. | Waterbury | 9.5% | 8.7%(+0.830)#61 | 9.8%(-0.283)#13,509 |
| 62. | West Woodstock | 9.4% | 8.7%(+0.752)#62 | 9.8%(-0.361)#13,621 |
| 63. | Alburgh | 9.4% | 8.7%(+0.706)#63 | 9.8%(-0.406)#13,706 |
| 64. | White River Junction | 9.2% | 8.7%(+0.562)#64 | 9.8%(-0.551)#13,918 |
| 65. | Winooski | 9.2% | 8.7%(+0.513)#65 | 9.8%(-0.600)#14,007 |
| 66. | Bellows Falls | 9.2% | 8.7%(+0.482)#66 | 9.8%(-0.631)#14,058 |
| 67. | St Johnsbury | 9.1% | 8.7%(+0.422)#67 | 9.8%(-0.691)#14,129 |
| 68. | Manchester | 9.0% | 8.7%(+0.338)#68 | 9.8%(-0.775)#14,350 |
| 69. | Newbury | 8.9% | 8.7%(+0.236)#69 | 9.8%(-0.877)#14,517 |
| 70. | Essex Junction | 8.5% | 8.7%(-0.202)#70 | 9.8%(-1.31)#15,186 |
| 71. | East Burke | 8.2% | 8.7%(-0.449)#71 | 9.8%(-1.56)#15,639 |
| 72. | Richford | 8.1% | 8.7%(-0.529)#72 | 9.8%(-1.64)#15,760 |
| 73. | Chelsea | 8.0% | 8.7%(-0.623)#73 | 9.8%(-1.74)#15,895 |
| 74. | Wardsboro | 7.9% | 8.7%(-0.774)#74 | 9.8%(-1.89)#16,136 |
| 75. | Hinesburg | 7.7% | 8.7%(-0.976)#75 | 9.8%(-2.09)#16,424 |
| 76. | New Haven | 7.7% | 8.7%(-0.976)#76 | 9.8%(-2.09)#16,459 |
| 77. | Sheffield | 7.4% | 8.7%(-1.26)#77 | 9.8%(-2.37)#16,882 |
| 78. | Wilmington | 7.3% | 8.7%(-1.34)#78 | 9.8%(-2.45)#16,983 |
| 79. | Brattleboro | 7.2% | 8.7%(-1.50)#79 | 9.8%(-2.61)#17,242 |
| 80. | West Brattleboro | 7.1% | 8.7%(-1.55)#80 | 9.8%(-2.66)#17,371 |
| 81. | Pownal Center | 7.1% | 8.7%(-1.58)#81 | 9.8%(-2.69)#17,414 |
| 82. | Fairfax | 7.0% | 8.7%(-1.66)#82 | 9.8%(-2.77)#17,536 |
| 83. | Middletown Springs | 6.8% | 8.7%(-1.85)#83 | 9.8%(-2.96)#17,799 |
| 84. | Barton | 6.7% | 8.7%(-2.00)#84 | 9.8%(-3.11)#17,996 |
| 85. | St. George | 6.7% | 8.7%(-2.00)#85 | 9.8%(-3.11)#18,005 |
| 86. | Brandon | 6.3% | 8.7%(-2.39)#86 | 9.8%(-3.50)#18,589 |
| 87. | Burlington | 6.0% | 8.7%(-2.69)#87 | 9.8%(-3.80)#19,016 |
| 88. | Swanton | 5.9% | 8.7%(-2.74)#88 | 9.8%(-3.85)#19,080 |
| 89. | Randolph | 5.9% | 8.7%(-2.77)#89 | 9.8%(-3.88)#19,128 |
| 90. | Windsor | 5.8% | 8.7%(-2.84)#90 | 9.8%(-3.95)#19,240 |
| 91. | Arlington | 5.8% | 8.7%(-2.86)#91 | 9.8%(-3.97)#19,271 |
| 92. | North Troy | 5.7% | 8.7%(-2.99)#92 | 9.8%(-4.10)#19,434 |
| 93. | Bakersfield | 5.6% | 8.7%(-3.04)#93 | 9.8%(-4.16)#19,499 |
| 94. | Morrisville | 5.4% | 8.7%(-3.22)#94 | 9.8%(-4.33)#19,702 |
| 95. | Waitsfield | 5.4% | 8.7%(-3.28)#95 | 9.8%(-4.39)#19,780 |
| 96. | Hanksville | 5.3% | 8.7%(-3.41)#96 | 9.8%(-4.52)#19,933 |
| 97. | Danville | 5.1% | 8.7%(-3.58)#97 | 9.8%(-4.70)#20,124 |
| 98. | Bradford | 4.8% | 8.7%(-3.87)#98 | 9.8%(-4.98)#20,427 |
| 99. | Vergennes | 4.8% | 8.7%(-3.87)#99 | 9.8%(-4.98)#20,433 |
| 100. | Cambridge | 4.8% | 8.7%(-3.91)#100 | 9.8%(-5.02)#20,483 |
1
2Common Questions
What are the Top 10 Cities with the Highest Percentage of Population with a Degree in Science and Engineering in Vermont?
Top 10 Cities with the Highest Percentage of Population with a Degree in Science and Engineering in Vermont are:
#1
100.0%
#2
66.2%
#3
38.9%
#4
33.3%
#5
30.9%
#6
29.7%
#7
25.7%
#8
25.6%
#9
23.7%
#10
21.9%
What city has the Highest Percentage of Population with a Degree in Science and Engineering in Vermont?
Newport Center has the Highest Percentage of Population with a Degree in Science and Engineering in Vermont with 100.0%.
What is the Percentage of Population with a Degree in Science and Engineering in the State of Vermont?
Percentage of Population with a Degree in Science and Engineering in Vermont is 8.7%.
What is the Percentage of Population with a Degree in Science and Engineering in the United States?
Percentage of Population with a Degree in Science and Engineering in the United States is 9.8%.