Cities with the Highest Percentage of Population with a Degree in Science and Engineering in Puerto Rico
RELATED REPORTS & OPTIONS
Science and Engineering
Puerto Rico
Compare Cities
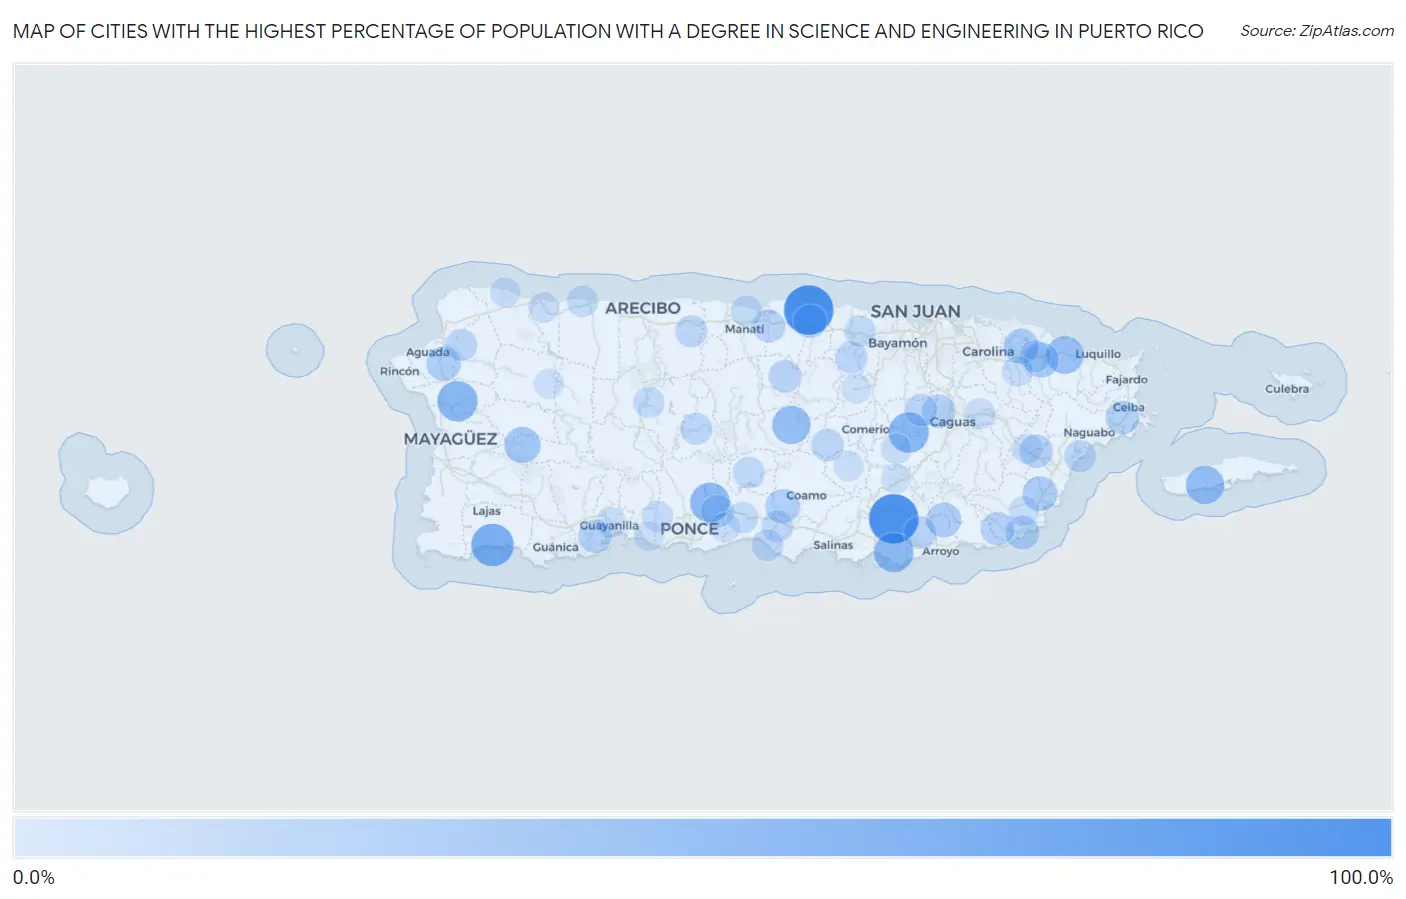
Map of Cities with the Highest Percentage of Population with a Degree in Science and Engineering in Puerto Rico
0.0%
100.0%
Cities with the Highest Percentage of Population with a Degree in Science and Engineering in Puerto Rico
| City | % Graduates | vs State | vs National | |
| 1. | Sabana | 100.0% | 12.4%(+87.6)#1 | 9.8%(+90.2)#8 |
| 2. | Villa De Sabana | 100.0% | 12.4%(+87.6)#2 | 9.8%(+90.2)#45 |
| 3. | Pueblito Del Carmen | 100.0% | 12.4%(+87.6)#3 | 9.8%(+90.2)#56 |
| 4. | La Parguera | 68.5% | 12.4%(+56.1)#4 | 9.8%(+58.8)#312 |
| 5. | Santa Clara | 59.1% | 12.4%(+46.7)#5 | 9.8%(+49.3)#423 |
| 6. | Espino | 59.0% | 12.4%(+46.5)#6 | 9.8%(+49.2)#425 |
| 7. | Cerrillos Hoyos | 55.9% | 12.4%(+43.5)#7 | 9.8%(+46.1)#464 |
| 8. | Playita Comunidad Salinas Municipio | 55.4% | 12.4%(+43.0)#8 | 9.8%(+45.6)#477 |
| 9. | Jobos | 55.3% | 12.4%(+42.9)#9 | 9.8%(+45.5)#478 |
| 10. | Palmarejo Comunidad Lajas Municipio | 51.6% | 12.4%(+39.1)#10 | 9.8%(+41.8)#526 |
| 11. | Esperanza | 50.0% | 12.4%(+37.6)#11 | 9.8%(+40.2)#544 |
| 12. | Orocovis | 49.7% | 12.4%(+37.3)#12 | 9.8%(+39.9)#640 |
| 13. | Lomas Verdes | 49.0% | 12.4%(+36.6)#13 | 9.8%(+39.2)#643 |
| 14. | Boqueron Comunidad Las Piedras Municipio | 48.3% | 12.4%(+35.8)#14 | 9.8%(+38.5)#663 |
| 15. | Hato Candal | 47.3% | 12.4%(+34.9)#15 | 9.8%(+37.6)#694 |
| 16. | Tomás De Castro | 43.7% | 12.4%(+31.3)#16 | 9.8%(+33.9)#795 |
| 17. | Rodriguez Hevia | 40.9% | 12.4%(+28.5)#17 | 9.8%(+31.1)#913 |
| 18. | Maricao | 40.5% | 12.4%(+28.1)#18 | 9.8%(+30.7)#930 |
| 19. | La Pica | 39.1% | 12.4%(+26.7)#19 | 9.8%(+29.3)#1,002 |
| 20. | Loiza | 38.7% | 12.4%(+26.3)#20 | 9.8%(+28.9)#1,030 |
| 21. | Bartolo | 35.8% | 12.4%(+23.4)#21 | 9.8%(+26.0)#1,181 |
| 22. | Luis Llorens Torres | 35.5% | 12.4%(+23.1)#22 | 9.8%(+25.8)#1,203 |
| 23. | San Isidro | 35.5% | 12.4%(+23.1)#23 | 9.8%(+25.7)#1,206 |
| 24. | Comunas | 35.2% | 12.4%(+22.7)#24 | 9.8%(+25.4)#1,227 |
| 25. | Yaurel | 34.7% | 12.4%(+22.3)#25 | 9.8%(+25.0)#1,258 |
| 26. | Voladoras | 33.7% | 12.4%(+21.3)#26 | 9.8%(+23.9)#1,301 |
| 27. | Luyando | 33.3% | 12.4%(+20.8)#27 | 9.8%(+23.5)#1,415 |
| 28. | Los Llanos | 32.2% | 12.4%(+19.8)#28 | 9.8%(+22.4)#1,467 |
| 29. | Caño Martin Peña | 31.3% | 12.4%(+18.9)#29 | 9.8%(+21.5)#1,542 |
| 30. | Benitez | 31.1% | 12.4%(+18.7)#30 | 9.8%(+21.3)#1,561 |
| 31. | Emajagua | 30.3% | 12.4%(+17.9)#31 | 9.8%(+20.5)#1,638 |
| 32. | Isleta | 30.0% | 12.4%(+17.6)#32 | 9.8%(+20.2)#1,667 |
| 33. | Aguas Claras | 29.7% | 12.4%(+17.3)#33 | 9.8%(+19.9)#1,721 |
| 34. | Ceiba | 29.5% | 12.4%(+17.1)#34 | 9.8%(+19.7)#1,736 |
| 35. | Suarez | 29.1% | 12.4%(+16.7)#35 | 9.8%(+19.4)#1,793 |
| 36. | Palo Seco | 29.0% | 12.4%(+16.6)#36 | 9.8%(+19.3)#1,805 |
| 37. | Rafael Gonzalez | 29.0% | 12.4%(+16.5)#37 | 9.8%(+19.2)#1,815 |
| 38. | Las Carolinas | 28.5% | 12.4%(+16.0)#38 | 9.8%(+18.7)#1,908 |
| 39. | Indios | 28.4% | 12.4%(+15.9)#39 | 9.8%(+18.6)#1,919 |
| 40. | La Fermina | 28.3% | 12.4%(+15.8)#40 | 9.8%(+18.5)#1,934 |
| 41. | Cambalache | 27.8% | 12.4%(+15.4)#41 | 9.8%(+18.0)#1,981 |
| 42. | San Antonio Comunidad Aguadilla Municipio | 27.0% | 12.4%(+14.5)#42 | 9.8%(+17.2)#2,099 |
| 43. | Coto Norte | 26.3% | 12.4%(+13.9)#43 | 9.8%(+16.5)#2,179 |
| 44. | Olimpo | 25.7% | 12.4%(+13.2)#44 | 9.8%(+15.9)#2,295 |
| 45. | Morovis | 25.5% | 12.4%(+13.1)#45 | 9.8%(+15.7)#2,316 |
| 46. | Aguas Buenas | 25.2% | 12.4%(+12.7)#46 | 9.8%(+15.4)#2,369 |
| 47. | Coto Laurel | 24.9% | 12.4%(+12.5)#47 | 9.8%(+15.1)#2,503 |
| 48. | Barranquitas | 24.6% | 12.4%(+12.2)#48 | 9.8%(+14.8)#2,538 |
| 49. | Galateo | 24.2% | 12.4%(+11.8)#49 | 9.8%(+14.4)#2,607 |
| 50. | Corazon | 23.9% | 12.4%(+11.5)#50 | 9.8%(+14.1)#2,660 |
| 51. | Sabana Hoyos | 23.4% | 12.4%(+11.0)#51 | 9.8%(+13.6)#2,787 |
| 52. | Punta Santiago | 23.4% | 12.4%(+11.0)#52 | 9.8%(+13.6)#2,788 |
| 53. | Franquez | 23.3% | 12.4%(+10.9)#53 | 9.8%(+13.5)#2,821 |
| 54. | La Dolores | 22.7% | 12.4%(+10.3)#54 | 9.8%(+12.9)#2,960 |
| 55. | Jayuya | 22.7% | 12.4%(+10.3)#55 | 9.8%(+12.9)#2,981 |
| 56. | Moca | 22.6% | 12.4%(+10.2)#56 | 9.8%(+12.8)#3,000 |
| 57. | Penuelas | 22.4% | 12.4%(+10.0)#57 | 9.8%(+12.7)#3,052 |
| 58. | Las Ollas | 22.1% | 12.4%(+9.69)#58 | 9.8%(+12.3)#3,150 |
| 59. | San Sebastian | 22.0% | 12.4%(+9.54)#59 | 9.8%(+12.2)#3,181 |
| 60. | Playita Cortada | 21.9% | 12.4%(+9.48)#60 | 9.8%(+12.1)#3,199 |
| 61. | Rio Blanco | 21.8% | 12.4%(+9.39)#61 | 9.8%(+12.0)#3,230 |
| 62. | Rio Grande | 21.7% | 12.4%(+9.26)#62 | 9.8%(+11.9)#3,265 |
| 63. | Bufalo | 21.4% | 12.4%(+9.00)#63 | 9.8%(+11.6)#3,338 |
| 64. | Mansión Del Sol | 21.4% | 12.4%(+9.00)#64 | 9.8%(+11.6)#3,346 |
| 65. | Villalba | 21.3% | 12.4%(+8.83)#65 | 9.8%(+11.5)#3,417 |
| 66. | Palomas Comunidad Yauco Municipio | 21.2% | 12.4%(+8.77)#66 | 9.8%(+11.4)#3,439 |
| 67. | Guanica | 20.8% | 12.4%(+8.35)#67 | 9.8%(+11.0)#3,553 |
| 68. | Camuy | 20.7% | 12.4%(+8.25)#68 | 9.8%(+10.9)#3,588 |
| 69. | Campanilla | 20.5% | 12.4%(+8.11)#69 | 9.8%(+10.8)#3,642 |
| 70. | Comerio | 20.5% | 12.4%(+8.04)#70 | 9.8%(+10.7)#3,657 |
| 71. | Piedra Aguza | 20.3% | 12.4%(+7.91)#71 | 9.8%(+10.6)#3,692 |
| 72. | Tierras Nuevas Poniente | 20.1% | 12.4%(+7.66)#72 | 9.8%(+10.3)#3,764 |
| 73. | Jaguas | 19.9% | 12.4%(+7.52)#73 | 9.8%(+10.2)#3,908 |
| 74. | Utuado | 19.8% | 12.4%(+7.39)#74 | 9.8%(+10.0)#3,936 |
| 75. | Rincón | 18.6% | 12.4%(+6.14)#75 | 9.8%(+8.78)#4,433 |
| 76. | Quebrada Del Agua | 18.5% | 12.4%(+6.09)#76 | 9.8%(+8.74)#4,456 |
| 77. | Las Gaviotas | 18.4% | 12.4%(+5.97)#77 | 9.8%(+8.61)#4,517 |
| 78. | Pabellones | 18.3% | 12.4%(+5.85)#78 | 9.8%(+8.50)#4,565 |
| 79. | Gurabo | 18.1% | 12.4%(+5.69)#79 | 9.8%(+8.34)#4,659 |
| 80. | Rio Lajas | 17.9% | 12.4%(+5.45)#80 | 9.8%(+8.10)#4,756 |
| 81. | Campo Rico | 17.7% | 12.4%(+5.32)#81 | 9.8%(+7.96)#4,814 |
| 82. | Quebradillas | 17.0% | 12.4%(+4.56)#82 | 9.8%(+7.20)#5,227 |
| 83. | Cidra | 16.9% | 12.4%(+4.48)#83 | 9.8%(+7.12)#5,267 |
| 84. | Las Piedras | 16.9% | 12.4%(+4.43)#84 | 9.8%(+7.07)#5,296 |
| 85. | Buena Vista Comunidad Arroyo Municipio | 16.0% | 12.4%(+3.61)#85 | 9.8%(+6.26)#5,823 |
| 86. | Guayanilla | 16.0% | 12.4%(+3.58)#86 | 9.8%(+6.22)#5,843 |
| 87. | Parcelas Penuelas | 16.0% | 12.4%(+3.53)#87 | 9.8%(+6.17)#5,883 |
| 88. | Isabela | 15.8% | 12.4%(+3.35)#88 | 9.8%(+5.99)#6,023 |
| 89. | Yabucoa | 15.7% | 12.4%(+3.28)#89 | 9.8%(+5.92)#6,060 |
| 90. | Las Marias | 15.4% | 12.4%(+3.02)#90 | 9.8%(+5.67)#6,234 |
| 91. | Aibonito | 15.4% | 12.4%(+3.00)#91 | 9.8%(+5.64)#6,251 |
| 92. | Naranjito | 15.3% | 12.4%(+2.89)#92 | 9.8%(+5.54)#6,356 |
| 93. | Juncal | 15.2% | 12.4%(+2.81)#93 | 9.8%(+5.46)#6,415 |
| 94. | Coqui | 15.2% | 12.4%(+2.77)#94 | 9.8%(+5.41)#6,448 |
| 95. | Tallaboa | 15.0% | 12.4%(+2.57)#95 | 9.8%(+5.22)#6,590 |
| 96. | Canovanas | 14.9% | 12.4%(+2.51)#96 | 9.8%(+5.15)#6,658 |
| 97. | Capitanejo | 14.9% | 12.4%(+2.47)#97 | 9.8%(+5.12)#6,682 |
| 98. | Cayey | 14.9% | 12.4%(+2.45)#98 | 9.8%(+5.09)#6,700 |
| 99. | El Mango | 14.8% | 12.4%(+2.35)#99 | 9.8%(+4.99)#6,784 |
| 100. | Mariano Colon | 14.7% | 12.4%(+2.25)#100 | 9.8%(+4.90)#6,847 |
Common Questions
What are the Top 10 Cities with the Highest Percentage of Population with a Degree in Science and Engineering in Puerto Rico?
Top 10 Cities with the Highest Percentage of Population with a Degree in Science and Engineering in Puerto Rico are:
#1
100.0%
#2
100.0%
#3
68.5%
#4
59.1%
#5
59.0%
#6
55.9%
#7
55.3%
#8
50.0%
#9
49.7%
#10
47.3%
What city has the Highest Percentage of Population with a Degree in Science and Engineering in Puerto Rico?
Sabana has the Highest Percentage of Population with a Degree in Science and Engineering in Puerto Rico with 100.0%.
What is the Percentage of Population with a Degree in Science and Engineering in the State of Puerto Rico?
Percentage of Population with a Degree in Science and Engineering in Puerto Rico is 12.4%.
What is the Percentage of Population with a Degree in Science and Engineering in the United States?
Percentage of Population with a Degree in Science and Engineering in the United States is 9.8%.