Hickman, CA Map & Demographics
Hickman Map
Hickman Overview
$31,412
PER CAPITA INCOME
$83,015
AVG FAMILY INCOME
$83,676
AVG HOUSEHOLD INCOME
63.7%
WAGE / INCOME GAP [ % ]
36.3¢/ $1
WAGE / INCOME GAP [ $ ]
0.34
INEQUALITY / GINI INDEX
810
TOTAL POPULATION
388
MALE POPULATION
422
FEMALE POPULATION
91.94
MALES / 100 FEMALES
108.76
FEMALES / 100 MALES
43.6
MEDIAN AGE
3.4
AVG FAMILY SIZE
3.2
AVG HOUSEHOLD SIZE
469
LABOR FORCE [ PEOPLE ]
70.3%
PERCENT IN LABOR FORCE
17.7%
UNEMPLOYMENT RATE
Hickman Zip Codes
Hickman Area Codes
Income in Hickman
Income Overview in Hickman
Per Capita Income in Hickman is $31,412, while median incomes of families and households are $83,015 and $83,676 respectively.
| Characteristic | Number | Measure |
| Per Capita Income | 810 | $31,412 |
| Median Family Income | 211 | $83,015 |
| Mean Family Income | 211 | $96,258 |
| Median Household Income | 256 | $83,676 |
| Mean Household Income | 256 | $93,811 |
| Income Deficit | 211 | $0 |
| Wage / Income Gap (%) | 810 | 63.65% |
| Wage / Income Gap ($) | 810 | 36.35¢ per $1 |
| Gini / Inequality Index | 810 | 0.34 |
Earnings by Sex in Hickman
Average Earnings in Hickman are $45,083, $67,946 for men and $24,695 for women, a difference of 63.6%.
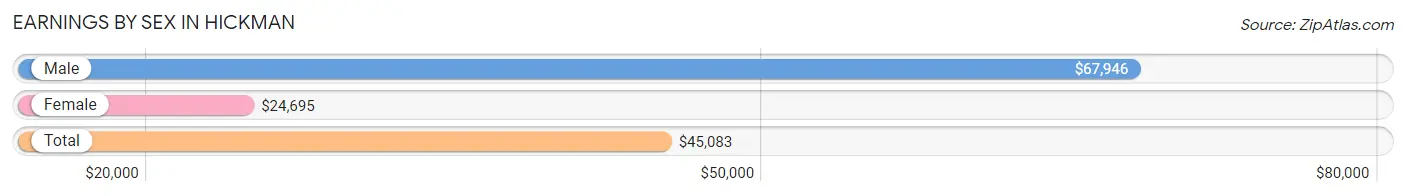
| Sex | Number | Average Earnings |
| Male | 197 (49.1%) | $67,946 |
| Female | 204 (50.9%) | $24,695 |
| Total | 401 (100.0%) | $45,083 |
Earnings by Sex by Income Bracket in Hickman
The most common earnings brackets in Hickman are $100,000+ for men (54 | 27.4%) and $55,000 to $64,999 for women (50 | 24.5%).
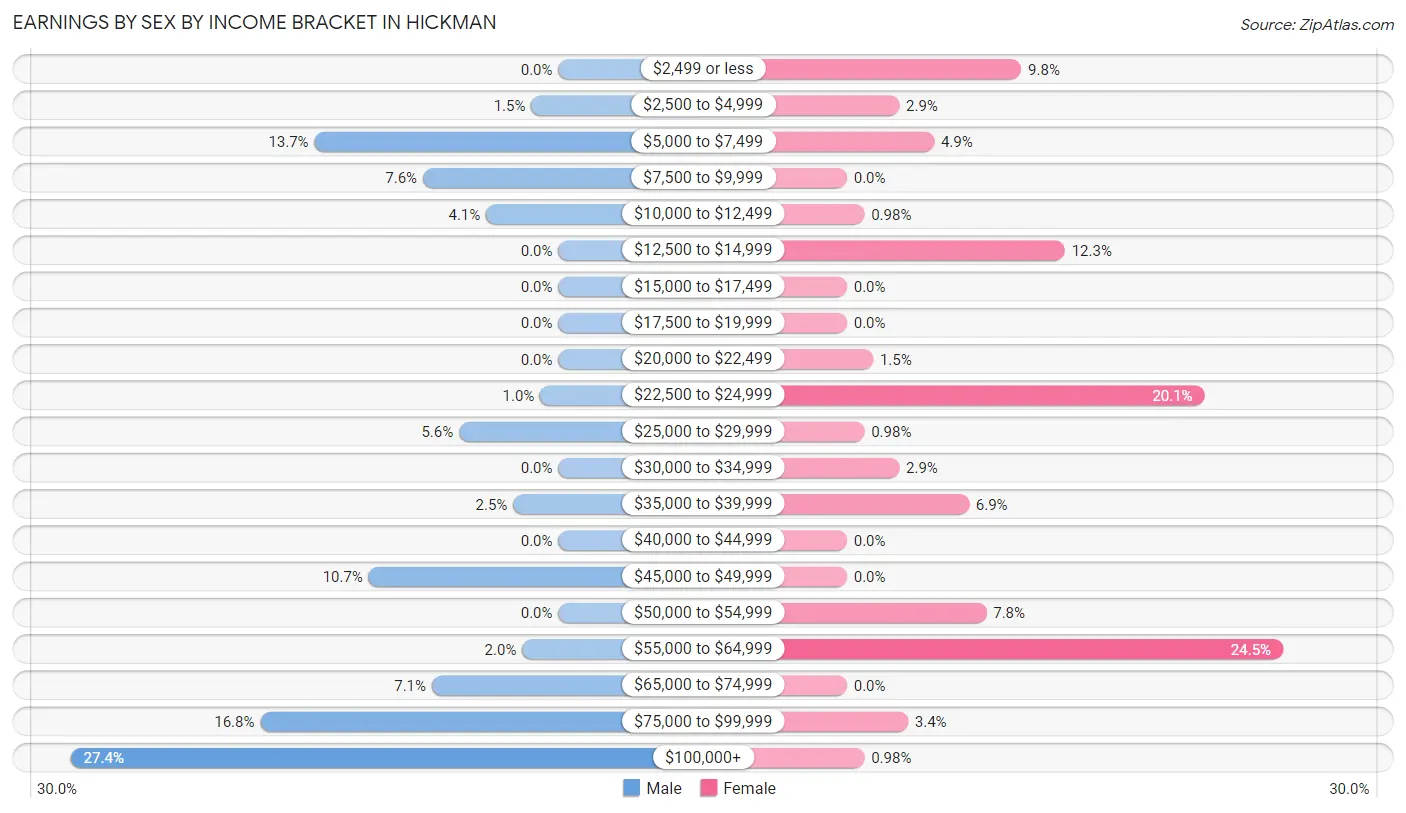
| Income | Male | Female |
| $2,499 or less | 0 (0.0%) | 20 (9.8%) |
| $2,500 to $4,999 | 3 (1.5%) | 6 (2.9%) |
| $5,000 to $7,499 | 27 (13.7%) | 10 (4.9%) |
| $7,500 to $9,999 | 15 (7.6%) | 0 (0.0%) |
| $10,000 to $12,499 | 8 (4.1%) | 2 (1.0%) |
| $12,500 to $14,999 | 0 (0.0%) | 25 (12.2%) |
| $15,000 to $17,499 | 0 (0.0%) | 0 (0.0%) |
| $17,500 to $19,999 | 0 (0.0%) | 0 (0.0%) |
| $20,000 to $22,499 | 0 (0.0%) | 3 (1.5%) |
| $22,500 to $24,999 | 2 (1.0%) | 41 (20.1%) |
| $25,000 to $29,999 | 11 (5.6%) | 2 (1.0%) |
| $30,000 to $34,999 | 0 (0.0%) | 6 (2.9%) |
| $35,000 to $39,999 | 5 (2.5%) | 14 (6.9%) |
| $40,000 to $44,999 | 0 (0.0%) | 0 (0.0%) |
| $45,000 to $49,999 | 21 (10.7%) | 0 (0.0%) |
| $50,000 to $54,999 | 0 (0.0%) | 16 (7.8%) |
| $55,000 to $64,999 | 4 (2.0%) | 50 (24.5%) |
| $65,000 to $74,999 | 14 (7.1%) | 0 (0.0%) |
| $75,000 to $99,999 | 33 (16.8%) | 7 (3.4%) |
| $100,000+ | 54 (27.4%) | 2 (1.0%) |
| Total | 197 (100.0%) | 204 (100.0%) |
Earnings by Sex by Educational Attainment in Hickman
Average earnings in Hickman are $69,107 for men and $36,364 for women, a difference of 47.4%. Men with an educational attainment of high school diploma enjoy the highest average annual earnings of $67,589, while those with high school diploma education earn the least with $67,589. Women with an educational attainment of college or associate's degree earn the most with the average annual earnings of $56,548, while those with college or associate's degree education have the smallest earnings of $56,548.
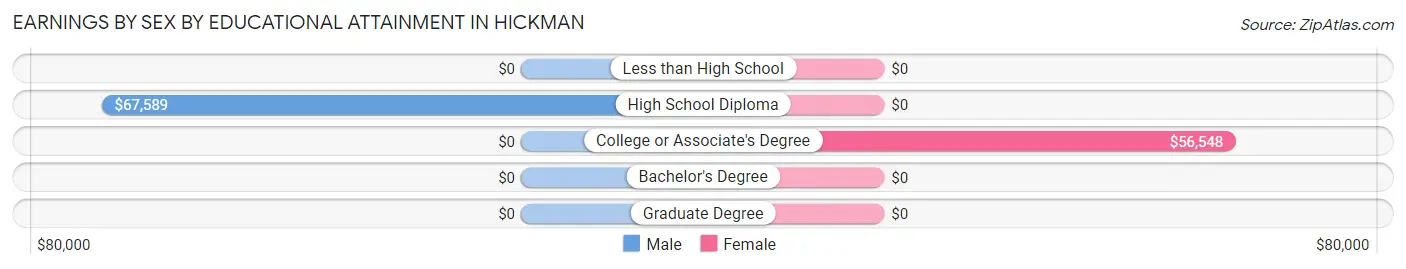
| Educational Attainment | Male Income | Female Income |
| Less than High School | - | - |
| High School Diploma | $67,589 | $0 |
| College or Associate's Degree | - | - |
| Bachelor's Degree | - | - |
| Graduate Degree | - | - |
| Total | $69,107 | $36,364 |
Family Income in Hickman
Family Income Brackets in Hickman
According to the Hickman family income data, there are 52 families falling into the $50,000 to $74,999 income range, which is the most common income bracket and makes up 24.6% of all families. Conversely, the $200,000+ income bracket is the least frequent group with only 2 families (0.9%) belonging to this category.
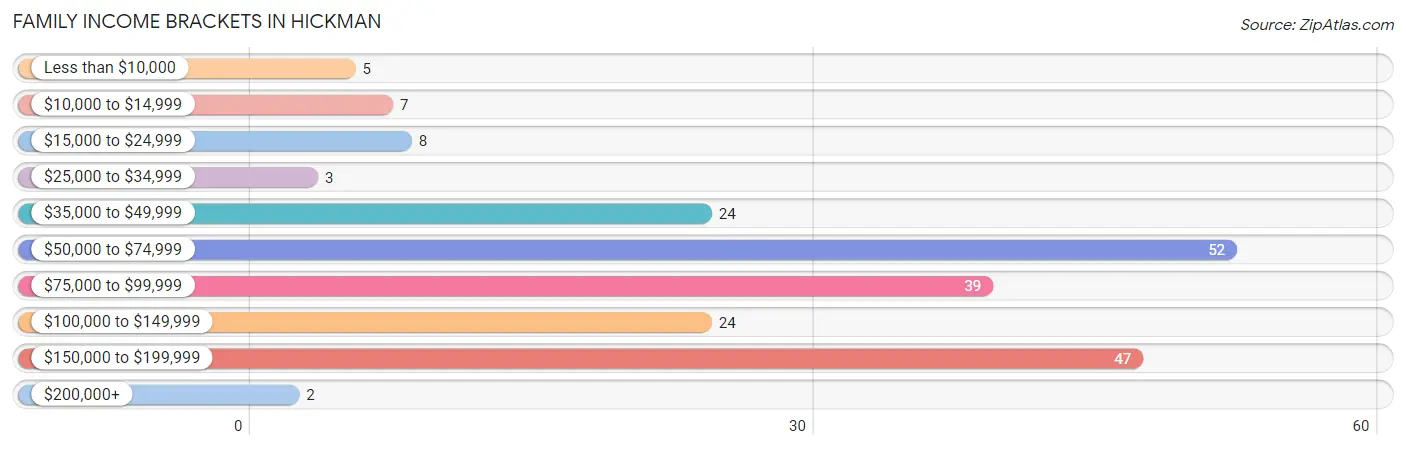
| Income Bracket | # Families | % Families |
| Less than $10,000 | 5 | 2.4% |
| $10,000 to $14,999 | 7 | 3.3% |
| $15,000 to $24,999 | 8 | 3.8% |
| $25,000 to $34,999 | 3 | 1.4% |
| $35,000 to $49,999 | 24 | 11.4% |
| $50,000 to $74,999 | 52 | 24.6% |
| $75,000 to $99,999 | 39 | 18.5% |
| $100,000 to $149,999 | 24 | 11.4% |
| $150,000 to $199,999 | 47 | 22.3% |
| $200,000+ | 2 | 0.9% |
Family Income by Famaliy Size in Hickman
3-person families (74 | 35.1%) account for the highest median family income in Hickman with $124,773 per family, while 3-person families (74 | 35.1%) have the highest median income of $41,591 per family member.
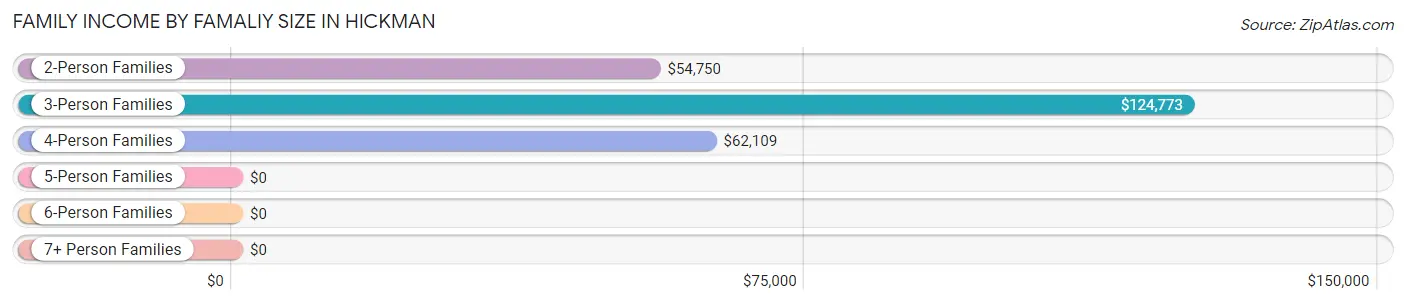
| Income Bracket | # Families | Median Income |
| 2-Person Families | 73 (34.6%) | $54,750 |
| 3-Person Families | 74 (35.1%) | $124,773 |
| 4-Person Families | 49 (23.2%) | $62,109 |
| 5-Person Families | 5 (2.4%) | $0 |
| 6-Person Families | 0 (0.0%) | $0 |
| 7+ Person Families | 10 (4.7%) | $0 |
| Total | 211 (100.0%) | $83,015 |
Family Income by Number of Earners in Hickman
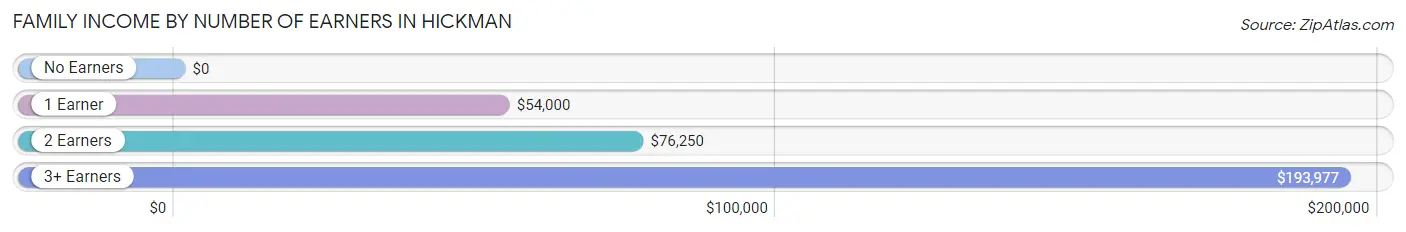
| Number of Earners | # Families | Median Income |
| No Earners | 26 (12.3%) | $0 |
| 1 Earner | 56 (26.5%) | $54,000 |
| 2 Earners | 97 (46.0%) | $76,250 |
| 3+ Earners | 32 (15.2%) | $193,977 |
| Total | 211 (100.0%) | $83,015 |
Household Income in Hickman
Household Income Brackets in Hickman
With 64 households falling in the category, the $50,000 to $74,999 income range is the most frequent in Hickman, accounting for 25.0% of all households.
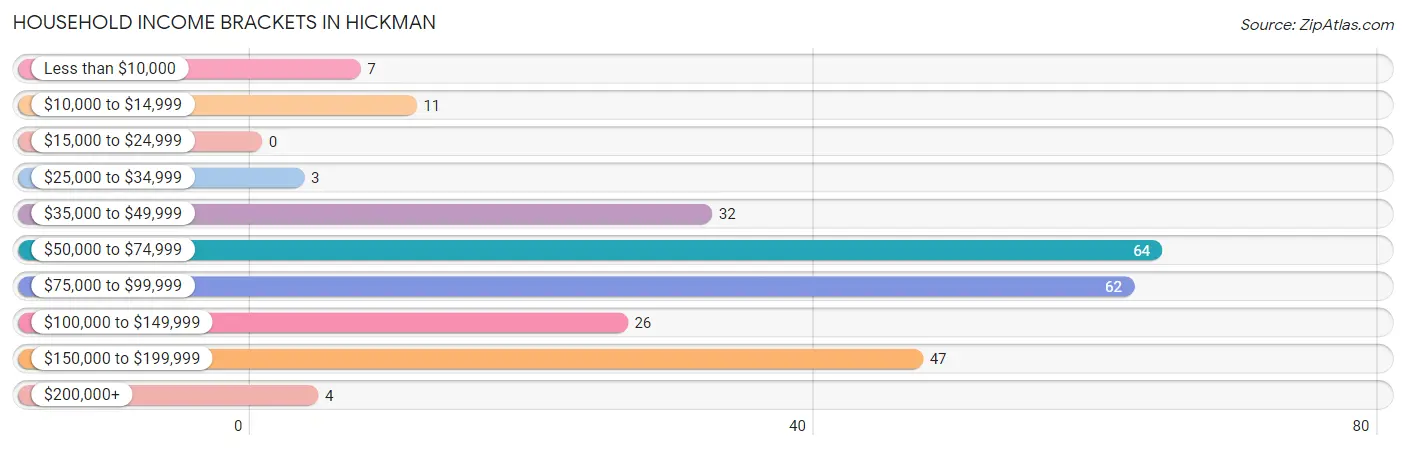
| Income Bracket | # Households | % Households |
| Less than $10,000 | 7 | 2.7% |
| $10,000 to $14,999 | 11 | 4.3% |
| $15,000 to $24,999 | 0 | 0.0% |
| $25,000 to $34,999 | 3 | 1.2% |
| $35,000 to $49,999 | 32 | 12.5% |
| $50,000 to $74,999 | 64 | 25.0% |
| $75,000 to $99,999 | 62 | 24.2% |
| $100,000 to $149,999 | 26 | 10.2% |
| $150,000 to $199,999 | 47 | 18.4% |
| $200,000+ | 4 | 1.6% |
Household Income by Householder Age in Hickman
The median household income in Hickman is $83,676, with the highest median household income of $91,115 found in the 45 to 64 years age bracket for the primary householder. A total of 139 households (54.3%) fall into this category.
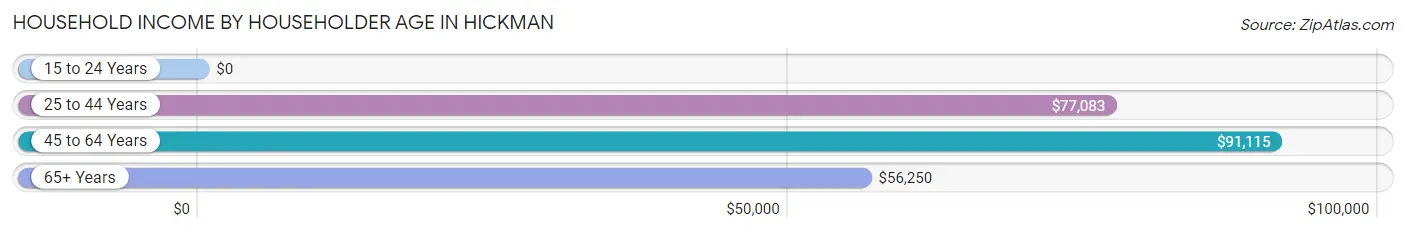
| Income Bracket | # Households | Median Income |
| 15 to 24 Years | 0 (0.0%) | $0 |
| 25 to 44 Years | 61 (23.8%) | $77,083 |
| 45 to 64 Years | 139 (54.3%) | $91,115 |
| 65+ Years | 56 (21.9%) | $56,250 |
| Total | 256 (100.0%) | $83,676 |
Poverty in Hickman
Income Below Poverty by Sex and Age in Hickman
With 7.6% poverty level for males and 6.6% for females among the residents of Hickman, under 5 year old males and 25 to 34 year old females are the most vulnerable to poverty, with 5 males (45.5%) and 4 females (18.2%) in their respective age groups living below the poverty level.
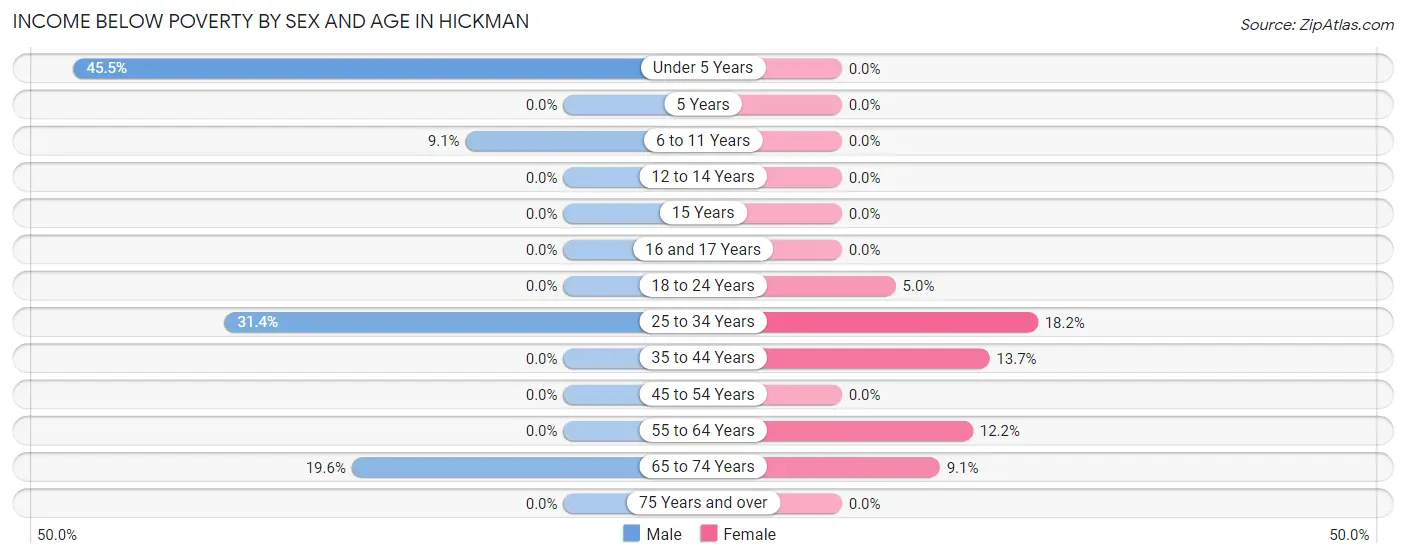
| Age Bracket | Male | Female |
| Under 5 Years | 5 (45.5%) | 0 (0.0%) |
| 5 Years | 0 (0.0%) | 0 (0.0%) |
| 6 to 11 Years | 2 (9.1%) | 0 (0.0%) |
| 12 to 14 Years | 0 (0.0%) | 0 (0.0%) |
| 15 Years | 0 (0.0%) | 0 (0.0%) |
| 16 and 17 Years | 0 (0.0%) | 0 (0.0%) |
| 18 to 24 Years | 0 (0.0%) | 3 (5.0%) |
| 25 to 34 Years | 11 (31.4%) | 4 (18.2%) |
| 35 to 44 Years | 0 (0.0%) | 10 (13.7%) |
| 45 to 54 Years | 0 (0.0%) | 0 (0.0%) |
| 55 to 64 Years | 0 (0.0%) | 9 (12.2%) |
| 65 to 74 Years | 11 (19.6%) | 2 (9.1%) |
| 75 Years and over | 0 (0.0%) | 0 (0.0%) |
| Total | 29 (7.6%) | 28 (6.6%) |
Income Above Poverty by Sex and Age in Hickman
According to the poverty statistics in Hickman, males aged 12 to 14 years and females aged under 5 years are the age groups that are most secure financially, with 100.0% of males and 100.0% of females in these age groups living above the poverty line.
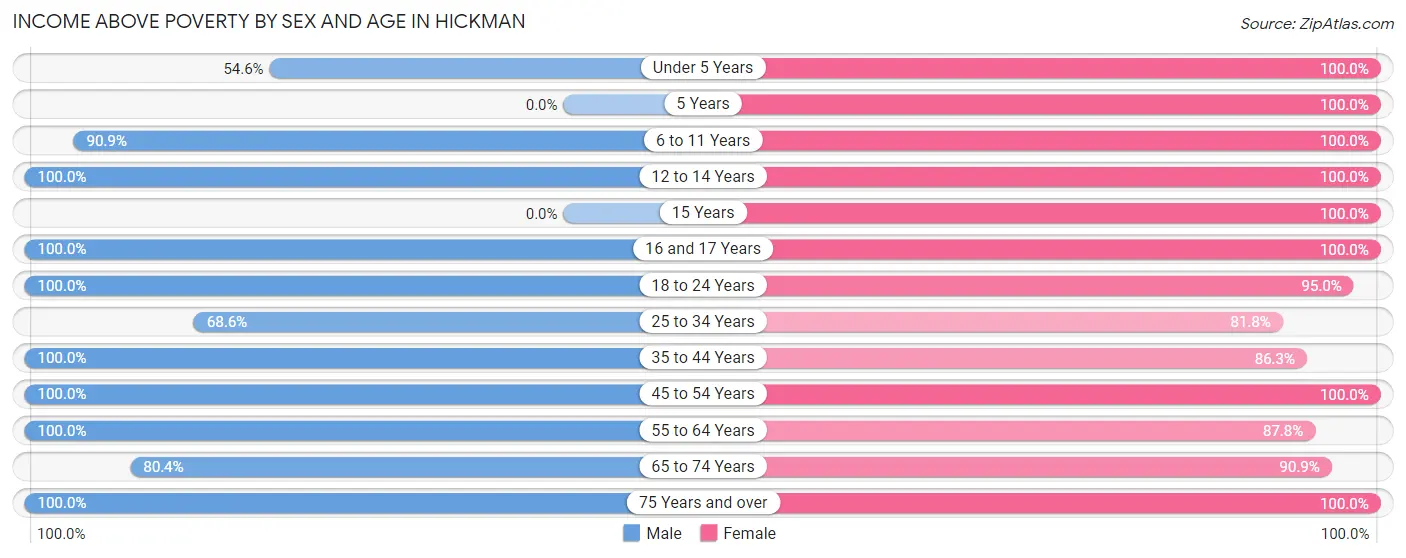
| Age Bracket | Male | Female |
| Under 5 Years | 6 (54.5%) | 2 (100.0%) |
| 5 Years | 0 (0.0%) | 2 (100.0%) |
| 6 to 11 Years | 20 (90.9%) | 17 (100.0%) |
| 12 to 14 Years | 20 (100.0%) | 50 (100.0%) |
| 15 Years | 0 (0.0%) | 11 (100.0%) |
| 16 and 17 Years | 13 (100.0%) | 19 (100.0%) |
| 18 to 24 Years | 32 (100.0%) | 57 (95.0%) |
| 25 to 34 Years | 24 (68.6%) | 18 (81.8%) |
| 35 to 44 Years | 62 (100.0%) | 63 (86.3%) |
| 45 to 54 Years | 81 (100.0%) | 55 (100.0%) |
| 55 to 64 Years | 46 (100.0%) | 65 (87.8%) |
| 65 to 74 Years | 45 (80.4%) | 20 (90.9%) |
| 75 Years and over | 2 (100.0%) | 15 (100.0%) |
| Total | 351 (92.4%) | 394 (93.4%) |
Income Below Poverty Among Married-Couple Families in Hickman
The poverty statistics for married-couple families in Hickman show that 3.0% or 5 of the total 165 families live below the poverty line. Families with 1 or 2 children have the highest poverty rate of 4.5%, comprising of 3 families. On the other hand, families with 3 or 4 children have the lowest poverty rate of 0.0%, which includes 0 families.
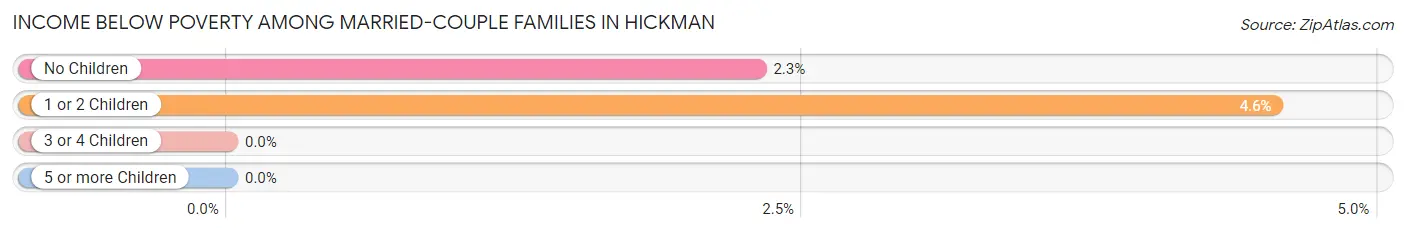
| Children | Above Poverty | Below Poverty |
| No Children | 85 (97.7%) | 2 (2.3%) |
| 1 or 2 Children | 63 (95.5%) | 3 (4.5%) |
| 3 or 4 Children | 10 (100.0%) | 0 (0.0%) |
| 5 or more Children | 2 (100.0%) | 0 (0.0%) |
| Total | 160 (97.0%) | 5 (3.0%) |
Income Below Poverty Among Single-Parent Households in Hickman
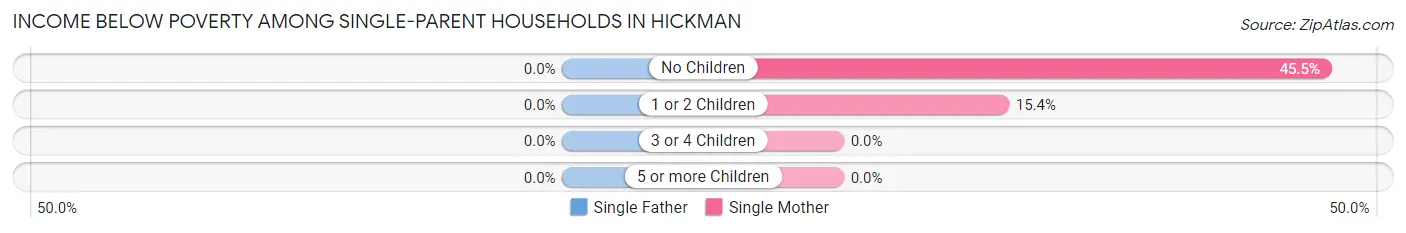
| Children | Single Father | Single Mother |
| No Children | 0 (0.0%) | 5 (45.5%) |
| 1 or 2 Children | 0 (0.0%) | 2 (15.4%) |
| 3 or 4 Children | 0 (0.0%) | 0 (0.0%) |
| 5 or more Children | 0 (0.0%) | 0 (0.0%) |
| Total | 0 (0.0%) | 7 (29.2%) |
Income Below Poverty Among Married-Couple vs Single-Parent Households in Hickman
The poverty data for Hickman shows that 5 of the married-couple family households (3.0%) and 7 of the single-parent households (15.2%) are living below the poverty level. Within the married-couple family households, those with 1 or 2 children have the highest poverty rate, with 3 households (4.5%) falling below the poverty line. Among the single-parent households, those with 1 or 2 children have the highest poverty rate, with 2 household (15.4%) living below poverty.
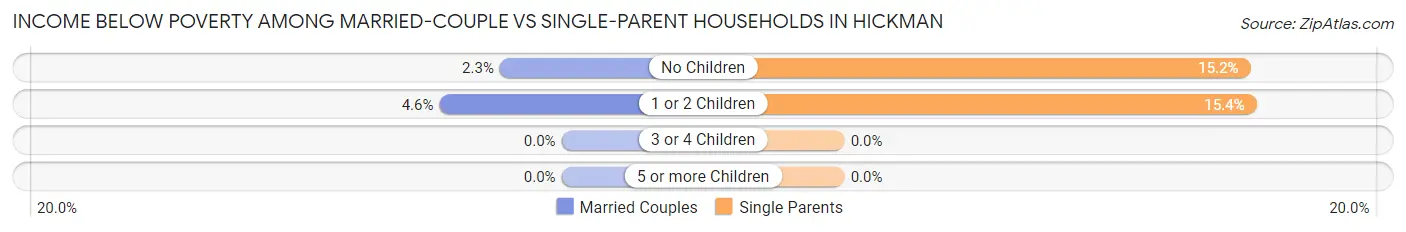
| Children | Married-Couple Families | Single-Parent Households |
| No Children | 2 (2.3%) | 5 (15.1%) |
| 1 or 2 Children | 3 (4.5%) | 2 (15.4%) |
| 3 or 4 Children | 0 (0.0%) | 0 (0.0%) |
| 5 or more Children | 0 (0.0%) | 0 (0.0%) |
| Total | 5 (3.0%) | 7 (15.2%) |
Race in Hickman
The most populous races in Hickman are White / Caucasian (543 | 67.0%), Hispanic or Latino (317 | 39.1%), and Two or more Races (159 | 19.6%).
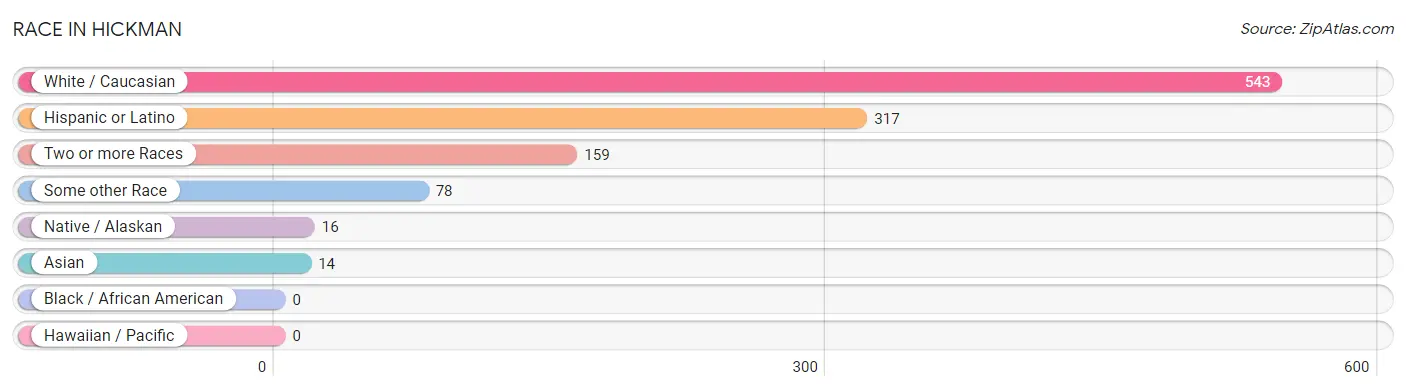
| Race | # Population | % Population |
| Asian | 14 | 1.7% |
| Black / African American | 0 | 0.0% |
| Hawaiian / Pacific | 0 | 0.0% |
| Hispanic or Latino | 317 | 39.1% |
| Native / Alaskan | 16 | 2.0% |
| White / Caucasian | 543 | 67.0% |
| Two or more Races | 159 | 19.6% |
| Some other Race | 78 | 9.6% |
| Total | 810 | 100.0% |
Ancestry in Hickman
The most populous ancestries reported in Hickman are Mexican (295 | 36.4%), English (115 | 14.2%), American (89 | 11.0%), Italian (54 | 6.7%), and Irish (48 | 5.9%), together accounting for 74.2% of all Hickman residents.
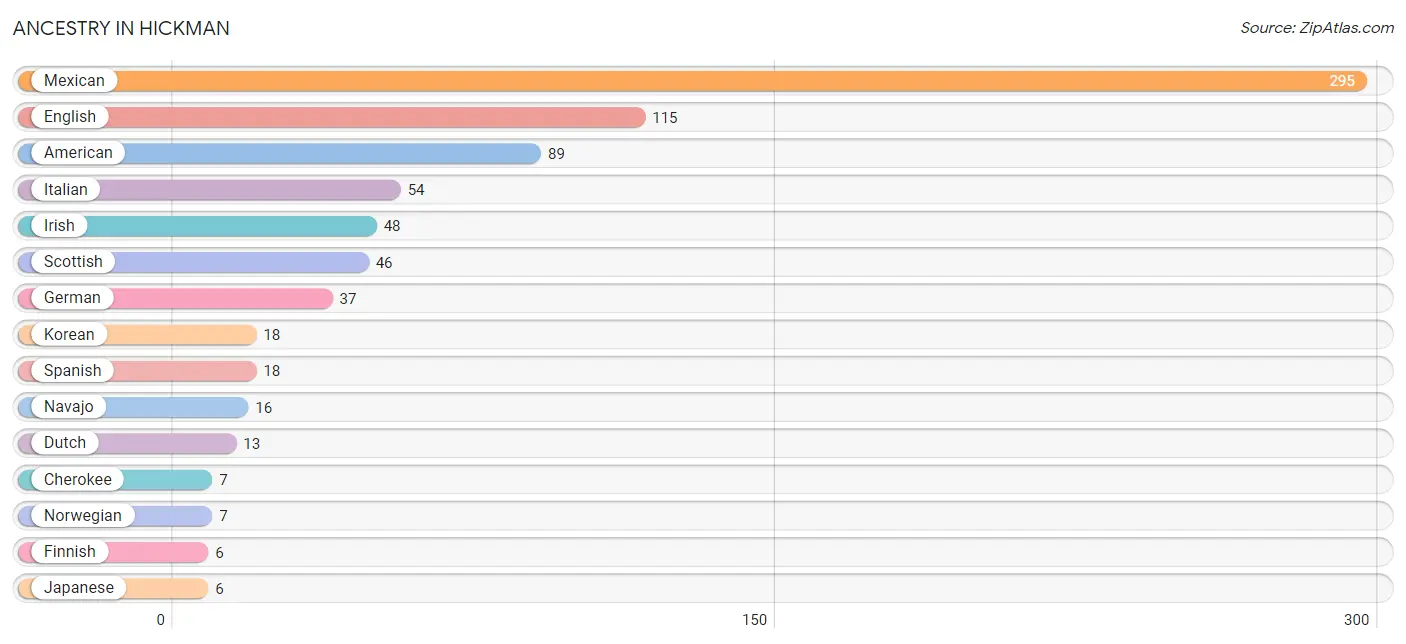
| Ancestry | # Population | % Population |
| American | 89 | 11.0% |
| Bhutanese | 4 | 0.5% |
| Cherokee | 7 | 0.9% |
| Choctaw | 5 | 0.6% |
| Dutch | 13 | 1.6% |
| English | 115 | 14.2% |
| Finnish | 6 | 0.7% |
| German | 37 | 4.6% |
| Irish | 48 | 5.9% |
| Italian | 54 | 6.7% |
| Japanese | 6 | 0.7% |
| Korean | 18 | 2.2% |
| Mexican | 295 | 36.4% |
| Navajo | 16 | 2.0% |
| Norwegian | 7 | 0.9% |
| Portuguese | 5 | 0.6% |
| Russian | 2 | 0.3% |
| Scandinavian | 2 | 0.3% |
| Scottish | 46 | 5.7% |
| Spaniard | 4 | 0.5% |
| Spanish | 18 | 2.2% |
| Swedish | 5 | 0.6% |
| Ukrainian | 4 | 0.5% | View All 23 Rows |
Immigrants in Hickman
The most numerous immigrant groups reported in Hickman came from Central America (112 | 13.8%), Latin America (112 | 13.8%), Mexico (112 | 13.8%), Asia (4 | 0.5%), and Eastern Europe (4 | 0.5%), together accounting for 42.5% of all Hickman residents.
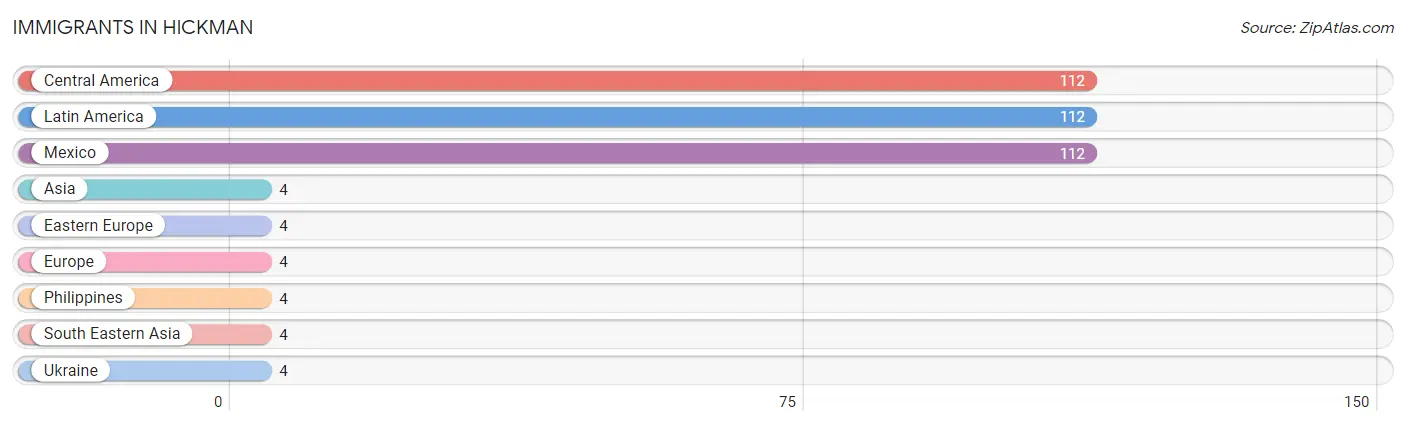
| Immigration Origin | # Population | % Population |
| Asia | 4 | 0.5% |
| Central America | 112 | 13.8% |
| Eastern Europe | 4 | 0.5% |
| Europe | 4 | 0.5% |
| Latin America | 112 | 13.8% |
| Mexico | 112 | 13.8% |
| Philippines | 4 | 0.5% |
| South Eastern Asia | 4 | 0.5% |
| Ukraine | 4 | 0.5% | View All 9 Rows |
Sex and Age in Hickman
Sex and Age in Hickman
The most populous age groups in Hickman are 50 to 54 Years (55 | 14.2%) for men and 40 to 44 Years (68 | 16.1%) for women.
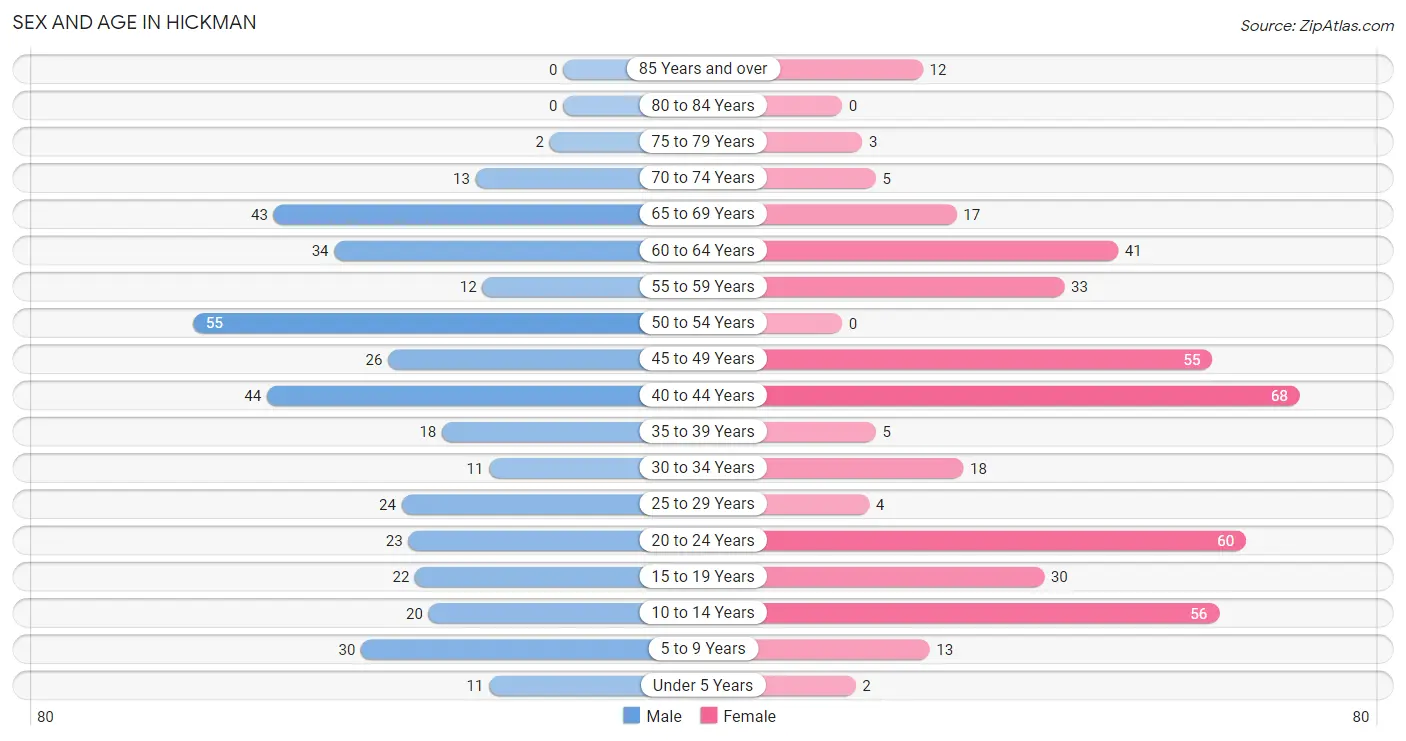
| Age Bracket | Male | Female |
| Under 5 Years | 11 (2.8%) | 2 (0.5%) |
| 5 to 9 Years | 30 (7.7%) | 13 (3.1%) |
| 10 to 14 Years | 20 (5.1%) | 56 (13.3%) |
| 15 to 19 Years | 22 (5.7%) | 30 (7.1%) |
| 20 to 24 Years | 23 (5.9%) | 60 (14.2%) |
| 25 to 29 Years | 24 (6.2%) | 4 (0.9%) |
| 30 to 34 Years | 11 (2.8%) | 18 (4.3%) |
| 35 to 39 Years | 18 (4.6%) | 5 (1.2%) |
| 40 to 44 Years | 44 (11.3%) | 68 (16.1%) |
| 45 to 49 Years | 26 (6.7%) | 55 (13.0%) |
| 50 to 54 Years | 55 (14.2%) | 0 (0.0%) |
| 55 to 59 Years | 12 (3.1%) | 33 (7.8%) |
| 60 to 64 Years | 34 (8.8%) | 41 (9.7%) |
| 65 to 69 Years | 43 (11.1%) | 17 (4.0%) |
| 70 to 74 Years | 13 (3.4%) | 5 (1.2%) |
| 75 to 79 Years | 2 (0.5%) | 3 (0.7%) |
| 80 to 84 Years | 0 (0.0%) | 0 (0.0%) |
| 85 Years and over | 0 (0.0%) | 12 (2.8%) |
| Total | 388 (100.0%) | 422 (100.0%) |
Families and Households in Hickman
Median Family Size in Hickman
The median family size in Hickman is 3.42 persons per family, with married-couple families (165 | 78.2%) accounting for the largest median family size of 3.64 persons per family. On the other hand, single female/mother families (24 | 11.4%) represent the smallest median family size with 2.29 persons per family.
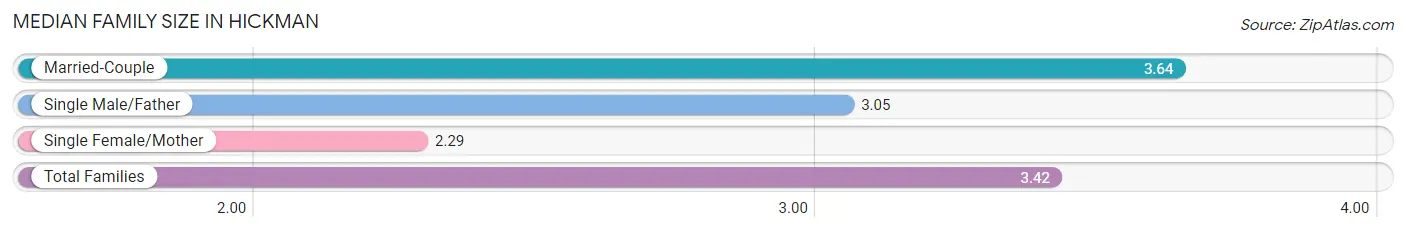
| Family Type | # Families | Family Size |
| Married-Couple | 165 (78.2%) | 3.64 |
| Single Male/Father | 22 (10.4%) | 3.05 |
| Single Female/Mother | 24 (11.4%) | 2.29 |
| Total Families | 211 (100.0%) | 3.42 |
Median Household Size in Hickman
The median household size in Hickman is 3.16 persons per household, with single male/father households (22 | 8.6%) accounting for the largest median household size of 4.64 persons per household. non-family households (45 | 17.6%) represent the smallest median household size with 1.13 persons per household.
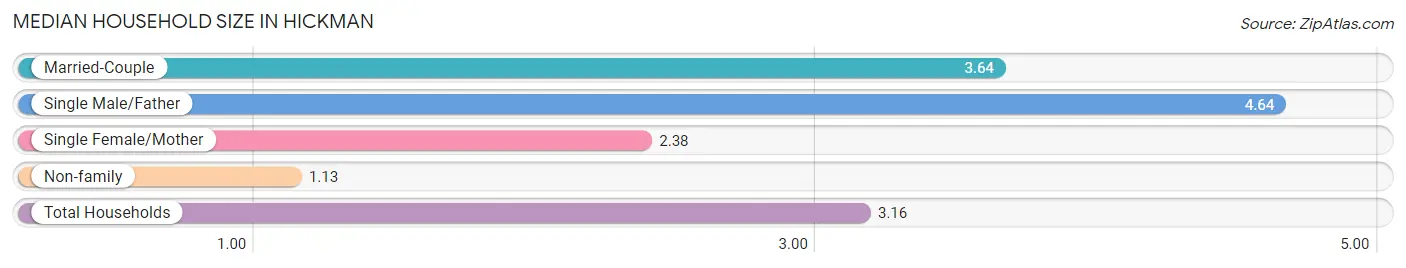
| Household Type | # Households | Household Size |
| Married-Couple | 165 (64.4%) | 3.64 |
| Single Male/Father | 22 (8.6%) | 4.64 |
| Single Female/Mother | 24 (9.4%) | 2.38 |
| Non-family | 45 (17.6%) | 1.13 |
| Total Households | 256 (100.0%) | 3.16 |
Household Size by Marriage Status in Hickman
Out of a total of 256 households in Hickman, 211 (82.4%) are family households, while 45 (17.6%) are nonfamily households. The most numerous type of family households are 3-person households, comprising 76, and the most common type of nonfamily households are 1-person households, comprising 38.
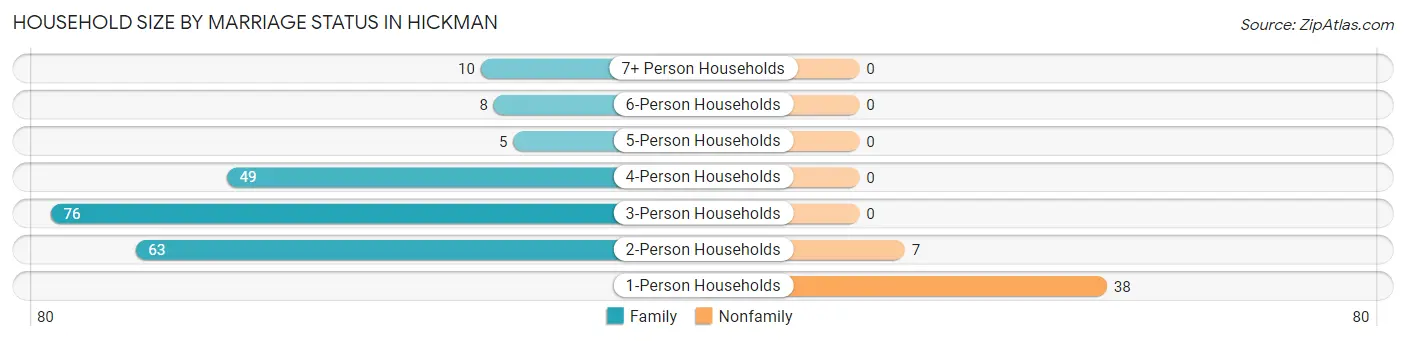
| Household Size | Family Households | Nonfamily Households |
| 1-Person Households | - | 38 (14.8%) |
| 2-Person Households | 63 (24.6%) | 7 (2.7%) |
| 3-Person Households | 76 (29.7%) | 0 (0.0%) |
| 4-Person Households | 49 (19.1%) | 0 (0.0%) |
| 5-Person Households | 5 (1.9%) | 0 (0.0%) |
| 6-Person Households | 8 (3.1%) | 0 (0.0%) |
| 7+ Person Households | 10 (3.9%) | 0 (0.0%) |
| Total | 211 (82.4%) | 45 (17.6%) |
Female Fertility in Hickman
Fertility by Age in Hickman
Average fertility rate in Hickman is 13.0 births per 1,000 women. Women in the age bracket of 20 to 34 years have the highest fertility rate with 37.0 births per 1,000 women. Women in the age bracket of 20 to 34 years acount for 100.0% of all women with births.
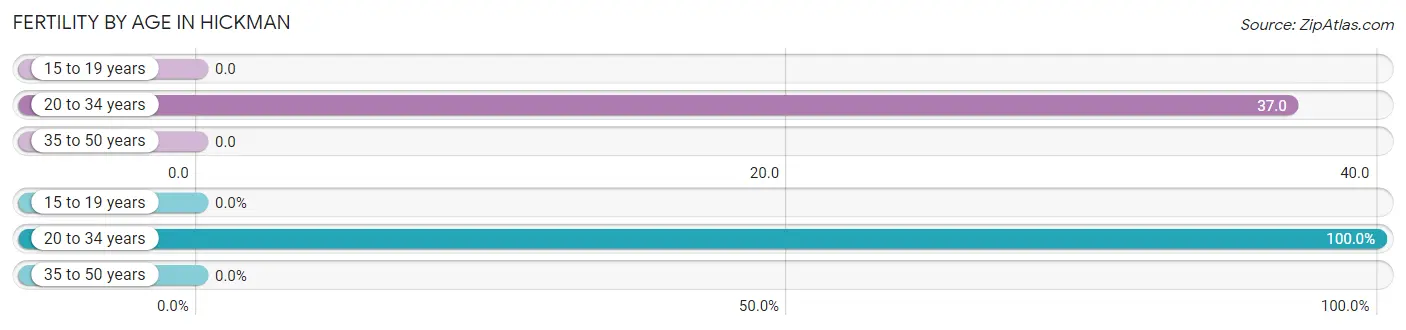
| Age Bracket | Women with Births | Births / 1,000 Women |
| 15 to 19 years | 0 (0.0%) | 0.0 |
| 20 to 34 years | 3 (100.0%) | 37.0 |
| 35 to 50 years | 0 (0.0%) | 0.0 |
| Total | 3 (100.0%) | 13.0 |
Fertility by Age by Marriage Status in Hickman
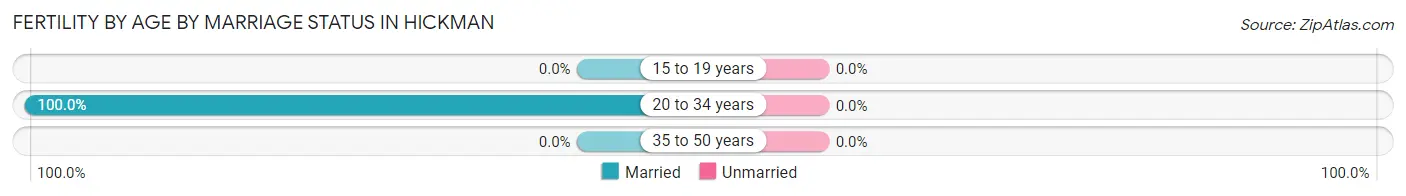
| Age Bracket | Married | Unmarried |
| 15 to 19 years | 0 (0.0%) | 0 (0.0%) |
| 20 to 34 years | 3 (100.0%) | 0 (0.0%) |
| 35 to 50 years | 0 (0.0%) | 0 (0.0%) |
| Total | 3 (100.0%) | 0 (0.0%) |
Fertility by Education in Hickman
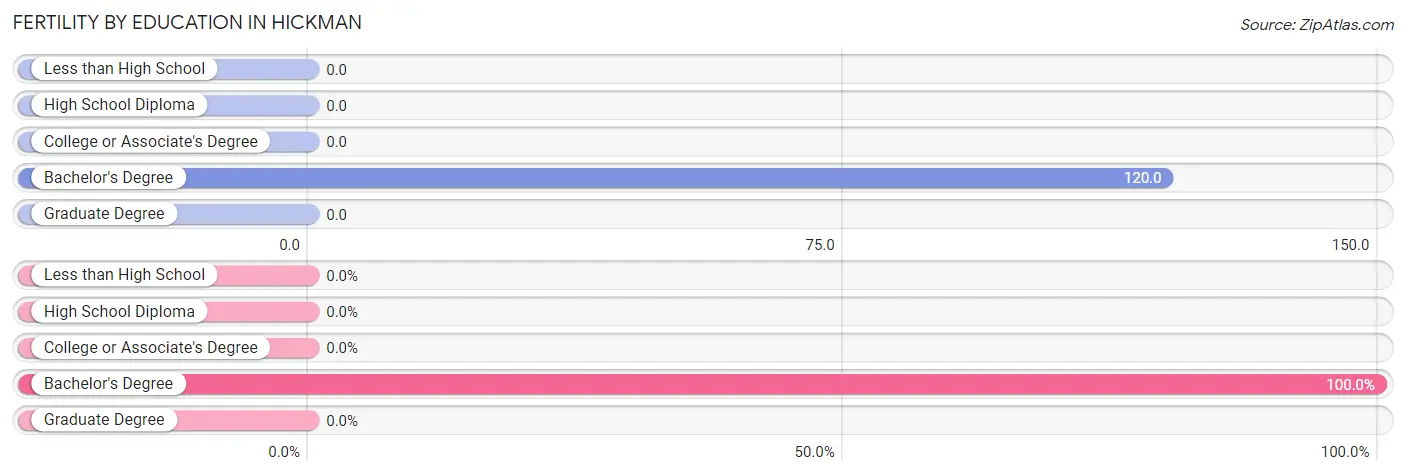
| Educational Attainment | Women with Births | Births / 1,000 Women |
| Less than High School | 0 (0.0%) | 0.0 |
| High School Diploma | 0 (0.0%) | 0.0 |
| College or Associate's Degree | 0 (0.0%) | 0.0 |
| Bachelor's Degree | 3 (100.0%) | 120.0 |
| Graduate Degree | 0 (0.0%) | 0.0 |
| Total | 3 (100.0%) | 13.0 |
Fertility by Education by Marriage Status in Hickman
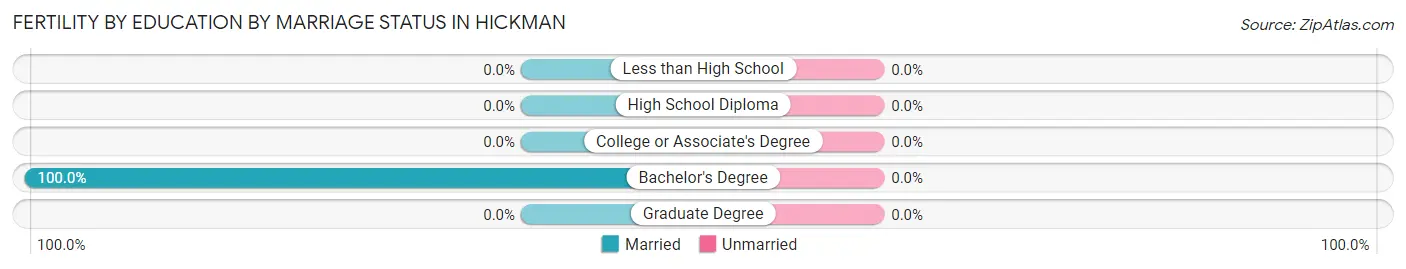
| Educational Attainment | Married | Unmarried |
| Less than High School | 0 (0.0%) | 0 (0.0%) |
| High School Diploma | 0 (0.0%) | 0 (0.0%) |
| College or Associate's Degree | 0 (0.0%) | 0 (0.0%) |
| Bachelor's Degree | 3 (100.0%) | 0 (0.0%) |
| Graduate Degree | 0 (0.0%) | 0 (0.0%) |
| Total | 3 (100.0%) | 0 (0.0%) |
Employment Characteristics in Hickman
Employment by Class of Employer in Hickman
Among the 375 employed individuals in Hickman, private company employees (183 | 48.8%), local government employees (71 | 18.9%), and not-for-profit organizations (50 | 13.3%) make up the most common classes of employment.
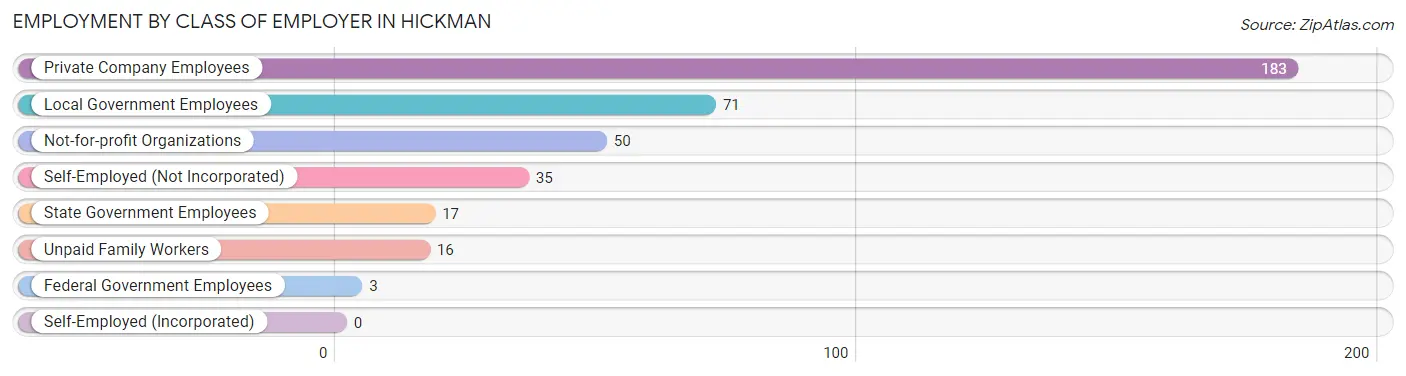
| Employer Class | # Employees | % Employees |
| Private Company Employees | 183 | 48.8% |
| Self-Employed (Incorporated) | 0 | 0.0% |
| Self-Employed (Not Incorporated) | 35 | 9.3% |
| Not-for-profit Organizations | 50 | 13.3% |
| Local Government Employees | 71 | 18.9% |
| State Government Employees | 17 | 4.5% |
| Federal Government Employees | 3 | 0.8% |
| Unpaid Family Workers | 16 | 4.3% |
| Total | 375 | 100.0% |
Employment Status by Age in Hickman
According to the labor force statistics for Hickman, out of the total population over 16 years of age (667), 70.3% or 469 individuals are in the labor force, with 17.7% or 83 of them unemployed. The age group with the highest labor force participation rate is 45 to 54 years, with 100.0% or 136 individuals in the labor force. Within the labor force, the 20 to 24 years age range has the highest percentage of unemployed individuals, with 36.5% or 19 of them being unemployed.
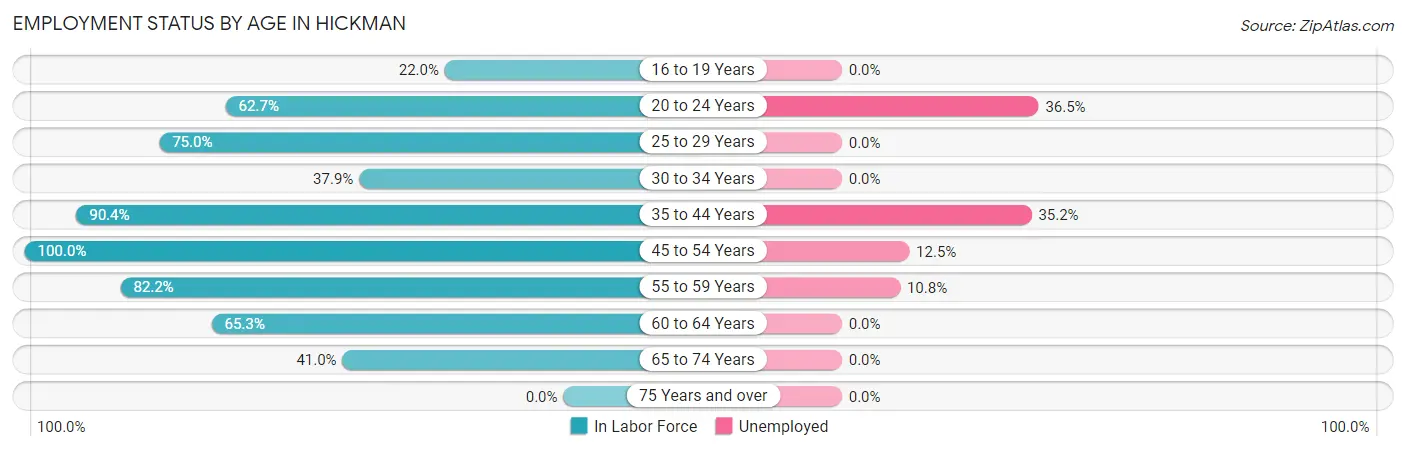
| Age Bracket | In Labor Force | Unemployed |
| 16 to 19 Years | 9 (22.0%) | 0 (0.0%) |
| 20 to 24 Years | 52 (62.7%) | 19 (36.5%) |
| 25 to 29 Years | 21 (75.0%) | 0 (0.0%) |
| 30 to 34 Years | 11 (37.9%) | 0 (0.0%) |
| 35 to 44 Years | 122 (90.4%) | 43 (35.2%) |
| 45 to 54 Years | 136 (100.0%) | 17 (12.5%) |
| 55 to 59 Years | 37 (82.2%) | 4 (10.8%) |
| 60 to 64 Years | 49 (65.3%) | 0 (0.0%) |
| 65 to 74 Years | 32 (41.0%) | 0 (0.0%) |
| 75 Years and over | 0 (0.0%) | 0 (0.0%) |
| Total | 469 (70.3%) | 83 (17.7%) |
Employment Status by Educational Attainment in Hickman
According to labor force statistics for Hickman, 83.9% of individuals (376) out of the total population between 25 and 64 years of age (448) are in the labor force, with 17.0% or 64 of them being unemployed. The group with the highest labor force participation rate are those with the educational attainment of bachelor's degree or higher, with 96.3% or 79 individuals in the labor force. Within the labor force, individuals with high school diploma education have the highest percentage of unemployment, with 31.9% or 52 of them being unemployed.
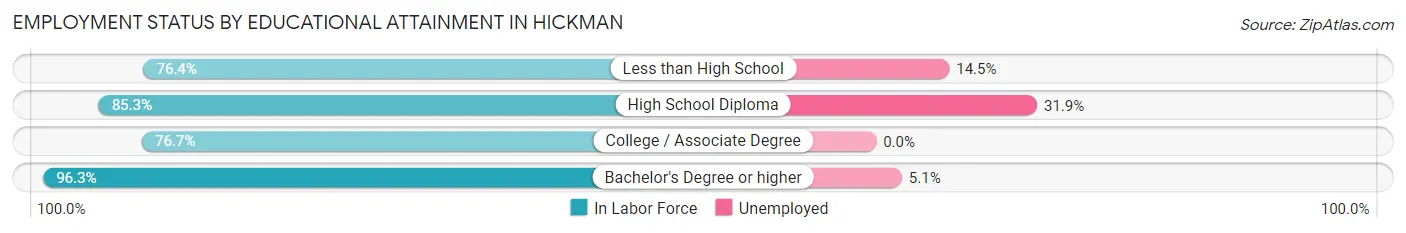
| Educational Attainment | In Labor Force | Unemployed |
| Less than High School | 55 (76.4%) | 10 (14.5%) |
| High School Diploma | 163 (85.3%) | 61 (31.9%) |
| College / Associate Degree | 79 (76.7%) | 0 (0.0%) |
| Bachelor's Degree or higher | 79 (96.3%) | 4 (5.1%) |
| Total | 376 (83.9%) | 76 (17.0%) |
Employment Occupations by Sex in Hickman
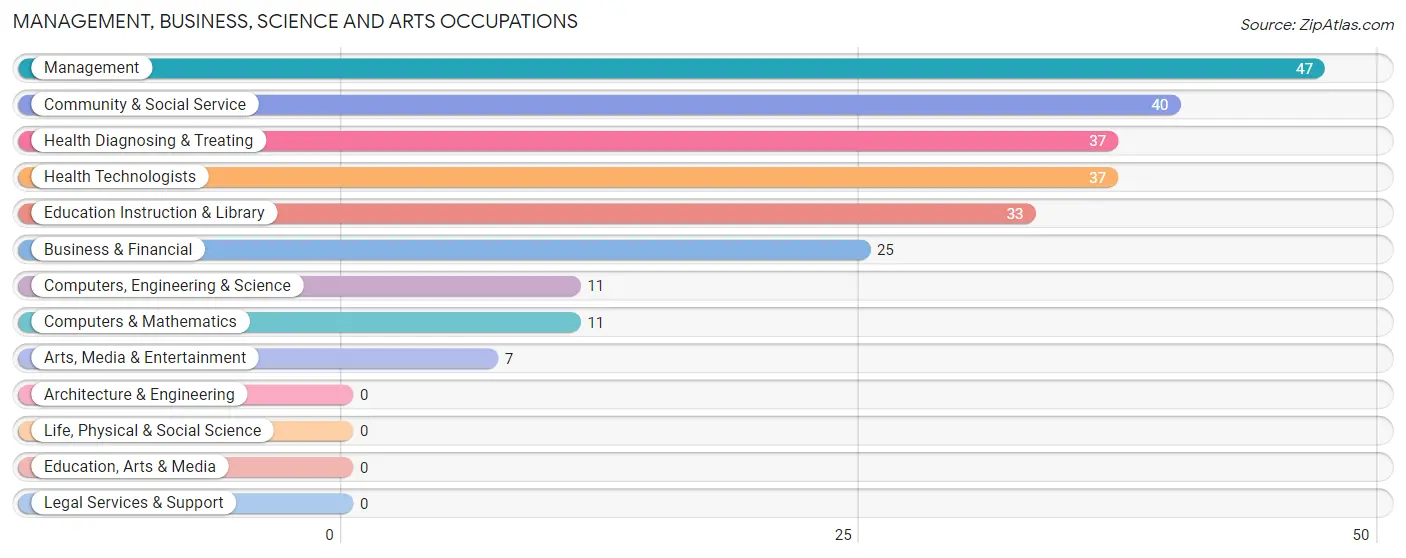
Management, Business, Science and Arts Occupations
The most common Management, Business, Science and Arts occupations in Hickman are Management (47 | 12.2%), Community & Social Service (40 | 10.4%), Health Diagnosing & Treating (37 | 9.6%), Health Technologists (37 | 9.6%), and Education Instruction & Library (33 | 8.6%).
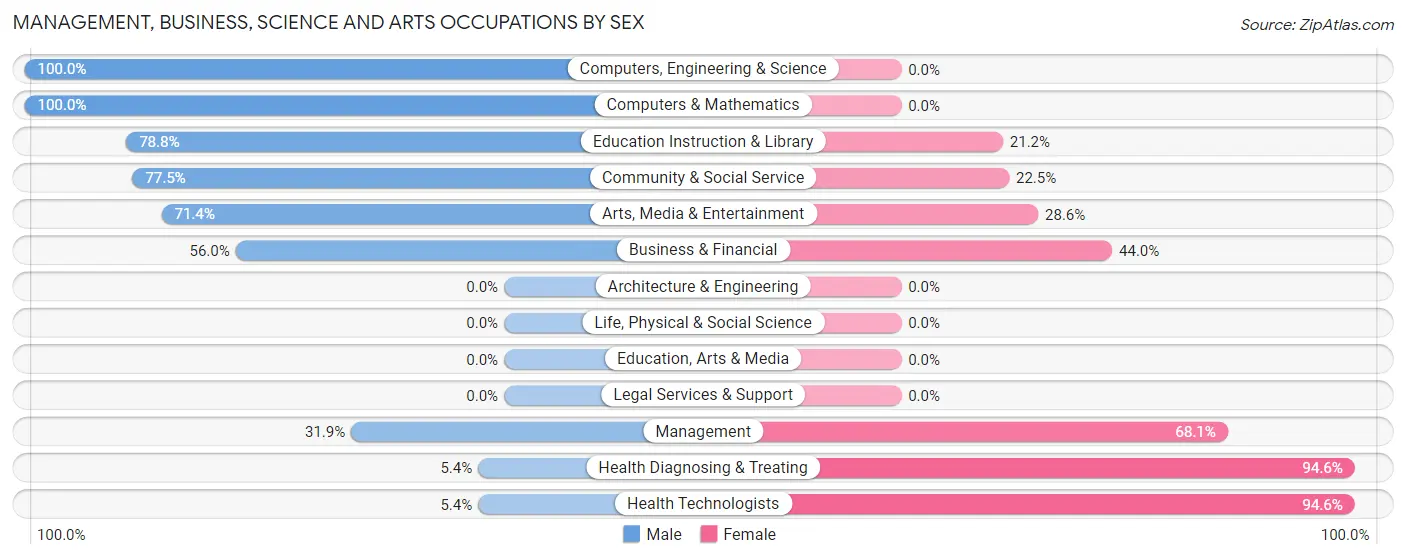
Management, Business, Science and Arts Occupations by Sex
Within the Management, Business, Science and Arts occupations in Hickman, the most male-oriented occupations are Computers, Engineering & Science (100.0%), Computers & Mathematics (100.0%), and Education Instruction & Library (78.8%), while the most female-oriented occupations are Health Diagnosing & Treating (94.6%), Health Technologists (94.6%), and Management (68.1%).
| Occupation | Male | Female |
| Management | 15 (31.9%) | 32 (68.1%) |
| Business & Financial | 14 (56.0%) | 11 (44.0%) |
| Computers, Engineering & Science | 11 (100.0%) | 0 (0.0%) |
| Computers & Mathematics | 11 (100.0%) | 0 (0.0%) |
| Architecture & Engineering | 0 (0.0%) | 0 (0.0%) |
| Life, Physical & Social Science | 0 (0.0%) | 0 (0.0%) |
| Community & Social Service | 31 (77.5%) | 9 (22.5%) |
| Education, Arts & Media | 0 (0.0%) | 0 (0.0%) |
| Legal Services & Support | 0 (0.0%) | 0 (0.0%) |
| Education Instruction & Library | 26 (78.8%) | 7 (21.2%) |
| Arts, Media & Entertainment | 5 (71.4%) | 2 (28.6%) |
| Health Diagnosing & Treating | 2 (5.4%) | 35 (94.6%) |
| Health Technologists | 2 (5.4%) | 35 (94.6%) |
| Total (Category) | 73 (45.6%) | 87 (54.4%) |
| Total (Overall) | 197 (51.0%) | 189 (49.0%) |
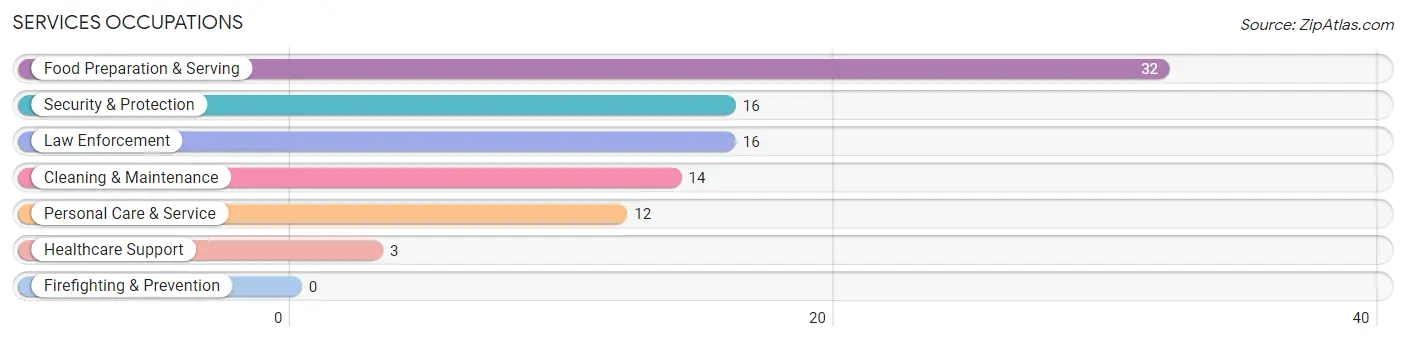
Services Occupations
The most common Services occupations in Hickman are Food Preparation & Serving (32 | 8.3%), Security & Protection (16 | 4.2%), Law Enforcement (16 | 4.2%), Cleaning & Maintenance (14 | 3.6%), and Personal Care & Service (12 | 3.1%).
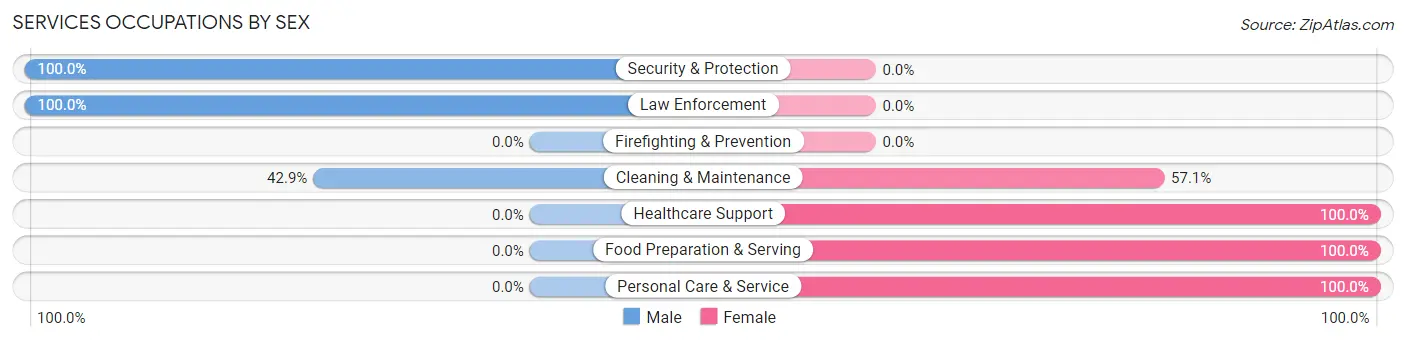
Services Occupations by Sex
Within the Services occupations in Hickman, the most male-oriented occupations are Security & Protection (100.0%), Law Enforcement (100.0%), and Cleaning & Maintenance (42.9%), while the most female-oriented occupations are Healthcare Support (100.0%), Food Preparation & Serving (100.0%), and Personal Care & Service (100.0%).
| Occupation | Male | Female |
| Healthcare Support | 0 (0.0%) | 3 (100.0%) |
| Security & Protection | 16 (100.0%) | 0 (0.0%) |
| Firefighting & Prevention | 0 (0.0%) | 0 (0.0%) |
| Law Enforcement | 16 (100.0%) | 0 (0.0%) |
| Food Preparation & Serving | 0 (0.0%) | 32 (100.0%) |
| Cleaning & Maintenance | 6 (42.9%) | 8 (57.1%) |
| Personal Care & Service | 0 (0.0%) | 12 (100.0%) |
| Total (Category) | 22 (28.6%) | 55 (71.4%) |
| Total (Overall) | 197 (51.0%) | 189 (49.0%) |
Sales and Office Occupations
The most common Sales and Office occupations in Hickman are Office & Administration (44 | 11.4%), and Sales & Related (5 | 1.3%).
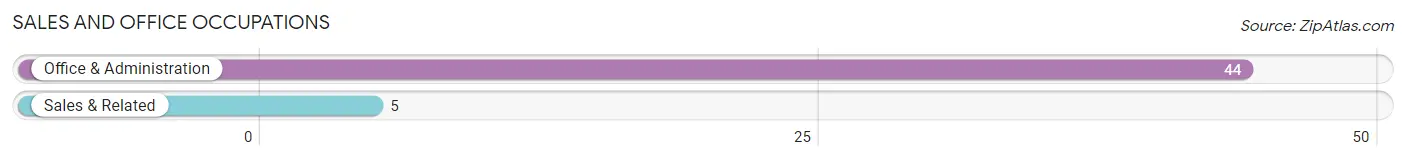
Sales and Office Occupations by Sex
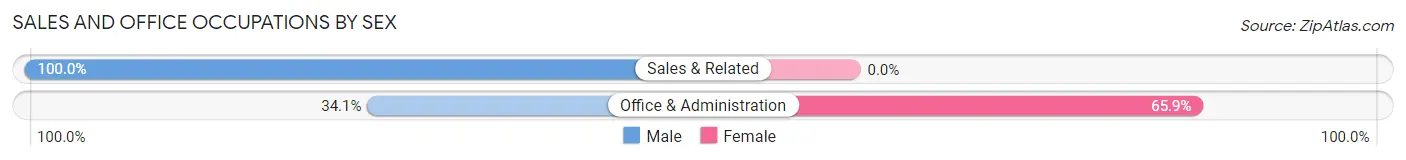
| Occupation | Male | Female |
| Sales & Related | 5 (100.0%) | 0 (0.0%) |
| Office & Administration | 15 (34.1%) | 29 (65.9%) |
| Total (Category) | 20 (40.8%) | 29 (59.2%) |
| Total (Overall) | 197 (51.0%) | 189 (49.0%) |
Natural Resources, Construction and Maintenance Occupations
The most common Natural Resources, Construction and Maintenance occupations in Hickman are Construction & Extraction (38 | 9.8%), and Farming, Fishing & Forestry (20 | 5.2%).
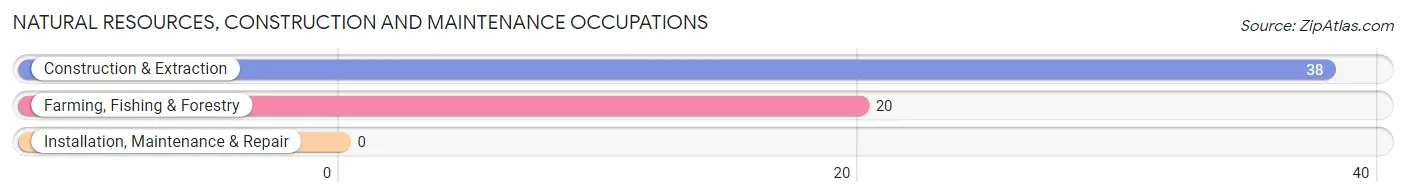
Natural Resources, Construction and Maintenance Occupations by Sex
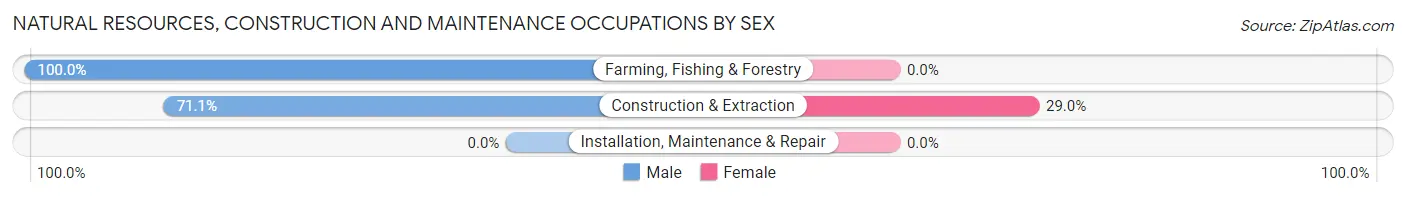
| Occupation | Male | Female |
| Farming, Fishing & Forestry | 20 (100.0%) | 0 (0.0%) |
| Construction & Extraction | 27 (71.1%) | 11 (28.9%) |
| Installation, Maintenance & Repair | 0 (0.0%) | 0 (0.0%) |
| Total (Category) | 47 (81.0%) | 11 (19.0%) |
| Total (Overall) | 197 (51.0%) | 189 (49.0%) |
Production, Transportation and Moving Occupations
The most common Production, Transportation and Moving occupations in Hickman are Transportation (27 | 7.0%), Production (12 | 3.1%), and Material Moving (3 | 0.8%).
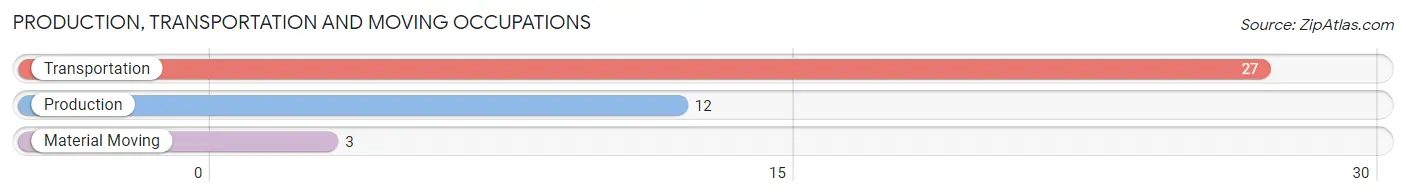
Production, Transportation and Moving Occupations by Sex
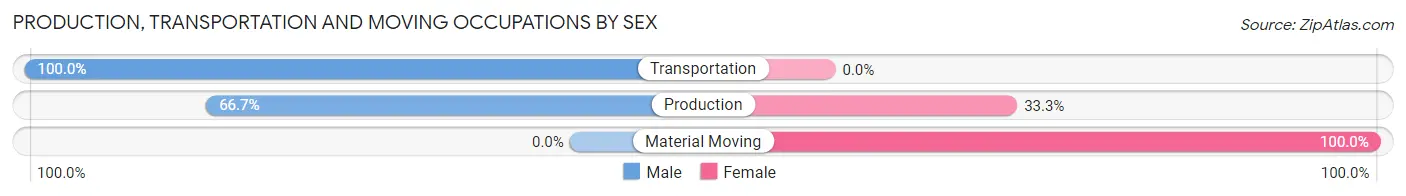
| Occupation | Male | Female |
| Production | 8 (66.7%) | 4 (33.3%) |
| Transportation | 27 (100.0%) | 0 (0.0%) |
| Material Moving | 0 (0.0%) | 3 (100.0%) |
| Total (Category) | 35 (83.3%) | 7 (16.7%) |
| Total (Overall) | 197 (51.0%) | 189 (49.0%) |
Employment Industries by Sex in Hickman
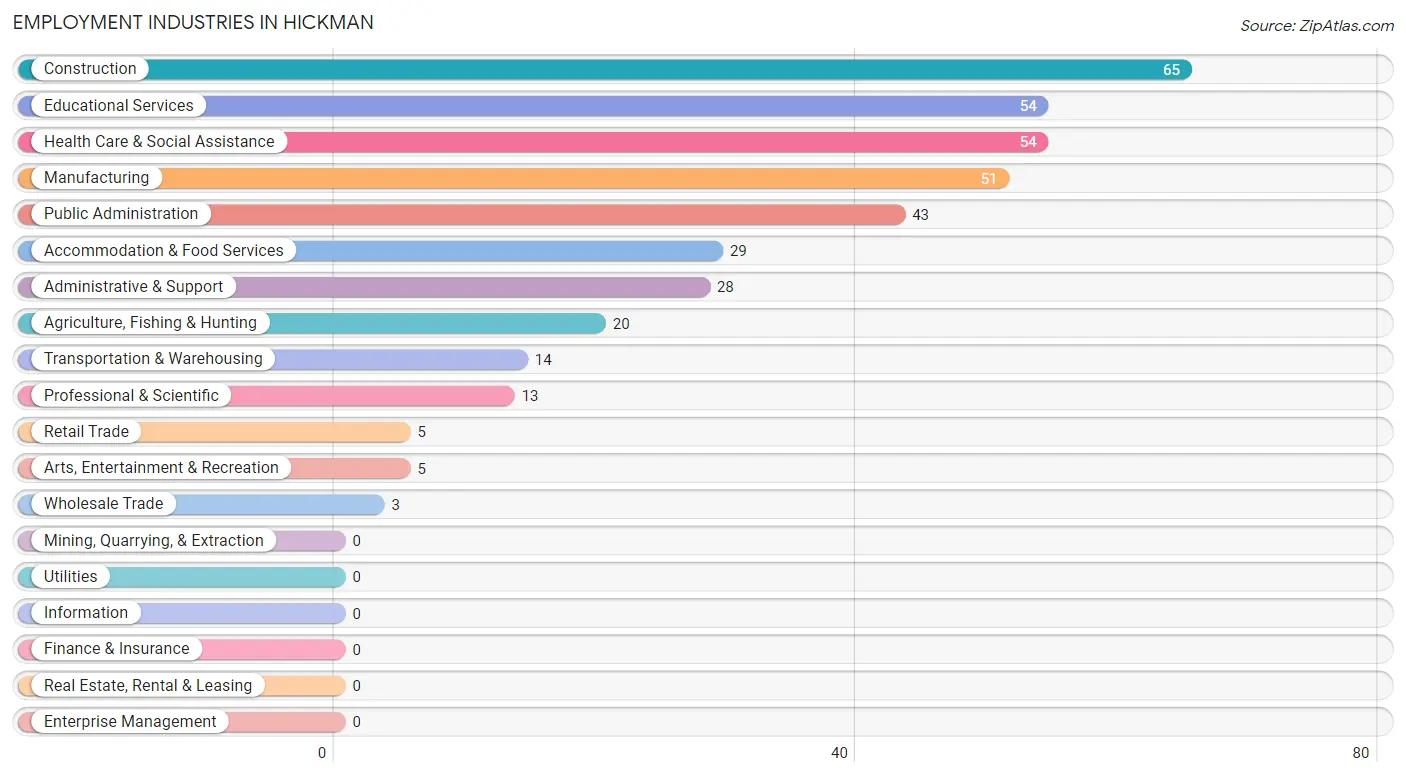
Employment Industries in Hickman
The major employment industries in Hickman include Construction (65 | 16.8%), Educational Services (54 | 14.0%), Health Care & Social Assistance (54 | 14.0%), Manufacturing (51 | 13.2%), and Public Administration (43 | 11.1%).
Employment Industries by Sex in Hickman
The Hickman industries that see more men than women are Agriculture, Fishing & Hunting (100.0%), Wholesale Trade (100.0%), and Retail Trade (100.0%), whereas the industries that tend to have a higher number of women are Health Care & Social Assistance (96.3%), Accommodation & Food Services (89.7%), and Professional & Scientific (69.2%).
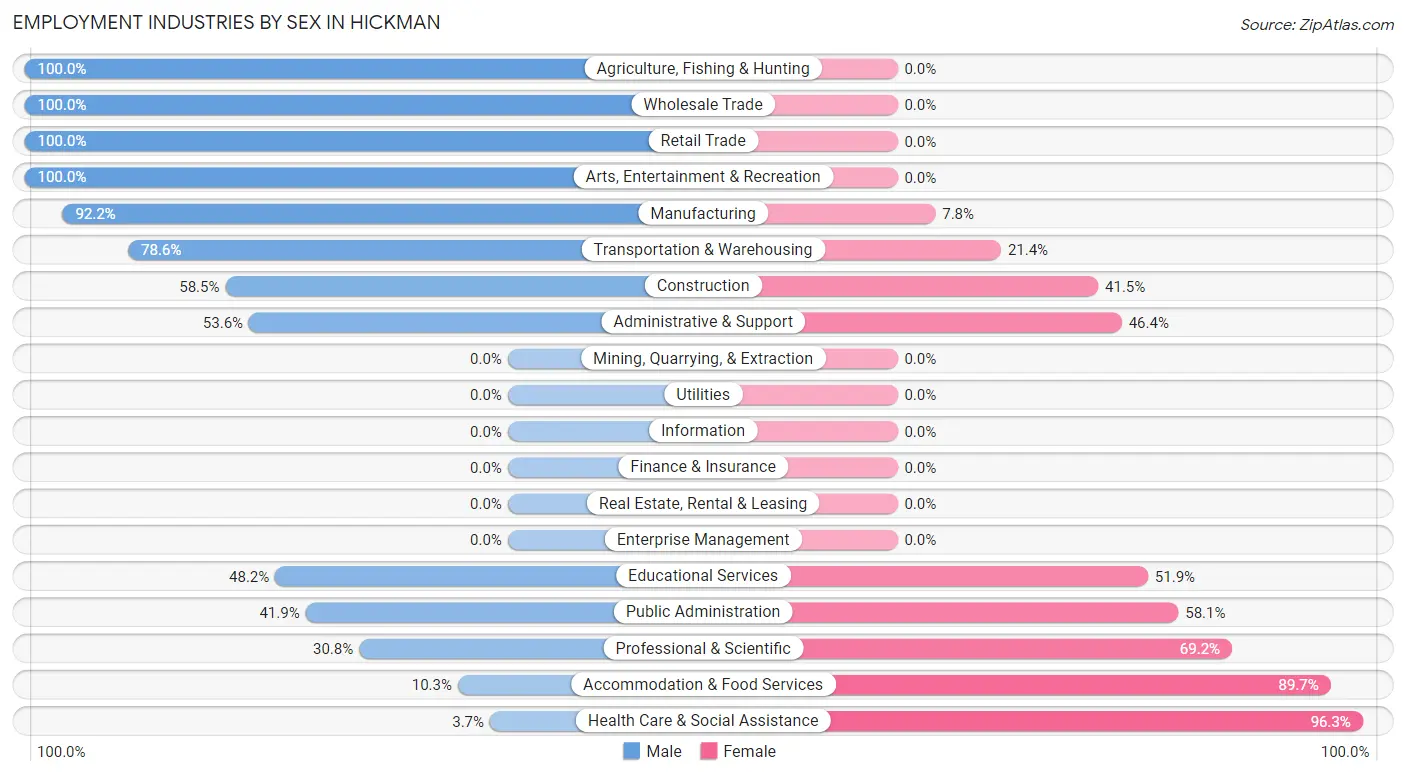
| Industry | Male | Female |
| Agriculture, Fishing & Hunting | 20 (100.0%) | 0 (0.0%) |
| Mining, Quarrying, & Extraction | 0 (0.0%) | 0 (0.0%) |
| Construction | 38 (58.5%) | 27 (41.5%) |
| Manufacturing | 47 (92.2%) | 4 (7.8%) |
| Wholesale Trade | 3 (100.0%) | 0 (0.0%) |
| Retail Trade | 5 (100.0%) | 0 (0.0%) |
| Transportation & Warehousing | 11 (78.6%) | 3 (21.4%) |
| Utilities | 0 (0.0%) | 0 (0.0%) |
| Information | 0 (0.0%) | 0 (0.0%) |
| Finance & Insurance | 0 (0.0%) | 0 (0.0%) |
| Real Estate, Rental & Leasing | 0 (0.0%) | 0 (0.0%) |
| Professional & Scientific | 4 (30.8%) | 9 (69.2%) |
| Enterprise Management | 0 (0.0%) | 0 (0.0%) |
| Administrative & Support | 15 (53.6%) | 13 (46.4%) |
| Educational Services | 26 (48.1%) | 28 (51.8%) |
| Health Care & Social Assistance | 2 (3.7%) | 52 (96.3%) |
| Arts, Entertainment & Recreation | 5 (100.0%) | 0 (0.0%) |
| Accommodation & Food Services | 3 (10.3%) | 26 (89.7%) |
| Public Administration | 18 (41.9%) | 25 (58.1%) |
| Total | 197 (51.0%) | 189 (49.0%) |
Education in Hickman
School Enrollment in Hickman
The most common levels of schooling among the 281 students in Hickman are high school (80 | 28.5%), college / undergraduate (79 | 28.1%), and middle school (53 | 18.9%).
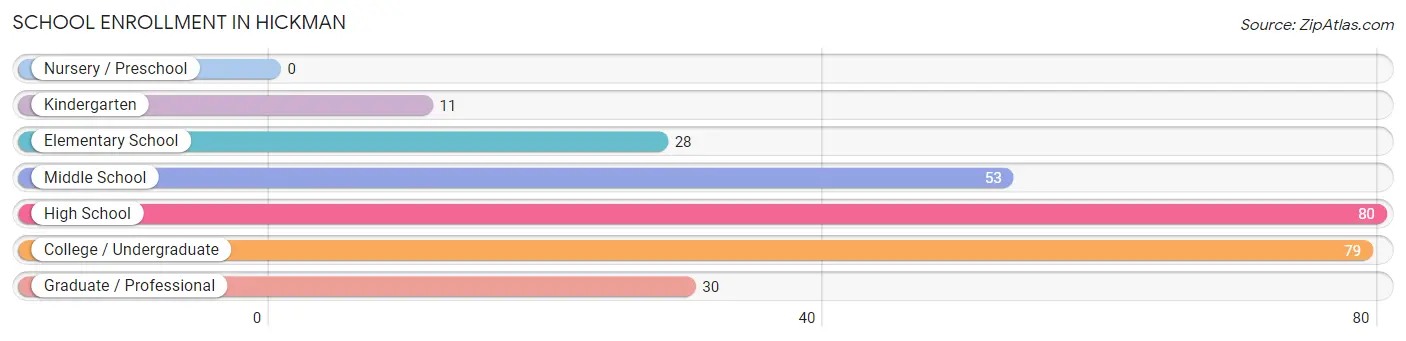
| School Level | # Students | % Students |
| Nursery / Preschool | 0 | 0.0% |
| Kindergarten | 11 | 3.9% |
| Elementary School | 28 | 10.0% |
| Middle School | 53 | 18.9% |
| High School | 80 | 28.5% |
| College / Undergraduate | 79 | 28.1% |
| Graduate / Professional | 30 | 10.7% |
| Total | 281 | 100.0% |
School Enrollment by Age by Funding Source in Hickman
Out of a total of 281 students who are enrolled in schools in Hickman, 31 (11.0%) attend a private institution, while the remaining 250 (89.0%) are enrolled in public schools. The age group of 25 to 34 year olds has the highest likelihood of being enrolled in private schools, with 14 (43.8% in the age bracket) enrolled. Conversely, the age group of 5 to 9 year old has the lowest likelihood of being enrolled in a private school, with 39 (100.0% in the age bracket) attending a public institution.
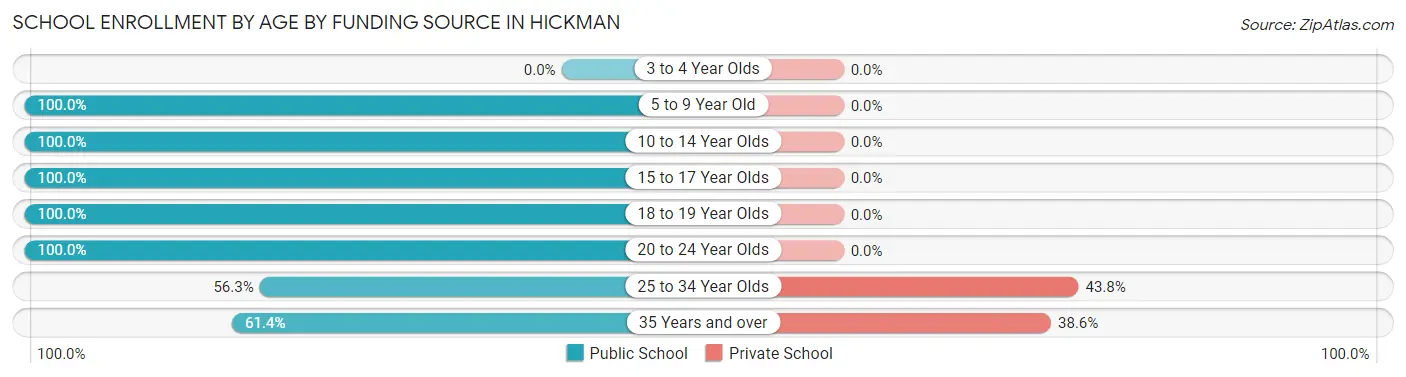
| Age Bracket | Public School | Private School |
| 3 to 4 Year Olds | 0 (0.0%) | 0 (0.0%) |
| 5 to 9 Year Old | 39 (100.0%) | 0 (0.0%) |
| 10 to 14 Year Olds | 76 (100.0%) | 0 (0.0%) |
| 15 to 17 Year Olds | 43 (100.0%) | 0 (0.0%) |
| 18 to 19 Year Olds | 9 (100.0%) | 0 (0.0%) |
| 20 to 24 Year Olds | 38 (100.0%) | 0 (0.0%) |
| 25 to 34 Year Olds | 18 (56.2%) | 14 (43.8%) |
| 35 Years and over | 27 (61.4%) | 17 (38.6%) |
| Total | 250 (89.0%) | 31 (11.0%) |
Educational Attainment by Field of Study in Hickman
Education (40 | 41.7%), science & technology (20 | 20.8%), arts & humanities (15 | 15.6%), social sciences (11 | 11.5%), and business (3 | 3.1%) are the most common fields of study among 96 individuals in Hickman who have obtained a bachelor's degree or higher.
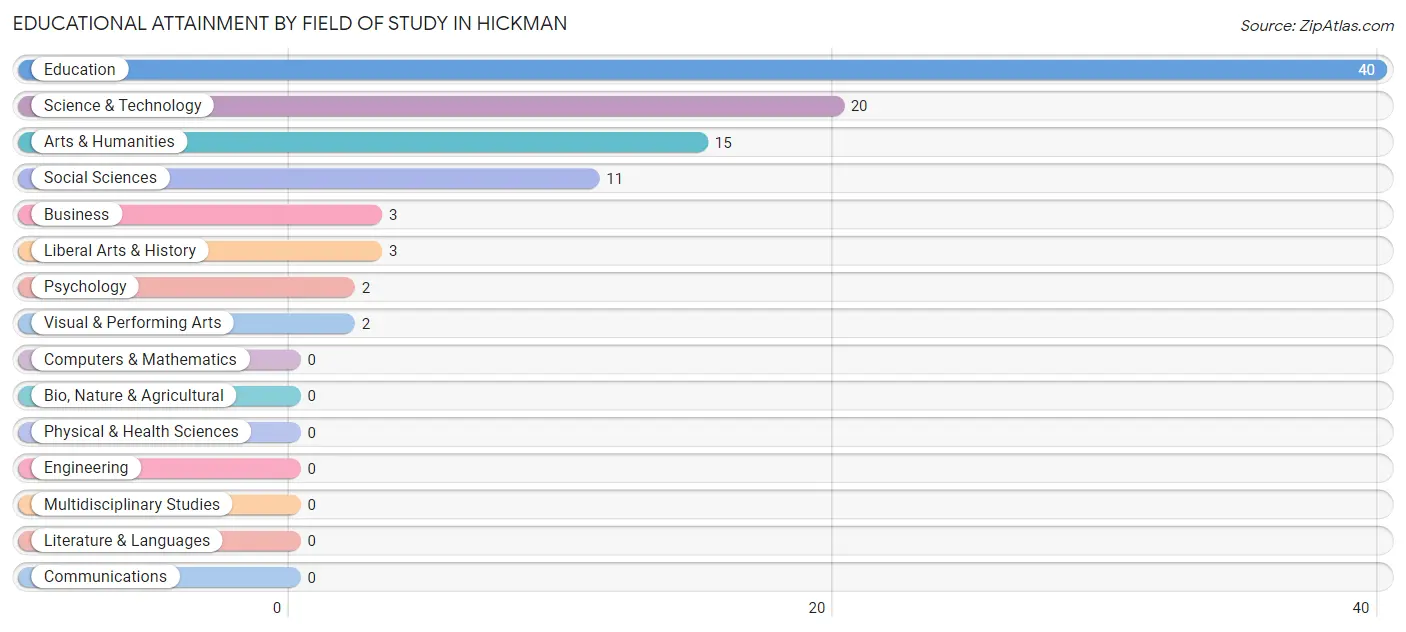
| Field of Study | # Graduates | % Graduates |
| Computers & Mathematics | 0 | 0.0% |
| Bio, Nature & Agricultural | 0 | 0.0% |
| Physical & Health Sciences | 0 | 0.0% |
| Psychology | 2 | 2.1% |
| Social Sciences | 11 | 11.5% |
| Engineering | 0 | 0.0% |
| Multidisciplinary Studies | 0 | 0.0% |
| Science & Technology | 20 | 20.8% |
| Business | 3 | 3.1% |
| Education | 40 | 41.7% |
| Literature & Languages | 0 | 0.0% |
| Liberal Arts & History | 3 | 3.1% |
| Visual & Performing Arts | 2 | 2.1% |
| Communications | 0 | 0.0% |
| Arts & Humanities | 15 | 15.6% |
| Total | 96 | 100.0% |
Transportation & Commute in Hickman
Vehicle Availability by Sex in Hickman
The most prevalent vehicle ownership categories in Hickman are males with 3 vehicles (98, accounting for 49.7%) and females with 3 vehicles (96, making up 55.1%).
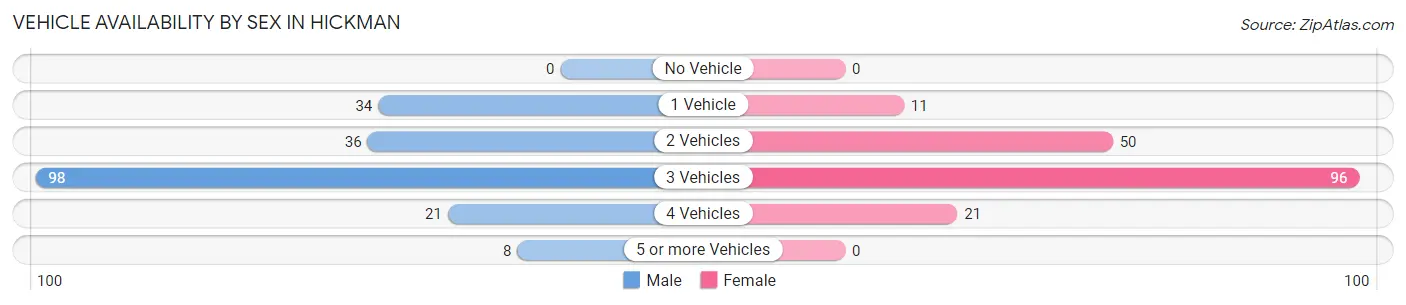
| Vehicles Available | Male | Female |
| No Vehicle | 0 (0.0%) | 0 (0.0%) |
| 1 Vehicle | 34 (17.3%) | 11 (6.2%) |
| 2 Vehicles | 36 (18.3%) | 50 (28.1%) |
| 3 Vehicles | 98 (49.7%) | 96 (53.9%) |
| 4 Vehicles | 21 (10.7%) | 21 (11.8%) |
| 5 or more Vehicles | 8 (4.1%) | 0 (0.0%) |
| Total | 197 (100.0%) | 178 (100.0%) |
Commute Time in Hickman
The most frequently occuring commute durations in Hickman are 25 to 29 minutes (60 commuters, 19.2%), 45 to 59 minutes (49 commuters, 15.7%), and 35 to 39 minutes (37 commuters, 11.8%).
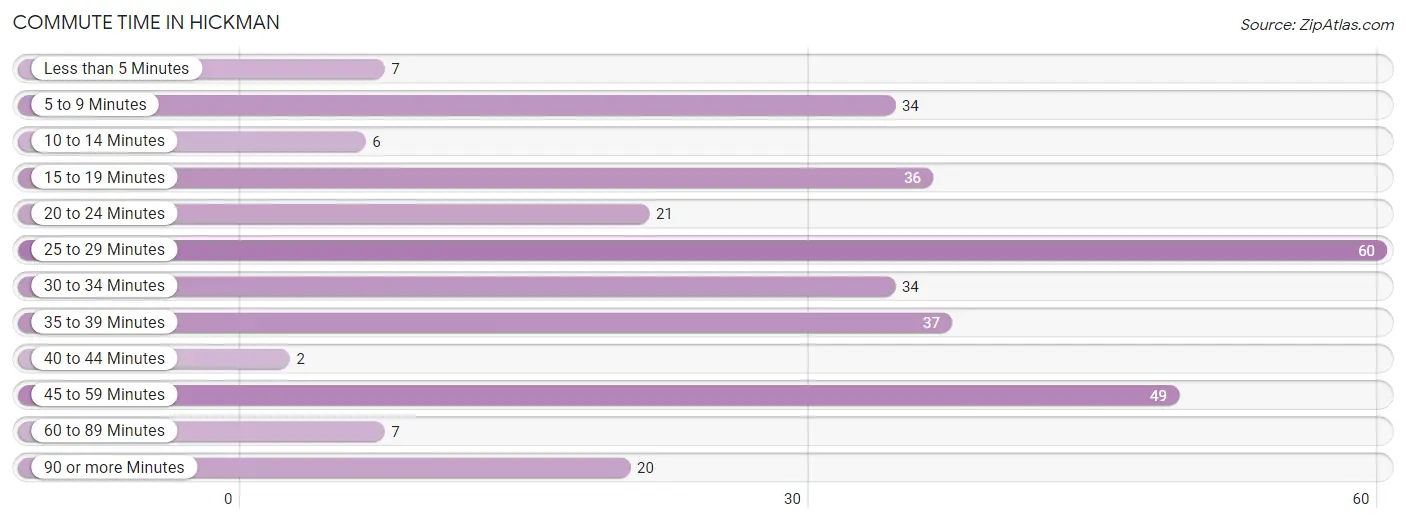
| Commute Time | # Commuters | % Commuters |
| Less than 5 Minutes | 7 | 2.2% |
| 5 to 9 Minutes | 34 | 10.9% |
| 10 to 14 Minutes | 6 | 1.9% |
| 15 to 19 Minutes | 36 | 11.5% |
| 20 to 24 Minutes | 21 | 6.7% |
| 25 to 29 Minutes | 60 | 19.2% |
| 30 to 34 Minutes | 34 | 10.9% |
| 35 to 39 Minutes | 37 | 11.8% |
| 40 to 44 Minutes | 2 | 0.6% |
| 45 to 59 Minutes | 49 | 15.7% |
| 60 to 89 Minutes | 7 | 2.2% |
| 90 or more Minutes | 20 | 6.4% |
Commute Time by Sex in Hickman
The most common commute times in Hickman are 45 to 59 minutes (45 commuters, 25.3%) for males and 25 to 29 minutes (57 commuters, 42.2%) for females.
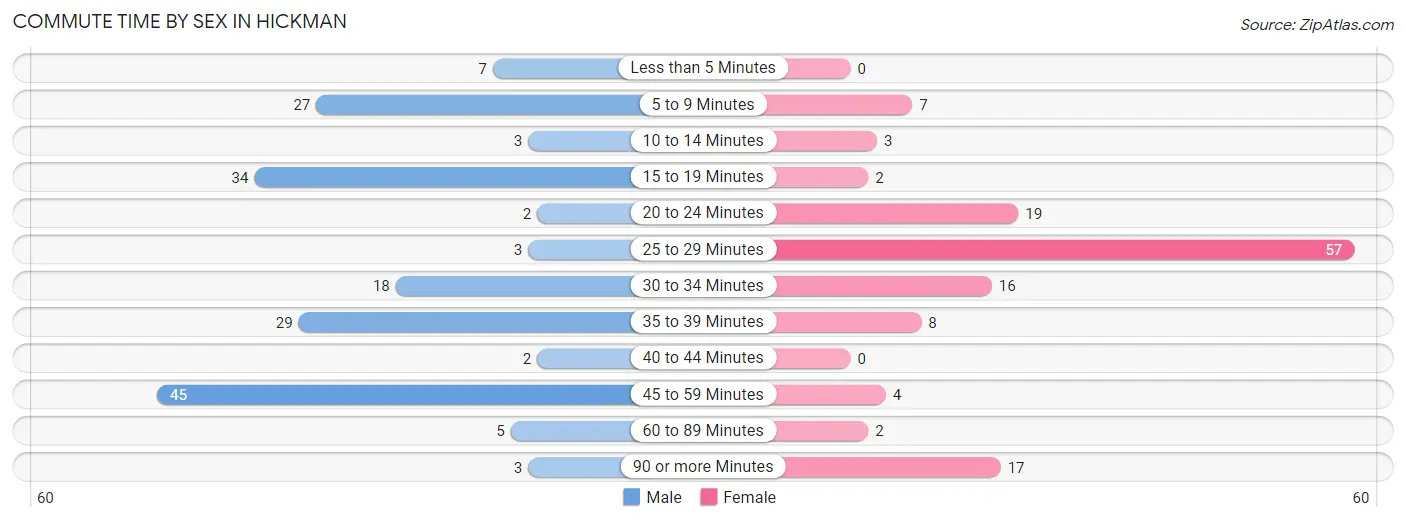
| Commute Time | Male | Female |
| Less than 5 Minutes | 7 (3.9%) | 0 (0.0%) |
| 5 to 9 Minutes | 27 (15.2%) | 7 (5.2%) |
| 10 to 14 Minutes | 3 (1.7%) | 3 (2.2%) |
| 15 to 19 Minutes | 34 (19.1%) | 2 (1.5%) |
| 20 to 24 Minutes | 2 (1.1%) | 19 (14.1%) |
| 25 to 29 Minutes | 3 (1.7%) | 57 (42.2%) |
| 30 to 34 Minutes | 18 (10.1%) | 16 (11.8%) |
| 35 to 39 Minutes | 29 (16.3%) | 8 (5.9%) |
| 40 to 44 Minutes | 2 (1.1%) | 0 (0.0%) |
| 45 to 59 Minutes | 45 (25.3%) | 4 (3.0%) |
| 60 to 89 Minutes | 5 (2.8%) | 2 (1.5%) |
| 90 or more Minutes | 3 (1.7%) | 17 (12.6%) |
Time of Departure to Work by Sex in Hickman
The most frequent times of departure to work in Hickman are 5:30 AM to 5:59 AM (41, 23.0%) for males and 7:00 AM to 7:29 AM (57, 42.2%) for females.
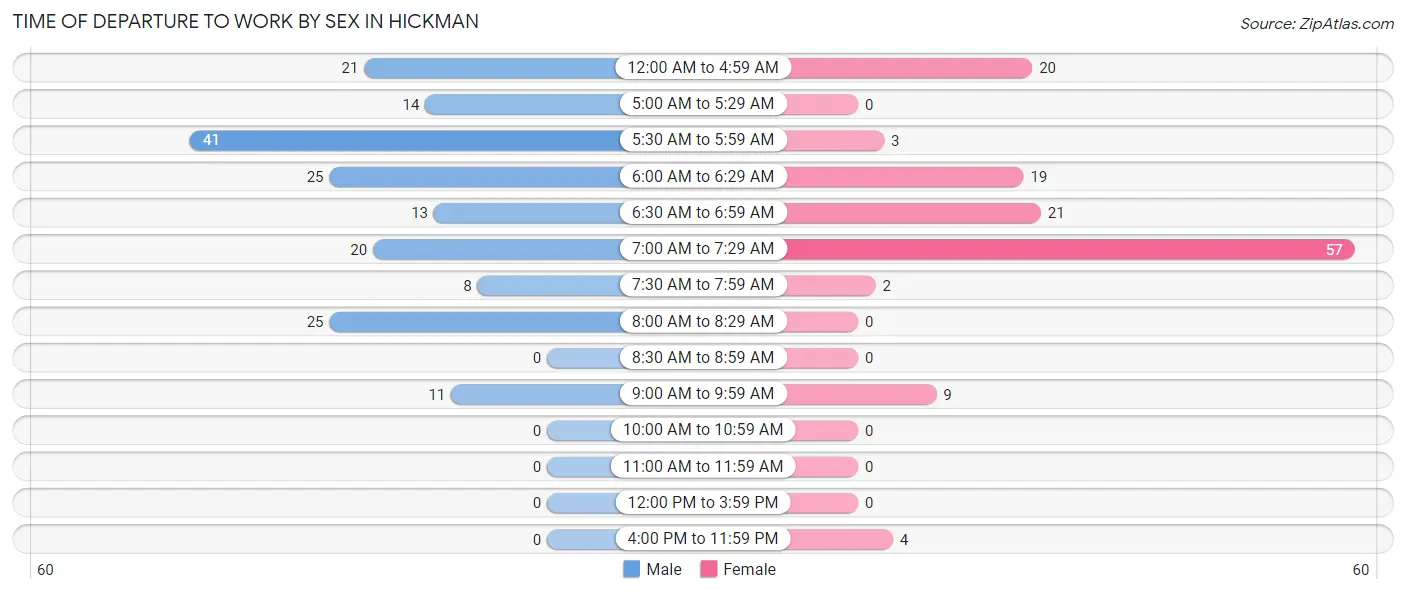
| Time of Departure | Male | Female |
| 12:00 AM to 4:59 AM | 21 (11.8%) | 20 (14.8%) |
| 5:00 AM to 5:29 AM | 14 (7.9%) | 0 (0.0%) |
| 5:30 AM to 5:59 AM | 41 (23.0%) | 3 (2.2%) |
| 6:00 AM to 6:29 AM | 25 (14.0%) | 19 (14.1%) |
| 6:30 AM to 6:59 AM | 13 (7.3%) | 21 (15.6%) |
| 7:00 AM to 7:29 AM | 20 (11.2%) | 57 (42.2%) |
| 7:30 AM to 7:59 AM | 8 (4.5%) | 2 (1.5%) |
| 8:00 AM to 8:29 AM | 25 (14.0%) | 0 (0.0%) |
| 8:30 AM to 8:59 AM | 0 (0.0%) | 0 (0.0%) |
| 9:00 AM to 9:59 AM | 11 (6.2%) | 9 (6.7%) |
| 10:00 AM to 10:59 AM | 0 (0.0%) | 0 (0.0%) |
| 11:00 AM to 11:59 AM | 0 (0.0%) | 0 (0.0%) |
| 12:00 PM to 3:59 PM | 0 (0.0%) | 0 (0.0%) |
| 4:00 PM to 11:59 PM | 0 (0.0%) | 4 (3.0%) |
| Total | 178 (100.0%) | 135 (100.0%) |
Housing Occupancy in Hickman
Occupancy by Ownership in Hickman
Of the total 256 dwellings in Hickman, owner-occupied units account for 196 (76.6%), while renter-occupied units make up 60 (23.4%).
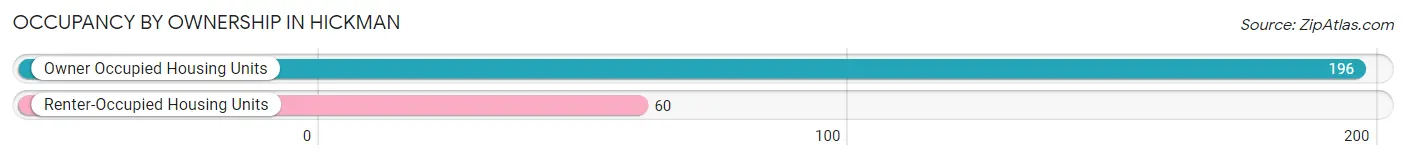
| Occupancy | # Housing Units | % Housing Units |
| Owner Occupied Housing Units | 196 | 76.6% |
| Renter-Occupied Housing Units | 60 | 23.4% |
| Total Occupied Housing Units | 256 | 100.0% |
Occupancy by Household Size in Hickman
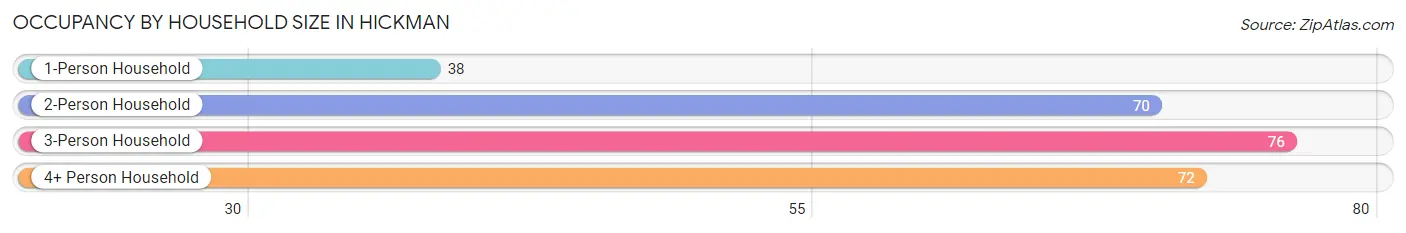
| Household Size | # Housing Units | % Housing Units |
| 1-Person Household | 38 | 14.8% |
| 2-Person Household | 70 | 27.3% |
| 3-Person Household | 76 | 29.7% |
| 4+ Person Household | 72 | 28.1% |
| Total Housing Units | 256 | 100.0% |
Occupancy by Ownership by Household Size in Hickman
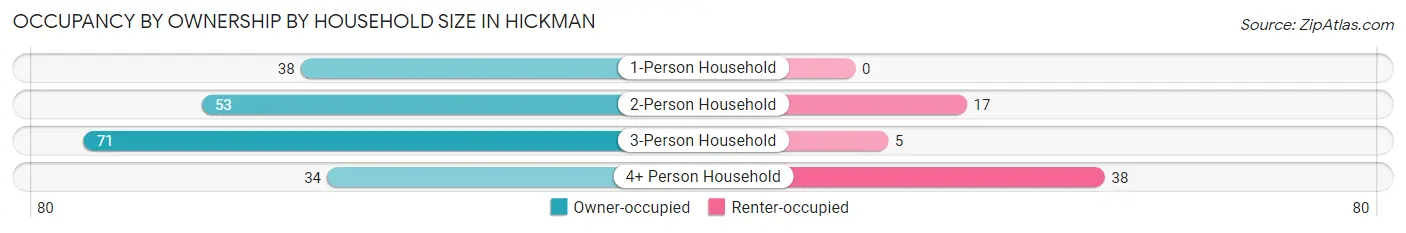
| Household Size | Owner-occupied | Renter-occupied |
| 1-Person Household | 38 (100.0%) | 0 (0.0%) |
| 2-Person Household | 53 (75.7%) | 17 (24.3%) |
| 3-Person Household | 71 (93.4%) | 5 (6.6%) |
| 4+ Person Household | 34 (47.2%) | 38 (52.8%) |
| Total Housing Units | 196 (76.6%) | 60 (23.4%) |
Occupancy by Educational Attainment in Hickman
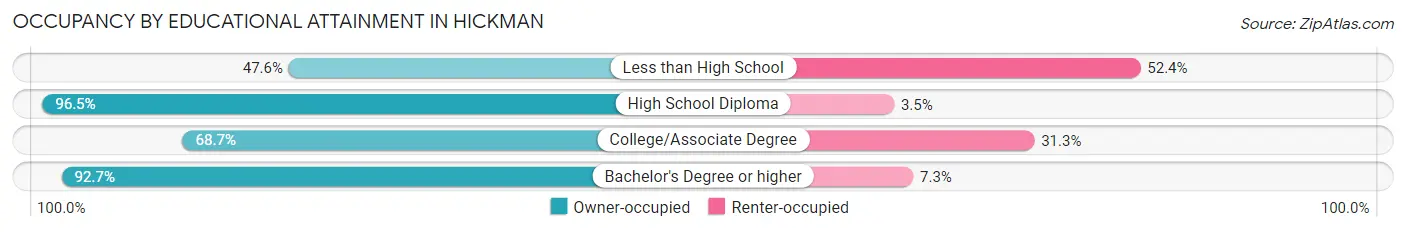
| Household Size | Owner-occupied | Renter-occupied |
| Less than High School | 30 (47.6%) | 33 (52.4%) |
| High School Diploma | 82 (96.5%) | 3 (3.5%) |
| College/Associate Degree | 46 (68.7%) | 21 (31.3%) |
| Bachelor's Degree or higher | 38 (92.7%) | 3 (7.3%) |
Occupancy by Age of Householder in Hickman
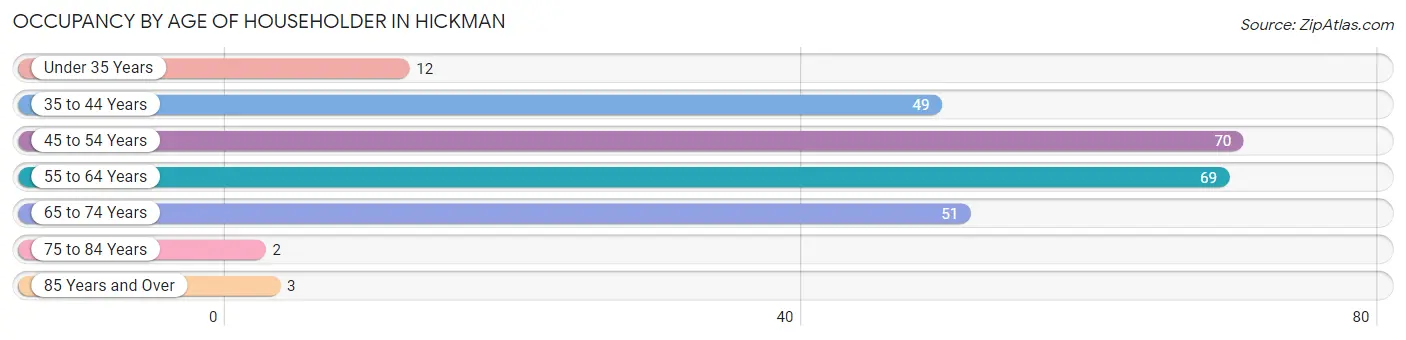
| Age Bracket | # Households | % Households |
| Under 35 Years | 12 | 4.7% |
| 35 to 44 Years | 49 | 19.1% |
| 45 to 54 Years | 70 | 27.3% |
| 55 to 64 Years | 69 | 27.0% |
| 65 to 74 Years | 51 | 19.9% |
| 75 to 84 Years | 2 | 0.8% |
| 85 Years and Over | 3 | 1.2% |
| Total | 256 | 100.0% |
Housing Finances in Hickman
Median Income by Occupancy in Hickman
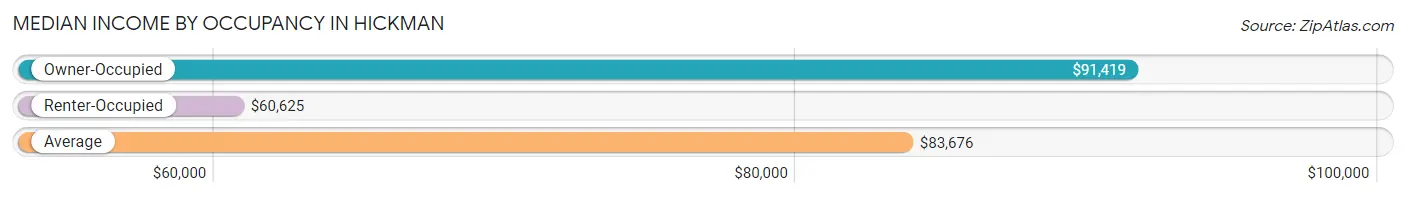
| Occupancy Type | # Households | Median Income |
| Owner-Occupied | 196 (76.6%) | $91,419 |
| Renter-Occupied | 60 (23.4%) | $60,625 |
| Average | 256 (100.0%) | $83,676 |
Occupancy by Householder Income Bracket in Hickman
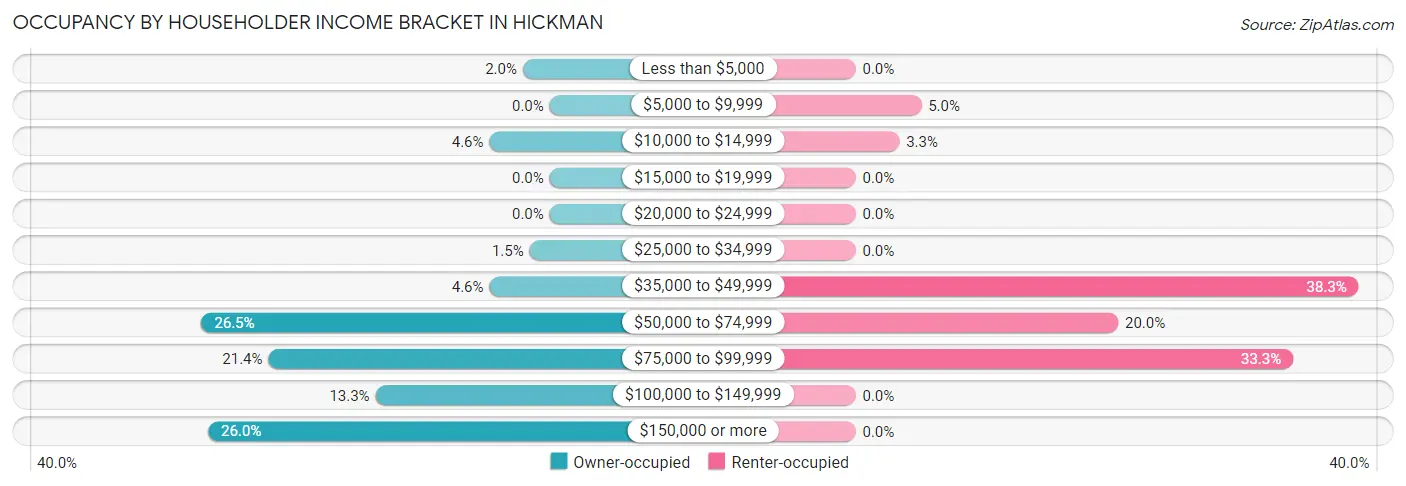
| Income Bracket | Owner-occupied | Renter-occupied |
| Less than $5,000 | 4 (2.0%) | 0 (0.0%) |
| $5,000 to $9,999 | 0 (0.0%) | 3 (5.0%) |
| $10,000 to $14,999 | 9 (4.6%) | 2 (3.3%) |
| $15,000 to $19,999 | 0 (0.0%) | 0 (0.0%) |
| $20,000 to $24,999 | 0 (0.0%) | 0 (0.0%) |
| $25,000 to $34,999 | 3 (1.5%) | 0 (0.0%) |
| $35,000 to $49,999 | 9 (4.6%) | 23 (38.3%) |
| $50,000 to $74,999 | 52 (26.5%) | 12 (20.0%) |
| $75,000 to $99,999 | 42 (21.4%) | 20 (33.3%) |
| $100,000 to $149,999 | 26 (13.3%) | 0 (0.0%) |
| $150,000 or more | 51 (26.0%) | 0 (0.0%) |
| Total | 196 (100.0%) | 60 (100.0%) |
Monthly Housing Cost Tiers in Hickman
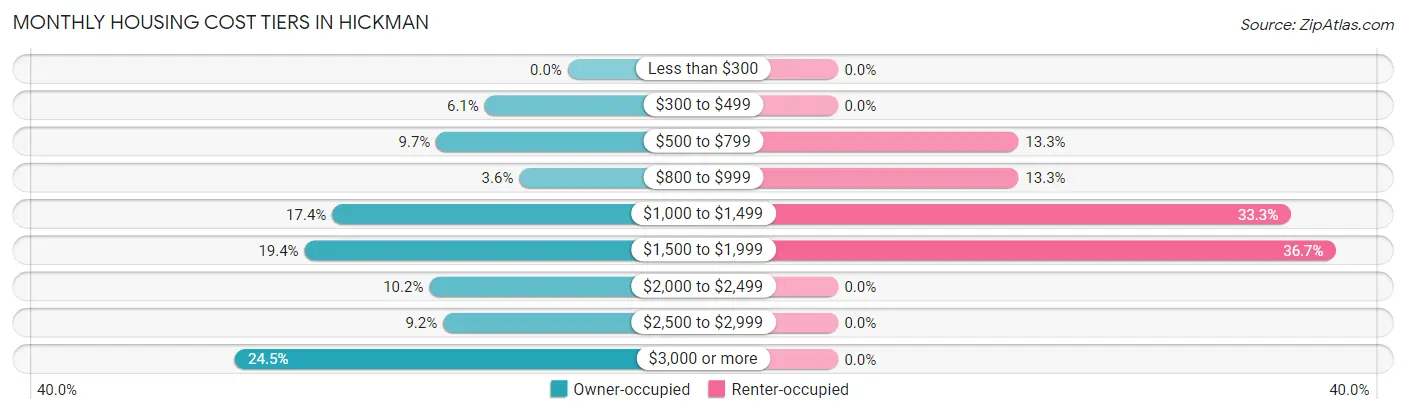
| Monthly Cost | Owner-occupied | Renter-occupied |
| Less than $300 | 0 (0.0%) | 0 (0.0%) |
| $300 to $499 | 12 (6.1%) | 0 (0.0%) |
| $500 to $799 | 19 (9.7%) | 8 (13.3%) |
| $800 to $999 | 7 (3.6%) | 8 (13.3%) |
| $1,000 to $1,499 | 34 (17.3%) | 20 (33.3%) |
| $1,500 to $1,999 | 38 (19.4%) | 22 (36.7%) |
| $2,000 to $2,499 | 20 (10.2%) | 0 (0.0%) |
| $2,500 to $2,999 | 18 (9.2%) | 0 (0.0%) |
| $3,000 or more | 48 (24.5%) | 0 (0.0%) |
| Total | 196 (100.0%) | 60 (100.0%) |
Physical Housing Characteristics in Hickman
Housing Structures in Hickman
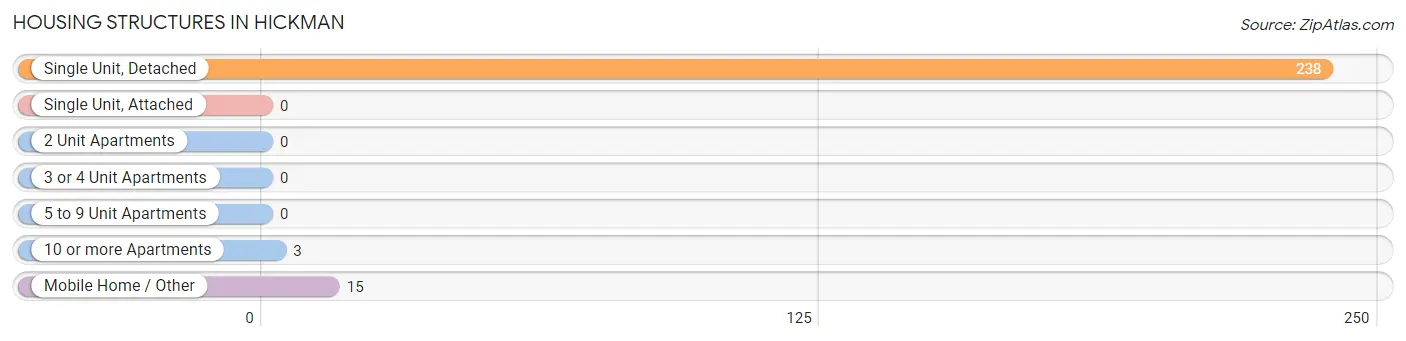
| Structure Type | # Housing Units | % Housing Units |
| Single Unit, Detached | 238 | 93.0% |
| Single Unit, Attached | 0 | 0.0% |
| 2 Unit Apartments | 0 | 0.0% |
| 3 or 4 Unit Apartments | 0 | 0.0% |
| 5 to 9 Unit Apartments | 0 | 0.0% |
| 10 or more Apartments | 3 | 1.2% |
| Mobile Home / Other | 15 | 5.9% |
| Total | 256 | 100.0% |
Housing Structures by Occupancy in Hickman
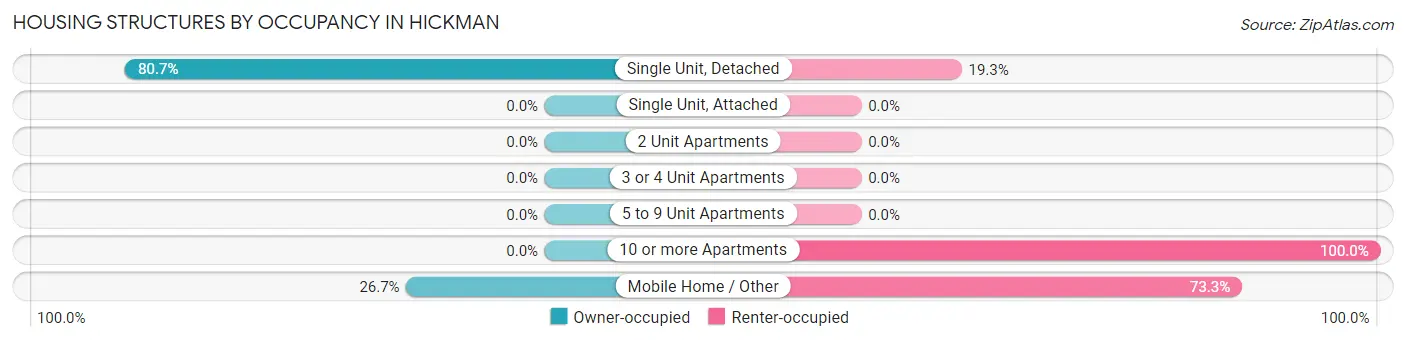
| Structure Type | Owner-occupied | Renter-occupied |
| Single Unit, Detached | 192 (80.7%) | 46 (19.3%) |
| Single Unit, Attached | 0 (0.0%) | 0 (0.0%) |
| 2 Unit Apartments | 0 (0.0%) | 0 (0.0%) |
| 3 or 4 Unit Apartments | 0 (0.0%) | 0 (0.0%) |
| 5 to 9 Unit Apartments | 0 (0.0%) | 0 (0.0%) |
| 10 or more Apartments | 0 (0.0%) | 3 (100.0%) |
| Mobile Home / Other | 4 (26.7%) | 11 (73.3%) |
| Total | 196 (76.6%) | 60 (23.4%) |
Housing Structures by Number of Rooms in Hickman
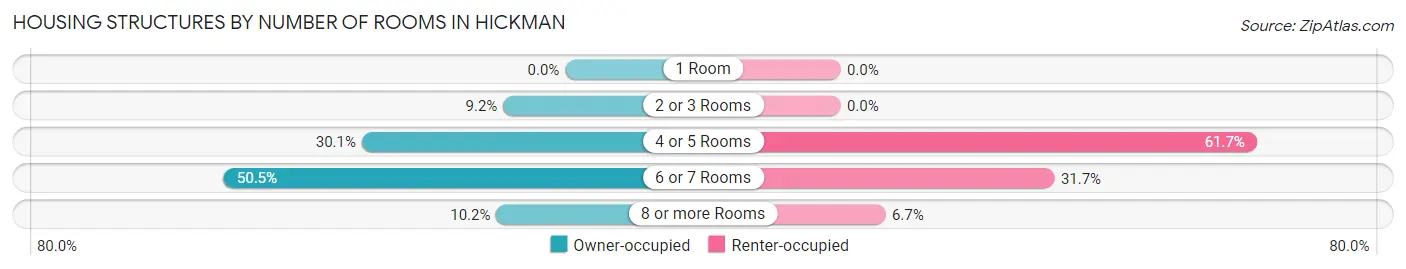
| Number of Rooms | Owner-occupied | Renter-occupied |
| 1 Room | 0 (0.0%) | 0 (0.0%) |
| 2 or 3 Rooms | 18 (9.2%) | 0 (0.0%) |
| 4 or 5 Rooms | 59 (30.1%) | 37 (61.7%) |
| 6 or 7 Rooms | 99 (50.5%) | 19 (31.7%) |
| 8 or more Rooms | 20 (10.2%) | 4 (6.7%) |
| Total | 196 (100.0%) | 60 (100.0%) |
Housing Structure by Heating Type in Hickman
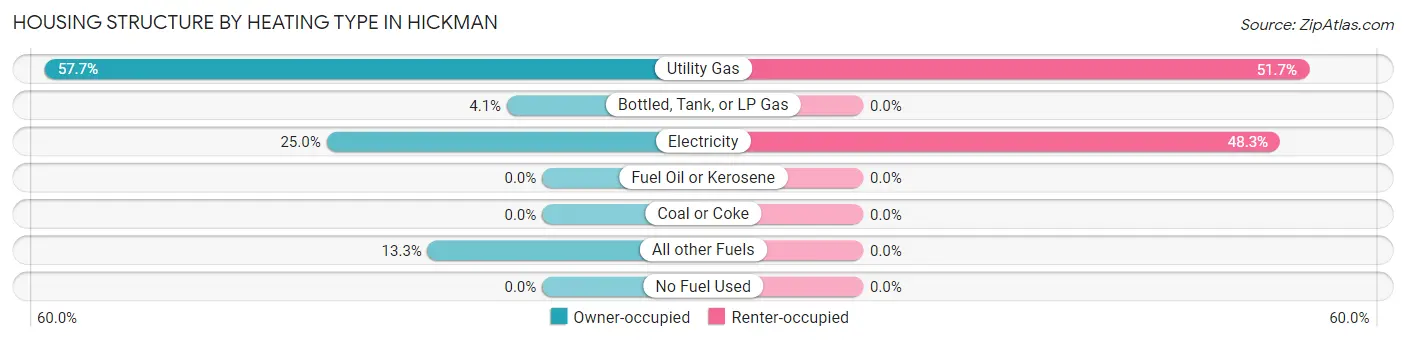
| Heating Type | Owner-occupied | Renter-occupied |
| Utility Gas | 113 (57.7%) | 31 (51.7%) |
| Bottled, Tank, or LP Gas | 8 (4.1%) | 0 (0.0%) |
| Electricity | 49 (25.0%) | 29 (48.3%) |
| Fuel Oil or Kerosene | 0 (0.0%) | 0 (0.0%) |
| Coal or Coke | 0 (0.0%) | 0 (0.0%) |
| All other Fuels | 26 (13.3%) | 0 (0.0%) |
| No Fuel Used | 0 (0.0%) | 0 (0.0%) |
| Total | 196 (100.0%) | 60 (100.0%) |
Household Vehicle Usage in Hickman
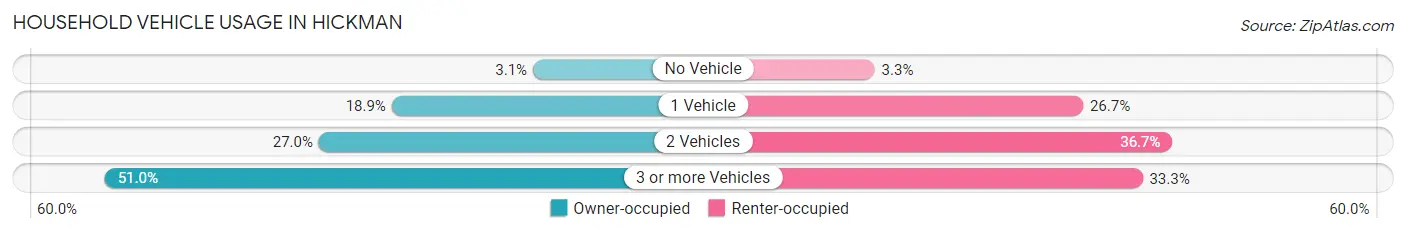
| Vehicles per Household | Owner-occupied | Renter-occupied |
| No Vehicle | 6 (3.1%) | 2 (3.3%) |
| 1 Vehicle | 37 (18.9%) | 16 (26.7%) |
| 2 Vehicles | 53 (27.0%) | 22 (36.7%) |
| 3 or more Vehicles | 100 (51.0%) | 20 (33.3%) |
| Total | 196 (100.0%) | 60 (100.0%) |
Real Estate & Mortgages in Hickman
Real Estate and Mortgage Overview in Hickman
| Characteristic | Without Mortgage | With Mortgage |
| Housing Units | 31 | 165 |
| Median Property Value | $325,000 | $488,600 |
| Median Household Income | $111,875 | $51 |
| Monthly Housing Costs | $570 | $48 |
| Real Estate Taxes | $3,167 | $1 |
Property Value by Mortgage Status in Hickman
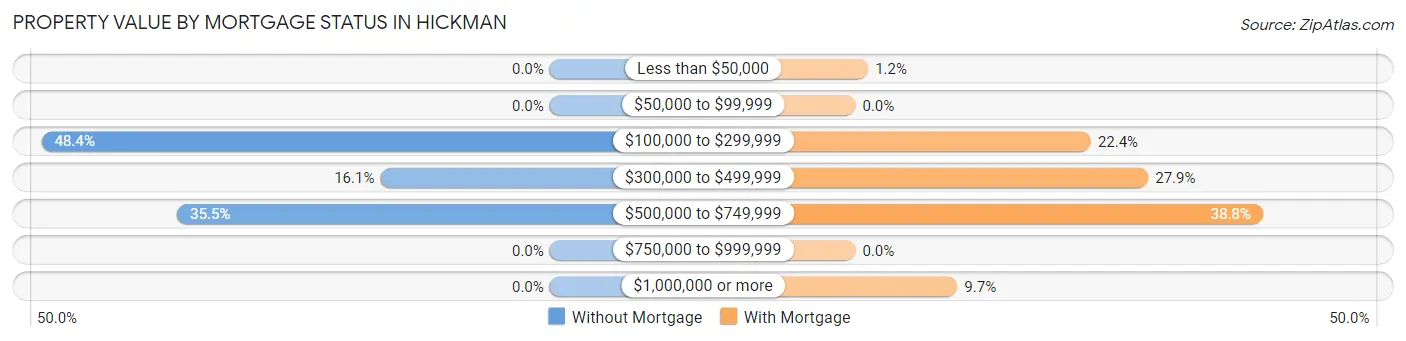
| Property Value | Without Mortgage | With Mortgage |
| Less than $50,000 | 0 (0.0%) | 2 (1.2%) |
| $50,000 to $99,999 | 0 (0.0%) | 0 (0.0%) |
| $100,000 to $299,999 | 15 (48.4%) | 37 (22.4%) |
| $300,000 to $499,999 | 5 (16.1%) | 46 (27.9%) |
| $500,000 to $749,999 | 11 (35.5%) | 64 (38.8%) |
| $750,000 to $999,999 | 0 (0.0%) | 0 (0.0%) |
| $1,000,000 or more | 0 (0.0%) | 16 (9.7%) |
| Total | 31 (100.0%) | 165 (100.0%) |
Household Income by Mortgage Status in Hickman
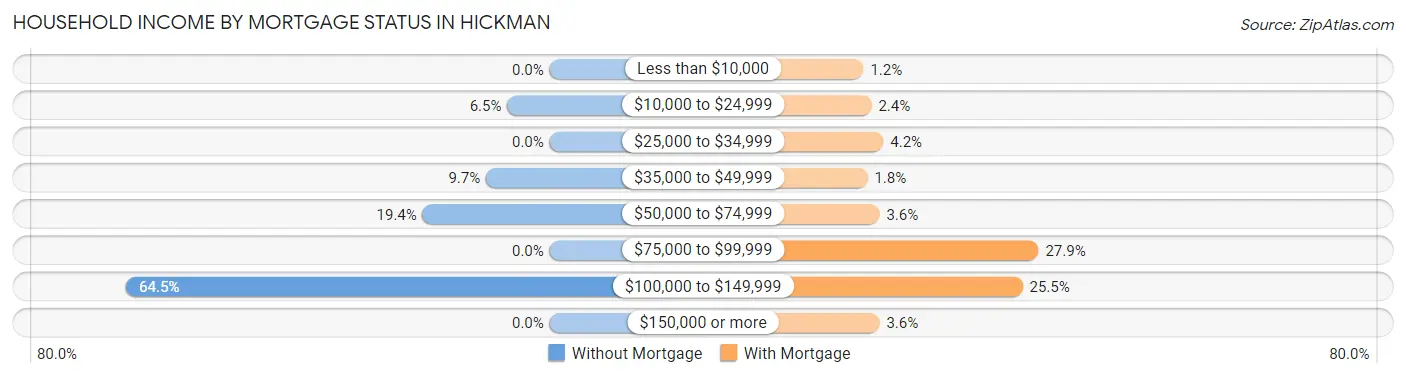
| Household Income | Without Mortgage | With Mortgage |
| Less than $10,000 | 0 (0.0%) | 2 (1.2%) |
| $10,000 to $24,999 | 2 (6.5%) | 4 (2.4%) |
| $25,000 to $34,999 | 0 (0.0%) | 7 (4.2%) |
| $35,000 to $49,999 | 3 (9.7%) | 3 (1.8%) |
| $50,000 to $74,999 | 6 (19.4%) | 6 (3.6%) |
| $75,000 to $99,999 | 0 (0.0%) | 46 (27.9%) |
| $100,000 to $149,999 | 20 (64.5%) | 42 (25.5%) |
| $150,000 or more | 0 (0.0%) | 6 (3.6%) |
| Total | 31 (100.0%) | 165 (100.0%) |
Property Value to Household Income Ratio in Hickman
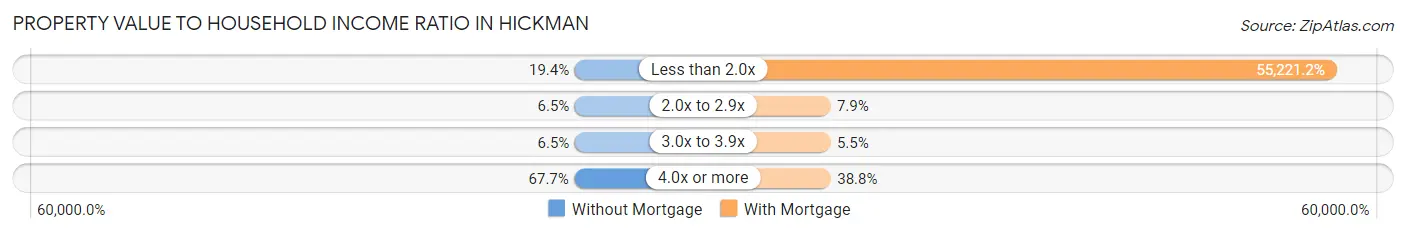
| Value-to-Income Ratio | Without Mortgage | With Mortgage |
| Less than 2.0x | 6 (19.4%) | 91,115 (55,221.2%) |
| 2.0x to 2.9x | 2 (6.5%) | 13 (7.9%) |
| 3.0x to 3.9x | 2 (6.5%) | 9 (5.4%) |
| 4.0x or more | 21 (67.7%) | 64 (38.8%) |
| Total | 31 (100.0%) | 165 (100.0%) |
Real Estate Taxes by Mortgage Status in Hickman
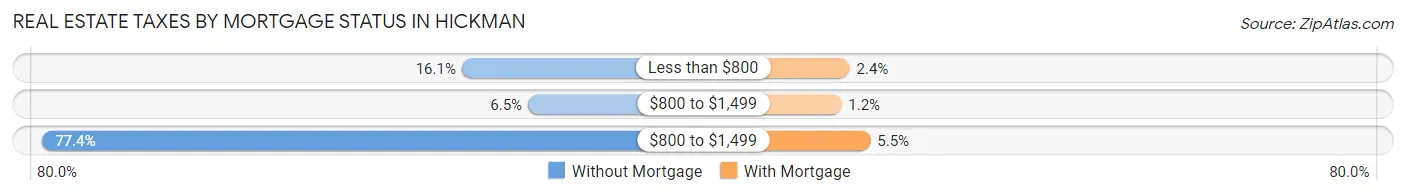
| Property Taxes | Without Mortgage | With Mortgage |
| Less than $800 | 5 (16.1%) | 4 (2.4%) |
| $800 to $1,499 | 2 (6.5%) | 2 (1.2%) |
| $800 to $1,499 | 24 (77.4%) | 9 (5.4%) |
| Total | 31 (100.0%) | 165 (100.0%) |
Health & Disability in Hickman
Health Insurance Coverage by Age in Hickman
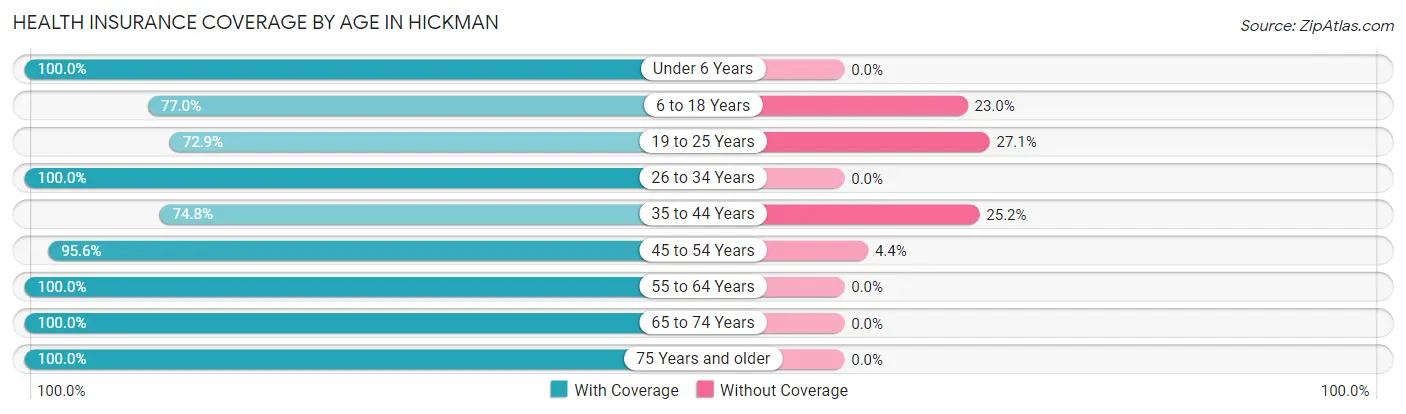
| Age Bracket | With Coverage | Without Coverage |
| Under 6 Years | 23 (100.0%) | 0 (0.0%) |
| 6 to 18 Years | 124 (77.0%) | 37 (23.0%) |
| 19 to 25 Years | 70 (72.9%) | 26 (27.1%) |
| 26 to 34 Years | 44 (100.0%) | 0 (0.0%) |
| 35 to 44 Years | 101 (74.8%) | 34 (25.2%) |
| 45 to 54 Years | 130 (95.6%) | 6 (4.4%) |
| 55 to 64 Years | 120 (100.0%) | 0 (0.0%) |
| 65 to 74 Years | 78 (100.0%) | 0 (0.0%) |
| 75 Years and older | 17 (100.0%) | 0 (0.0%) |
| Total | 707 (87.3%) | 103 (12.7%) |
Health Insurance Coverage by Citizenship Status in Hickman
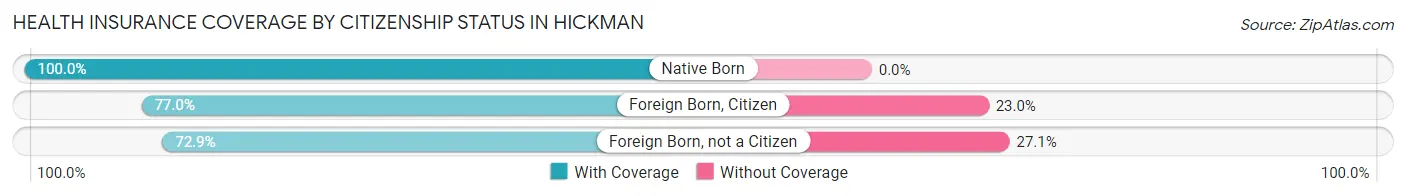
| Citizenship Status | With Coverage | Without Coverage |
| Native Born | 23 (100.0%) | 0 (0.0%) |
| Foreign Born, Citizen | 124 (77.0%) | 37 (23.0%) |
| Foreign Born, not a Citizen | 70 (72.9%) | 26 (27.1%) |
Health Insurance Coverage by Household Income in Hickman
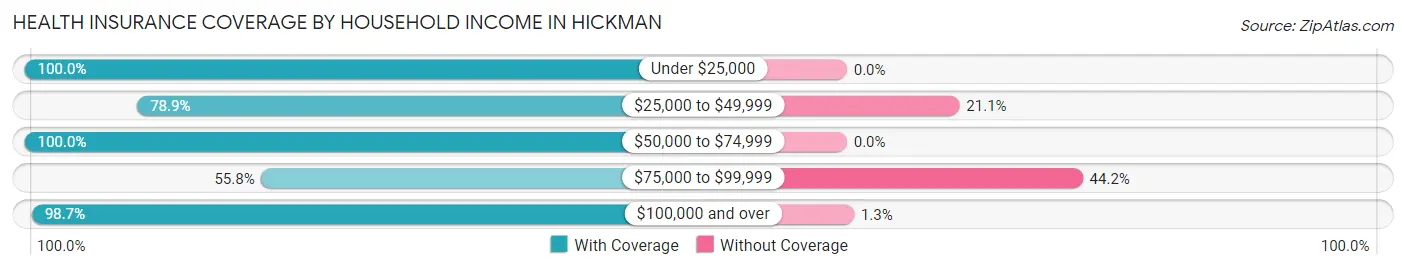
| Household Income | With Coverage | Without Coverage |
| Under $25,000 | 37 (100.0%) | 0 (0.0%) |
| $25,000 to $49,999 | 86 (78.9%) | 23 (21.1%) |
| $50,000 to $74,999 | 194 (100.0%) | 0 (0.0%) |
| $75,000 to $99,999 | 96 (55.8%) | 76 (44.2%) |
| $100,000 and over | 294 (98.7%) | 4 (1.3%) |
Public vs Private Health Insurance Coverage by Age in Hickman
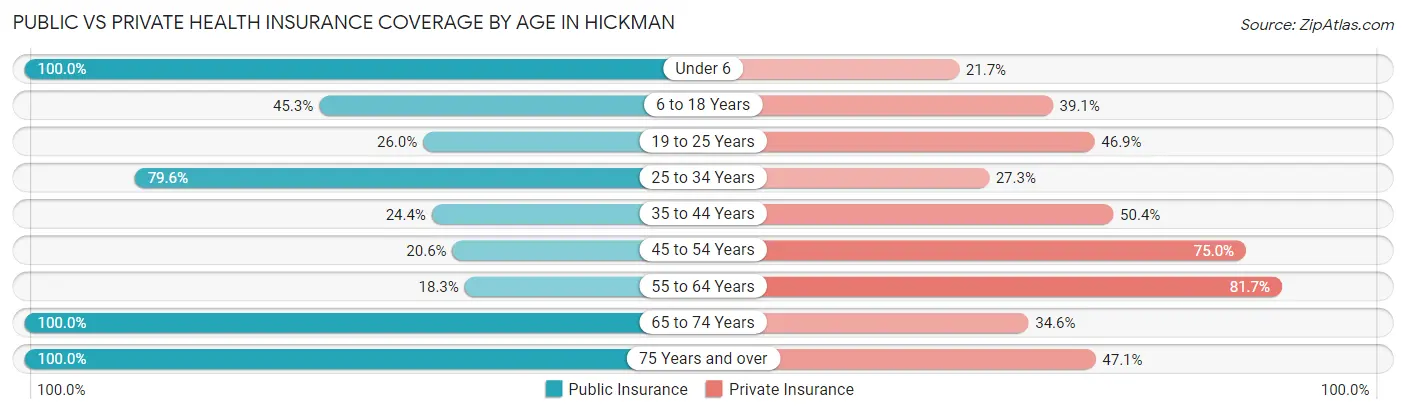
| Age Bracket | Public Insurance | Private Insurance |
| Under 6 | 23 (100.0%) | 5 (21.7%) |
| 6 to 18 Years | 73 (45.3%) | 63 (39.1%) |
| 19 to 25 Years | 25 (26.0%) | 45 (46.9%) |
| 25 to 34 Years | 35 (79.5%) | 12 (27.3%) |
| 35 to 44 Years | 33 (24.4%) | 68 (50.4%) |
| 45 to 54 Years | 28 (20.6%) | 102 (75.0%) |
| 55 to 64 Years | 22 (18.3%) | 98 (81.7%) |
| 65 to 74 Years | 78 (100.0%) | 27 (34.6%) |
| 75 Years and over | 17 (100.0%) | 8 (47.1%) |
| Total | 334 (41.2%) | 428 (52.8%) |
Disability Status by Sex by Age in Hickman
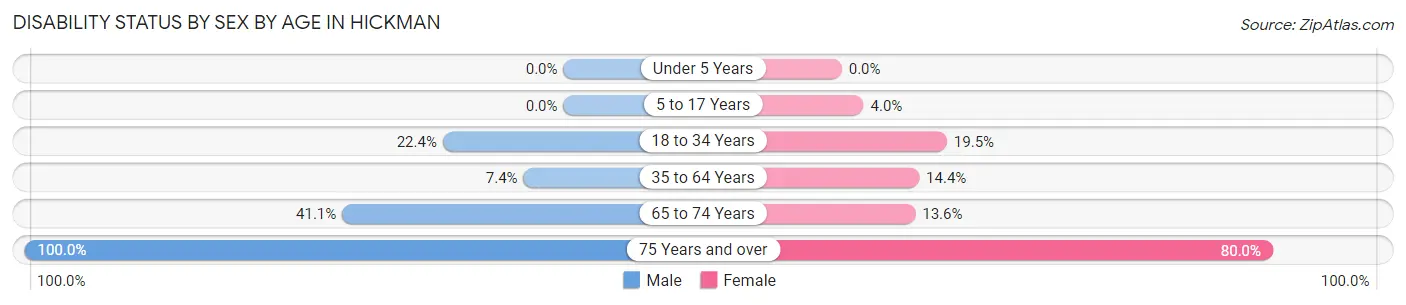
| Age Bracket | Male | Female |
| Under 5 Years | 0 (0.0%) | 0 (0.0%) |
| 5 to 17 Years | 0 (0.0%) | 4 (4.0%) |
| 18 to 34 Years | 15 (22.4%) | 16 (19.5%) |
| 35 to 64 Years | 14 (7.4%) | 29 (14.4%) |
| 65 to 74 Years | 23 (41.1%) | 3 (13.6%) |
| 75 Years and over | 2 (100.0%) | 12 (80.0%) |
Disability Class by Sex by Age in Hickman
Disability Class: Hearing Difficulty
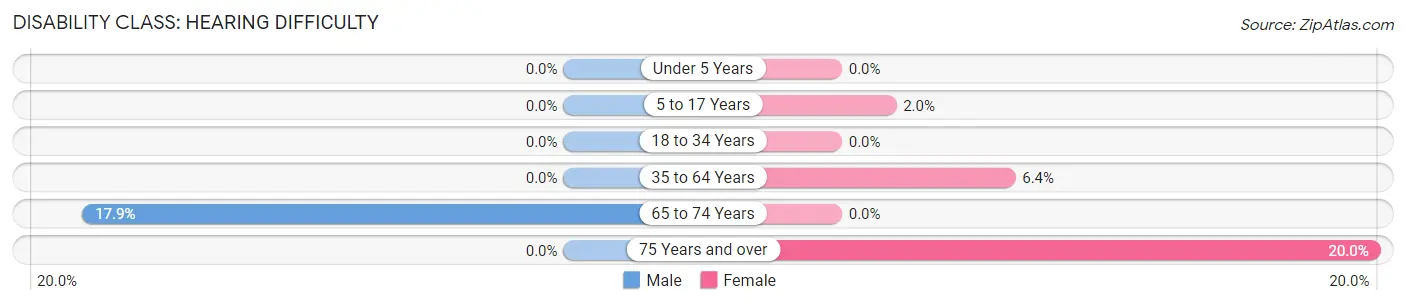
| Age Bracket | Male | Female |
| Under 5 Years | 0 (0.0%) | 0 (0.0%) |
| 5 to 17 Years | 0 (0.0%) | 2 (2.0%) |
| 18 to 34 Years | 0 (0.0%) | 0 (0.0%) |
| 35 to 64 Years | 0 (0.0%) | 13 (6.4%) |
| 65 to 74 Years | 10 (17.9%) | 0 (0.0%) |
| 75 Years and over | 0 (0.0%) | 3 (20.0%) |
Disability Class: Vision Difficulty
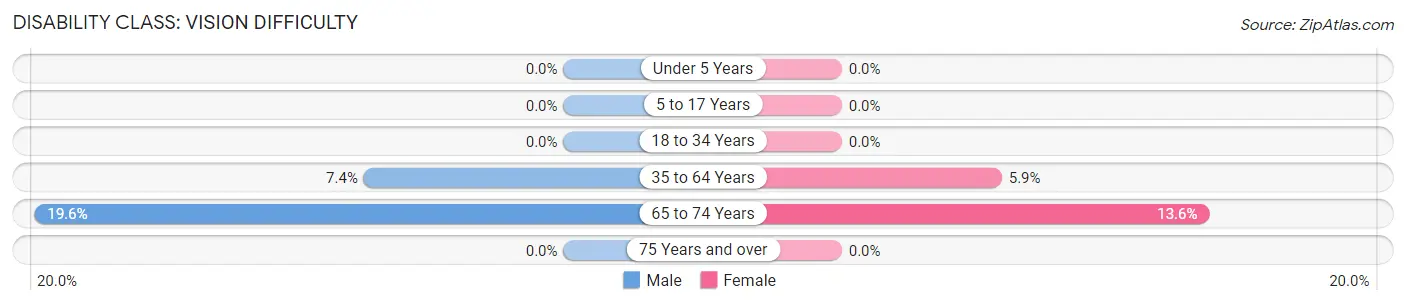
| Age Bracket | Male | Female |
| Under 5 Years | 0 (0.0%) | 0 (0.0%) |
| 5 to 17 Years | 0 (0.0%) | 0 (0.0%) |
| 18 to 34 Years | 0 (0.0%) | 0 (0.0%) |
| 35 to 64 Years | 14 (7.4%) | 12 (5.9%) |
| 65 to 74 Years | 11 (19.6%) | 3 (13.6%) |
| 75 Years and over | 0 (0.0%) | 0 (0.0%) |
Disability Class: Cognitive Difficulty
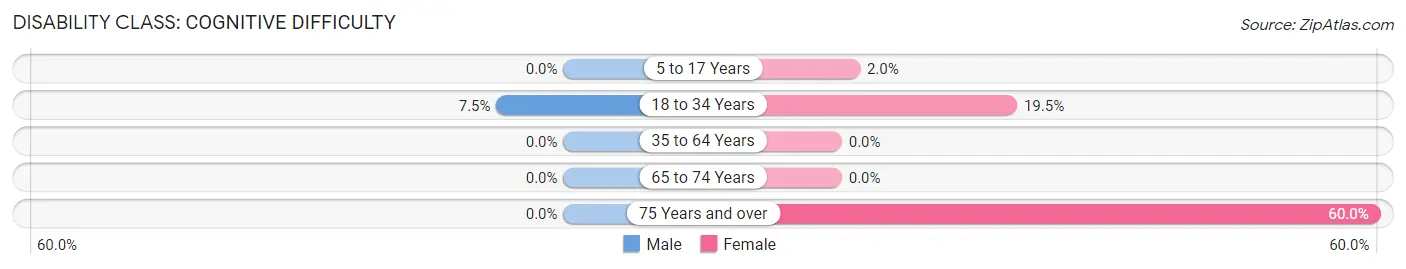
| Age Bracket | Male | Female |
| 5 to 17 Years | 0 (0.0%) | 2 (2.0%) |
| 18 to 34 Years | 5 (7.5%) | 16 (19.5%) |
| 35 to 64 Years | 0 (0.0%) | 0 (0.0%) |
| 65 to 74 Years | 0 (0.0%) | 0 (0.0%) |
| 75 Years and over | 0 (0.0%) | 9 (60.0%) |
Disability Class: Ambulatory Difficulty
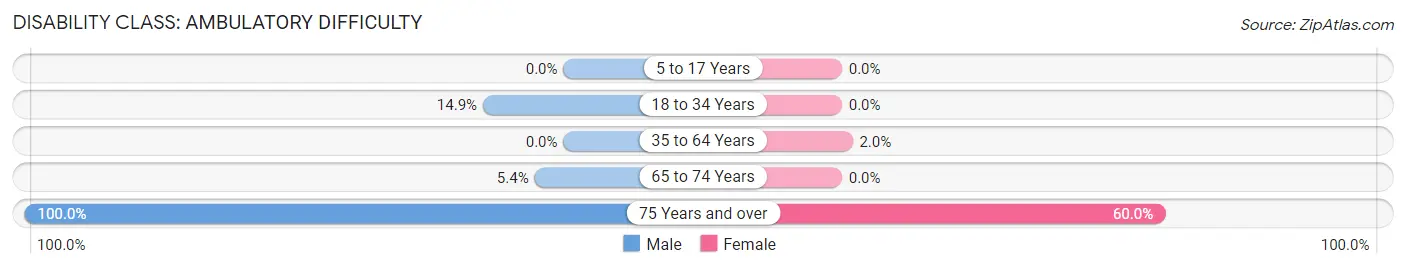
| Age Bracket | Male | Female |
| 5 to 17 Years | 0 (0.0%) | 0 (0.0%) |
| 18 to 34 Years | 10 (14.9%) | 0 (0.0%) |
| 35 to 64 Years | 0 (0.0%) | 4 (2.0%) |
| 65 to 74 Years | 3 (5.4%) | 0 (0.0%) |
| 75 Years and over | 2 (100.0%) | 9 (60.0%) |
Disability Class: Self-Care Difficulty
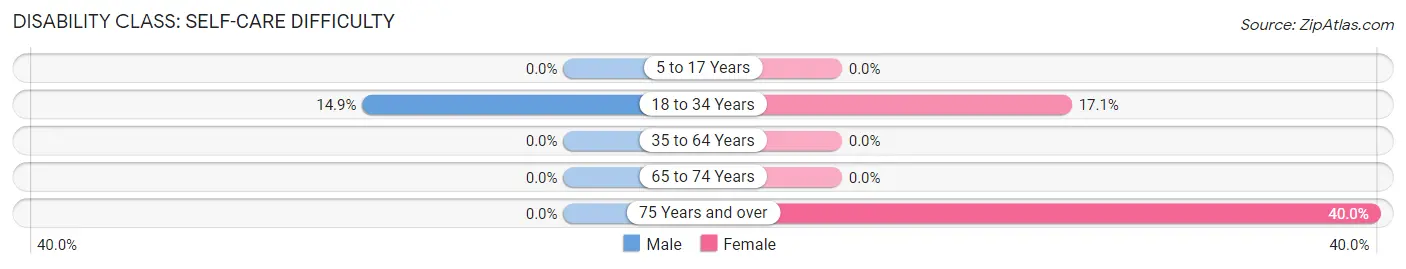
| Age Bracket | Male | Female |
| 5 to 17 Years | 0 (0.0%) | 0 (0.0%) |
| 18 to 34 Years | 10 (14.9%) | 14 (17.1%) |
| 35 to 64 Years | 0 (0.0%) | 0 (0.0%) |
| 65 to 74 Years | 0 (0.0%) | 0 (0.0%) |
| 75 Years and over | 0 (0.0%) | 6 (40.0%) |
Technology Access in Hickman
Computing Device Access in Hickman
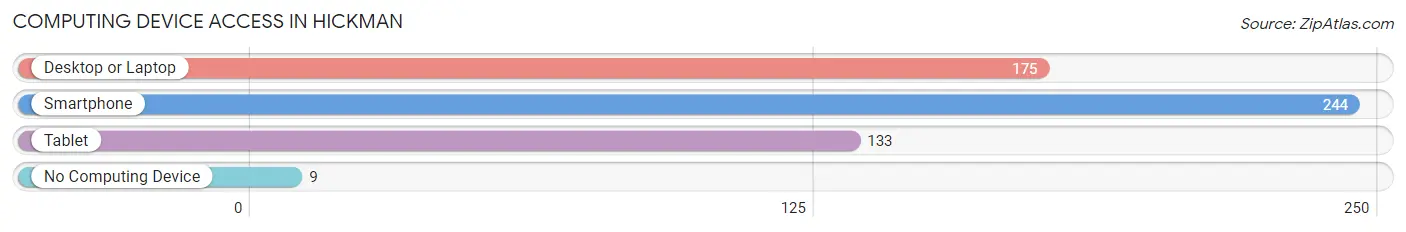
| Device Type | # Households | % Households |
| Desktop or Laptop | 175 | 68.4% |
| Smartphone | 244 | 95.3% |
| Tablet | 133 | 51.9% |
| No Computing Device | 9 | 3.5% |
| Total | 256 | 100.0% |
Internet Access in Hickman
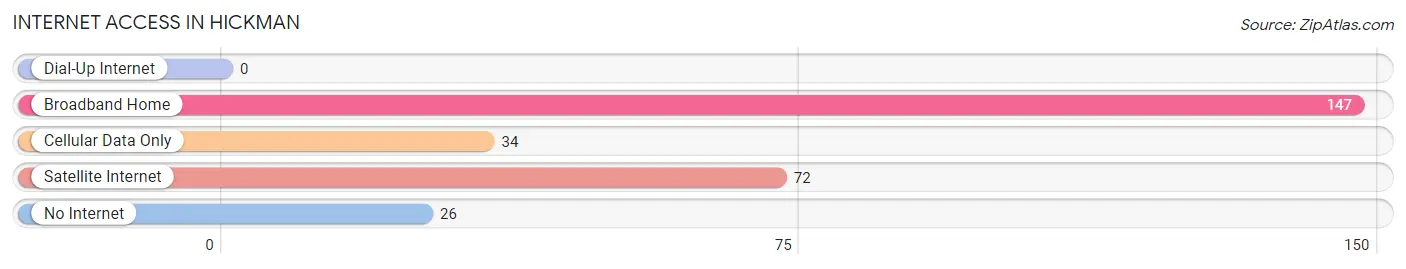
| Internet Type | # Households | % Households |
| Dial-Up Internet | 0 | 0.0% |
| Broadband Home | 147 | 57.4% |
| Cellular Data Only | 34 | 13.3% |
| Satellite Internet | 72 | 28.1% |
| No Internet | 26 | 10.2% |
| Total | 256 | 100.0% |
Hickman Summary
Hickman is a small unincorporated community located in the Sierra Nevada foothills of California, in the United States. It is situated in the foothills of the Sierra Nevada mountain range, approximately 25 miles east of Fresno, California. The population of Hickman is estimated to be around 1,000 people.
History
Hickman was founded in 1856 by a group of settlers from the Midwest. The settlers were looking for a place to settle and start a new life. The town was named after one of the settlers, William Hickman. The town was originally a farming community, with the main crops being wheat, barley, and oats. The town also had a few small businesses, such as a general store, a blacksmith, and a post office.
In the late 1800s, Hickman began to experience a population boom due to the discovery of gold in the nearby hills. This led to an influx of miners and prospectors to the area, and the town quickly grew in size. The population of Hickman peaked in the early 1900s, with a population of over 1,000 people.
Geography
Hickman is located in the Sierra Nevada foothills of California, in the United States. It is situated in the foothills of the Sierra Nevada mountain range, approximately 25 miles east of Fresno, California. The town is located at an elevation of 1,400 feet above sea level.
The climate in Hickman is semi-arid, with hot summers and mild winters. The average annual temperature is around 70 degrees Fahrenheit. The average annual precipitation is around 10 inches.
Economy
The economy of Hickman is largely based on agriculture. The main crops grown in the area are wheat, barley, oats, and hay. The town also has a few small businesses, such as a general store, a blacksmith, and a post office.
The town also has a few tourist attractions, such as the Hickman Historical Museum, which showcases the history of the town and the surrounding area. The town also has a few restaurants and bars, as well as a few small shops.
Demographics
The population of Hickman is estimated to be around 1,000 people. The town is predominantly white, with a small Hispanic population. The median household income in Hickman is around $50,000. The town has a low unemployment rate, with most of the population employed in the agricultural sector.
Common Questions
What is Per Capita Income in Hickman?
Per Capita income in Hickman is $31,412.
What is the Median Family Income in Hickman?
Median Family Income in Hickman is $83,015.
What is the Median Household income in Hickman?
Median Household Income in Hickman is $83,676.
What is Income or Wage Gap in Hickman?
Income or Wage Gap in Hickman is 63.7%.
Women in Hickman earn 36.3 cents for every dollar earned by a man.
What is Inequality or Gini Index in Hickman?
Inequality or Gini Index in Hickman is 0.34.
What is the Total Population of Hickman?
Total Population of Hickman is 810.
What is the Total Male Population of Hickman?
Total Male Population of Hickman is 388.
What is the Total Female Population of Hickman?
Total Female Population of Hickman is 422.
What is the Ratio of Males per 100 Females in Hickman?
There are 91.94 Males per 100 Females in Hickman.
What is the Ratio of Females per 100 Males in Hickman?
There are 108.76 Females per 100 Males in Hickman.
What is the Median Population Age in Hickman?
Median Population Age in Hickman is 43.6 Years.
What is the Average Family Size in Hickman
Average Family Size in Hickman is 3.4 People.
What is the Average Household Size in Hickman
Average Household Size in Hickman is 3.2 People.
How Large is the Labor Force in Hickman?
There are 469 People in the Labor Forcein in Hickman.
What is the Percentage of People in the Labor Force in Hickman?
70.3% of People are in the Labor Force in Hickman.
What is the Unemployment Rate in Hickman?
Unemployment Rate in Hickman is 17.7%.