Cities with the Highest Percentage of Population with a Degree in Science and Engineering in Montana
RELATED REPORTS & OPTIONS
Science and Engineering
Montana
Compare Cities
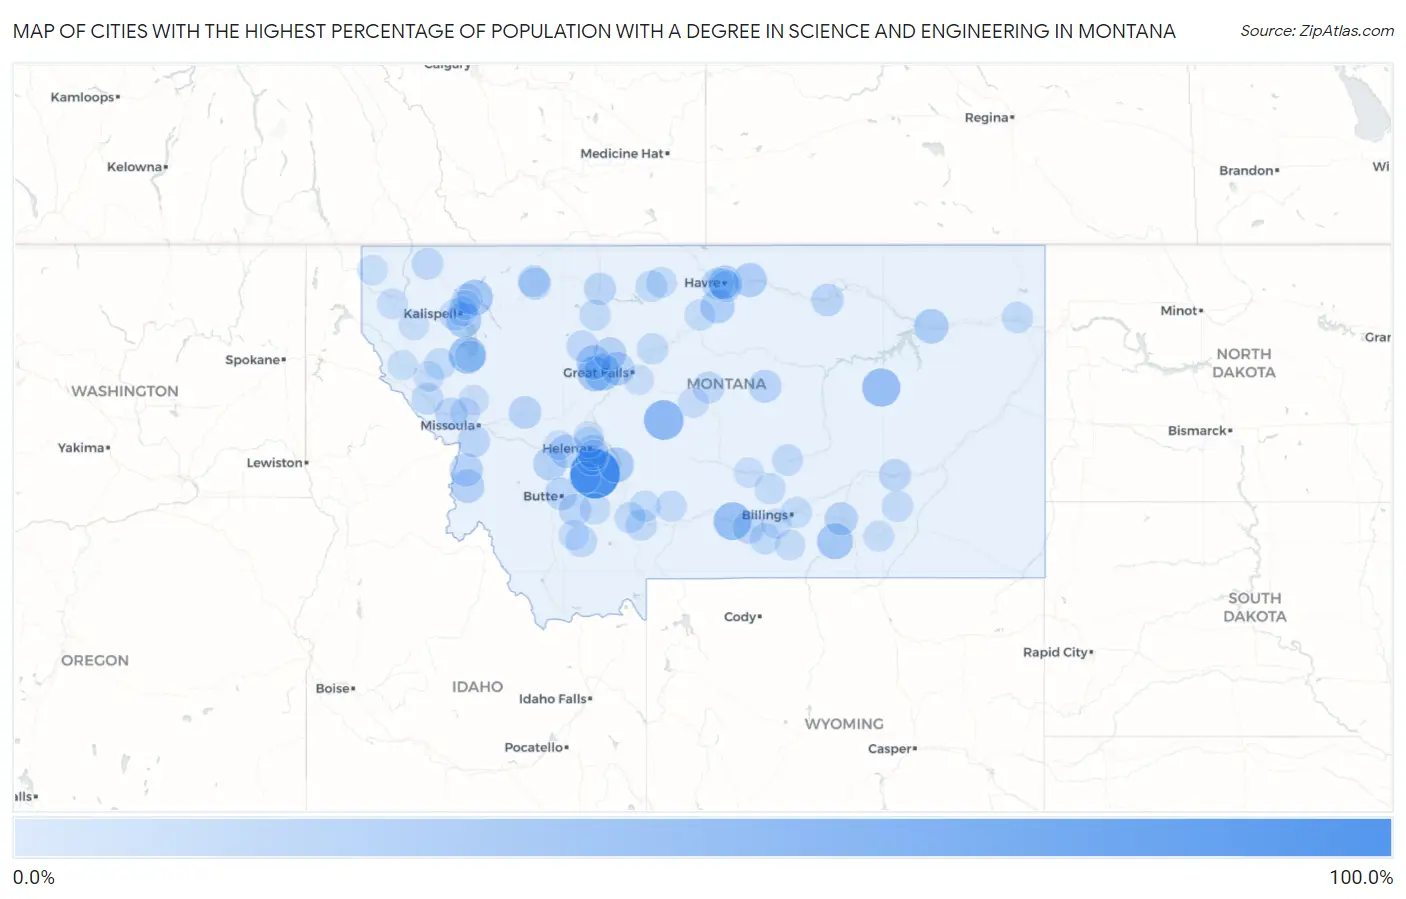
Map of Cities with the Highest Percentage of Population with a Degree in Science and Engineering in Montana
0.0%
100.0%
Cities with the Highest Percentage of Population with a Degree in Science and Engineering in Montana
| City | % Graduates | vs State | vs National | |
| 1. | Acton | 100.0% | 11.0%(+89.0)#1 | 9.8%(+90.2)#148 |
| 2. | Elkhorn | 100.0% | 11.0%(+89.0)#2 | 9.8%(+90.2)#171 |
| 3. | Twin Creeks | 58.6% | 11.0%(+47.6)#3 | 9.8%(+48.8)#432 |
| 4. | Neihart | 55.6% | 11.0%(+44.5)#4 | 9.8%(+45.8)#475 |
| 5. | Rimini | 50.0% | 11.0%(+39.0)#5 | 9.8%(+40.2)#602 |
| 6. | Coffee Creek | 50.0% | 11.0%(+39.0)#6 | 9.8%(+40.2)#625 |
| 7. | Jordan | 48.5% | 11.0%(+37.5)#7 | 9.8%(+38.7)#654 |
| 8. | Reed Point | 47.4% | 11.0%(+36.3)#8 | 9.8%(+37.6)#690 |
| 9. | Fox | 47.4% | 11.0%(+36.3)#9 | 9.8%(+37.6)#693 |
| 10. | Jette | 44.6% | 11.0%(+33.5)#10 | 9.8%(+34.8)#752 |
| 11. | Brandon | 41.7% | 11.0%(+30.6)#11 | 9.8%(+31.9)#892 |
| 12. | Fort Shaw | 40.7% | 11.0%(+29.7)#12 | 9.8%(+31.0)#922 |
| 13. | St Xavier | 38.9% | 11.0%(+27.9)#13 | 9.8%(+29.1)#1,024 |
| 14. | Hungry Horse | 38.6% | 11.0%(+27.6)#14 | 9.8%(+28.8)#1,035 |
| 15. | Forest Hill Village | 36.0% | 11.0%(+25.0)#15 | 9.8%(+26.2)#1,172 |
| 16. | The Silos | 35.3% | 11.0%(+24.3)#16 | 9.8%(+25.5)#1,215 |
| 17. | Simms | 35.1% | 11.0%(+24.1)#17 | 9.8%(+25.3)#1,234 |
| 18. | Rapelje | 35.0% | 11.0%(+24.0)#18 | 9.8%(+25.2)#1,242 |
| 19. | Frazer | 33.3% | 11.0%(+22.3)#19 | 9.8%(+23.6)#1,329 |
| 20. | New Miami Colony | 33.3% | 11.0%(+22.3)#20 | 9.8%(+23.6)#1,360 |
| 21. | Fairfield | 33.0% | 11.0%(+22.0)#21 | 9.8%(+23.2)#1,420 |
| 22. | Pine Creek | 32.3% | 11.0%(+21.2)#22 | 9.8%(+22.5)#1,462 |
| 23. | Sangrey | 31.8% | 11.0%(+20.8)#23 | 9.8%(+22.0)#1,489 |
| 24. | Chinook | 30.9% | 11.0%(+19.9)#24 | 9.8%(+21.1)#1,579 |
| 25. | Havre North | 30.8% | 11.0%(+19.7)#25 | 9.8%(+21.0)#1,590 |
| 26. | Tracy | 30.0% | 11.0%(+19.0)#26 | 9.8%(+20.2)#1,687 |
| 27. | Deer Lodge | 28.6% | 11.0%(+17.6)#27 | 9.8%(+18.9)#1,842 |
| 28. | Charlos Heights | 28.6% | 11.0%(+17.5)#28 | 9.8%(+18.8)#1,898 |
| 29. | Wolf Creek | 28.6% | 11.0%(+17.5)#29 | 9.8%(+18.8)#1,901 |
| 30. | Vaughn | 28.1% | 11.0%(+17.1)#30 | 9.8%(+18.3)#1,947 |
| 31. | Pinesdale | 27.5% | 11.0%(+16.5)#31 | 9.8%(+17.7)#2,014 |
| 32. | Elliston | 27.5% | 11.0%(+16.4)#32 | 9.8%(+17.7)#2,022 |
| 33. | Hardin | 27.1% | 11.0%(+16.1)#33 | 9.8%(+17.3)#2,078 |
| 34. | Roy | 26.3% | 11.0%(+15.3)#34 | 9.8%(+16.5)#2,195 |
| 35. | Power | 26.1% | 11.0%(+15.1)#35 | 9.8%(+16.3)#2,222 |
| 36. | Helmville | 25.0% | 11.0%(+14.0)#36 | 9.8%(+15.2)#2,485 |
| 37. | Ovando | 25.0% | 11.0%(+14.0)#37 | 9.8%(+15.2)#2,494 |
| 38. | Malta | 24.9% | 11.0%(+13.9)#38 | 9.8%(+15.1)#2,504 |
| 39. | Walkerville | 24.8% | 11.0%(+13.8)#39 | 9.8%(+15.0)#2,514 |
| 40. | Columbus | 24.4% | 11.0%(+13.4)#40 | 9.8%(+14.6)#2,579 |
| 41. | Rader Creek | 24.3% | 11.0%(+13.3)#41 | 9.8%(+14.5)#2,593 |
| 42. | Shelby | 23.4% | 11.0%(+12.4)#42 | 9.8%(+13.6)#2,779 |
| 43. | Alberton | 23.4% | 11.0%(+12.4)#43 | 9.8%(+13.6)#2,794 |
| 44. | Carlton | 23.4% | 11.0%(+12.3)#44 | 9.8%(+13.6)#2,798 |
| 45. | Beaver Creek | 23.3% | 11.0%(+12.3)#45 | 9.8%(+13.6)#2,807 |
| 46. | South Browning | 23.2% | 11.0%(+12.1)#46 | 9.8%(+13.4)#2,849 |
| 47. | South Hills | 22.9% | 11.0%(+11.9)#47 | 9.8%(+13.1)#2,928 |
| 48. | Forsyth | 22.7% | 11.0%(+11.7)#48 | 9.8%(+12.9)#2,980 |
| 49. | Denton | 22.0% | 11.0%(+10.9)#49 | 9.8%(+12.2)#3,188 |
| 50. | Sheridan | 21.7% | 11.0%(+10.6)#50 | 9.8%(+11.9)#3,271 |
| 51. | Superior | 21.6% | 11.0%(+10.6)#51 | 9.8%(+11.8)#3,299 |
| 52. | Saddle Butte | 21.4% | 11.0%(+10.4)#52 | 9.8%(+11.6)#3,361 |
| 53. | Fortine | 21.3% | 11.0%(+10.3)#53 | 9.8%(+11.6)#3,393 |
| 54. | North Browning | 21.3% | 11.0%(+10.2)#54 | 9.8%(+11.5)#3,418 |
| 55. | Choteau | 21.2% | 11.0%(+10.2)#55 | 9.8%(+11.4)#3,424 |
| 56. | Chester | 20.7% | 11.0%(+9.65)#56 | 9.8%(+10.9)#3,594 |
| 57. | Joliet | 20.7% | 11.0%(+9.64)#57 | 9.8%(+10.9)#3,595 |
| 58. | Batavia | 20.3% | 11.0%(+9.28)#58 | 9.8%(+10.5)#3,703 |
| 59. | Camp Three | 20.0% | 11.0%(+8.98)#59 | 9.8%(+10.2)#3,867 |
| 60. | Carter | 20.0% | 11.0%(+8.98)#60 | 9.8%(+10.2)#3,887 |
| 61. | Colstrip | 20.0% | 11.0%(+8.93)#61 | 9.8%(+10.2)#3,907 |
| 62. | King Arthur Park | 19.9% | 11.0%(+8.86)#62 | 9.8%(+10.1)#3,921 |
| 63. | Culbertson | 19.9% | 11.0%(+8.85)#63 | 9.8%(+10.1)#3,924 |
| 64. | Springhill | 19.7% | 11.0%(+8.65)#64 | 9.8%(+9.89)#3,977 |
| 65. | Conrad | 19.6% | 11.0%(+8.57)#65 | 9.8%(+9.81)#3,997 |
| 66. | Hot Springs | 19.5% | 11.0%(+8.49)#66 | 9.8%(+9.73)#4,032 |
| 67. | Amsterdam | 19.5% | 11.0%(+8.49)#67 | 9.8%(+9.73)#4,038 |
| 68. | Broadview | 18.9% | 11.0%(+7.90)#68 | 9.8%(+9.14)#4,265 |
| 69. | Big Sandy | 18.9% | 11.0%(+7.83)#69 | 9.8%(+9.07)#4,291 |
| 70. | Cardwell | 18.8% | 11.0%(+7.73)#70 | 9.8%(+8.97)#4,368 |
| 71. | Clyde Park | 18.6% | 11.0%(+7.58)#71 | 9.8%(+8.82)#4,417 |
| 72. | Polson | 18.3% | 11.0%(+7.31)#72 | 9.8%(+8.55)#4,546 |
| 73. | Boulder | 18.3% | 11.0%(+7.25)#73 | 9.8%(+8.49)#4,568 |
| 74. | Lockwood | 18.3% | 11.0%(+7.24)#74 | 9.8%(+8.48)#4,575 |
| 75. | Helena Valley West Central | 18.2% | 11.0%(+7.16)#75 | 9.8%(+8.40)#4,597 |
| 76. | Joplin | 18.2% | 11.0%(+7.16)#76 | 9.8%(+8.40)#4,622 |
| 77. | Havre | 18.1% | 11.0%(+7.08)#77 | 9.8%(+8.32)#4,669 |
| 78. | Plains | 17.7% | 11.0%(+6.67)#78 | 9.8%(+7.91)#4,841 |
| 79. | Busby | 17.6% | 11.0%(+6.63)#79 | 9.8%(+7.87)#4,873 |
| 80. | Pioneer Junction | 17.4% | 11.0%(+6.37)#80 | 9.8%(+7.61)#5,005 |
| 81. | Stanford | 17.2% | 11.0%(+6.22)#81 | 9.8%(+7.46)#5,086 |
| 82. | Clancy | 17.2% | 11.0%(+6.17)#82 | 9.8%(+7.41)#5,105 |
| 83. | Laurel | 16.7% | 11.0%(+5.72)#83 | 9.8%(+6.96)#5,342 |
| 84. | Pryor | 16.7% | 11.0%(+5.65)#84 | 9.8%(+6.89)#5,387 |
| 85. | Maverick Mountain | 16.7% | 11.0%(+5.65)#85 | 9.8%(+6.89)#5,491 |
| 86. | Wise River | 16.7% | 11.0%(+5.65)#86 | 9.8%(+6.89)#5,498 |
| 87. | Sylvanite | 16.1% | 11.0%(+5.11)#87 | 9.8%(+6.35)#5,778 |
| 88. | Twin Bridges | 15.9% | 11.0%(+4.89)#88 | 9.8%(+6.13)#5,911 |
| 89. | Sand Coulee | 15.7% | 11.0%(+4.66)#89 | 9.8%(+5.90)#6,080 |
| 90. | Happys Inn | 15.7% | 11.0%(+4.66)#90 | 9.8%(+5.90)#6,081 |
| 91. | Columbia Falls | 15.5% | 11.0%(+4.47)#91 | 9.8%(+5.71)#6,207 |
| 92. | Arlee | 15.5% | 11.0%(+4.43)#92 | 9.8%(+5.67)#6,227 |
| 93. | Ryegate | 15.4% | 11.0%(+4.36)#93 | 9.8%(+5.60)#6,303 |
| 94. | Helena Valley Northwest | 15.3% | 11.0%(+4.31)#94 | 9.8%(+5.55)#6,348 |
| 95. | Montana City | 15.3% | 11.0%(+4.25)#95 | 9.8%(+5.49)#6,392 |
| 96. | Thompson Falls | 15.2% | 11.0%(+4.17)#96 | 9.8%(+5.41)#6,445 |
| 97. | Evergreen | 15.1% | 11.0%(+4.07)#97 | 9.8%(+5.31)#6,527 |
| 98. | Frenchtown | 15.0% | 11.0%(+3.99)#98 | 9.8%(+5.23)#6,579 |
| 99. | Helena Flats | 14.4% | 11.0%(+3.38)#99 | 9.8%(+4.62)#7,067 |
| 100. | Avon | 14.3% | 11.0%(+3.26)#100 | 9.8%(+4.50)#7,227 |
Common Questions
What are the Top 10 Cities with the Highest Percentage of Population with a Degree in Science and Engineering in Montana?
Top 10 Cities with the Highest Percentage of Population with a Degree in Science and Engineering in Montana are:
#1
100.0%
#2
55.6%
#3
48.5%
#4
47.4%
#5
44.6%
#6
40.7%
#7
38.9%
#8
38.6%
#9
36.0%
#10
35.3%
What city has the Highest Percentage of Population with a Degree in Science and Engineering in Montana?
Elkhorn has the Highest Percentage of Population with a Degree in Science and Engineering in Montana with 100.0%.
What is the Percentage of Population with a Degree in Science and Engineering in the State of Montana?
Percentage of Population with a Degree in Science and Engineering in Montana is 11.0%.
What is the Percentage of Population with a Degree in Science and Engineering in the United States?
Percentage of Population with a Degree in Science and Engineering in the United States is 9.8%.