Cities with the Highest Percentage of Population with a Degree in Science and Engineering in Tennessee
RELATED REPORTS & OPTIONS
Science and Engineering
Tennessee
Compare Cities
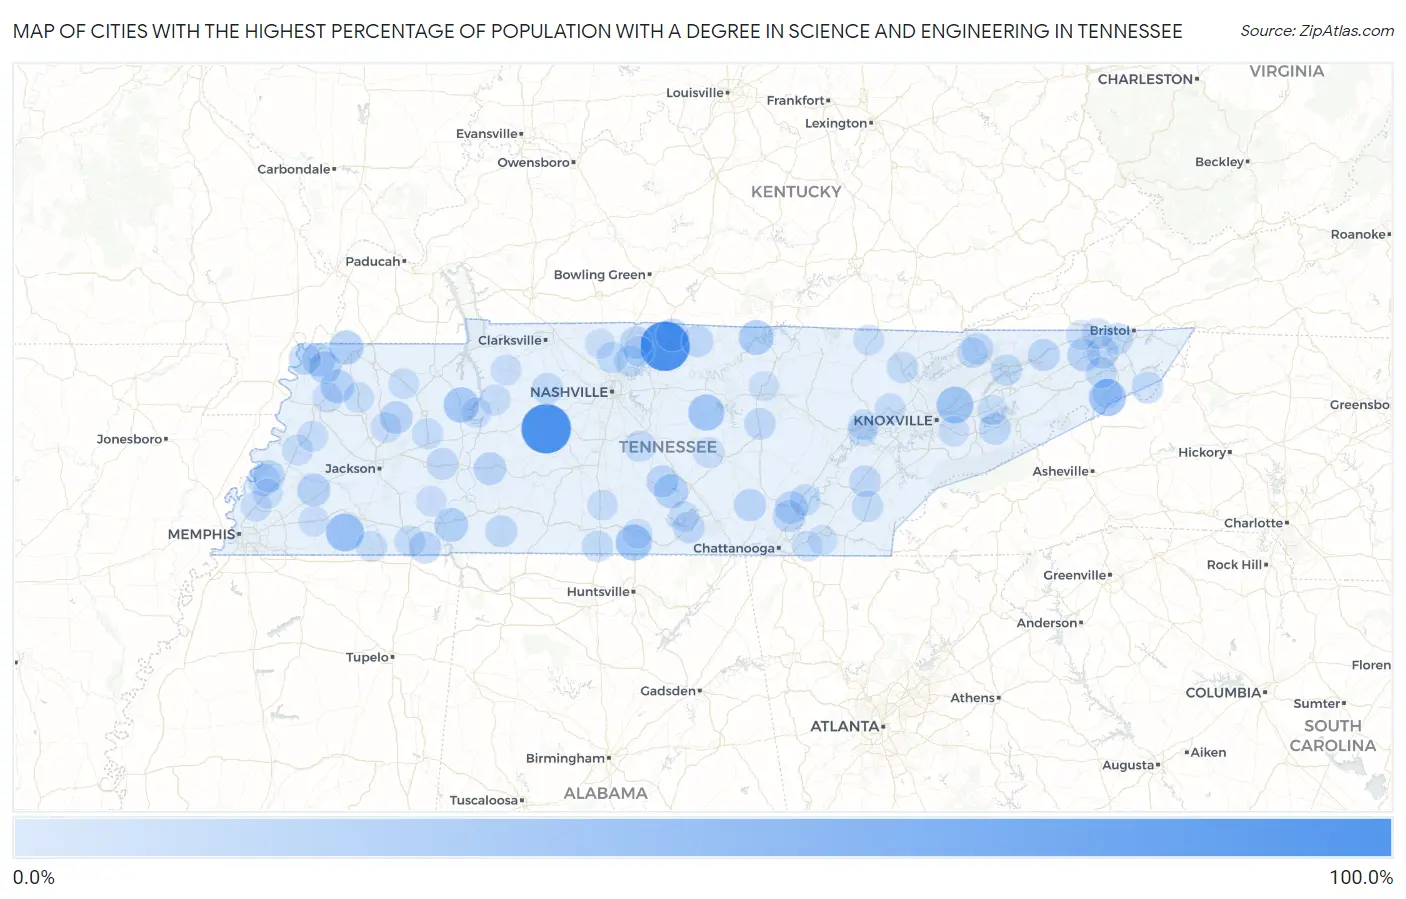
Map of Cities with the Highest Percentage of Population with a Degree in Science and Engineering in Tennessee
0.0%
100.0%
Cities with the Highest Percentage of Population with a Degree in Science and Engineering in Tennessee
| City | % Graduates | vs State | vs National | |
| 1. | Fowlkes | 100.0% | 10.9%(+89.1)#1 | 9.8%(+90.2)#11 |
| 2. | Lenox | 100.0% | 10.9%(+89.1)#2 | 9.8%(+90.2)#33 |
| 3. | Wrigley | 100.0% | 10.9%(+89.1)#3 | 9.8%(+90.2)#35 |
| 4. | Bethpage | 100.0% | 10.9%(+89.1)#4 | 9.8%(+90.2)#59 |
| 5. | Whiteside | 100.0% | 10.9%(+89.1)#5 | 9.8%(+90.2)#94 |
| 6. | Oak Grove Cdp Sumner County | 62.9% | 10.9%(+51.9)#6 | 9.8%(+53.1)#367 |
| 7. | Palmersville | 56.2% | 10.9%(+45.3)#7 | 9.8%(+46.5)#456 |
| 8. | Hilham | 50.0% | 10.9%(+39.1)#8 | 9.8%(+40.2)#558 |
| 9. | Hickory Valley | 50.0% | 10.9%(+39.1)#9 | 9.8%(+40.2)#591 |
| 10. | Finley | 46.6% | 10.9%(+35.7)#10 | 9.8%(+36.8)#713 |
| 11. | Banner Hill | 46.0% | 10.9%(+35.1)#11 | 9.8%(+36.2)#722 |
| 12. | Mascot | 44.6% | 10.9%(+33.6)#12 | 9.8%(+34.8)#753 |
| 13. | Park City | 42.5% | 10.9%(+31.6)#13 | 9.8%(+32.7)#854 |
| 14. | Dowelltown | 42.4% | 10.9%(+31.5)#14 | 9.8%(+32.6)#855 |
| 15. | Ocoee | 39.5% | 10.9%(+28.6)#15 | 9.8%(+29.8)#990 |
| 16. | Camden | 39.2% | 10.9%(+28.3)#16 | 9.8%(+29.4)#996 |
| 17. | Celina | 36.5% | 10.9%(+25.6)#17 | 9.8%(+26.7)#1,140 |
| 18. | Bon Air | 36.4% | 10.9%(+25.4)#18 | 9.8%(+26.6)#1,149 |
| 19. | Woodland Mills | 35.0% | 10.9%(+24.1)#19 | 9.8%(+25.2)#1,239 |
| 20. | Hampton | 33.9% | 10.9%(+23.0)#20 | 9.8%(+24.1)#1,296 |
| 21. | Olivet | 33.3% | 10.9%(+22.4)#21 | 9.8%(+23.6)#1,315 |
| 22. | Normandy | 33.3% | 10.9%(+22.4)#22 | 9.8%(+23.6)#1,383 |
| 23. | Trimble | 31.7% | 10.9%(+20.8)#23 | 9.8%(+21.9)#1,502 |
| 24. | Stanton | 30.2% | 10.9%(+19.3)#24 | 9.8%(+20.5)#1,646 |
| 25. | Samburg | 29.4% | 10.9%(+18.5)#25 | 9.8%(+19.6)#1,754 |
| 26. | Westmoreland | 29.2% | 10.9%(+18.2)#26 | 9.8%(+19.4)#1,776 |
| 27. | Blanche | 29.2% | 10.9%(+18.2)#27 | 9.8%(+19.4)#1,787 |
| 28. | Linden | 28.9% | 10.9%(+18.0)#28 | 9.8%(+19.1)#1,824 |
| 29. | Atwood | 28.8% | 10.9%(+17.9)#29 | 9.8%(+19.0)#1,833 |
| 30. | Fall Branch | 28.7% | 10.9%(+17.7)#30 | 9.8%(+18.9)#1,841 |
| 31. | Flat Top Mountain | 28.1% | 10.9%(+17.2)#31 | 9.8%(+18.3)#1,944 |
| 32. | Hornbeak | 27.5% | 10.9%(+16.6)#32 | 9.8%(+17.7)#2,016 |
| 33. | Biltmore | 27.4% | 10.9%(+16.5)#33 | 9.8%(+17.7)#2,024 |
| 34. | New Deal | 27.3% | 10.9%(+16.4)#34 | 9.8%(+17.5)#2,058 |
| 35. | Palmer | 27.0% | 10.9%(+16.1)#35 | 9.8%(+17.2)#2,088 |
| 36. | Gilt Edge | 26.7% | 10.9%(+15.7)#36 | 9.8%(+16.9)#2,129 |
| 37. | Wartrace | 26.4% | 10.9%(+15.5)#37 | 9.8%(+16.7)#2,168 |
| 38. | Mowbray Mountain | 26.2% | 10.9%(+15.3)#38 | 9.8%(+16.4)#2,205 |
| 39. | Tiptonville | 26.2% | 10.9%(+15.2)#39 | 9.8%(+16.4)#2,209 |
| 40. | Rogersville | 25.9% | 10.9%(+15.0)#40 | 9.8%(+16.2)#2,241 |
| 41. | Burlison | 25.9% | 10.9%(+14.9)#41 | 9.8%(+16.1)#2,262 |
| 42. | Spurgeon | 25.7% | 10.9%(+14.8)#42 | 9.8%(+16.0)#2,284 |
| 43. | Michie | 25.5% | 10.9%(+14.6)#43 | 9.8%(+15.8)#2,311 |
| 44. | Fairgarden | 25.5% | 10.9%(+14.5)#44 | 9.8%(+15.7)#2,327 |
| 45. | Collinwood | 25.3% | 10.9%(+14.4)#45 | 9.8%(+15.5)#2,346 |
| 46. | Lafayette | 25.3% | 10.9%(+14.4)#46 | 9.8%(+15.5)#2,353 |
| 47. | Roan Mountain | 25.3% | 10.9%(+14.4)#47 | 9.8%(+15.5)#2,354 |
| 48. | Gladeville | 25.2% | 10.9%(+14.3)#48 | 9.8%(+15.4)#2,361 |
| 49. | Niota | 24.6% | 10.9%(+13.7)#49 | 9.8%(+14.8)#2,541 |
| 50. | Sparta | 24.5% | 10.9%(+13.6)#50 | 9.8%(+14.7)#2,556 |
| 51. | Winchester | 24.4% | 10.9%(+13.5)#51 | 9.8%(+14.7)#2,567 |
| 52. | Tazewell | 24.4% | 10.9%(+13.5)#52 | 9.8%(+14.7)#2,568 |
| 53. | Chesterfield | 24.3% | 10.9%(+13.4)#53 | 9.8%(+14.5)#2,589 |
| 54. | Blountville | 23.6% | 10.9%(+12.7)#54 | 9.8%(+13.9)#2,725 |
| 55. | Charlotte | 23.6% | 10.9%(+12.6)#55 | 9.8%(+13.8)#2,740 |
| 56. | Caryville | 23.5% | 10.9%(+12.6)#56 | 9.8%(+13.7)#2,767 |
| 57. | Shackle Island | 23.2% | 10.9%(+12.3)#57 | 9.8%(+13.4)#2,835 |
| 58. | Etowah | 23.2% | 10.9%(+12.3)#58 | 9.8%(+13.4)#2,842 |
| 59. | Ridgetop | 23.2% | 10.9%(+12.2)#59 | 9.8%(+13.4)#2,846 |
| 60. | Jonesborough | 23.1% | 10.9%(+12.2)#60 | 9.8%(+13.3)#2,863 |
| 61. | Sale Creek | 23.0% | 10.9%(+12.1)#61 | 9.8%(+13.2)#2,903 |
| 62. | Rockvale | 23.0% | 10.9%(+12.1)#62 | 9.8%(+13.2)#2,904 |
| 63. | Bean Station | 22.9% | 10.9%(+12.0)#63 | 9.8%(+13.2)#2,919 |
| 64. | Elkton | 22.9% | 10.9%(+11.9)#64 | 9.8%(+13.1)#2,936 |
| 65. | Eastview | 22.5% | 10.9%(+11.6)#65 | 9.8%(+12.7)#3,043 |
| 66. | Clarksburg | 21.7% | 10.9%(+10.8)#66 | 9.8%(+12.0)#3,249 |
| 67. | Valley Forge | 21.7% | 10.9%(+10.8)#67 | 9.8%(+11.9)#3,268 |
| 68. | Ripley | 21.4% | 10.9%(+10.5)#68 | 9.8%(+11.6)#3,373 |
| 69. | Harriman | 21.4% | 10.9%(+10.4)#69 | 9.8%(+11.6)#3,385 |
| 70. | Waverly | 21.3% | 10.9%(+10.4)#70 | 9.8%(+11.5)#3,396 |
| 71. | Bloomingdale | 21.3% | 10.9%(+10.4)#71 | 9.8%(+11.5)#3,397 |
| 72. | Centertown | 21.2% | 10.9%(+10.3)#72 | 9.8%(+11.4)#3,433 |
| 73. | Milan | 21.2% | 10.9%(+10.3)#73 | 9.8%(+11.4)#3,441 |
| 74. | Middleton | 21.0% | 10.9%(+10.1)#74 | 9.8%(+11.2)#3,487 |
| 75. | Gates | 20.9% | 10.9%(+10.0)#75 | 9.8%(+11.1)#3,507 |
| 76. | Rutherford | 20.9% | 10.9%(+9.99)#76 | 9.8%(+11.1)#3,510 |
| 77. | Oliver Springs | 20.9% | 10.9%(+9.94)#77 | 9.8%(+11.1)#3,519 |
| 78. | Oneida | 20.7% | 10.9%(+9.83)#78 | 9.8%(+11.0)#3,561 |
| 79. | Millington | 20.7% | 10.9%(+9.76)#79 | 9.8%(+10.9)#3,589 |
| 80. | Gleason | 20.4% | 10.9%(+9.44)#80 | 9.8%(+10.6)#3,688 |
| 81. | Cornersville | 20.2% | 10.9%(+9.31)#81 | 9.8%(+10.4)#3,725 |
| 82. | New Tazewell | 20.2% | 10.9%(+9.25)#82 | 9.8%(+10.4)#3,745 |
| 83. | Estill Springs | 20.1% | 10.9%(+9.15)#83 | 9.8%(+10.3)#3,767 |
| 84. | Milledgeville | 20.0% | 10.9%(+9.08)#84 | 9.8%(+10.2)#3,839 |
| 85. | Seymour | 19.9% | 10.9%(+8.99)#85 | 9.8%(+10.1)#3,915 |
| 86. | Erin | 19.9% | 10.9%(+8.96)#86 | 9.8%(+10.1)#3,923 |
| 87. | Somerville | 19.8% | 10.9%(+8.93)#87 | 9.8%(+10.1)#3,929 |
| 88. | New Johnsonville | 19.6% | 10.9%(+8.65)#88 | 9.8%(+9.78)#4,004 |
| 89. | Cottontown | 19.4% | 10.9%(+8.48)#89 | 9.8%(+9.62)#4,072 |
| 90. | Collegedale | 19.0% | 10.9%(+8.06)#90 | 9.8%(+9.20)#4,233 |
| 91. | Newbern | 18.9% | 10.9%(+8.02)#91 | 9.8%(+9.15)#4,247 |
| 92. | Midtown | 18.8% | 10.9%(+7.87)#92 | 9.8%(+9.00)#4,323 |
| 93. | Dandridge | 18.7% | 10.9%(+7.79)#93 | 9.8%(+8.92)#4,375 |
| 94. | Erwin | 18.6% | 10.9%(+7.70)#94 | 9.8%(+8.84)#4,409 |
| 95. | South Cleveland | 18.5% | 10.9%(+7.61)#95 | 9.8%(+8.75)#4,448 |
| 96. | Fayetteville | 18.4% | 10.9%(+7.49)#96 | 9.8%(+8.63)#4,507 |
| 97. | Algood | 18.3% | 10.9%(+7.42)#97 | 9.8%(+8.56)#4,541 |
| 98. | Atoka | 18.2% | 10.9%(+7.33)#98 | 9.8%(+8.47)#4,579 |
| 99. | Springfield | 18.2% | 10.9%(+7.28)#99 | 9.8%(+8.42)#4,595 |
| 100. | Mount Carmel | 18.0% | 10.9%(+7.07)#100 | 9.8%(+8.20)#4,711 |
Common Questions
What are the Top 10 Cities with the Highest Percentage of Population with a Degree in Science and Engineering in Tennessee?
Top 10 Cities with the Highest Percentage of Population with a Degree in Science and Engineering in Tennessee are:
#1
100.0%
#2
100.0%
#3
50.0%
#4
46.0%
#5
44.6%
#6
42.5%
#7
42.4%
#8
39.2%
#9
36.5%
#10
35.0%
What city has the Highest Percentage of Population with a Degree in Science and Engineering in Tennessee?
Wrigley has the Highest Percentage of Population with a Degree in Science and Engineering in Tennessee with 100.0%.
What is the Percentage of Population with a Degree in Science and Engineering in the State of Tennessee?
Percentage of Population with a Degree in Science and Engineering in Tennessee is 10.9%.
What is the Percentage of Population with a Degree in Science and Engineering in the United States?
Percentage of Population with a Degree in Science and Engineering in the United States is 9.8%.