Cities with the Highest Percentage of Population with a Degree in Science and Engineering in Maryland
RELATED REPORTS & OPTIONS
Science and Engineering
Maryland
Compare Cities
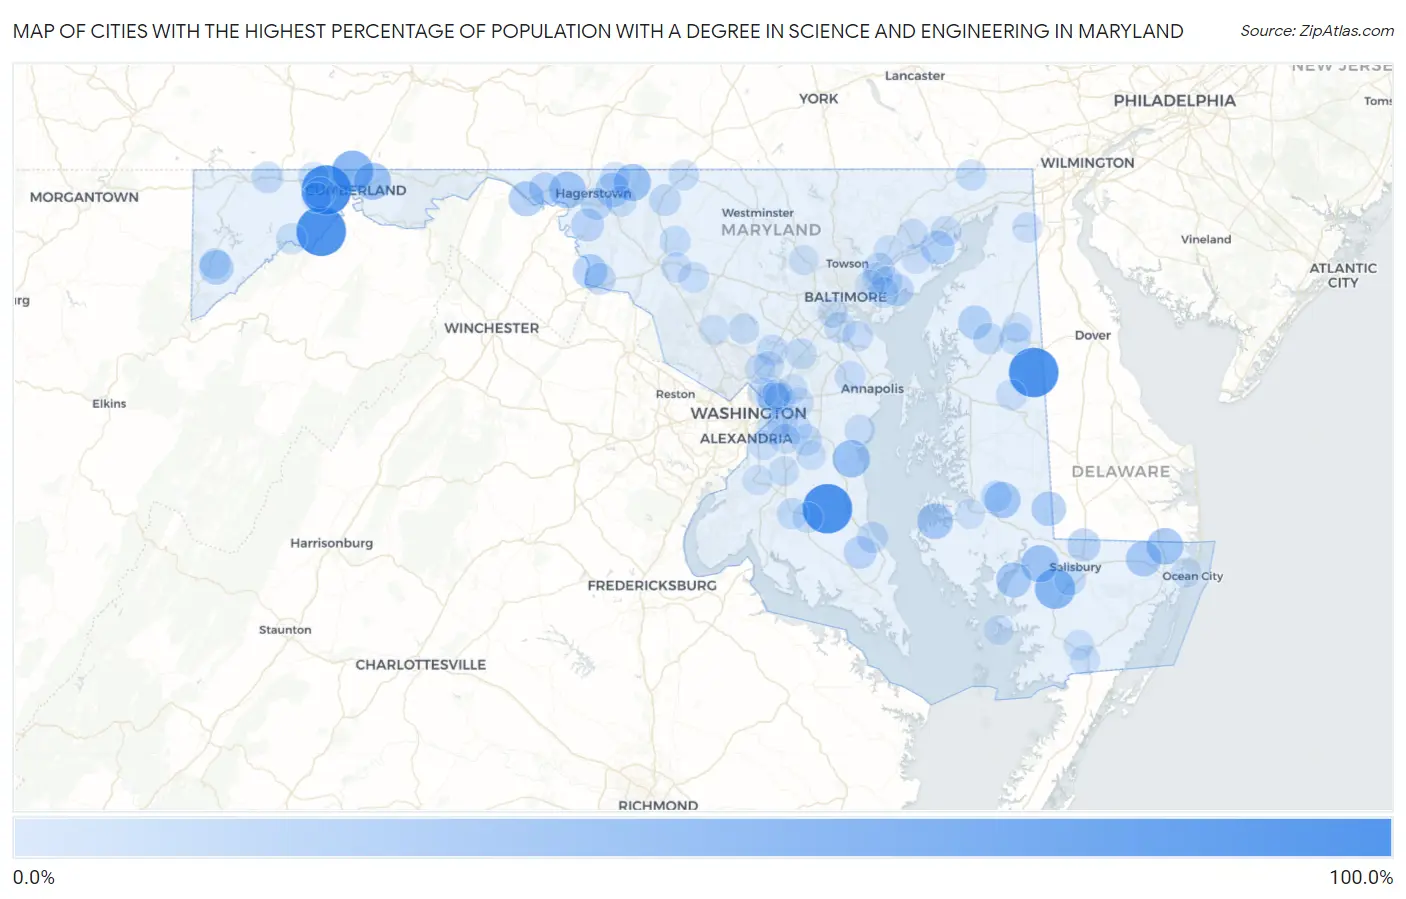
Map of Cities with the Highest Percentage of Population with a Degree in Science and Engineering in Maryland
0.0%
100.0%
Cities with the Highest Percentage of Population with a Degree in Science and Engineering in Maryland
| City | % Graduates | vs State | vs National | |
| 1. | Danville | 100.0% | 8.8%(+91.2)#1 | 9.8%(+90.2)#22 |
| 2. | Eckhart Mines | 100.0% | 8.8%(+91.2)#2 | 9.8%(+90.2)#34 |
| 3. | Goldsboro | 100.0% | 8.8%(+91.2)#3 | 9.8%(+90.2)#82 |
| 4. | Eagle Harbor | 100.0% | 8.8%(+91.2)#4 | 9.8%(+90.2)#181 |
| 5. | Ellerslie | 61.5% | 8.8%(+52.7)#5 | 9.8%(+51.8)#384 |
| 6. | Allen | 56.8% | 8.8%(+48.0)#6 | 9.8%(+47.0)#450 |
| 7. | Friendship | 43.4% | 8.8%(+34.6)#7 | 9.8%(+33.7)#809 |
| 8. | Quantico | 43.2% | 8.8%(+34.4)#8 | 9.8%(+33.5)#818 |
| 9. | Pleasant Grove | 42.6% | 8.8%(+33.7)#9 | 9.8%(+32.8)#852 |
| 10. | Edgemont | 41.9% | 8.8%(+33.1)#10 | 9.8%(+32.2)#876 |
| 11. | Wilson Conococheague | 40.5% | 8.8%(+31.7)#11 | 9.8%(+30.7)#929 |
| 12. | Bishopville | 39.6% | 8.8%(+30.8)#12 | 9.8%(+29.8)#987 |
| 13. | East New Market | 38.5% | 8.8%(+29.7)#13 | 9.8%(+28.7)#1,041 |
| 14. | Madison | 36.0% | 8.8%(+27.2)#14 | 9.8%(+26.2)#1,173 |
| 15. | Whaleyville | 35.3% | 8.8%(+26.5)#15 | 9.8%(+25.5)#1,221 |
| 16. | Lisbon | 35.3% | 8.8%(+26.5)#16 | 9.8%(+25.5)#1,223 |
| 17. | Crumpton | 33.8% | 8.8%(+25.0)#17 | 9.8%(+24.0)#1,298 |
| 18. | Tyaskin | 33.3% | 8.8%(+24.5)#18 | 9.8%(+23.6)#1,387 |
| 19. | Big Pool | 33.3% | 8.8%(+24.5)#19 | 9.8%(+23.6)#1,408 |
| 20. | Galestown | 31.2% | 8.8%(+22.4)#20 | 9.8%(+21.5)#1,552 |
| 21. | Chewsville | 30.9% | 8.8%(+22.1)#21 | 9.8%(+21.1)#1,584 |
| 22. | Loch Lynn Heights | 30.6% | 8.8%(+21.8)#22 | 9.8%(+20.9)#1,613 |
| 23. | Dargan | 30.2% | 8.8%(+21.4)#23 | 9.8%(+20.4)#1,653 |
| 24. | Perryman | 28.6% | 8.8%(+19.8)#24 | 9.8%(+18.8)#1,846 |
| 25. | Kingstown | 28.1% | 8.8%(+19.3)#25 | 9.8%(+18.3)#1,946 |
| 26. | Delmar | 24.9% | 8.8%(+16.1)#26 | 9.8%(+15.1)#2,501 |
| 27. | Graceham | 24.2% | 8.8%(+15.4)#27 | 9.8%(+14.4)#2,606 |
| 28. | Fairplay | 24.0% | 8.8%(+15.2)#28 | 9.8%(+14.2)#2,648 |
| 29. | Broomes Island | 23.1% | 8.8%(+14.3)#29 | 9.8%(+13.3)#2,875 |
| 30. | Clear Spring | 22.9% | 8.8%(+14.1)#30 | 9.8%(+13.1)#2,924 |
| 31. | Bowleys Quarters | 21.5% | 8.8%(+12.7)#31 | 9.8%(+11.7)#3,319 |
| 32. | Edmonston | 21.4% | 8.8%(+12.6)#32 | 9.8%(+11.6)#3,381 |
| 33. | Bladensburg | 20.8% | 8.8%(+12.0)#33 | 9.8%(+11.0)#3,549 |
| 34. | Funkstown | 20.4% | 8.8%(+11.6)#34 | 9.8%(+10.7)#3,673 |
| 35. | Silver Hill | 20.4% | 8.8%(+11.6)#35 | 9.8%(+10.6)#3,683 |
| 36. | Garretts Mill | 19.4% | 8.8%(+10.6)#36 | 9.8%(+9.60)#4,082 |
| 37. | White Marsh | 18.9% | 8.8%(+10.1)#37 | 9.8%(+9.11)#4,273 |
| 38. | Grantsville | 18.8% | 8.8%(+10.0)#38 | 9.8%(+9.04)#4,306 |
| 39. | Thurmont | 18.4% | 8.8%(+9.63)#39 | 9.8%(+8.66)#4,493 |
| 40. | Barclay | 18.2% | 8.8%(+9.37)#40 | 9.8%(+8.40)#4,631 |
| 41. | Church Hill | 18.1% | 8.8%(+9.33)#41 | 9.8%(+8.36)#4,654 |
| 42. | St Leonard | 17.9% | 8.8%(+9.14)#42 | 9.8%(+8.17)#4,729 |
| 43. | Landover Hills | 17.7% | 8.8%(+8.89)#43 | 9.8%(+7.91)#4,839 |
| 44. | Bryantown | 17.7% | 8.8%(+8.89)#44 | 9.8%(+7.91)#4,840 |
| 45. | Secretary | 17.5% | 8.8%(+8.74)#45 | 9.8%(+7.76)#4,929 |
| 46. | Fruitland | 17.3% | 8.8%(+8.53)#46 | 9.8%(+7.56)#5,030 |
| 47. | Queensland | 17.3% | 8.8%(+8.48)#47 | 9.8%(+7.50)#5,052 |
| 48. | Ferndale | 16.9% | 8.8%(+8.06)#48 | 9.8%(+7.09)#5,286 |
| 49. | Finzel | 16.7% | 8.8%(+7.86)#49 | 9.8%(+6.89)#5,385 |
| 50. | Walkersville | 16.2% | 8.8%(+7.37)#50 | 9.8%(+6.40)#5,740 |
| 51. | Rising Sun | 16.2% | 8.8%(+7.35)#51 | 9.8%(+6.38)#5,753 |
| 52. | Mountain Lake Park | 16.1% | 8.8%(+7.25)#52 | 9.8%(+6.27)#5,819 |
| 53. | Grahamtown | 16.0% | 8.8%(+7.19)#53 | 9.8%(+6.22)#5,859 |
| 54. | Westernport | 15.9% | 8.8%(+7.12)#54 | 9.8%(+6.15)#5,892 |
| 55. | Maryland City | 15.7% | 8.8%(+6.93)#55 | 9.8%(+5.95)#6,045 |
| 56. | Essex | 15.7% | 8.8%(+6.89)#56 | 9.8%(+5.92)#6,067 |
| 57. | Burtonsville | 15.4% | 8.8%(+6.61)#57 | 9.8%(+5.64)#6,253 |
| 58. | Jugtown | 15.4% | 8.8%(+6.58)#58 | 9.8%(+5.60)#6,314 |
| 59. | Ridgely | 15.3% | 8.8%(+6.48)#59 | 9.8%(+5.51)#6,374 |
| 60. | Rossville | 15.1% | 8.8%(+6.24)#60 | 9.8%(+5.27)#6,558 |
| 61. | Hughesville | 15.0% | 8.8%(+6.21)#61 | 9.8%(+5.23)#6,578 |
| 62. | Crownsville | 14.8% | 8.8%(+5.95)#62 | 9.8%(+4.98)#6,795 |
| 63. | Emmitsburg | 14.6% | 8.8%(+5.81)#63 | 9.8%(+4.84)#6,893 |
| 64. | Leitersburg | 14.5% | 8.8%(+5.74)#64 | 9.8%(+4.76)#6,949 |
| 65. | Brookeville | 14.5% | 8.8%(+5.65)#65 | 9.8%(+4.68)#7,013 |
| 66. | Westphalia | 14.4% | 8.8%(+5.64)#66 | 9.8%(+4.67)#7,028 |
| 67. | Monrovia | 14.4% | 8.8%(+5.63)#67 | 9.8%(+4.66)#7,036 |
| 68. | District Heights | 14.3% | 8.8%(+5.51)#68 | 9.8%(+4.54)#7,114 |
| 69. | Galesville | 14.3% | 8.8%(+5.51)#69 | 9.8%(+4.54)#7,115 |
| 70. | Lansdowne | 14.3% | 8.8%(+5.48)#70 | 9.8%(+4.50)#7,129 |
| 71. | Aberdeen | 13.9% | 8.8%(+5.08)#71 | 9.8%(+4.10)#7,556 |
| 72. | Abingdon | 13.7% | 8.8%(+4.94)#72 | 9.8%(+3.97)#7,686 |
| 73. | Pasadena | 13.7% | 8.8%(+4.86)#73 | 9.8%(+3.88)#7,746 |
| 74. | Chesapeake City | 13.6% | 8.8%(+4.74)#74 | 9.8%(+3.77)#7,869 |
| 75. | White Oak | 13.5% | 8.8%(+4.71)#75 | 9.8%(+3.74)#7,889 |
| 76. | Calverton | 13.2% | 8.8%(+4.43)#76 | 9.8%(+3.45)#8,192 |
| 77. | Mitchellville | 13.1% | 8.8%(+4.31)#77 | 9.8%(+3.34)#8,324 |
| 78. | Bel Air South | 13.1% | 8.8%(+4.28)#78 | 9.8%(+3.30)#8,353 |
| 79. | Edgewood | 13.0% | 8.8%(+4.23)#79 | 9.8%(+3.26)#8,425 |
| 80. | Middle River | 12.8% | 8.8%(+4.01)#80 | 9.8%(+3.04)#8,685 |
| 81. | Bartonsville | 12.8% | 8.8%(+4.00)#81 | 9.8%(+3.03)#8,690 |
| 82. | Chillum | 12.8% | 8.8%(+3.96)#82 | 9.8%(+2.98)#8,731 |
| 83. | Brandywine | 12.7% | 8.8%(+3.90)#83 | 9.8%(+2.92)#8,790 |
| 84. | West Pocomoke | 12.6% | 8.8%(+3.78)#84 | 9.8%(+2.81)#8,896 |
| 85. | Seabrook | 12.4% | 8.8%(+3.63)#85 | 9.8%(+2.65)#9,125 |
| 86. | Pocomoke City | 12.3% | 8.8%(+3.46)#86 | 9.8%(+2.49)#9,305 |
| 87. | Croom | 12.2% | 8.8%(+3.43)#87 | 9.8%(+2.46)#9,351 |
| 88. | East Riverdale | 12.2% | 8.8%(+3.42)#88 | 9.8%(+2.44)#9,363 |
| 89. | Accokeek | 12.2% | 8.8%(+3.37)#89 | 9.8%(+2.40)#9,424 |
| 90. | Oxon Hill | 12.2% | 8.8%(+3.37)#90 | 9.8%(+2.39)#9,430 |
| 91. | Kingsville | 12.1% | 8.8%(+3.25)#91 | 9.8%(+2.27)#9,582 |
| 92. | Andrews Afb | 12.0% | 8.8%(+3.23)#92 | 9.8%(+2.26)#9,606 |
| 93. | Sudlersville | 12.0% | 8.8%(+3.19)#93 | 9.8%(+2.22)#9,655 |
| 94. | Deal Island | 12.0% | 8.8%(+3.19)#94 | 9.8%(+2.22)#9,658 |
| 95. | Montgomery Village | 12.0% | 8.8%(+3.16)#95 | 9.8%(+2.18)#9,703 |
| 96. | West Ocean City | 11.9% | 8.8%(+3.10)#96 | 9.8%(+2.12)#9,785 |
| 97. | Owings Mills | 11.9% | 8.8%(+3.07)#97 | 9.8%(+2.09)#9,828 |
| 98. | Cambridge | 11.9% | 8.8%(+3.05)#98 | 9.8%(+2.08)#9,854 |
| 99. | Rosedale | 11.8% | 8.8%(+2.99)#99 | 9.8%(+2.02)#9,923 |
| 100. | Shaft | 11.7% | 8.8%(+2.92)#100 | 9.8%(+1.95)#10,019 |
Common Questions
What are the Top 10 Cities with the Highest Percentage of Population with a Degree in Science and Engineering in Maryland?
Top 10 Cities with the Highest Percentage of Population with a Degree in Science and Engineering in Maryland are:
#1
100.0%
#2
100.0%
#3
100.0%
#4
100.0%
#5
61.5%
#6
56.8%
#7
43.4%
#8
43.2%
#9
42.6%
#10
41.9%
What city has the Highest Percentage of Population with a Degree in Science and Engineering in Maryland?
Danville has the Highest Percentage of Population with a Degree in Science and Engineering in Maryland with 100.0%.
What is the Percentage of Population with a Degree in Science and Engineering in the State of Maryland?
Percentage of Population with a Degree in Science and Engineering in Maryland is 8.8%.
What is the Percentage of Population with a Degree in Science and Engineering in the United States?
Percentage of Population with a Degree in Science and Engineering in the United States is 9.8%.