Cities with the Highest Percentage of Population with a Degree in Science and Engineering in West Virginia
RELATED REPORTS & OPTIONS
Science and Engineering
West Virginia
Compare Cities
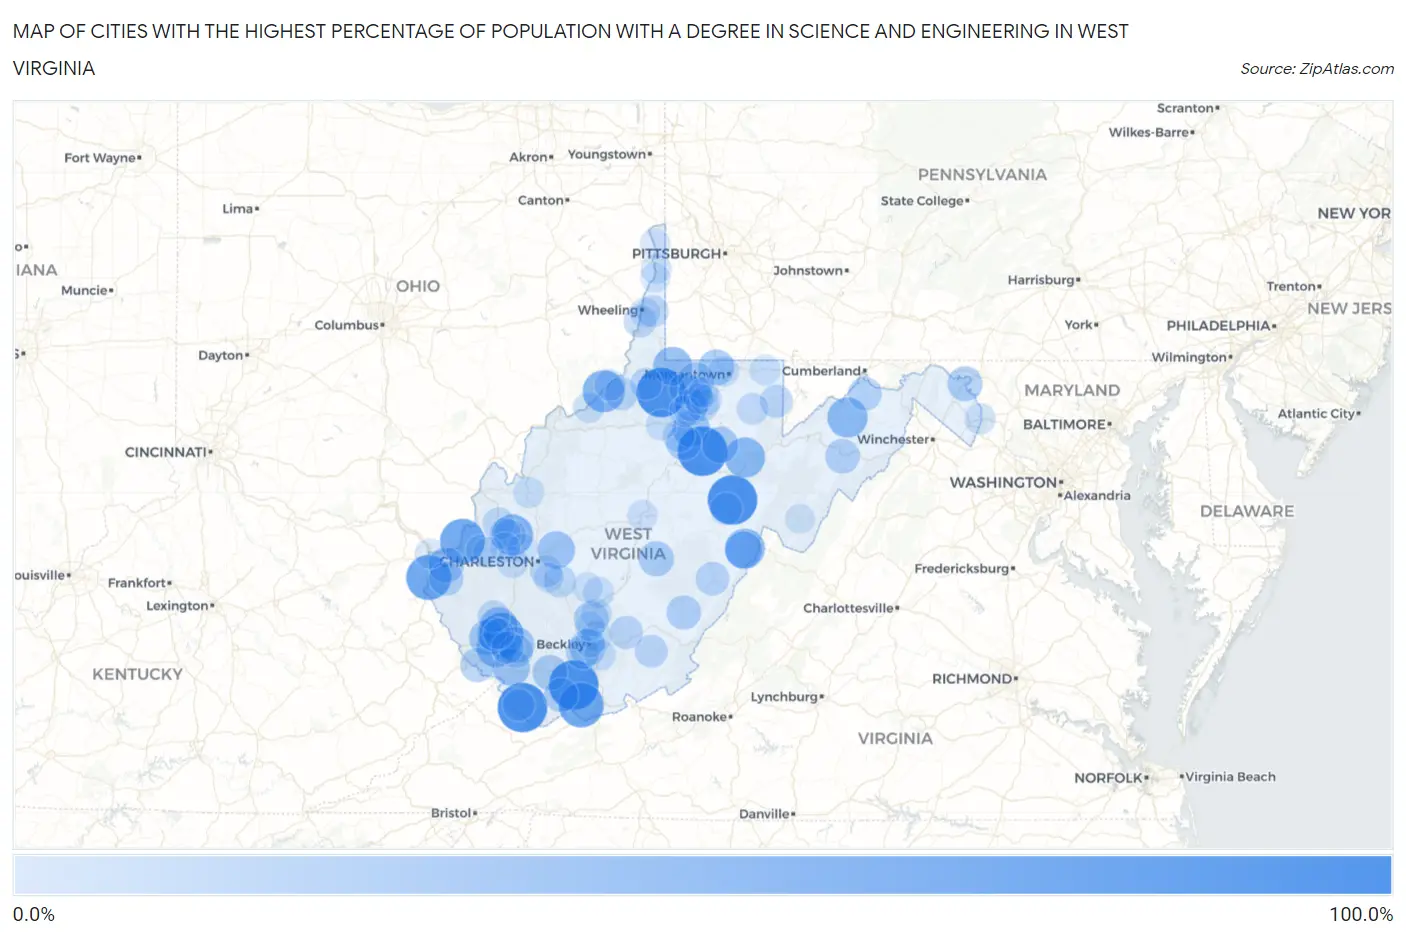
Map of Cities with the Highest Percentage of Population with a Degree in Science and Engineering in West Virginia
0.0%
100.0%
Cities with the Highest Percentage of Population with a Degree in Science and Engineering in West Virginia
| City | % Graduates | vs State | vs National | |
| 1. | Raysal | 100.0% | 13.5%(+86.5)#1 | 9.8%(+90.2)#20 |
| 2. | Valley Bend | 100.0% | 13.5%(+86.5)#2 | 9.8%(+90.2)#24 |
| 3. | Smithfield | 100.0% | 13.5%(+86.5)#3 | 9.8%(+90.2)#108 |
| 4. | Century | 100.0% | 13.5%(+86.5)#4 | 9.8%(+90.2)#120 |
| 5. | Covel | 100.0% | 13.5%(+86.5)#5 | 9.8%(+90.2)#128 |
| 6. | Prichard | 79.7% | 13.5%(+66.1)#6 | 9.8%(+69.9)#247 |
| 7. | Montcalm | 78.9% | 13.5%(+65.4)#7 | 9.8%(+69.2)#249 |
| 8. | Lesage | 78.7% | 13.5%(+65.2)#8 | 9.8%(+69.0)#251 |
| 9. | Stollings | 77.5% | 13.5%(+64.0)#9 | 9.8%(+67.7)#258 |
| 10. | Friendly | 66.7% | 13.5%(+53.1)#10 | 9.8%(+56.9)#338 |
| 11. | Hometown | 63.2% | 13.5%(+49.6)#11 | 9.8%(+53.4)#364 |
| 12. | Montrose | 59.1% | 13.5%(+45.6)#12 | 9.8%(+49.3)#424 |
| 13. | Burlington | 58.5% | 13.5%(+45.0)#13 | 9.8%(+48.8)#433 |
| 14. | Arbovale | 57.9% | 13.5%(+44.4)#14 | 9.8%(+48.1)#438 |
| 15. | Omar | 55.0% | 13.5%(+41.5)#15 | 9.8%(+45.2)#481 |
| 16. | Hundred | 53.8% | 13.5%(+40.3)#16 | 9.8%(+44.1)#492 |
| 17. | Henlawson | 50.0% | 13.5%(+36.5)#17 | 9.8%(+40.2)#556 |
| 18. | Elkview | 47.1% | 13.5%(+33.6)#18 | 9.8%(+37.3)#697 |
| 19. | Gilbert | 46.4% | 13.5%(+32.9)#19 | 9.8%(+36.6)#716 |
| 20. | Anmoore | 46.2% | 13.5%(+32.6)#20 | 9.8%(+36.4)#720 |
| 21. | Green Bank | 45.5% | 13.5%(+31.9)#21 | 9.8%(+35.7)#734 |
| 22. | Accoville | 42.3% | 13.5%(+28.8)#22 | 9.8%(+32.5)#860 |
| 23. | Philippi | 42.0% | 13.5%(+28.4)#23 | 9.8%(+32.2)#874 |
| 24. | Holden | 41.9% | 13.5%(+28.3)#24 | 9.8%(+32.1)#877 |
| 25. | Macarthur | 41.5% | 13.5%(+27.9)#25 | 9.8%(+31.7)#898 |
| 26. | Cassville | 40.7% | 13.5%(+27.2)#26 | 9.8%(+31.0)#917 |
| 27. | Fairview | 40.0% | 13.5%(+26.5)#27 | 9.8%(+30.2)#956 |
| 28. | Hansford | 38.9% | 13.5%(+25.4)#28 | 9.8%(+29.2)#1,014 |
| 29. | Lavalette | 38.1% | 13.5%(+24.5)#29 | 9.8%(+28.3)#1,068 |
| 30. | Pineville | 37.5% | 13.5%(+24.0)#30 | 9.8%(+27.7)#1,087 |
| 31. | Lost Creek | 37.5% | 13.5%(+24.0)#31 | 9.8%(+27.7)#1,094 |
| 32. | Camden On Gauley | 37.5% | 13.5%(+24.0)#32 | 9.8%(+27.7)#1,103 |
| 33. | Falling Waters | 36.3% | 13.5%(+22.8)#33 | 9.8%(+26.5)#1,157 |
| 34. | Scarbro | 36.0% | 13.5%(+22.5)#34 | 9.8%(+26.2)#1,170 |
| 35. | Moorefield | 34.6% | 13.5%(+21.1)#35 | 9.8%(+24.9)#1,261 |
| 36. | Shinnston | 33.6% | 13.5%(+20.1)#36 | 9.8%(+23.9)#1,304 |
| 37. | Matewan | 33.3% | 13.5%(+19.8)#37 | 9.8%(+23.6)#1,318 |
| 38. | Northfork | 33.3% | 13.5%(+19.8)#38 | 9.8%(+23.6)#1,325 |
| 39. | Falling Spring | 33.3% | 13.5%(+19.8)#39 | 9.8%(+23.6)#1,377 |
| 40. | Wayne | 33.0% | 13.5%(+19.4)#40 | 9.8%(+23.2)#1,423 |
| 41. | Mount Gay Shamrock | 32.9% | 13.5%(+19.4)#41 | 9.8%(+23.1)#1,425 |
| 42. | Idamay | 31.3% | 13.5%(+17.8)#42 | 9.8%(+21.6)#1,540 |
| 43. | Fort Ashby | 31.1% | 13.5%(+17.5)#43 | 9.8%(+21.3)#1,563 |
| 44. | Marlinton | 31.0% | 13.5%(+17.4)#44 | 9.8%(+21.2)#1,577 |
| 45. | Mallory | 29.6% | 13.5%(+16.1)#45 | 9.8%(+19.9)#1,726 |
| 46. | Sophia | 29.2% | 13.5%(+15.6)#46 | 9.8%(+19.4)#1,777 |
| 47. | Meadow Bridge | 28.9% | 13.5%(+15.4)#47 | 9.8%(+19.2)#1,818 |
| 48. | Middlebourne | 28.6% | 13.5%(+15.0)#48 | 9.8%(+18.8)#1,855 |
| 49. | Farmington | 28.2% | 13.5%(+14.7)#49 | 9.8%(+18.4)#1,938 |
| 50. | Terra Alta | 28.0% | 13.5%(+14.5)#50 | 9.8%(+18.3)#1,950 |
| 51. | Enterprise | 28.0% | 13.5%(+14.5)#51 | 9.8%(+18.3)#1,951 |
| 52. | Alderson | 27.7% | 13.5%(+14.2)#52 | 9.8%(+17.9)#1,991 |
| 53. | Man | 25.9% | 13.5%(+12.3)#53 | 9.8%(+16.1)#2,256 |
| 54. | East Bank | 25.8% | 13.5%(+12.3)#54 | 9.8%(+16.0)#2,268 |
| 55. | White Hall | 25.7% | 13.5%(+12.2)#55 | 9.8%(+15.9)#2,285 |
| 56. | Mcmechen | 25.7% | 13.5%(+12.1)#56 | 9.8%(+15.9)#2,296 |
| 57. | Rand | 25.0% | 13.5%(+11.5)#57 | 9.8%(+15.2)#2,385 |
| 58. | Pine Grove | 25.0% | 13.5%(+11.5)#58 | 9.8%(+15.2)#2,438 |
| 59. | Huttonsville | 25.0% | 13.5%(+11.5)#59 | 9.8%(+15.2)#2,447 |
| 60. | Buffalo | 24.8% | 13.5%(+11.3)#60 | 9.8%(+15.0)#2,516 |
| 61. | Triadelphia | 24.3% | 13.5%(+10.8)#61 | 9.8%(+14.6)#2,582 |
| 62. | West Milford | 24.3% | 13.5%(+10.8)#62 | 9.8%(+14.5)#2,591 |
| 63. | Bradshaw | 23.8% | 13.5%(+10.3)#63 | 9.8%(+14.0)#2,693 |
| 64. | Chapmanville | 23.6% | 13.5%(+10.1)#64 | 9.8%(+13.8)#2,733 |
| 65. | Winfield | 23.5% | 13.5%(+10.0)#65 | 9.8%(+13.8)#2,744 |
| 66. | Mannington | 23.1% | 13.5%(+9.54)#66 | 9.8%(+13.3)#2,871 |
| 67. | Tunnelton | 23.1% | 13.5%(+9.54)#67 | 9.8%(+13.3)#2,881 |
| 68. | Lumberport | 22.5% | 13.5%(+8.97)#68 | 9.8%(+12.7)#3,031 |
| 69. | Eleanor | 21.9% | 13.5%(+8.36)#69 | 9.8%(+12.1)#3,205 |
| 70. | Sistersville | 21.8% | 13.5%(+8.23)#70 | 9.8%(+12.0)#3,241 |
| 71. | Tornado | 21.2% | 13.5%(+7.66)#71 | 9.8%(+11.4)#3,437 |
| 72. | Piney View | 21.2% | 13.5%(+7.64)#72 | 9.8%(+11.4)#3,444 |
| 73. | Shady Spring | 21.2% | 13.5%(+7.63)#73 | 9.8%(+11.4)#3,446 |
| 74. | Culloden | 20.7% | 13.5%(+7.14)#74 | 9.8%(+10.9)#3,591 |
| 75. | Ansted | 20.6% | 13.5%(+7.08)#75 | 9.8%(+10.8)#3,611 |
| 76. | Ripley | 20.1% | 13.5%(+6.59)#76 | 9.8%(+10.3)#3,757 |
| 77. | Granville | 20.0% | 13.5%(+6.47)#77 | 9.8%(+10.2)#3,786 |
| 78. | Bruceton Mills | 20.0% | 13.5%(+6.47)#78 | 9.8%(+10.2)#3,893 |
| 79. | Milton | 19.8% | 13.5%(+6.30)#79 | 9.8%(+10.1)#3,930 |
| 80. | Bolivar | 19.8% | 13.5%(+6.26)#80 | 9.8%(+10.0)#3,945 |
| 81. | St Marys | 19.7% | 13.5%(+6.18)#81 | 9.8%(+9.93)#3,967 |
| 82. | Salem | 19.5% | 13.5%(+5.93)#82 | 9.8%(+9.68)#4,047 |
| 83. | Pleasant Valley | 19.5% | 13.5%(+5.93)#83 | 9.8%(+9.68)#4,050 |
| 84. | Logan | 19.3% | 13.5%(+5.74)#84 | 9.8%(+9.50)#4,113 |
| 85. | Monongah | 18.4% | 13.5%(+4.89)#85 | 9.8%(+8.64)#4,497 |
| 86. | Oak Hill | 18.2% | 13.5%(+4.71)#86 | 9.8%(+8.46)#4,582 |
| 87. | Bethlehem | 17.8% | 13.5%(+4.25)#87 | 9.8%(+8.00)#4,793 |
| 88. | New Cumberland | 17.5% | 13.5%(+4.01)#88 | 9.8%(+7.76)#4,925 |
| 89. | Gauley Bridge | 17.3% | 13.5%(+3.78)#89 | 9.8%(+7.53)#5,043 |
| 90. | Belle | 17.1% | 13.5%(+3.61)#90 | 9.8%(+7.36)#5,132 |
| 91. | Sutton | 17.1% | 13.5%(+3.54)#91 | 9.8%(+7.29)#5,169 |
| 92. | Cross Lanes | 17.1% | 13.5%(+3.53)#92 | 9.8%(+7.28)#5,183 |
| 93. | Teays Valley | 17.0% | 13.5%(+3.50)#93 | 9.8%(+7.25)#5,204 |
| 94. | Follansbee | 16.9% | 13.5%(+3.40)#94 | 9.8%(+7.15)#5,257 |
| 95. | Kenova | 16.9% | 13.5%(+3.34)#95 | 9.8%(+7.09)#5,284 |
| 96. | Beckley | 16.9% | 13.5%(+3.33)#96 | 9.8%(+7.08)#5,290 |
| 97. | Mount Hope | 16.2% | 13.5%(+2.66)#97 | 9.8%(+6.42)#5,731 |
| 98. | Wellsburg | 16.1% | 13.5%(+2.54)#98 | 9.8%(+6.29)#5,810 |
| 99. | Franklin | 15.7% | 13.5%(+2.22)#99 | 9.8%(+5.97)#6,036 |
| 100. | Barrackville | 15.7% | 13.5%(+2.21)#100 | 9.8%(+5.96)#6,042 |
Common Questions
What are the Top 10 Cities with the Highest Percentage of Population with a Degree in Science and Engineering in West Virginia?
Top 10 Cities with the Highest Percentage of Population with a Degree in Science and Engineering in West Virginia are:
#1
100.0%
#2
100.0%
#3
100.0%
#4
100.0%
#5
100.0%
#6
79.7%
#7
78.9%
#8
78.7%
#9
77.5%
#10
66.7%
What city has the Highest Percentage of Population with a Degree in Science and Engineering in West Virginia?
Raysal has the Highest Percentage of Population with a Degree in Science and Engineering in West Virginia with 100.0%.
What is the Percentage of Population with a Degree in Science and Engineering in the State of West Virginia?
Percentage of Population with a Degree in Science and Engineering in West Virginia is 13.5%.
What is the Percentage of Population with a Degree in Science and Engineering in the United States?
Percentage of Population with a Degree in Science and Engineering in the United States is 9.8%.