Cities with the Highest Percentage of Population with a Degree in Science and Engineering in New Mexico
RELATED REPORTS & OPTIONS
Science and Engineering
New Mexico
Compare Cities
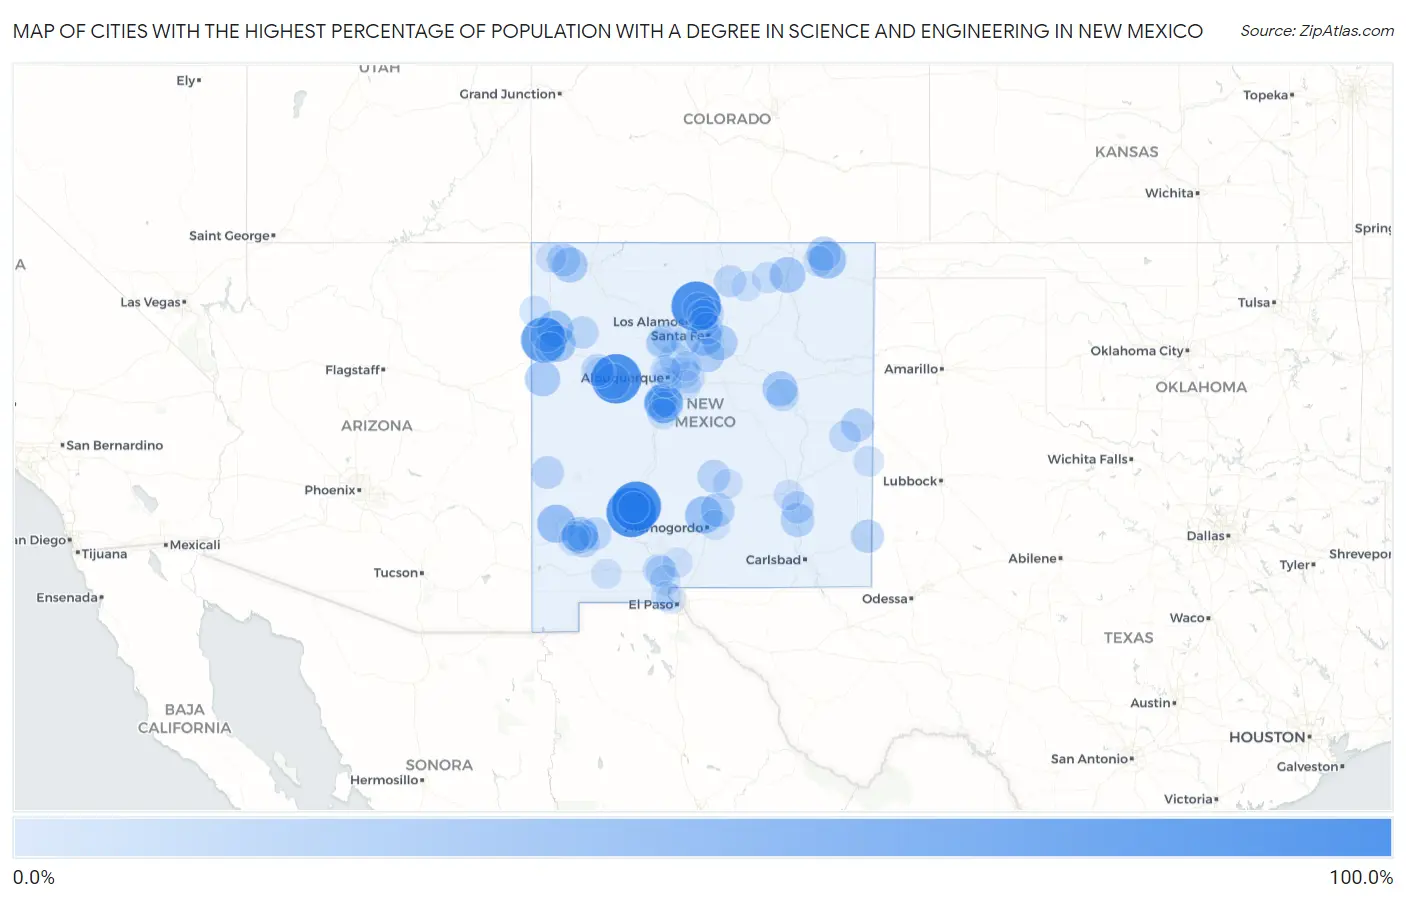
Map of Cities with the Highest Percentage of Population with a Degree in Science and Engineering in New Mexico
0.0%
100.0%
Cities with the Highest Percentage of Population with a Degree in Science and Engineering in New Mexico
| City | % Graduates | vs State | vs National | |
| 1. | Williamsburg | 100.0% | 9.2%(+90.8)#1 | 9.8%(+90.2)#15 |
| 2. | North Acomita Village | 100.0% | 9.2%(+90.8)#2 | 9.8%(+90.2)#76 |
| 3. | Chili | 100.0% | 9.2%(+90.8)#3 | 9.8%(+90.2)#77 |
| 4. | Hot Springs Landing | 100.0% | 9.2%(+90.8)#4 | 9.8%(+90.2)#165 |
| 5. | Rock Springs | 80.0% | 9.2%(+70.8)#5 | 9.8%(+70.2)#243 |
| 6. | Sagar | 53.8% | 9.2%(+44.6)#6 | 9.8%(+44.0)#496 |
| 7. | Jamestown | 51.5% | 9.2%(+42.4)#7 | 9.8%(+41.7)#527 |
| 8. | Adelino | 50.0% | 9.2%(+40.8)#8 | 9.8%(+40.2)#545 |
| 9. | Lindrith | 47.1% | 9.2%(+37.9)#9 | 9.8%(+37.3)#703 |
| 10. | Cliff | 46.7% | 9.2%(+37.5)#10 | 9.8%(+36.9)#710 |
| 11. | Tularosa | 43.2% | 9.2%(+34.1)#11 | 9.8%(+33.4)#819 |
| 12. | Des Moines | 42.9% | 9.2%(+33.7)#12 | 9.8%(+33.1)#840 |
| 13. | Crestview | 41.4% | 9.2%(+32.2)#13 | 9.8%(+31.6)#902 |
| 14. | Arenas Valley | 39.0% | 9.2%(+29.8)#14 | 9.8%(+29.2)#1,013 |
| 15. | Brimhall Nizhoni | 38.9% | 9.2%(+29.7)#15 | 9.8%(+29.1)#1,018 |
| 16. | Church Rock | 38.6% | 9.2%(+29.5)#16 | 9.8%(+28.9)#1,034 |
| 17. | Agua Fria | 38.2% | 9.2%(+29.0)#17 | 9.8%(+28.4)#1,064 |
| 18. | Skyline Ganipa | 35.6% | 9.2%(+26.4)#18 | 9.8%(+25.8)#1,201 |
| 19. | Maxwell | 35.5% | 9.2%(+26.3)#19 | 9.8%(+25.7)#1,207 |
| 20. | Zuni Pueblo | 33.8% | 9.2%(+24.7)#20 | 9.8%(+24.0)#1,297 |
| 21. | Ojo Amarillo | 33.3% | 9.2%(+24.2)#21 | 9.8%(+23.6)#1,323 |
| 22. | Santa Rosa | 33.2% | 9.2%(+24.1)#22 | 9.8%(+23.4)#1,416 |
| 23. | La Cueva | 31.6% | 9.2%(+22.4)#23 | 9.8%(+21.8)#1,520 |
| 24. | Encantado | 31.0% | 9.2%(+21.9)#24 | 9.8%(+21.3)#1,574 |
| 25. | Canon | 30.8% | 9.2%(+21.6)#25 | 9.8%(+21.0)#1,593 |
| 26. | Folsom | 30.0% | 9.2%(+20.8)#26 | 9.8%(+20.2)#1,690 |
| 27. | Twin Lakes | 29.6% | 9.2%(+20.5)#27 | 9.8%(+19.8)#1,728 |
| 28. | Galisteo | 29.2% | 9.2%(+20.1)#28 | 9.8%(+19.4)#1,774 |
| 29. | Mescalero | 28.6% | 9.2%(+19.4)#29 | 9.8%(+18.8)#1,854 |
| 30. | El Cerro | 28.2% | 9.2%(+19.0)#30 | 9.8%(+18.4)#1,941 |
| 31. | Lake Arthur | 27.3% | 9.2%(+18.1)#31 | 9.8%(+17.5)#2,044 |
| 32. | Los Chaves | 27.1% | 9.2%(+17.9)#32 | 9.8%(+17.3)#2,082 |
| 33. | Cannon Afb | 25.0% | 9.2%(+15.8)#33 | 9.8%(+15.2)#2,381 |
| 34. | North Hobbs | 24.8% | 9.2%(+15.6)#34 | 9.8%(+15.0)#2,518 |
| 35. | Waterflow | 24.8% | 9.2%(+15.6)#35 | 9.8%(+15.0)#2,523 |
| 36. | Barton | 23.5% | 9.2%(+14.4)#36 | 9.8%(+13.7)#2,765 |
| 37. | Carrizozo | 23.4% | 9.2%(+14.3)#37 | 9.8%(+13.7)#2,773 |
| 38. | Chimayo | 22.7% | 9.2%(+13.6)#38 | 9.8%(+13.0)#2,957 |
| 39. | Reserve | 22.7% | 9.2%(+13.6)#39 | 9.8%(+12.9)#2,964 |
| 40. | San Lorenzo | 22.0% | 9.2%(+12.9)#40 | 9.8%(+12.3)#3,168 |
| 41. | Rio Rancho Estates | 21.6% | 9.2%(+12.5)#41 | 9.8%(+11.9)#3,279 |
| 42. | Chamita | 21.6% | 9.2%(+12.5)#42 | 9.8%(+11.8)#3,284 |
| 43. | Hurley | 21.6% | 9.2%(+12.4)#43 | 9.8%(+11.8)#3,296 |
| 44. | Puerto De Luna | 21.4% | 9.2%(+12.3)#44 | 9.8%(+11.6)#3,351 |
| 45. | Turley | 21.2% | 9.2%(+12.1)#45 | 9.8%(+11.4)#3,432 |
| 46. | Dexter | 20.8% | 9.2%(+11.7)#46 | 9.8%(+11.1)#3,523 |
| 47. | Crownpoint | 20.6% | 9.2%(+11.5)#47 | 9.8%(+10.9)#3,600 |
| 48. | Crouch Mesa | 20.4% | 9.2%(+11.3)#48 | 9.8%(+10.7)#3,670 |
| 49. | Milan | 20.2% | 9.2%(+11.0)#49 | 9.8%(+10.4)#3,740 |
| 50. | Taos Pueblo | 19.7% | 9.2%(+10.6)#50 | 9.8%(+9.96)#3,957 |
| 51. | Sedillo | 19.1% | 9.2%(+9.99)#51 | 9.8%(+9.37)#4,164 |
| 52. | Sandia Park | 19.0% | 9.2%(+9.87)#52 | 9.8%(+9.24)#4,220 |
| 53. | Mesilla | 18.9% | 9.2%(+9.77)#53 | 9.8%(+9.15)#4,251 |
| 54. | Belen | 18.9% | 9.2%(+9.75)#54 | 9.8%(+9.12)#4,270 |
| 55. | Peak Place | 18.8% | 9.2%(+9.59)#55 | 9.8%(+8.97)#4,344 |
| 56. | Floyd | 18.2% | 9.2%(+9.03)#56 | 9.8%(+8.40)#4,639 |
| 57. | Cañoncito | 17.8% | 9.2%(+8.67)#57 | 9.8%(+8.05)#4,784 |
| 58. | Santa Ana Pueblo | 17.7% | 9.2%(+8.59)#58 | 9.8%(+7.96)#4,815 |
| 59. | Jemez Pueblo | 17.4% | 9.2%(+8.23)#59 | 9.8%(+7.61)#4,996 |
| 60. | Pena Blanca | 17.4% | 9.2%(+8.23)#60 | 9.8%(+7.61)#5,006 |
| 61. | Truth Or Consequences | 17.1% | 9.2%(+7.92)#61 | 9.8%(+7.30)#5,163 |
| 62. | Rio Communities | 16.7% | 9.2%(+7.51)#62 | 9.8%(+6.89)#5,359 |
| 63. | Torreon Cdp Sandoval County | 16.7% | 9.2%(+7.51)#63 | 9.8%(+6.89)#5,397 |
| 64. | Santa Clara | 16.6% | 9.2%(+7.43)#64 | 9.8%(+6.81)#5,510 |
| 65. | Cimarron | 16.2% | 9.2%(+7.01)#65 | 9.8%(+6.39)#5,746 |
| 66. | Las Maravillas | 16.1% | 9.2%(+6.98)#66 | 9.8%(+6.36)#5,760 |
| 67. | San Pablo | 15.6% | 9.2%(+6.40)#67 | 9.8%(+5.77)#6,169 |
| 68. | Crystal | 15.4% | 9.2%(+6.23)#68 | 9.8%(+5.60)#6,297 |
| 69. | Grants | 14.5% | 9.2%(+5.34)#69 | 9.8%(+4.71)#6,974 |
| 70. | Casa Colorada | 14.5% | 9.2%(+5.30)#70 | 9.8%(+4.68)#7,012 |
| 71. | Tyrone | 14.4% | 9.2%(+5.28)#71 | 9.8%(+4.65)#7,045 |
| 72. | Silver City | 14.3% | 9.2%(+5.15)#72 | 9.8%(+4.53)#7,123 |
| 73. | San Antonito Cdp Bernalillo County | 14.3% | 9.2%(+5.13)#73 | 9.8%(+4.50)#7,156 |
| 74. | Causey | 14.3% | 9.2%(+5.13)#74 | 9.8%(+4.50)#7,216 |
| 75. | Ponderosa | 14.3% | 9.2%(+5.13)#75 | 9.8%(+4.50)#7,228 |
| 76. | Capulin | 14.3% | 9.2%(+5.13)#76 | 9.8%(+4.50)#7,246 |
| 77. | Little Walnut | 14.2% | 9.2%(+5.05)#77 | 9.8%(+4.42)#7,293 |
| 78. | Gallup | 13.9% | 9.2%(+4.75)#78 | 9.8%(+4.12)#7,531 |
| 79. | La Mesa | 13.6% | 9.2%(+4.48)#79 | 9.8%(+3.85)#7,767 |
| 80. | Sunlit Hills | 13.4% | 9.2%(+4.23)#80 | 9.8%(+3.60)#8,017 |
| 81. | Roswell | 13.1% | 9.2%(+3.97)#81 | 9.8%(+3.35)#8,314 |
| 82. | South Valley | 13.0% | 9.2%(+3.79)#82 | 9.8%(+3.17)#8,529 |
| 83. | Conejo | 12.5% | 9.2%(+3.34)#83 | 9.8%(+2.72)#9,001 |
| 84. | San Ysidro | 12.5% | 9.2%(+3.34)#84 | 9.8%(+2.72)#9,040 |
| 85. | Shiprock | 12.4% | 9.2%(+3.27)#85 | 9.8%(+2.64)#9,138 |
| 86. | Sombrillo | 12.1% | 9.2%(+2.96)#86 | 9.8%(+2.34)#9,509 |
| 87. | Sunland Park | 11.8% | 9.2%(+2.68)#87 | 9.8%(+2.06)#9,878 |
| 88. | Ponderosa Pine | 11.8% | 9.2%(+2.61)#88 | 9.8%(+1.98)#9,947 |
| 89. | La Hacienda | 11.8% | 9.2%(+2.61)#89 | 9.8%(+1.98)#9,956 |
| 90. | Los Ranchos De Albuquerque | 11.7% | 9.2%(+2.57)#90 | 9.8%(+1.94)#10,027 |
| 91. | Santa Teresa | 11.7% | 9.2%(+2.54)#91 | 9.8%(+1.91)#10,066 |
| 92. | Cochiti | 11.6% | 9.2%(+2.47)#92 | 9.8%(+1.85)#10,156 |
| 93. | White Sands | 11.6% | 9.2%(+2.45)#93 | 9.8%(+1.83)#10,182 |
| 94. | Angel Fire | 11.5% | 9.2%(+2.36)#94 | 9.8%(+1.73)#10,309 |
| 95. | Angustura | 11.4% | 9.2%(+2.21)#95 | 9.8%(+1.58)#10,528 |
| 96. | Capitan | 11.4% | 9.2%(+2.21)#96 | 9.8%(+1.58)#10,529 |
| 97. | La Madera | 11.3% | 9.2%(+2.19)#97 | 9.8%(+1.56)#10,567 |
| 98. | High Rolls | 11.3% | 9.2%(+2.14)#98 | 9.8%(+1.52)#10,628 |
| 99. | Paradise Hills | 11.3% | 9.2%(+2.13)#99 | 9.8%(+1.51)#10,642 |
| 100. | Cuyamungue | 11.3% | 9.2%(+2.11)#100 | 9.8%(+1.49)#10,672 |
Common Questions
What are the Top 10 Cities with the Highest Percentage of Population with a Degree in Science and Engineering in New Mexico?
Top 10 Cities with the Highest Percentage of Population with a Degree in Science and Engineering in New Mexico are:
#1
100.0%
#2
100.0%
#3
100.0%
#4
100.0%
#5
80.0%
#6
50.0%
#7
46.7%
#8
43.2%
#9
42.9%
#10
39.0%
What city has the Highest Percentage of Population with a Degree in Science and Engineering in New Mexico?
Williamsburg has the Highest Percentage of Population with a Degree in Science and Engineering in New Mexico with 100.0%.
What is the Percentage of Population with a Degree in Science and Engineering in the State of New Mexico?
Percentage of Population with a Degree in Science and Engineering in New Mexico is 9.2%.
What is the Percentage of Population with a Degree in Science and Engineering in the United States?
Percentage of Population with a Degree in Science and Engineering in the United States is 9.8%.