Cities with the Highest Percentage of Population with a Degree in Science and Engineering in Texas
RELATED REPORTS & OPTIONS
Science and Engineering
Texas
Compare Cities
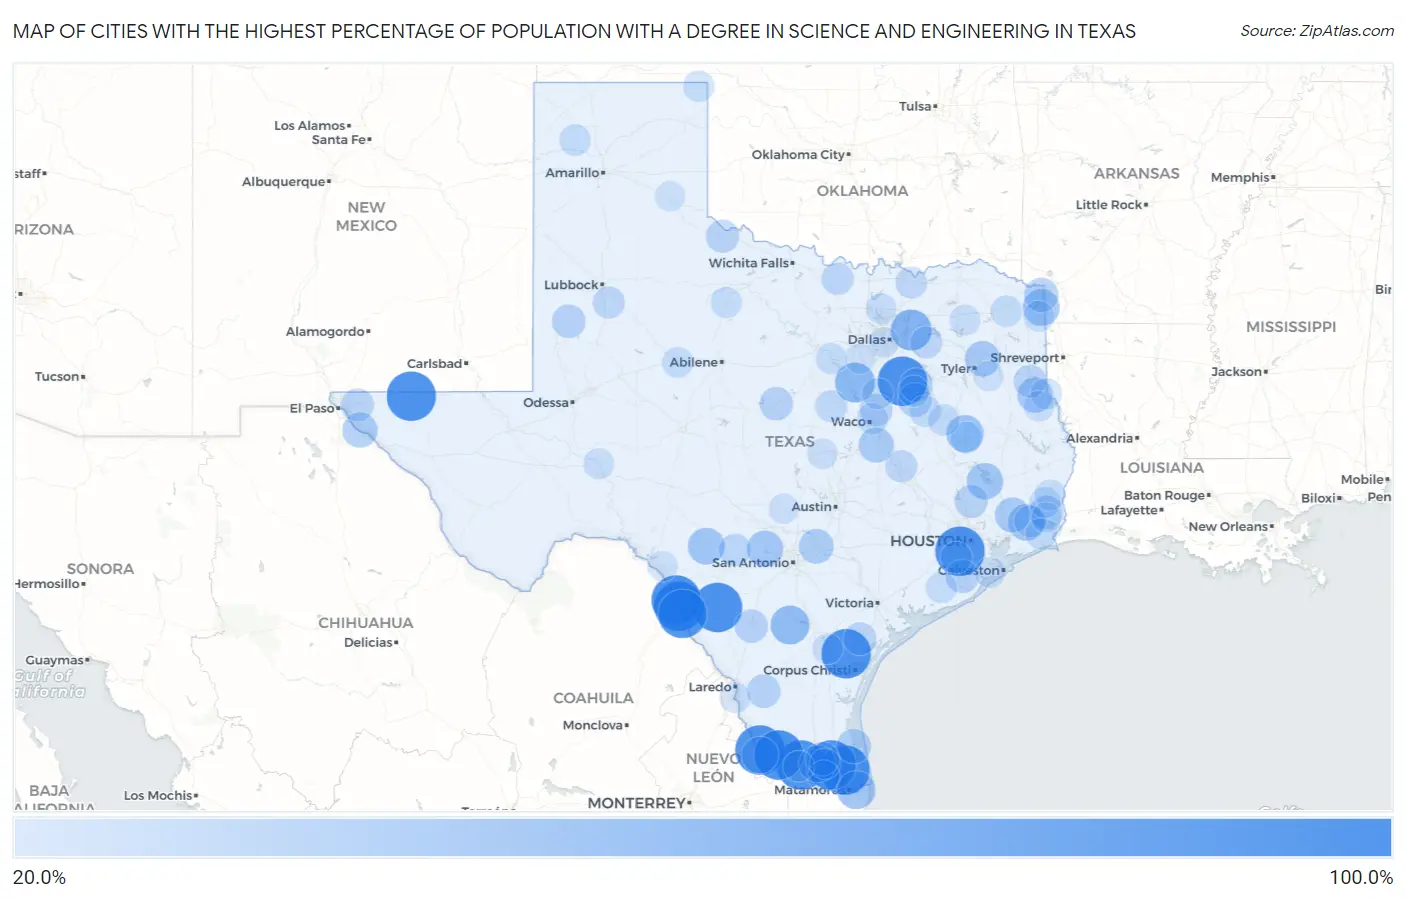
Map of Cities with the Highest Percentage of Population with a Degree in Science and Engineering in Texas
0.0%
100.0%
Cities with the Highest Percentage of Population with a Degree in Science and Engineering in Texas
| City | % Graduates | vs State | vs National | |
| 1. | West Sharyland | 100.0% | 9.5%(+90.5)#1 | 9.8%(+90.2)#1 |
| 2. | Fifth Street | 100.0% | 9.5%(+90.5)#2 | 9.8%(+90.2)#2 |
| 3. | Fabrica | 100.0% | 9.5%(+90.5)#3 | 9.8%(+90.2)#10 |
| 4. | Morgan Farm | 100.0% | 9.5%(+90.5)#4 | 9.8%(+90.2)#41 |
| 5. | Loma Grande | 100.0% | 9.5%(+90.5)#5 | 9.8%(+90.2)#83 |
| 6. | Villa Del Sol | 100.0% | 9.5%(+90.5)#6 | 9.8%(+90.2)#84 |
| 7. | La Minita | 100.0% | 9.5%(+90.5)#7 | 9.8%(+90.2)#89 |
| 8. | Emhouse | 100.0% | 9.5%(+90.5)#8 | 9.8%(+90.2)#99 |
| 9. | Sammy Martinez | 100.0% | 9.5%(+90.5)#9 | 9.8%(+90.2)#107 |
| 10. | Dell City | 100.0% | 9.5%(+90.5)#10 | 9.8%(+90.2)#146 |
| 11. | Radar Base | 100.0% | 9.5%(+90.5)#11 | 9.8%(+90.2)#152 |
| 12. | Tierra Bonita | 100.0% | 9.5%(+90.5)#12 | 9.8%(+90.2)#159 |
| 13. | Rosita | 96.7% | 9.5%(+87.1)#13 | 9.8%(+86.9)#212 |
| 14. | Mobile City | 66.7% | 9.5%(+57.1)#14 | 9.8%(+56.9)#326 |
| 15. | Blum | 62.5% | 9.5%(+53.0)#15 | 9.8%(+52.7)#372 |
| 16. | Tilden | 58.3% | 9.5%(+48.8)#16 | 9.8%(+48.6)#434 |
| 17. | South Point | 55.3% | 9.5%(+45.7)#17 | 9.8%(+45.5)#479 |
| 18. | Latexo | 52.0% | 9.5%(+42.5)#18 | 9.8%(+42.2)#520 |
| 19. | Forest Heights | 51.6% | 9.5%(+42.1)#19 | 9.8%(+41.9)#523 |
| 20. | San Carlos | 51.3% | 9.5%(+41.7)#20 | 9.8%(+41.5)#529 |
| 21. | Deerwood | 50.9% | 9.5%(+41.4)#21 | 9.8%(+41.1)#536 |
| 22. | Camp Wood | 50.0% | 9.5%(+40.5)#22 | 9.8%(+40.2)#543 |
| 23. | Fronton | 50.0% | 9.5%(+40.5)#23 | 9.8%(+40.2)#565 |
| 24. | Domino | 50.0% | 9.5%(+40.5)#24 | 9.8%(+40.2)#632 |
| 25. | Cape Royale | 48.7% | 9.5%(+39.2)#25 | 9.8%(+38.9)#647 |
| 26. | Nome | 48.6% | 9.5%(+39.0)#26 | 9.8%(+38.8)#651 |
| 27. | Lake Medina Shores | 48.1% | 9.5%(+38.6)#27 | 9.8%(+38.3)#671 |
| 28. | Winona | 44.6% | 9.5%(+35.1)#28 | 9.8%(+34.9)#750 |
| 29. | Tenaha | 44.4% | 9.5%(+34.9)#29 | 9.8%(+34.7)#755 |
| 30. | Lott | 43.9% | 9.5%(+34.4)#30 | 9.8%(+34.2)#782 |
| 31. | Hull | 43.7% | 9.5%(+34.1)#31 | 9.8%(+33.9)#797 |
| 32. | Tornillo | 43.6% | 9.5%(+34.1)#32 | 9.8%(+33.8)#800 |
| 33. | Lake Dunlap | 42.6% | 9.5%(+33.1)#33 | 9.8%(+32.8)#851 |
| 34. | Port Mansfield | 40.9% | 9.5%(+31.4)#34 | 9.8%(+31.1)#914 |
| 35. | Nash | 40.5% | 9.5%(+30.9)#35 | 9.8%(+30.7)#933 |
| 36. | Zephyr | 40.0% | 9.5%(+30.5)#36 | 9.8%(+30.2)#958 |
| 37. | Pine Forest | 39.1% | 9.5%(+29.6)#37 | 9.8%(+29.3)#1,000 |
| 38. | Streetman | 38.9% | 9.5%(+29.4)#38 | 9.8%(+29.1)#1,020 |
| 39. | Bear Creek Ranch | 38.3% | 9.5%(+28.8)#39 | 9.8%(+28.5)#1,058 |
| 40. | Holiday Lakes | 37.5% | 9.5%(+28.0)#40 | 9.8%(+27.7)#1,084 |
| 41. | Blanket | 37.5% | 9.5%(+28.0)#41 | 9.8%(+27.7)#1,093 |
| 42. | Wellman | 37.5% | 9.5%(+28.0)#42 | 9.8%(+27.7)#1,097 |
| 43. | Mirando City | 37.5% | 9.5%(+28.0)#43 | 9.8%(+27.7)#1,098 |
| 44. | Cotulla | 37.2% | 9.5%(+27.6)#44 | 9.8%(+27.4)#1,119 |
| 45. | Monte Alto | 37.1% | 9.5%(+27.6)#45 | 9.8%(+27.3)#1,122 |
| 46. | Cut And Shoot | 36.8% | 9.5%(+27.3)#46 | 9.8%(+27.1)#1,127 |
| 47. | Bluff Dale | 36.6% | 9.5%(+27.1)#47 | 9.8%(+26.8)#1,139 |
| 48. | Powell | 36.4% | 9.5%(+26.8)#48 | 9.8%(+26.6)#1,153 |
| 49. | Quanah | 35.9% | 9.5%(+26.4)#49 | 9.8%(+26.1)#1,176 |
| 50. | Homestead Meadows South | 35.4% | 9.5%(+25.9)#50 | 9.8%(+25.6)#1,211 |
| 51. | Woodsboro | 35.1% | 9.5%(+25.6)#51 | 9.8%(+25.3)#1,232 |
| 52. | Carthage | 34.8% | 9.5%(+25.3)#52 | 9.8%(+25.1)#1,247 |
| 53. | Leroy | 34.7% | 9.5%(+25.1)#53 | 9.8%(+24.9)#1,259 |
| 54. | Montague | 33.3% | 9.5%(+23.8)#54 | 9.8%(+23.6)#1,347 |
| 55. | Utopia | 33.3% | 9.5%(+23.8)#55 | 9.8%(+23.6)#1,348 |
| 56. | Elmo | 32.5% | 9.5%(+23.0)#56 | 9.8%(+22.7)#1,446 |
| 57. | Wilson | 32.1% | 9.5%(+22.6)#57 | 9.8%(+22.4)#1,471 |
| 58. | Hearne | 31.9% | 9.5%(+22.4)#58 | 9.8%(+22.2)#1,483 |
| 59. | Cranfills Gap | 31.8% | 9.5%(+22.3)#59 | 9.8%(+22.0)#1,491 |
| 60. | China | 31.5% | 9.5%(+22.0)#60 | 9.8%(+21.7)#1,526 |
| 61. | Progreso | 31.4% | 9.5%(+21.9)#61 | 9.8%(+21.6)#1,538 |
| 62. | Bells | 31.1% | 9.5%(+21.6)#62 | 9.8%(+21.4)#1,558 |
| 63. | Omaha | 30.5% | 9.5%(+21.0)#63 | 9.8%(+20.7)#1,620 |
| 64. | Fairfield | 30.4% | 9.5%(+20.9)#64 | 9.8%(+20.7)#1,623 |
| 65. | Channing | 30.4% | 9.5%(+20.8)#65 | 9.8%(+20.6)#1,635 |
| 66. | Crockett | 30.3% | 9.5%(+20.8)#66 | 9.8%(+20.5)#1,637 |
| 67. | Thompsons | 30.0% | 9.5%(+20.5)#67 | 9.8%(+20.2)#1,674 |
| 68. | Bellmead | 30.0% | 9.5%(+20.4)#68 | 9.8%(+20.2)#1,694 |
| 69. | Taylor Landing | 29.9% | 9.5%(+20.3)#69 | 9.8%(+20.1)#1,697 |
| 70. | Oakwood | 29.7% | 9.5%(+20.2)#70 | 9.8%(+19.9)#1,712 |
| 71. | Evadale | 29.2% | 9.5%(+19.6)#71 | 9.8%(+19.4)#1,780 |
| 72. | Follett | 29.1% | 9.5%(+19.6)#72 | 9.8%(+19.3)#1,796 |
| 73. | Van Vleck | 29.0% | 9.5%(+19.5)#73 | 9.8%(+19.3)#1,802 |
| 74. | Oak Trail Shores | 28.6% | 9.5%(+19.1)#74 | 9.8%(+18.9)#1,843 |
| 75. | Bynum | 28.6% | 9.5%(+19.0)#75 | 9.8%(+18.8)#1,868 |
| 76. | Navarro | 28.6% | 9.5%(+19.0)#76 | 9.8%(+18.8)#1,881 |
| 77. | Weinert | 28.6% | 9.5%(+19.0)#77 | 9.8%(+18.8)#1,884 |
| 78. | Roscoe | 28.5% | 9.5%(+19.0)#78 | 9.8%(+18.7)#1,907 |
| 79. | Joaquin | 28.3% | 9.5%(+18.7)#79 | 9.8%(+18.5)#1,929 |
| 80. | Atlanta | 27.9% | 9.5%(+18.4)#80 | 9.8%(+18.2)#1,960 |
| 81. | Buna | 27.8% | 9.5%(+18.3)#81 | 9.8%(+18.0)#1,975 |
| 82. | Como | 27.8% | 9.5%(+18.3)#82 | 9.8%(+18.0)#1,983 |
| 83. | Perezville | 27.7% | 9.5%(+18.2)#83 | 9.8%(+17.9)#1,992 |
| 84. | Paloma Creek | 27.6% | 9.5%(+18.1)#84 | 9.8%(+17.8)#2,005 |
| 85. | Rice Tracts | 27.5% | 9.5%(+18.0)#85 | 9.8%(+17.7)#2,018 |
| 86. | Iraan | 27.3% | 9.5%(+17.8)#86 | 9.8%(+17.5)#2,039 |
| 87. | Garwood | 27.3% | 9.5%(+17.8)#87 | 9.8%(+17.5)#2,047 |
| 88. | El Cenizo | 27.2% | 9.5%(+17.7)#88 | 9.8%(+17.4)#2,074 |
| 89. | Hitchcock | 27.0% | 9.5%(+17.5)#89 | 9.8%(+17.2)#2,096 |
| 90. | La Villa | 26.5% | 9.5%(+16.9)#90 | 9.8%(+16.7)#2,159 |
| 91. | Kempner | 26.4% | 9.5%(+16.9)#91 | 9.8%(+16.7)#2,167 |
| 92. | Lake City | 26.2% | 9.5%(+16.7)#92 | 9.8%(+16.4)#2,206 |
| 93. | Center | 26.1% | 9.5%(+16.6)#93 | 9.8%(+16.4)#2,214 |
| 94. | Cockrell Hill | 26.0% | 9.5%(+16.5)#94 | 9.8%(+16.2)#2,232 |
| 95. | Laughlin Afb | 25.5% | 9.5%(+16.0)#95 | 9.8%(+15.7)#2,317 |
| 96. | Hedley | 25.5% | 9.5%(+15.9)#96 | 9.8%(+15.7)#2,329 |
| 97. | Cross Timber | 25.3% | 9.5%(+15.8)#97 | 9.8%(+15.5)#2,348 |
| 98. | Stonewall | 25.3% | 9.5%(+15.8)#98 | 9.8%(+15.5)#2,351 |
| 99. | Arp | 25.2% | 9.5%(+15.7)#99 | 9.8%(+15.5)#2,359 |
| 100. | Rose City | 25.0% | 9.5%(+15.5)#100 | 9.8%(+15.2)#2,413 |
Common Questions
What are the Top 10 Cities with the Highest Percentage of Population with a Degree in Science and Engineering in Texas?
Top 10 Cities with the Highest Percentage of Population with a Degree in Science and Engineering in Texas are:
#1
100.0%
#2
100.0%
#3
100.0%
#4
100.0%
#5
100.0%
#6
100.0%
#7
100.0%
#8
100.0%
#9
100.0%
#10
100.0%
What city has the Highest Percentage of Population with a Degree in Science and Engineering in Texas?
West Sharyland has the Highest Percentage of Population with a Degree in Science and Engineering in Texas with 100.0%.
What is the Percentage of Population with a Degree in Science and Engineering in the State of Texas?
Percentage of Population with a Degree in Science and Engineering in Texas is 9.5%.
What is the Percentage of Population with a Degree in Science and Engineering in the United States?
Percentage of Population with a Degree in Science and Engineering in the United States is 9.8%.