Cities with the Highest Percentage of Population with a Degree in Science and Engineering in Delaware
RELATED REPORTS & OPTIONS
Science and Engineering
Delaware
Compare Cities
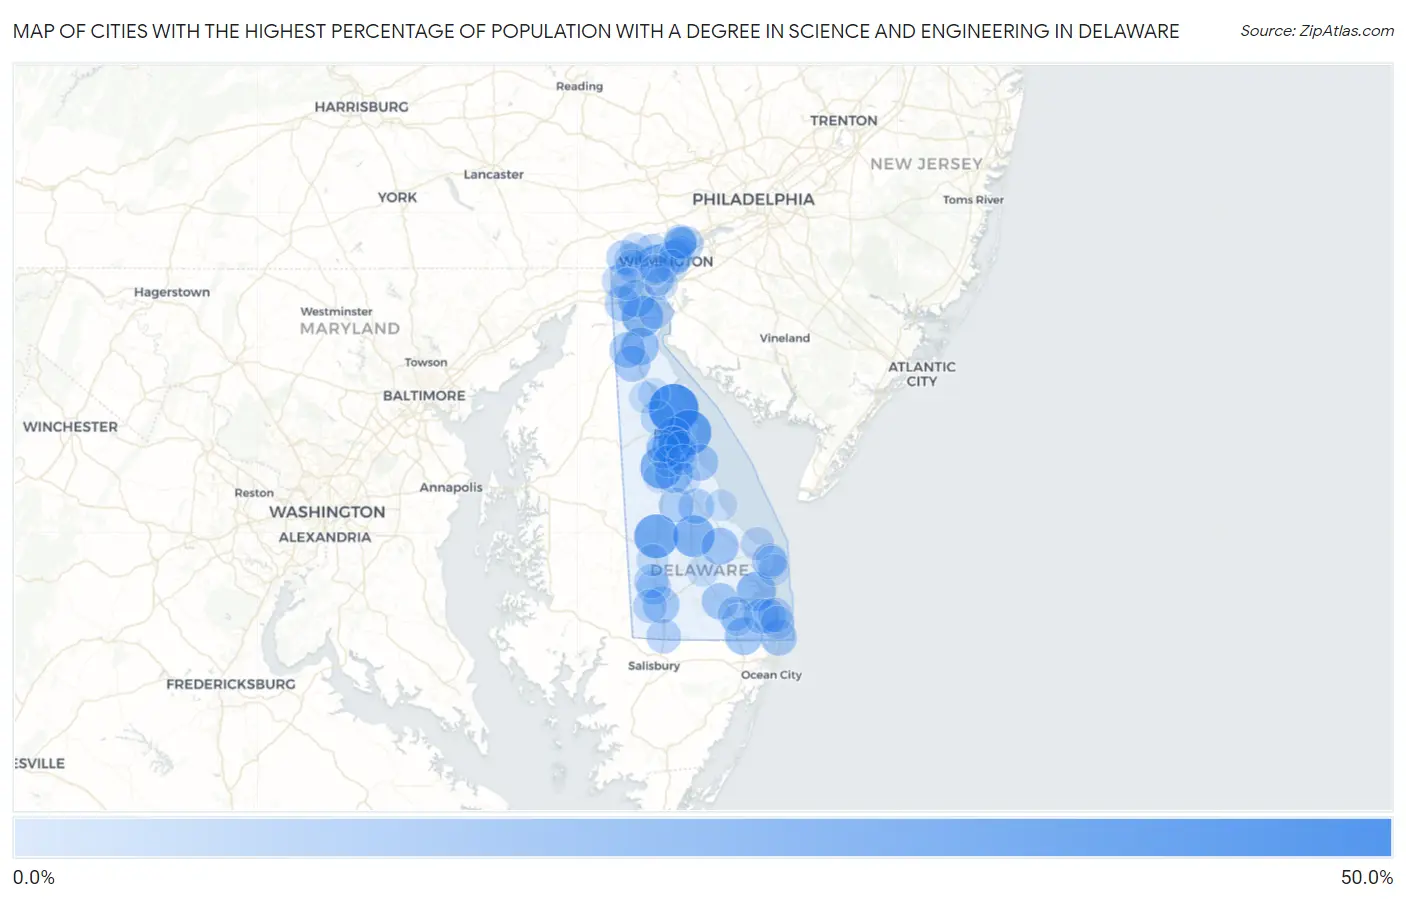
Map of Cities with the Highest Percentage of Population with a Degree in Science and Engineering in Delaware
0.0%
50.0%
Cities with the Highest Percentage of Population with a Degree in Science and Engineering in Delaware
| City | % Graduates | vs State | vs National | |
| 1. | Leipsic | 47.1% | 9.8%(+37.2)#1 | 9.8%(+37.3)#702 |
| 2. | Little Creek | 36.4% | 9.8%(+26.5)#2 | 9.8%(+26.6)#1,151 |
| 3. | Greenwood | 33.3% | 9.8%(+23.5)#3 | 9.8%(+23.6)#1,314 |
| 4. | Viola | 29.4% | 9.8%(+19.6)#4 | 9.8%(+19.6)#1,757 |
| 5. | Ellendale | 27.8% | 9.8%(+17.9)#5 | 9.8%(+18.0)#1,982 |
| 6. | Lincoln | 25.9% | 9.8%(+16.1)#6 | 9.8%(+16.1)#2,246 |
| 7. | St Georges | 25.8% | 9.8%(+16.0)#7 | 9.8%(+16.0)#2,277 |
| 8. | Highland Acres | 22.6% | 9.8%(+12.8)#8 | 9.8%(+12.9)#2,992 |
| 9. | Long Neck | 22.0% | 9.8%(+12.2)#9 | 9.8%(+12.2)#3,170 |
| 10. | Rising Sun Lebanon | 21.2% | 9.8%(+11.4)#10 | 9.8%(+11.4)#3,438 |
| 11. | Elsmere | 19.1% | 9.8%(+9.28)#11 | 9.8%(+9.34)#4,171 |
| 12. | Riverview | 18.7% | 9.8%(+8.89)#12 | 9.8%(+8.95)#4,369 |
| 13. | Odessa | 18.3% | 9.8%(+8.48)#13 | 9.8%(+8.54)#4,551 |
| 14. | Selbyville | 17.9% | 9.8%(+8.06)#14 | 9.8%(+8.12)#4,750 |
| 15. | Bear | 17.0% | 9.8%(+7.15)#15 | 9.8%(+7.21)#5,225 |
| 16. | Milton | 16.9% | 9.8%(+7.07)#16 | 9.8%(+7.13)#5,265 |
| 17. | Laurel | 15.4% | 9.8%(+5.55)#17 | 9.8%(+5.60)#6,261 |
| 18. | Millsboro | 15.3% | 9.8%(+5.44)#18 | 9.8%(+5.50)#6,383 |
| 19. | Bowers | 15.1% | 9.8%(+5.21)#19 | 9.8%(+5.27)#6,555 |
| 20. | Fenwick Island | 14.5% | 9.8%(+4.65)#20 | 9.8%(+4.70)#6,986 |
| 21. | Townsend | 14.0% | 9.8%(+4.20)#21 | 9.8%(+4.26)#7,413 |
| 22. | Middletown | 13.8% | 9.8%(+3.92)#22 | 9.8%(+3.98)#7,676 |
| 23. | Rehoboth Beach | 13.7% | 9.8%(+3.89)#23 | 9.8%(+3.94)#7,699 |
| 24. | Millville | 12.8% | 9.8%(+2.91)#24 | 9.8%(+2.97)#8,745 |
| 25. | Milford | 12.6% | 9.8%(+2.73)#25 | 9.8%(+2.79)#8,921 |
| 26. | Glasgow | 12.2% | 9.8%(+2.40)#26 | 9.8%(+2.46)#9,350 |
| 27. | Houston | 11.8% | 9.8%(+1.93)#27 | 9.8%(+1.98)#9,963 |
| 28. | Claymont | 11.3% | 9.8%(+1.43)#28 | 9.8%(+1.49)#10,659 |
| 29. | Ocean View | 11.3% | 9.8%(+1.42)#29 | 9.8%(+1.48)#10,678 |
| 30. | Dover | 11.2% | 9.8%(+1.32)#30 | 9.8%(+1.38)#10,823 |
| 31. | Bethany Beach | 11.0% | 9.8%(+1.12)#31 | 9.8%(+1.18)#11,158 |
| 32. | Blades | 10.9% | 9.8%(+1.07)#32 | 9.8%(+1.13)#11,215 |
| 33. | North Star | 10.6% | 9.8%(+0.789)#33 | 9.8%(+0.846)#11,676 |
| 34. | Delmar | 10.5% | 9.8%(+0.622)#34 | 9.8%(+0.680)#11,917 |
| 35. | Camden | 10.4% | 9.8%(+0.564)#35 | 9.8%(+0.622)#12,022 |
| 36. | Dagsboro | 10.3% | 9.8%(+0.441)#36 | 9.8%(+0.499)#12,236 |
| 37. | Cheswold | 10.2% | 9.8%(+0.321)#37 | 9.8%(+0.379)#12,429 |
| 38. | Bellefonte | 9.7% | 9.8%(-0.128)#38 | 9.8%(-0.070)#13,135 |
| 39. | Seaford | 9.7% | 9.8%(-0.128)#39 | 9.8%(-0.070)#13,136 |
| 40. | Greenville | 9.6% | 9.8%(-0.198)#40 | 9.8%(-0.140)#13,247 |
| 41. | Edgemoor | 9.1% | 9.8%(-0.735)#41 | 9.8%(-0.677)#14,113 |
| 42. | Pike Creek | 9.0% | 9.8%(-0.844)#42 | 9.8%(-0.786)#14,359 |
| 43. | Bethel | 8.7% | 9.8%(-1.19)#43 | 9.8%(-1.13)#14,910 |
| 44. | Newark | 8.5% | 9.8%(-1.37)#44 | 9.8%(-1.31)#15,179 |
| 45. | South Bethany | 8.0% | 9.8%(-1.81)#45 | 9.8%(-1.75)#15,918 |
| 46. | Lewes | 7.8% | 9.8%(-2.03)#46 | 9.8%(-1.97)#16,246 |
| 47. | Pike Creek Valley | 7.8% | 9.8%(-2.08)#47 | 9.8%(-2.02)#16,314 |
| 48. | Arden | 7.5% | 9.8%(-2.38)#48 | 9.8%(-2.32)#16,796 |
| 49. | Ardencroft | 7.3% | 9.8%(-2.50)#49 | 9.8%(-2.44)#16,975 |
| 50. | Wilmington | 7.3% | 9.8%(-2.57)#50 | 9.8%(-2.51)#17,090 |
| 51. | Delaware City | 7.0% | 9.8%(-2.81)#51 | 9.8%(-2.75)#17,496 |
| 52. | New Castle | 6.7% | 9.8%(-3.14)#52 | 9.8%(-3.08)#17,946 |
| 53. | Wyoming | 6.4% | 9.8%(-3.45)#53 | 9.8%(-3.39)#18,432 |
| 54. | Brookside | 6.3% | 9.8%(-3.58)#54 | 9.8%(-3.52)#18,610 |
| 55. | Hockessin | 5.8% | 9.8%(-4.09)#55 | 9.8%(-4.03)#19,352 |
| 56. | Wilmington Manor | 5.3% | 9.8%(-4.52)#56 | 9.8%(-4.46)#19,845 |
| 57. | Ardentown | 5.3% | 9.8%(-4.54)#57 | 9.8%(-4.48)#19,875 |
| 58. | Frankford | 5.2% | 9.8%(-4.63)#58 | 9.8%(-4.57)#19,991 |
| 59. | Bridgeville | 5.2% | 9.8%(-4.68)#59 | 9.8%(-4.62)#20,036 |
| 60. | Kent Acres | 4.8% | 9.8%(-5.08)#60 | 9.8%(-5.02)#20,454 |
| 61. | Clayton | 4.4% | 9.8%(-5.47)#61 | 9.8%(-5.41)#20,846 |
| 62. | Dewey Beach | 4.3% | 9.8%(-5.57)#62 | 9.8%(-5.51)#20,935 |
| 63. | Woodside East | 4.1% | 9.8%(-5.69)#63 | 9.8%(-5.64)#21,058 |
| 64. | Smyrna | 4.1% | 9.8%(-5.77)#64 | 9.8%(-5.71)#21,127 |
| 65. | Slaughter Beach | 4.0% | 9.8%(-5.88)#65 | 9.8%(-5.83)#21,231 |
| 66. | Georgetown | 3.7% | 9.8%(-6.16)#66 | 9.8%(-6.10)#21,462 |
| 67. | Frederica | 3.4% | 9.8%(-6.47)#67 | 9.8%(-6.41)#21,718 |
| 68. | Dover Base Housing | 2.7% | 9.8%(-7.16)#68 | 9.8%(-7.10)#22,188 |
| 69. | Henlopen Acres | 2.5% | 9.8%(-7.34)#69 | 9.8%(-7.28)#22,347 |
| 70. | Newport | 2.4% | 9.8%(-7.40)#70 | 9.8%(-7.34)#22,374 |
| 71. | Felton | 2.2% | 9.8%(-7.67)#71 | 9.8%(-7.61)#22,509 |
| 72. | Magnolia | 1.7% | 9.8%(-8.12)#72 | 9.8%(-8.06)#22,719 |
1
Common Questions
What are the Top 10 Cities with the Highest Percentage of Population with a Degree in Science and Engineering in Delaware?
Top 10 Cities with the Highest Percentage of Population with a Degree in Science and Engineering in Delaware are:
#1
47.1%
#2
36.4%
#3
33.3%
#4
29.4%
#5
27.8%
#6
25.8%
#7
22.6%
#8
22.0%
#9
21.2%
#10
19.1%
What city has the Highest Percentage of Population with a Degree in Science and Engineering in Delaware?
Leipsic has the Highest Percentage of Population with a Degree in Science and Engineering in Delaware with 47.1%.
What is the Percentage of Population with a Degree in Science and Engineering in the State of Delaware?
Percentage of Population with a Degree in Science and Engineering in Delaware is 9.8%.
What is the Percentage of Population with a Degree in Science and Engineering in the United States?
Percentage of Population with a Degree in Science and Engineering in the United States is 9.8%.