Cities with the Highest Percentage of Population with a Degree in Science and Engineering in North Carolina
RELATED REPORTS & OPTIONS
Science and Engineering
North Carolina
Compare Cities
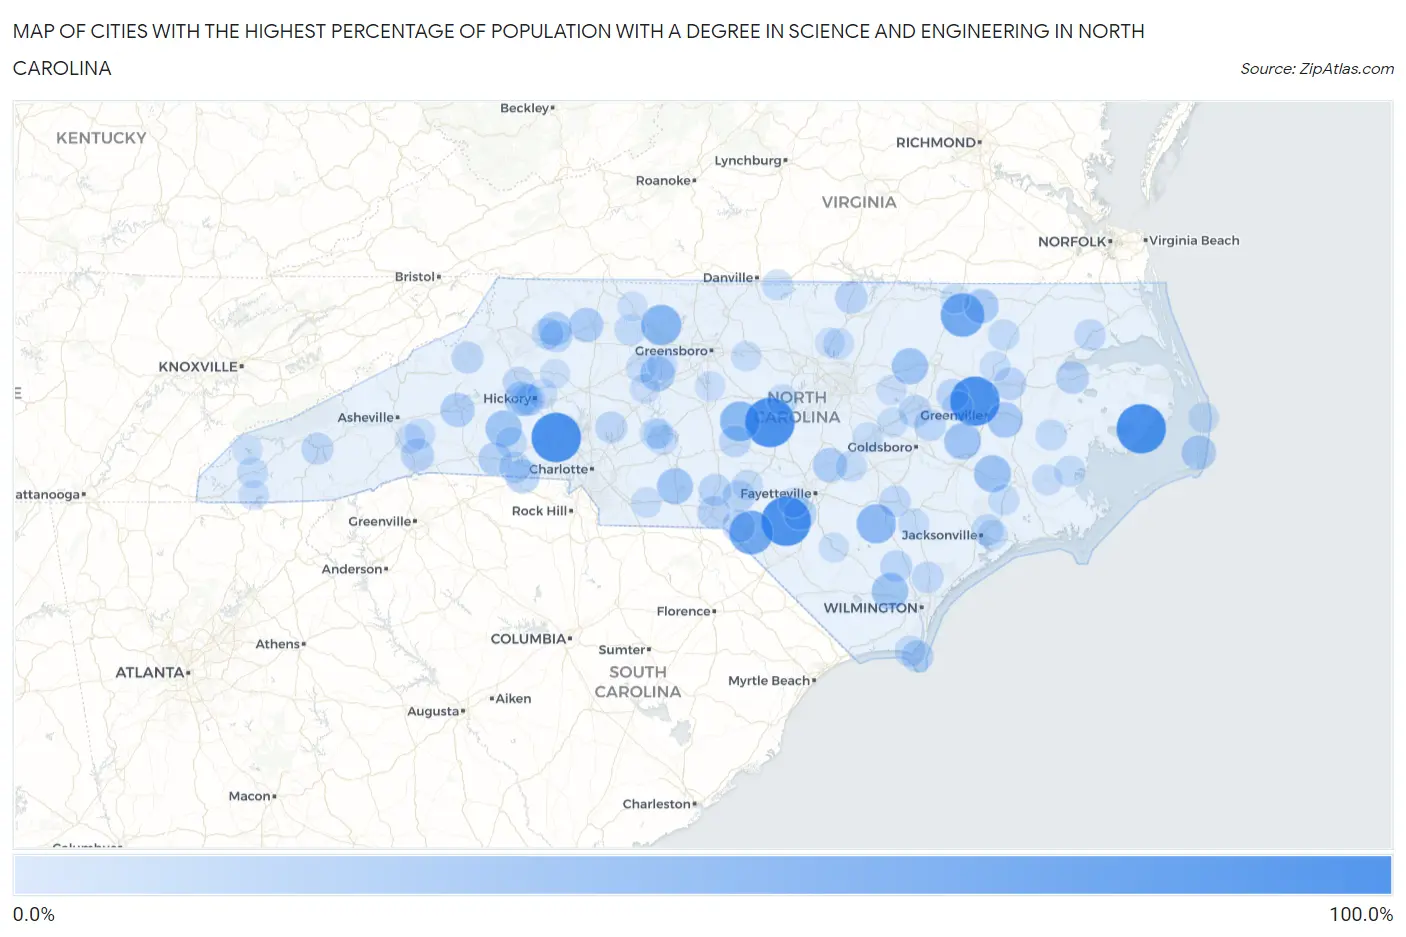
Map of Cities with the Highest Percentage of Population with a Degree in Science and Engineering in North Carolina
0.0%
100.0%
Cities with the Highest Percentage of Population with a Degree in Science and Engineering in North Carolina
| City | % Graduates | vs State | vs National | |
| 1. | Iron Station | 100.0% | 9.8%(+90.2)#1 | 9.8%(+90.2)#18 |
| 2. | Engelhard | 100.0% | 9.8%(+90.2)#2 | 9.8%(+90.2)#68 |
| 3. | Shannon | 100.0% | 9.8%(+90.2)#3 | 9.8%(+90.2)#72 |
| 4. | Gulf | 100.0% | 9.8%(+90.2)#4 | 9.8%(+90.2)#92 |
| 5. | Belvoir | 100.0% | 9.8%(+90.2)#5 | 9.8%(+90.2)#96 |
| 6. | Smithtown | 100.0% | 9.8%(+90.2)#6 | 9.8%(+90.2)#100 |
| 7. | East Laurinburg | 75.0% | 9.8%(+65.2)#7 | 9.8%(+65.2)#267 |
| 8. | Halifax | 74.6% | 9.8%(+64.8)#8 | 9.8%(+64.8)#282 |
| 9. | Germanton | 60.3% | 9.8%(+50.5)#9 | 9.8%(+50.5)#400 |
| 10. | Bennett | 58.8% | 9.8%(+49.1)#10 | 9.8%(+49.0)#426 |
| 11. | Ingold | 56.0% | 9.8%(+46.2)#11 | 9.8%(+46.2)#461 |
| 12. | Crouse | 50.0% | 9.8%(+40.2)#12 | 9.8%(+40.2)#582 |
| 13. | Cove City | 47.1% | 9.8%(+37.4)#13 | 9.8%(+37.3)#696 |
| 14. | Hookerton | 45.5% | 9.8%(+35.7)#14 | 9.8%(+35.7)#728 |
| 15. | Riegelwood | 44.4% | 9.8%(+34.7)#15 | 9.8%(+34.7)#759 |
| 16. | Casar | 44.4% | 9.8%(+34.7)#16 | 9.8%(+34.7)#761 |
| 17. | Momeyer | 43.8% | 9.8%(+34.0)#17 | 9.8%(+34.0)#790 |
| 18. | Ansonville | 42.9% | 9.8%(+33.1)#18 | 9.8%(+33.1)#825 |
| 19. | Grimesland | 40.6% | 9.8%(+30.9)#19 | 9.8%(+30.8)#926 |
| 20. | Welcome | 38.3% | 9.8%(+28.5)#20 | 9.8%(+28.5)#1,060 |
| 21. | Jackson | 37.5% | 9.8%(+27.7)#21 | 9.8%(+27.7)#1,086 |
| 22. | Pleasant Hill | 36.4% | 9.8%(+26.6)#22 | 9.8%(+26.6)#1,144 |
| 23. | Avon | 36.3% | 9.8%(+26.5)#23 | 9.8%(+26.5)#1,158 |
| 24. | Icard | 35.8% | 9.8%(+26.1)#24 | 9.8%(+26.0)#1,183 |
| 25. | Grover | 35.3% | 9.8%(+25.5)#25 | 9.8%(+25.5)#1,213 |
| 26. | Linden | 35.3% | 9.8%(+25.5)#26 | 9.8%(+25.5)#1,220 |
| 27. | West Marion | 35.2% | 9.8%(+25.5)#27 | 9.8%(+25.4)#1,226 |
| 28. | Mulberry | 33.6% | 9.8%(+23.8)#28 | 9.8%(+23.8)#1,307 |
| 29. | Mooresboro | 31.6% | 9.8%(+21.8)#29 | 9.8%(+21.8)#1,516 |
| 30. | Dana | 30.7% | 9.8%(+21.0)#30 | 9.8%(+20.9)#1,610 |
| 31. | Roper | 30.3% | 9.8%(+20.6)#31 | 9.8%(+20.5)#1,640 |
| 32. | Laurel Hill | 29.8% | 9.8%(+20.0)#32 | 9.8%(+20.0)#1,702 |
| 33. | Everetts | 29.4% | 9.8%(+19.7)#33 | 9.8%(+19.6)#1,751 |
| 34. | Parkton | 29.3% | 9.8%(+19.5)#34 | 9.8%(+19.5)#1,766 |
| 35. | Hildebran | 29.0% | 9.8%(+19.3)#35 | 9.8%(+19.3)#1,800 |
| 36. | East Rockingham | 28.9% | 9.8%(+19.2)#36 | 9.8%(+19.2)#1,816 |
| 37. | Stovall | 28.6% | 9.8%(+18.8)#37 | 9.8%(+18.8)#1,863 |
| 38. | Ellerbe | 27.9% | 9.8%(+18.2)#38 | 9.8%(+18.1)#1,961 |
| 39. | Lucama | 27.9% | 9.8%(+18.1)#39 | 9.8%(+18.1)#1,967 |
| 40. | North Wilkesboro | 27.3% | 9.8%(+17.5)#40 | 9.8%(+17.5)#2,034 |
| 41. | Hoffman | 27.3% | 9.8%(+17.5)#41 | 9.8%(+17.5)#2,041 |
| 42. | Atkinson | 27.3% | 9.8%(+17.5)#42 | 9.8%(+17.5)#2,049 |
| 43. | Macclesfield | 27.3% | 9.8%(+17.5)#43 | 9.8%(+17.5)#2,055 |
| 44. | Dillsboro | 27.0% | 9.8%(+17.2)#44 | 9.8%(+17.2)#2,095 |
| 45. | Bald Head Island | 26.5% | 9.8%(+16.8)#45 | 9.8%(+16.7)#2,156 |
| 46. | Eureka | 26.5% | 9.8%(+16.7)#46 | 9.8%(+16.7)#2,164 |
| 47. | Robbins | 26.3% | 9.8%(+16.6)#47 | 9.8%(+16.5)#2,178 |
| 48. | Crossnore | 26.3% | 9.8%(+16.6)#48 | 9.8%(+16.5)#2,197 |
| 49. | Enochville | 25.9% | 9.8%(+16.2)#49 | 9.8%(+16.2)#2,243 |
| 50. | Hudson | 25.7% | 9.8%(+15.9)#50 | 9.8%(+15.9)#2,291 |
| 51. | Millers Creek | 25.7% | 9.8%(+15.9)#51 | 9.8%(+15.9)#2,298 |
| 52. | Rocky Point | 25.5% | 9.8%(+15.7)#52 | 9.8%(+15.7)#2,323 |
| 53. | Patterson Springs | 25.4% | 9.8%(+15.6)#53 | 9.8%(+15.6)#2,340 |
| 54. | Pumpkin Center | 25.1% | 9.8%(+15.4)#54 | 9.8%(+15.4)#2,371 |
| 55. | Turkey | 25.0% | 9.8%(+15.2)#55 | 9.8%(+15.2)#2,406 |
| 56. | Hertford | 24.7% | 9.8%(+14.9)#56 | 9.8%(+14.9)#2,531 |
| 57. | Caswell Beach | 24.4% | 9.8%(+14.7)#57 | 9.8%(+14.6)#2,570 |
| 58. | Pittsboro | 24.1% | 9.8%(+14.3)#58 | 9.8%(+14.3)#2,638 |
| 59. | Lawndale | 23.8% | 9.8%(+14.1)#59 | 9.8%(+14.0)#2,686 |
| 60. | Kelford | 23.8% | 9.8%(+14.1)#60 | 9.8%(+14.0)#2,692 |
| 61. | Plain View | 23.6% | 9.8%(+13.9)#61 | 9.8%(+13.8)#2,728 |
| 62. | Mesic | 23.5% | 9.8%(+13.8)#62 | 9.8%(+13.7)#2,758 |
| 63. | East Bend | 23.3% | 9.8%(+13.5)#63 | 9.8%(+13.5)#2,825 |
| 64. | Misenheimer | 23.3% | 9.8%(+13.5)#64 | 9.8%(+13.5)#2,826 |
| 65. | Bath | 23.2% | 9.8%(+13.4)#65 | 9.8%(+13.4)#2,850 |
| 66. | Pinebluff | 22.8% | 9.8%(+13.0)#66 | 9.8%(+13.0)#2,948 |
| 67. | Long View | 22.6% | 9.8%(+12.9)#67 | 9.8%(+12.8)#3,004 |
| 68. | Pollocksville | 22.4% | 9.8%(+12.7)#68 | 9.8%(+12.7)#3,049 |
| 69. | Springdale | 22.3% | 9.8%(+12.5)#69 | 9.8%(+12.5)#3,073 |
| 70. | Andrews | 22.2% | 9.8%(+12.5)#70 | 9.8%(+12.4)#3,079 |
| 71. | Rose Hill | 22.2% | 9.8%(+12.5)#71 | 9.8%(+12.4)#3,080 |
| 72. | Milton | 22.2% | 9.8%(+12.5)#72 | 9.8%(+12.4)#3,122 |
| 73. | Creedmoor | 21.8% | 9.8%(+12.0)#73 | 9.8%(+12.0)#3,243 |
| 74. | New London | 21.6% | 9.8%(+11.9)#74 | 9.8%(+11.9)#3,277 |
| 75. | Advance | 21.6% | 9.8%(+11.8)#75 | 9.8%(+11.8)#3,298 |
| 76. | Micro | 21.6% | 9.8%(+11.8)#76 | 9.8%(+11.8)#3,304 |
| 77. | Gerton | 21.6% | 9.8%(+11.8)#77 | 9.8%(+11.8)#3,306 |
| 78. | Grantsboro | 21.5% | 9.8%(+11.8)#78 | 9.8%(+11.8)#3,316 |
| 79. | Piney Green | 21.5% | 9.8%(+11.7)#79 | 9.8%(+11.7)#3,328 |
| 80. | Oak City | 21.4% | 9.8%(+11.7)#80 | 9.8%(+11.6)#3,350 |
| 81. | Rodanthe | 21.3% | 9.8%(+11.6)#81 | 9.8%(+11.6)#3,389 |
| 82. | Fountain | 20.8% | 9.8%(+11.1)#82 | 9.8%(+11.1)#3,538 |
| 83. | Marshville | 20.7% | 9.8%(+11.0)#83 | 9.8%(+10.9)#3,573 |
| 84. | Four Oaks | 20.5% | 9.8%(+10.7)#84 | 9.8%(+10.7)#3,659 |
| 85. | Alamance | 20.4% | 9.8%(+10.7)#85 | 9.8%(+10.6)#3,676 |
| 86. | Middlesex | 20.3% | 9.8%(+10.6)#86 | 9.8%(+10.6)#3,693 |
| 87. | Tyro | 20.2% | 9.8%(+10.5)#87 | 9.8%(+10.4)#3,728 |
| 88. | Midway | 20.0% | 9.8%(+10.3)#88 | 9.8%(+10.2)#3,770 |
| 89. | Hayesville | 20.0% | 9.8%(+10.2)#89 | 9.8%(+10.2)#3,802 |
| 90. | St Stephens | 19.6% | 9.8%(+9.87)#90 | 9.8%(+9.84)#3,991 |
| 91. | Hoopers Creek | 19.4% | 9.8%(+9.66)#91 | 9.8%(+9.63)#4,064 |
| 92. | Rockfish | 19.4% | 9.8%(+9.63)#92 | 9.8%(+9.60)#4,083 |
| 93. | Randleman | 19.2% | 9.8%(+9.48)#93 | 9.8%(+9.45)#4,128 |
| 94. | Dublin | 19.2% | 9.8%(+9.48)#94 | 9.8%(+9.45)#4,136 |
| 95. | Richfield | 18.9% | 9.8%(+9.20)#95 | 9.8%(+9.17)#4,242 |
| 96. | Butner | 18.9% | 9.8%(+9.19)#96 | 9.8%(+9.16)#4,246 |
| 97. | Pilot Mountain | 18.9% | 9.8%(+9.10)#97 | 9.8%(+9.07)#4,290 |
| 98. | Taylorsville | 18.7% | 9.8%(+8.90)#98 | 9.8%(+8.87)#4,394 |
| 99. | Roanoke Rapids | 18.4% | 9.8%(+8.67)#99 | 9.8%(+8.64)#4,495 |
| 100. | Lake Santeetlah | 18.4% | 9.8%(+8.62)#100 | 9.8%(+8.59)#4,530 |
Common Questions
What are the Top 10 Cities with the Highest Percentage of Population with a Degree in Science and Engineering in North Carolina?
Top 10 Cities with the Highest Percentage of Population with a Degree in Science and Engineering in North Carolina are:
#1
100.0%
#2
100.0%
#3
100.0%
#4
100.0%
#5
100.0%
#6
75.0%
#7
74.6%
#8
60.3%
#9
58.8%
#10
56.0%
What city has the Highest Percentage of Population with a Degree in Science and Engineering in North Carolina?
Iron Station has the Highest Percentage of Population with a Degree in Science and Engineering in North Carolina with 100.0%.
What is the Percentage of Population with a Degree in Science and Engineering in the State of North Carolina?
Percentage of Population with a Degree in Science and Engineering in North Carolina is 9.8%.
What is the Percentage of Population with a Degree in Science and Engineering in the United States?
Percentage of Population with a Degree in Science and Engineering in the United States is 9.8%.