Cities with the Highest Percentage of Population with a Degree in Science and Engineering in Utah
RELATED REPORTS & OPTIONS
Science and Engineering
Utah
Compare Cities
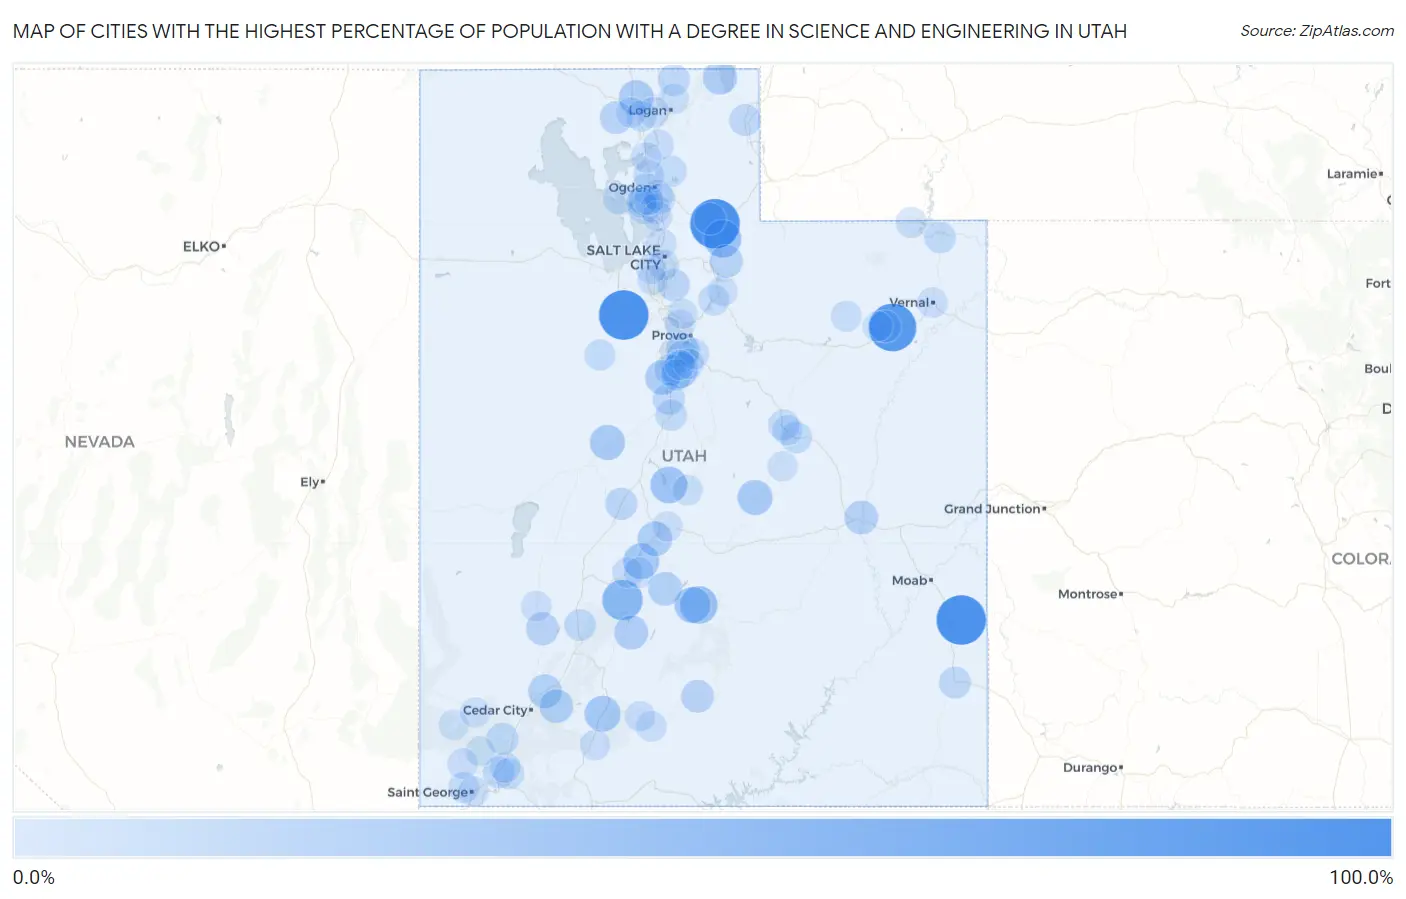
Map of Cities with the Highest Percentage of Population with a Degree in Science and Engineering in Utah
0.0%
100.0%
Cities with the Highest Percentage of Population with a Degree in Science and Engineering in Utah
| City | % Graduates | vs State | vs National | |
| 1. | La Sal | 100.0% | 10.4%(+89.6)#1 | 9.8%(+90.2)#61 |
| 2. | Echo | 100.0% | 10.4%(+89.6)#2 | 9.8%(+90.2)#147 |
| 3. | Ophir | 100.0% | 10.4%(+89.6)#3 | 9.8%(+90.2)#182 |
| 4. | Fort Duchesne | 90.9% | 10.4%(+80.5)#4 | 9.8%(+81.1)#217 |
| 5. | Marysvale | 57.5% | 10.4%(+47.2)#5 | 9.8%(+47.8)#440 |
| 6. | Hobble Creek | 50.0% | 10.4%(+39.6)#6 | 9.8%(+40.2)#571 |
| 7. | Hoytsville | 44.6% | 10.4%(+34.2)#7 | 9.8%(+34.8)#751 |
| 8. | Lyman | 44.4% | 10.4%(+34.1)#8 | 9.8%(+34.7)#765 |
| 9. | Fayette | 40.4% | 10.4%(+30.0)#9 | 9.8%(+30.6)#937 |
| 10. | Spring Lake | 37.8% | 10.4%(+27.4)#10 | 9.8%(+28.0)#1,076 |
| 11. | Central Valley | 37.2% | 10.4%(+26.8)#11 | 9.8%(+27.4)#1,116 |
| 12. | Loa | 37.2% | 10.4%(+26.8)#12 | 9.8%(+27.4)#1,117 |
| 13. | Hatch | 36.8% | 10.4%(+26.5)#13 | 9.8%(+27.1)#1,129 |
| 14. | Lynndyl | 33.3% | 10.4%(+23.0)#14 | 9.8%(+23.6)#1,384 |
| 15. | Clawson | 33.3% | 10.4%(+23.0)#15 | 9.8%(+23.6)#1,402 |
| 16. | Riverside | 32.4% | 10.4%(+22.0)#16 | 9.8%(+22.6)#1,451 |
| 17. | Sigurd | 31.4% | 10.4%(+21.1)#17 | 9.8%(+21.6)#1,530 |
| 18. | Goshen | 30.6% | 10.4%(+20.2)#18 | 9.8%(+20.8)#1,617 |
| 19. | Garden City | 29.8% | 10.4%(+19.4)#19 | 9.8%(+20.0)#1,706 |
| 20. | Kingston | 28.6% | 10.4%(+18.2)#20 | 9.8%(+18.8)#1,865 |
| 21. | Koosharem | 27.8% | 10.4%(+17.4)#21 | 9.8%(+18.0)#1,985 |
| 22. | Summit | 27.3% | 10.4%(+16.9)#22 | 9.8%(+17.5)#2,059 |
| 23. | Brian Head | 27.3% | 10.4%(+16.9)#23 | 9.8%(+17.5)#2,069 |
| 24. | Green River | 26.9% | 10.4%(+16.6)#24 | 9.8%(+17.1)#2,105 |
| 25. | Lake Shore | 26.7% | 10.4%(+16.4)#25 | 9.8%(+17.0)#2,124 |
| 26. | Peoa | 25.0% | 10.4%(+14.6)#26 | 9.8%(+15.2)#2,478 |
| 27. | Minersville | 24.1% | 10.4%(+13.7)#27 | 9.8%(+14.3)#2,628 |
| 28. | Escalante | 23.5% | 10.4%(+13.2)#28 | 9.8%(+13.7)#2,748 |
| 29. | Thatcher | 23.4% | 10.4%(+13.0)#29 | 9.8%(+13.6)#2,789 |
| 30. | Sundance | 22.2% | 10.4%(+11.9)#30 | 9.8%(+12.4)#3,138 |
| 31. | Granite | 20.4% | 10.4%(+10.0)#31 | 9.8%(+10.6)#3,686 |
| 32. | Ballard | 20.0% | 10.4%(+9.63)#32 | 9.8%(+10.2)#3,783 |
| 33. | Holden | 20.0% | 10.4%(+9.63)#33 | 9.8%(+10.2)#3,812 |
| 34. | Monticello | 19.6% | 10.4%(+9.24)#34 | 9.8%(+9.83)#3,994 |
| 35. | Richmond | 19.4% | 10.4%(+9.03)#35 | 9.8%(+9.61)#4,074 |
| 36. | Mona | 19.4% | 10.4%(+9.02)#36 | 9.8%(+9.60)#4,081 |
| 37. | New Harmony | 19.2% | 10.4%(+8.83)#37 | 9.8%(+9.41)#4,158 |
| 38. | Henefer | 18.7% | 10.4%(+8.34)#38 | 9.8%(+8.93)#4,374 |
| 39. | Randolph | 18.6% | 10.4%(+8.24)#39 | 9.8%(+8.82)#4,411 |
| 40. | Beaver | 18.3% | 10.4%(+7.98)#40 | 9.8%(+8.57)#4,536 |
| 41. | Benjamin | 18.0% | 10.4%(+7.62)#41 | 9.8%(+8.20)#4,710 |
| 42. | Leeds | 17.7% | 10.4%(+7.38)#42 | 9.8%(+7.96)#4,816 |
| 43. | Flaming Gorge | 17.6% | 10.4%(+7.28)#43 | 9.8%(+7.87)#4,888 |
| 44. | Wellington | 17.6% | 10.4%(+7.21)#44 | 9.8%(+7.79)#4,907 |
| 45. | Nephi | 17.3% | 10.4%(+6.95)#45 | 9.8%(+7.54)#5,039 |
| 46. | Genola | 16.8% | 10.4%(+6.46)#46 | 9.8%(+7.05)#5,307 |
| 47. | Hooper | 16.8% | 10.4%(+6.46)#47 | 9.8%(+7.04)#5,308 |
| 48. | La Verkin | 16.3% | 10.4%(+5.89)#48 | 9.8%(+6.47)#5,699 |
| 49. | Carbonville | 16.2% | 10.4%(+5.85)#49 | 9.8%(+6.43)#5,716 |
| 50. | Wolf Creek | 16.0% | 10.4%(+5.67)#50 | 9.8%(+6.26)#5,824 |
| 51. | Santaquin | 16.0% | 10.4%(+5.63)#51 | 9.8%(+6.22)#5,845 |
| 52. | Vernon | 15.8% | 10.4%(+5.42)#52 | 9.8%(+6.01)#6,013 |
| 53. | Syracuse | 15.8% | 10.4%(+5.38)#53 | 9.8%(+5.97)#6,034 |
| 54. | Charleston | 15.7% | 10.4%(+5.37)#54 | 9.8%(+5.96)#6,041 |
| 55. | Spanish Fork | 15.4% | 10.4%(+5.08)#55 | 9.8%(+5.66)#6,237 |
| 56. | Mendon | 15.1% | 10.4%(+4.69)#56 | 9.8%(+5.27)#6,553 |
| 57. | Santa Clara | 14.9% | 10.4%(+4.57)#57 | 9.8%(+5.16)#6,653 |
| 58. | West Haven | 14.7% | 10.4%(+4.32)#58 | 9.8%(+4.90)#6,843 |
| 59. | Clinton | 14.6% | 10.4%(+4.20)#59 | 9.8%(+4.78)#6,936 |
| 60. | Altamont | 14.3% | 10.4%(+3.92)#60 | 9.8%(+4.50)#7,172 |
| 61. | Manila | 14.3% | 10.4%(+3.92)#61 | 9.8%(+4.50)#7,182 |
| 62. | Deweyville | 14.3% | 10.4%(+3.92)#62 | 9.8%(+4.50)#7,196 |
| 63. | South Salt Lake | 14.1% | 10.4%(+3.73)#63 | 9.8%(+4.32)#7,368 |
| 64. | Joseph | 14.0% | 10.4%(+3.63)#64 | 9.8%(+4.22)#7,455 |
| 65. | South Ogden | 13.9% | 10.4%(+3.53)#65 | 9.8%(+4.12)#7,534 |
| 66. | Farr West | 13.9% | 10.4%(+3.50)#66 | 9.8%(+4.09)#7,572 |
| 67. | Henrieville | 13.8% | 10.4%(+3.43)#67 | 9.8%(+4.01)#7,645 |
| 68. | Dammeron Valley | 13.6% | 10.4%(+3.20)#68 | 9.8%(+3.78)#7,836 |
| 69. | Milford | 13.5% | 10.4%(+3.16)#69 | 9.8%(+3.74)#7,887 |
| 70. | Tropic | 13.3% | 10.4%(+2.91)#70 | 9.8%(+3.50)#8,153 |
| 71. | Monroe | 13.3% | 10.4%(+2.90)#71 | 9.8%(+3.48)#8,163 |
| 72. | Layton | 13.2% | 10.4%(+2.84)#72 | 9.8%(+3.42)#8,230 |
| 73. | Uintah | 13.2% | 10.4%(+2.81)#73 | 9.8%(+3.40)#8,254 |
| 74. | Sterling | 13.2% | 10.4%(+2.79)#74 | 9.8%(+3.38)#8,287 |
| 75. | Mantua | 13.1% | 10.4%(+2.74)#75 | 9.8%(+3.33)#8,333 |
| 76. | North Salt Lake | 13.0% | 10.4%(+2.63)#76 | 9.8%(+3.22)#8,471 |
| 77. | Willard | 13.0% | 10.4%(+2.61)#77 | 9.8%(+3.20)#8,494 |
| 78. | Toquerville | 12.9% | 10.4%(+2.54)#78 | 9.8%(+3.13)#8,567 |
| 79. | West Valley City | 12.8% | 10.4%(+2.46)#79 | 9.8%(+3.05)#8,663 |
| 80. | Alton | 12.8% | 10.4%(+2.45)#80 | 9.8%(+3.04)#8,681 |
| 81. | Vernal | 12.8% | 10.4%(+2.40)#81 | 9.8%(+2.99)#8,718 |
| 82. | Vineyard | 12.7% | 10.4%(+2.37)#82 | 9.8%(+2.96)#8,762 |
| 83. | Tremonton | 12.7% | 10.4%(+2.32)#83 | 9.8%(+2.90)#8,804 |
| 84. | Price | 12.6% | 10.4%(+2.26)#84 | 9.8%(+2.85)#8,856 |
| 85. | Salem | 12.5% | 10.4%(+2.10)#85 | 9.8%(+2.69)#9,092 |
| 86. | Pleasant Grove | 12.4% | 10.4%(+2.06)#86 | 9.8%(+2.65)#9,130 |
| 87. | Heber | 12.3% | 10.4%(+1.98)#87 | 9.8%(+2.56)#9,218 |
| 88. | Hyde Park | 12.3% | 10.4%(+1.91)#88 | 9.8%(+2.49)#9,300 |
| 89. | Enterprise | 12.2% | 10.4%(+1.86)#89 | 9.8%(+2.45)#9,358 |
| 90. | West Point | 12.1% | 10.4%(+1.74)#90 | 9.8%(+2.33)#9,524 |
| 91. | Salina | 12.0% | 10.4%(+1.63)#91 | 9.8%(+2.22)#9,643 |
| 92. | Cleveland | 12.0% | 10.4%(+1.63)#92 | 9.8%(+2.22)#9,653 |
| 93. | West Jordan | 12.0% | 10.4%(+1.60)#93 | 9.8%(+2.18)#9,699 |
| 94. | St George | 11.8% | 10.4%(+1.42)#94 | 9.8%(+2.00)#9,933 |
| 95. | Pine Valley | 11.8% | 10.4%(+1.40)#95 | 9.8%(+1.98)#9,971 |
| 96. | Kaysville | 11.8% | 10.4%(+1.39)#96 | 9.8%(+1.97)#9,995 |
| 97. | Payson | 11.7% | 10.4%(+1.34)#97 | 9.8%(+1.92)#10,051 |
| 98. | Newcastle | 11.7% | 10.4%(+1.34)#98 | 9.8%(+1.92)#10,055 |
| 99. | Roosevelt | 11.7% | 10.4%(+1.30)#99 | 9.8%(+1.88)#10,111 |
| 100. | Sunset | 11.6% | 10.4%(+1.24)#100 | 9.8%(+1.83)#10,179 |
Common Questions
What are the Top 10 Cities with the Highest Percentage of Population with a Degree in Science and Engineering in Utah?
Top 10 Cities with the Highest Percentage of Population with a Degree in Science and Engineering in Utah are:
#1
100.0%
#2
100.0%
#3
100.0%
#4
90.9%
#5
57.5%
#6
44.6%
#7
44.4%
#8
40.4%
#9
37.8%
#10
37.2%
What city has the Highest Percentage of Population with a Degree in Science and Engineering in Utah?
La Sal has the Highest Percentage of Population with a Degree in Science and Engineering in Utah with 100.0%.
What is the Percentage of Population with a Degree in Science and Engineering in the State of Utah?
Percentage of Population with a Degree in Science and Engineering in Utah is 10.4%.
What is the Percentage of Population with a Degree in Science and Engineering in the United States?
Percentage of Population with a Degree in Science and Engineering in the United States is 9.8%.