Cities with the Highest Percentage of Population with a Degree in Science and Engineering in Massachusetts
RELATED REPORTS & OPTIONS
Science and Engineering
Massachusetts
Compare Cities
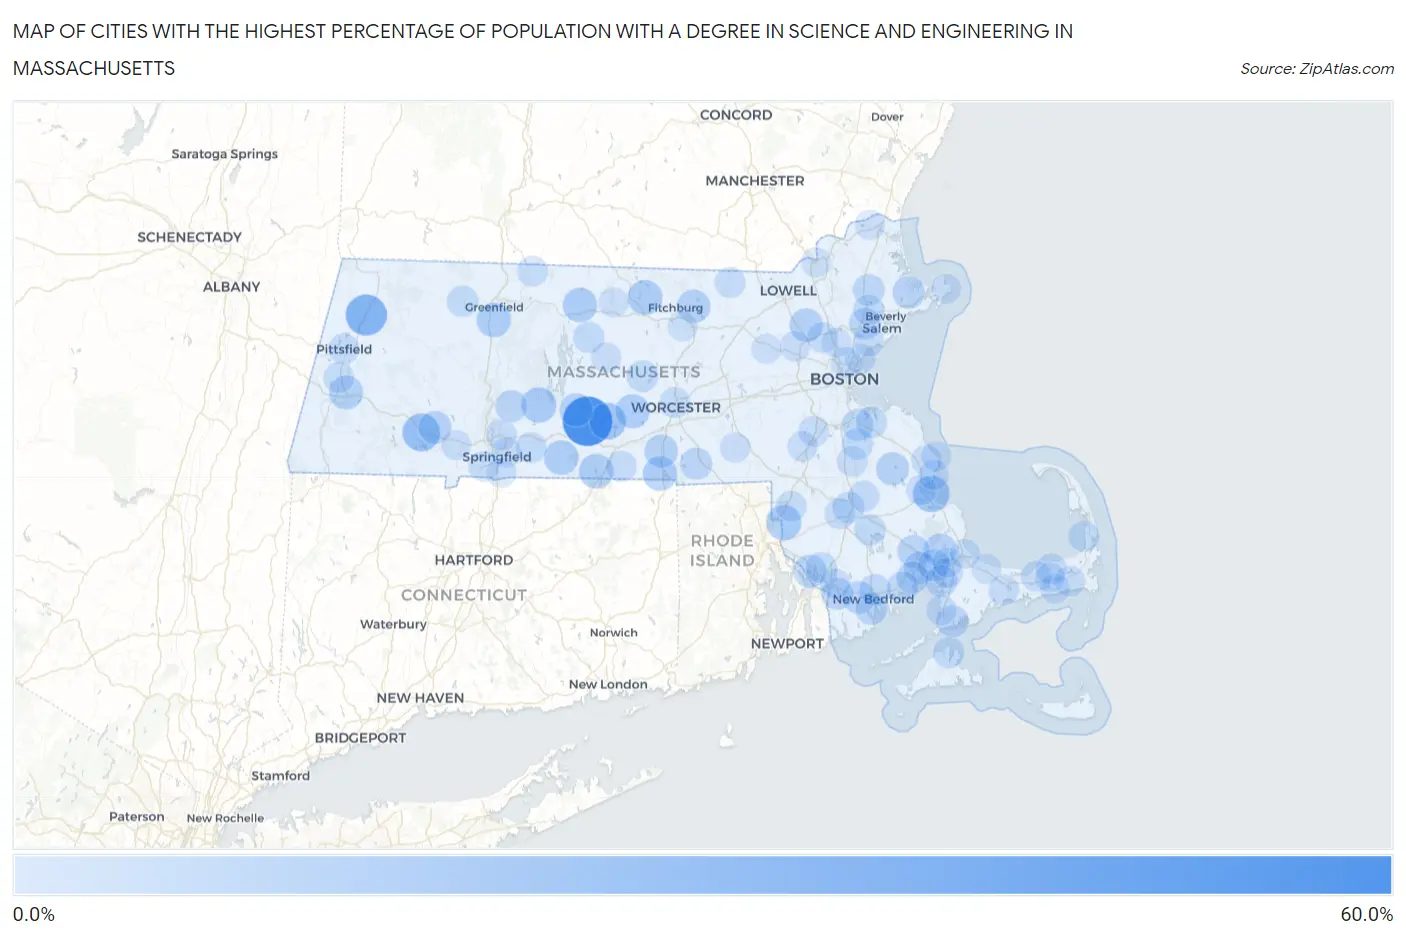
Map of Cities with the Highest Percentage of Population with a Degree in Science and Engineering in Massachusetts
0.0%
60.0%
Cities with the Highest Percentage of Population with a Degree in Science and Engineering in Massachusetts
| City | % Graduates | vs State | vs National | |
| 1. | Warren | 52.1% | 8.5%(+43.7)#1 | 9.8%(+42.4)#518 |
| 2. | Cheshire | 32.7% | 8.5%(+24.2)#2 | 9.8%(+22.9)#1,435 |
| 3. | Blandford | 25.5% | 8.5%(+17.0)#3 | 9.8%(+15.7)#2,319 |
| 4. | North Plymouth | 23.5% | 8.5%(+15.1)#4 | 9.8%(+13.7)#2,764 |
| 5. | Brookfield | 23.2% | 8.5%(+14.7)#5 | 9.8%(+13.4)#2,837 |
| 6. | North Seekonk | 20.2% | 8.5%(+11.8)#6 | 9.8%(+10.5)#3,723 |
| 7. | Oak Bluffs | 20.1% | 8.5%(+11.6)#7 | 9.8%(+10.3)#3,763 |
| 8. | Belchertown | 20.0% | 8.5%(+11.5)#8 | 9.8%(+10.2)#3,775 |
| 9. | South Ashburnham | 19.3% | 8.5%(+10.8)#9 | 9.8%(+9.48)#4,120 |
| 10. | Holland | 18.8% | 8.5%(+10.3)#10 | 9.8%(+9.03)#4,309 |
| 11. | Deerfield | 18.6% | 8.5%(+10.2)#11 | 9.8%(+8.85)#4,403 |
| 12. | Athol | 18.5% | 8.5%(+10.1)#12 | 9.8%(+8.76)#4,443 |
| 13. | Monson Center | 18.5% | 8.5%(+10.1)#13 | 9.8%(+8.76)#4,447 |
| 14. | Webster | 18.3% | 8.5%(+9.85)#14 | 9.8%(+8.54)#4,553 |
| 15. | Spencer | 17.9% | 8.5%(+9.45)#15 | 9.8%(+8.13)#4,742 |
| 16. | Lee | 17.4% | 8.5%(+8.91)#16 | 9.8%(+7.60)#5,021 |
| 17. | Ware | 16.5% | 8.5%(+7.99)#17 | 9.8%(+6.68)#5,572 |
| 18. | Oxford | 16.3% | 8.5%(+7.86)#18 | 9.8%(+6.54)#5,657 |
| 19. | Lunenburg | 16.3% | 8.5%(+7.81)#19 | 9.8%(+6.50)#5,675 |
| 20. | Pinehurst | 16.2% | 8.5%(+7.76)#20 | 9.8%(+6.45)#5,710 |
| 21. | White Island Shores | 15.7% | 8.5%(+7.20)#21 | 9.8%(+5.89)#6,089 |
| 22. | Hanson | 15.6% | 8.5%(+7.13)#22 | 9.8%(+5.82)#6,134 |
| 23. | Russell | 15.4% | 8.5%(+6.98)#23 | 9.8%(+5.67)#6,233 |
| 24. | Ocean Grove | 15.2% | 8.5%(+6.78)#24 | 9.8%(+5.47)#6,410 |
| 25. | West Wareham | 15.1% | 8.5%(+6.66)#25 | 9.8%(+5.34)#6,506 |
| 26. | Smith Mills | 14.8% | 8.5%(+6.34)#26 | 9.8%(+5.03)#6,769 |
| 27. | Essex | 14.7% | 8.5%(+6.19)#27 | 9.8%(+4.88)#6,862 |
| 28. | Weweantic | 14.1% | 8.5%(+5.66)#28 | 9.8%(+4.35)#7,341 |
| 29. | Onset | 13.6% | 8.5%(+5.14)#29 | 9.8%(+3.82)#7,806 |
| 30. | North Westport | 13.6% | 8.5%(+5.09)#30 | 9.8%(+3.78)#7,841 |
| 31. | Marion Center | 13.5% | 8.5%(+5.03)#31 | 9.8%(+3.72)#7,910 |
| 32. | Pocasset | 13.5% | 8.5%(+5.02)#32 | 9.8%(+3.70)#7,922 |
| 33. | Teaticket | 13.4% | 8.5%(+4.93)#33 | 9.8%(+3.62)#8,008 |
| 34. | Granby | 13.3% | 8.5%(+4.85)#34 | 9.8%(+3.54)#8,127 |
| 35. | Bliss Corner | 13.2% | 8.5%(+4.78)#35 | 9.8%(+3.47)#8,176 |
| 36. | East Douglas | 13.2% | 8.5%(+4.76)#36 | 9.8%(+3.45)#8,195 |
| 37. | Peabody | 13.2% | 8.5%(+4.74)#37 | 9.8%(+3.43)#8,213 |
| 38. | Topsfield | 12.9% | 8.5%(+4.39)#38 | 9.8%(+3.08)#8,626 |
| 39. | New Bedford | 12.8% | 8.5%(+4.38)#39 | 9.8%(+3.07)#8,638 |
| 40. | Braintree Town | 12.7% | 8.5%(+4.28)#40 | 9.8%(+2.96)#8,751 |
| 41. | Mattapoisett Center | 12.6% | 8.5%(+4.17)#41 | 9.8%(+2.86)#8,849 |
| 42. | Rutland | 12.5% | 8.5%(+4.01)#42 | 9.8%(+2.69)#9,088 |
| 43. | Holbrook | 12.5% | 8.5%(+4.00)#43 | 9.8%(+2.68)#9,096 |
| 44. | Weymouth Town | 12.4% | 8.5%(+3.98)#44 | 9.8%(+2.67)#9,112 |
| 45. | Raynham Center | 12.4% | 8.5%(+3.89)#45 | 9.8%(+2.57)#9,206 |
| 46. | Shelburne Falls | 12.2% | 8.5%(+3.74)#46 | 9.8%(+2.43)#9,389 |
| 47. | North Lakeville | 12.0% | 8.5%(+3.53)#47 | 9.8%(+2.22)#9,641 |
| 48. | Petersham | 11.9% | 8.5%(+3.41)#48 | 9.8%(+2.10)#9,824 |
| 49. | Vineyard Haven | 11.8% | 8.5%(+3.37)#49 | 9.8%(+2.06)#9,880 |
| 50. | North Eastham | 11.6% | 8.5%(+3.18)#50 | 9.8%(+1.87)#10,126 |
| 51. | Somerset | 11.5% | 8.5%(+3.02)#51 | 9.8%(+1.70)#10,352 |
| 52. | Danvers | 11.5% | 8.5%(+2.98)#52 | 9.8%(+1.67)#10,402 |
| 53. | Monument Beach | 11.2% | 8.5%(+2.76)#53 | 9.8%(+1.45)#10,724 |
| 54. | Wilbraham | 11.2% | 8.5%(+2.75)#54 | 9.8%(+1.44)#10,741 |
| 55. | Bridgewater Town | 11.2% | 8.5%(+2.72)#55 | 9.8%(+1.41)#10,778 |
| 56. | Woburn | 11.1% | 8.5%(+2.62)#56 | 9.8%(+1.30)#11,005 |
| 57. | Worcester | 11.0% | 8.5%(+2.58)#57 | 9.8%(+1.27)#11,041 |
| 58. | Everett | 11.0% | 8.5%(+2.52)#58 | 9.8%(+1.21)#11,119 |
| 59. | Southbridge Town | 11.0% | 8.5%(+2.51)#59 | 9.8%(+1.20)#11,137 |
| 60. | Lenox | 11.0% | 8.5%(+2.48)#60 | 9.8%(+1.17)#11,170 |
| 61. | Taunton | 10.9% | 8.5%(+2.45)#61 | 9.8%(+1.14)#11,196 |
| 62. | Pittsfield | 10.9% | 8.5%(+2.43)#62 | 9.8%(+1.12)#11,237 |
| 63. | Brockton | 10.9% | 8.5%(+2.42)#63 | 9.8%(+1.11)#11,246 |
| 64. | Barnstable Town | 10.9% | 8.5%(+2.42)#64 | 9.8%(+1.11)#11,251 |
| 65. | East Dennis | 10.9% | 8.5%(+2.40)#65 | 9.8%(+1.09)#11,273 |
| 66. | Norwood | 10.9% | 8.5%(+2.39)#66 | 9.8%(+1.08)#11,301 |
| 67. | Attleboro | 10.8% | 8.5%(+2.37)#67 | 9.8%(+1.06)#11,324 |
| 68. | Chicopee | 10.7% | 8.5%(+2.25)#68 | 9.8%(+0.941)#11,495 |
| 69. | East Pepperell | 10.6% | 8.5%(+2.17)#69 | 9.8%(+0.862)#11,639 |
| 70. | Harwich Center | 10.5% | 8.5%(+2.00)#70 | 9.8%(+0.689)#11,907 |
| 71. | Northfield | 10.5% | 8.5%(+1.98)#71 | 9.8%(+0.670)#11,934 |
| 72. | Revere | 10.4% | 8.5%(+1.96)#72 | 9.8%(+0.643)#11,977 |
| 73. | Agawam Town | 10.4% | 8.5%(+1.93)#73 | 9.8%(+0.618)#12,031 |
| 74. | Yarmouth Port | 10.3% | 8.5%(+1.88)#74 | 9.8%(+0.563)#12,107 |
| 75. | West Falmouth | 10.2% | 8.5%(+1.75)#75 | 9.8%(+0.434)#12,334 |
| 76. | Lynn | 10.2% | 8.5%(+1.74)#76 | 9.8%(+0.431)#12,340 |
| 77. | Walpole | 10.2% | 8.5%(+1.72)#77 | 9.8%(+0.403)#12,402 |
| 78. | Kingston | 10.2% | 8.5%(+1.69)#78 | 9.8%(+0.380)#12,426 |
| 79. | Barre | 10.0% | 8.5%(+1.53)#79 | 9.8%(+0.219)#12,679 |
| 80. | Marshfield | 10.0% | 8.5%(+1.51)#80 | 9.8%(+0.202)#12,750 |
| 81. | Hanscom Afb | 10.0% | 8.5%(+1.50)#81 | 9.8%(+0.189)#12,762 |
| 82. | Fall River | 9.9% | 8.5%(+1.44)#82 | 9.8%(+0.133)#12,840 |
| 83. | Duxbury | 9.9% | 8.5%(+1.44)#83 | 9.8%(+0.124)#12,853 |
| 84. | Springfield | 9.9% | 8.5%(+1.41)#84 | 9.8%(+0.101)#12,879 |
| 85. | Hopedale | 9.8% | 8.5%(+1.32)#85 | 9.8%(+0.008)#13,030 |
| 86. | Ocean Bluff Brant Rock | 9.6% | 8.5%(+1.17)#86 | 9.8%(-0.143)#13,254 |
| 87. | Westfield | 9.6% | 8.5%(+1.16)#87 | 9.8%(-0.148)#13,269 |
| 88. | West Concord | 9.6% | 8.5%(+1.15)#88 | 9.8%(-0.164)#13,297 |
| 89. | Buzzards Bay | 9.6% | 8.5%(+1.10)#89 | 9.8%(-0.214)#13,373 |
| 90. | East Sandwich | 9.6% | 8.5%(+1.09)#90 | 9.8%(-0.226)#13,387 |
| 91. | Leominster | 9.5% | 8.5%(+1.06)#91 | 9.8%(-0.257)#13,433 |
| 92. | Baldwinville | 9.5% | 8.5%(+1.000)#92 | 9.8%(-0.313)#13,550 |
| 93. | Dennis Port | 9.5% | 8.5%(+0.988)#93 | 9.8%(-0.325)#13,565 |
| 94. | Longmeadow | 9.4% | 8.5%(+0.973)#94 | 9.8%(-0.339)#13,584 |
| 95. | South Dennis | 9.4% | 8.5%(+0.969)#95 | 9.8%(-0.343)#13,590 |
| 96. | Rockport | 9.4% | 8.5%(+0.892)#96 | 9.8%(-0.420)#13,730 |
| 97. | Stoneham | 9.3% | 8.5%(+0.871)#97 | 9.8%(-0.441)#13,751 |
| 98. | Methuen Town | 9.3% | 8.5%(+0.871)#98 | 9.8%(-0.441)#13,752 |
| 99. | Amesbury Town | 9.3% | 8.5%(+0.812)#99 | 9.8%(-0.500)#13,846 |
| 100. | Sagamore | 9.3% | 8.5%(+0.798)#100 | 9.8%(-0.515)#13,871 |
Common Questions
What are the Top 10 Cities with the Highest Percentage of Population with a Degree in Science and Engineering in Massachusetts?
Top 10 Cities with the Highest Percentage of Population with a Degree in Science and Engineering in Massachusetts are:
#1
52.1%
#2
32.7%
#3
25.5%
#4
23.5%
#5
23.2%
#6
20.2%
#7
20.0%
#8
19.3%
#9
18.8%
#10
18.6%
What city has the Highest Percentage of Population with a Degree in Science and Engineering in Massachusetts?
Warren has the Highest Percentage of Population with a Degree in Science and Engineering in Massachusetts with 52.1%.
What is the Percentage of Population with a Degree in Science and Engineering in the State of Massachusetts?
Percentage of Population with a Degree in Science and Engineering in Massachusetts is 8.5%.
What is the Percentage of Population with a Degree in Science and Engineering in the United States?
Percentage of Population with a Degree in Science and Engineering in the United States is 9.8%.