Cities with the Highest Percentage of Population with a Degree in Science and Engineering in Maine
RELATED REPORTS & OPTIONS
Science and Engineering
Maine
Compare Cities
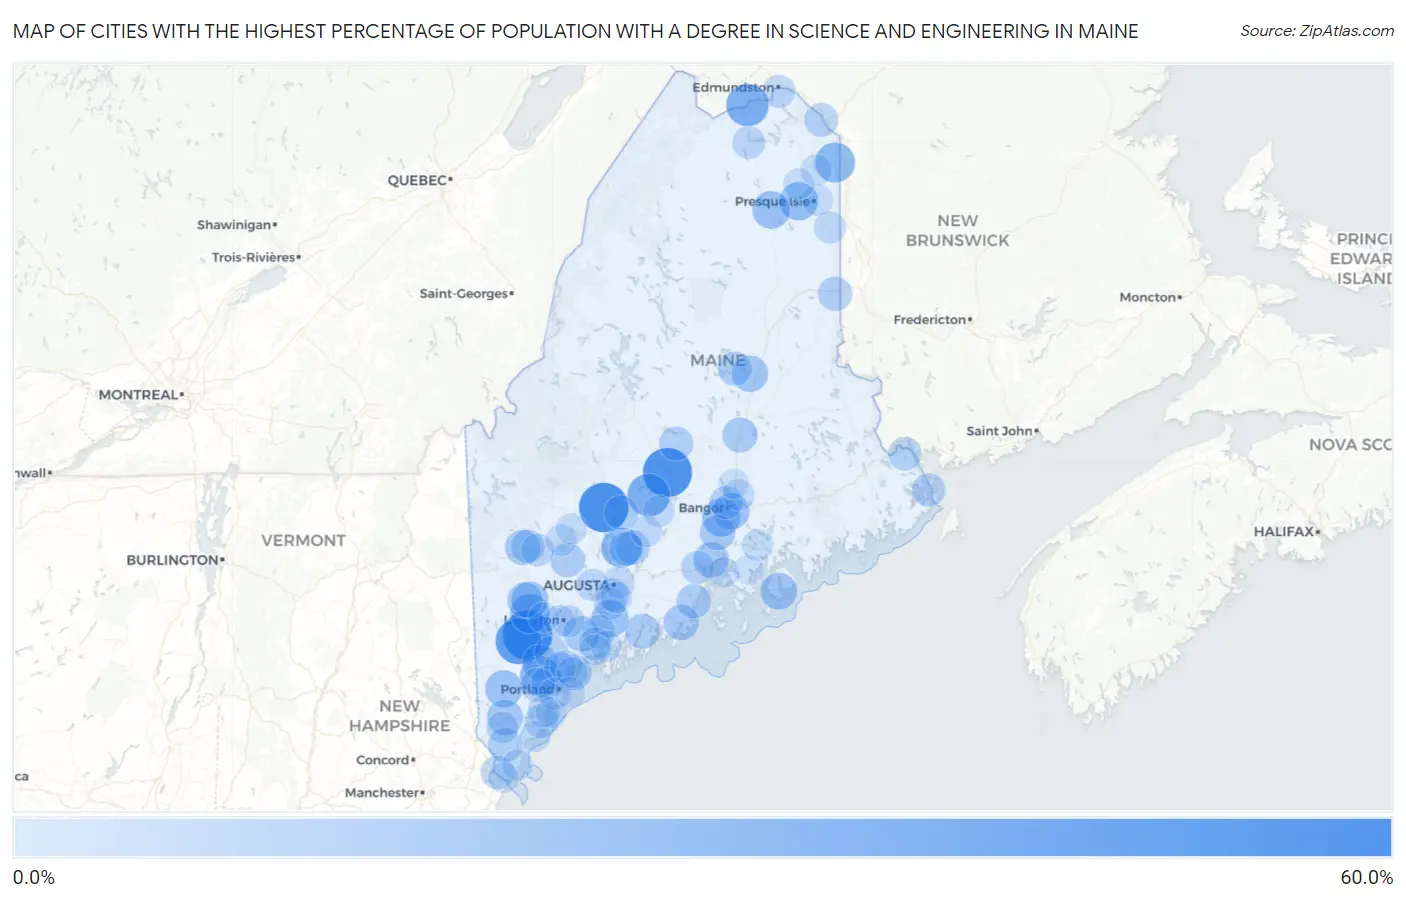
Map of Cities with the Highest Percentage of Population with a Degree in Science and Engineering in Maine
0.0%
60.0%
Cities with the Highest Percentage of Population with a Degree in Science and Engineering in Maine
| City | % Graduates | vs State | vs National | |
| 1. | Madison | 51.2% | 10.9%(+40.2)#1 | 9.8%(+41.4)#532 |
| 2. | Casco | 50.9% | 10.9%(+40.0)#2 | 9.8%(+41.1)#535 |
| 3. | Dexter | 50.2% | 10.9%(+39.2)#3 | 9.8%(+40.4)#541 |
| 4. | Naples | 43.1% | 10.9%(+32.1)#4 | 9.8%(+33.3)#820 |
| 5. | Hartland | 34.6% | 10.9%(+23.7)#5 | 9.8%(+24.8)#1,262 |
| 6. | Fort Kent | 34.2% | 10.9%(+23.3)#6 | 9.8%(+24.4)#1,284 |
| 7. | Bradley | 32.8% | 10.9%(+21.9)#7 | 9.8%(+23.0)#1,429 |
| 8. | South Windham | 28.8% | 10.9%(+17.9)#8 | 9.8%(+19.0)#1,830 |
| 9. | Oakland | 28.5% | 10.9%(+17.6)#9 | 9.8%(+18.8)#1,902 |
| 10. | Limestone | 28.3% | 10.9%(+17.4)#10 | 9.8%(+18.5)#1,926 |
| 11. | Oxford | 26.8% | 10.9%(+15.9)#11 | 9.8%(+17.0)#2,115 |
| 12. | Greene | 25.8% | 10.9%(+14.9)#12 | 9.8%(+16.0)#2,279 |
| 13. | Mapleton | 25.0% | 10.9%(+14.1)#13 | 9.8%(+15.2)#2,392 |
| 14. | Hampden | 24.2% | 10.9%(+13.3)#14 | 9.8%(+14.4)#2,613 |
| 15. | Ashland | 23.0% | 10.9%(+12.1)#15 | 9.8%(+13.2)#2,915 |
| 16. | Richmond | 22.1% | 10.9%(+11.1)#16 | 9.8%(+12.3)#3,163 |
| 17. | Lake Arrowhead | 21.8% | 10.9%(+10.8)#17 | 9.8%(+12.0)#3,240 |
| 18. | South Paris | 21.1% | 10.9%(+10.2)#18 | 9.8%(+11.4)#3,450 |
| 19. | Southwest Harbor | 20.7% | 10.9%(+9.74)#19 | 9.8%(+10.9)#3,596 |
| 20. | Brewer | 20.6% | 10.9%(+9.69)#20 | 9.8%(+10.8)#3,612 |
| 21. | East Millinocket | 20.1% | 10.9%(+9.15)#21 | 9.8%(+10.3)#3,765 |
| 22. | Alfred | 19.2% | 10.9%(+8.31)#22 | 9.8%(+9.45)#4,129 |
| 23. | North Windham | 19.2% | 10.9%(+8.30)#23 | 9.8%(+9.44)#4,149 |
| 24. | Searsport | 18.8% | 10.9%(+7.92)#24 | 9.8%(+9.06)#4,295 |
| 25. | Kezar Falls | 18.6% | 10.9%(+7.72)#25 | 9.8%(+8.86)#4,399 |
| 26. | Winterport | 18.0% | 10.9%(+7.12)#26 | 9.8%(+8.26)#4,690 |
| 27. | Lisbon Falls | 18.0% | 10.9%(+7.09)#27 | 9.8%(+8.23)#4,696 |
| 28. | Littlejohn Island | 18.0% | 10.9%(+7.08)#28 | 9.8%(+8.22)#4,705 |
| 29. | Thomaston | 17.8% | 10.9%(+6.93)#29 | 9.8%(+8.07)#4,774 |
| 30. | Norway | 17.5% | 10.9%(+6.58)#30 | 9.8%(+7.72)#4,950 |
| 31. | Rumford | 17.1% | 10.9%(+6.19)#31 | 9.8%(+7.33)#5,149 |
| 32. | Howland | 16.9% | 10.9%(+5.96)#32 | 9.8%(+7.10)#5,278 |
| 33. | Damariscotta | 16.5% | 10.9%(+5.62)#33 | 9.8%(+6.76)#5,534 |
| 34. | Kingfield | 16.5% | 10.9%(+5.53)#34 | 9.8%(+6.67)#5,583 |
| 35. | Livermore Falls | 16.1% | 10.9%(+5.14)#35 | 9.8%(+6.28)#5,816 |
| 36. | Camden | 15.6% | 10.9%(+4.68)#36 | 9.8%(+5.82)#6,132 |
| 37. | Winslow | 15.6% | 10.9%(+4.65)#37 | 9.8%(+5.79)#6,152 |
| 38. | North Berwick | 15.4% | 10.9%(+4.52)#38 | 9.8%(+5.66)#6,242 |
| 39. | Skowhegan | 15.3% | 10.9%(+4.34)#39 | 9.8%(+5.48)#6,397 |
| 40. | Gorham | 15.2% | 10.9%(+4.24)#40 | 9.8%(+5.38)#6,471 |
| 41. | Millinocket | 15.0% | 10.9%(+4.13)#41 | 9.8%(+5.27)#6,559 |
| 42. | Houlton | 15.0% | 10.9%(+4.07)#42 | 9.8%(+5.21)#6,619 |
| 43. | Dover Foxcroft | 14.9% | 10.9%(+3.94)#43 | 9.8%(+5.08)#6,712 |
| 44. | Waterville | 14.9% | 10.9%(+3.93)#44 | 9.8%(+5.07)#6,724 |
| 45. | Van Buren | 14.4% | 10.9%(+3.49)#45 | 9.8%(+4.63)#7,056 |
| 46. | Calais | 13.8% | 10.9%(+2.91)#46 | 9.8%(+4.05)#7,592 |
| 47. | Mexico | 13.7% | 10.9%(+2.81)#47 | 9.8%(+3.95)#7,696 |
| 48. | Biddeford | 13.6% | 10.9%(+2.67)#48 | 9.8%(+3.81)#7,819 |
| 49. | South Eliot | 13.2% | 10.9%(+2.31)#49 | 9.8%(+3.45)#8,198 |
| 50. | Oak Hill | 13.2% | 10.9%(+2.28)#50 | 9.8%(+3.42)#8,228 |
| 51. | Eastport | 13.2% | 10.9%(+2.26)#51 | 9.8%(+3.40)#8,256 |
| 52. | Gray | 13.1% | 10.9%(+2.18)#52 | 9.8%(+3.32)#8,336 |
| 53. | Bangor | 13.0% | 10.9%(+2.08)#53 | 9.8%(+3.22)#8,469 |
| 54. | Westbrook | 12.7% | 10.9%(+1.81)#54 | 9.8%(+2.95)#8,771 |
| 55. | Belfast | 12.3% | 10.9%(+1.41)#55 | 9.8%(+2.55)#9,231 |
| 56. | Farmingdale | 12.1% | 10.9%(+1.16)#56 | 9.8%(+2.30)#9,551 |
| 57. | Bowdoinham | 12.0% | 10.9%(+1.04)#57 | 9.8%(+2.18)#9,702 |
| 58. | Eagle Lake | 11.8% | 10.9%(+0.921)#58 | 9.8%(+2.06)#9,876 |
| 59. | Madawaska | 11.7% | 10.9%(+0.820)#59 | 9.8%(+1.96)#10,004 |
| 60. | Dixfield | 11.5% | 10.9%(+0.617)#60 | 9.8%(+1.76)#10,267 |
| 61. | Topsham | 11.5% | 10.9%(+0.562)#61 | 9.8%(+1.70)#10,356 |
| 62. | Winthrop | 10.9% | 10.9%(-0.057)#62 | 9.8%(+1.08)#11,291 |
| 63. | Patten | 10.6% | 10.9%(-0.333)#63 | 9.8%(+0.807)#11,732 |
| 64. | Yarmouth | 10.3% | 10.9%(-0.631)#64 | 9.8%(+0.509)#12,215 |
| 65. | Sanford | 10.3% | 10.9%(-0.633)#65 | 9.8%(+0.507)#12,219 |
| 66. | South Portland | 10.2% | 10.9%(-0.687)#66 | 9.8%(+0.453)#12,309 |
| 67. | Saco | 10.2% | 10.9%(-0.717)#67 | 9.8%(+0.424)#12,350 |
| 68. | Mars Hill | 10.2% | 10.9%(-0.717)#68 | 9.8%(+0.423)#12,353 |
| 69. | Lewiston | 10.2% | 10.9%(-0.728)#69 | 9.8%(+0.412)#12,385 |
| 70. | Auburn | 10.0% | 10.9%(-0.938)#70 | 9.8%(+0.202)#12,752 |
| 71. | Gardiner | 9.9% | 10.9%(-0.978)#71 | 9.8%(+0.162)#12,800 |
| 72. | Augusta | 9.7% | 10.9%(-1.26)#72 | 9.8%(-0.117)#13,216 |
| 73. | Pittsfield | 9.6% | 10.9%(-1.33)#73 | 9.8%(-0.185)#13,327 |
| 74. | South Berwick | 9.6% | 10.9%(-1.34)#74 | 9.8%(-0.200)#13,349 |
| 75. | Randolph | 9.4% | 10.9%(-1.48)#75 | 9.8%(-0.339)#13,586 |
| 76. | Clinton | 9.3% | 10.9%(-1.62)#76 | 9.8%(-0.479)#13,801 |
| 77. | Island Falls | 9.3% | 10.9%(-1.66)#77 | 9.8%(-0.522)#13,884 |
| 78. | Ellsworth | 9.1% | 10.9%(-1.78)#78 | 9.8%(-0.641)#14,069 |
| 79. | Cumberland Center | 9.1% | 10.9%(-1.79)#79 | 9.8%(-0.649)#14,075 |
| 80. | Wilton | 9.1% | 10.9%(-1.86)#80 | 9.8%(-0.723)#14,266 |
| 81. | Orono | 9.0% | 10.9%(-1.88)#81 | 9.8%(-0.742)#14,286 |
| 82. | Presque Isle | 8.9% | 10.9%(-2.02)#82 | 9.8%(-0.881)#14,524 |
| 83. | Caribou | 8.8% | 10.9%(-2.16)#83 | 9.8%(-1.02)#14,726 |
| 84. | Veazie | 8.6% | 10.9%(-2.32)#84 | 9.8%(-1.18)#14,987 |
| 85. | Farmington | 8.3% | 10.9%(-2.66)#85 | 9.8%(-1.52)#15,568 |
| 86. | Bath | 8.2% | 10.9%(-2.69)#86 | 9.8%(-1.55)#15,606 |
| 87. | Kennebunkport | 8.1% | 10.9%(-2.81)#87 | 9.8%(-1.67)#15,785 |
| 88. | Lisbon | 8.1% | 10.9%(-2.84)#88 | 9.8%(-1.70)#15,829 |
| 89. | Washburn | 8.0% | 10.9%(-2.95)#89 | 9.8%(-1.81)#16,001 |
| 90. | Cape Neddick | 7.9% | 10.9%(-3.00)#90 | 9.8%(-1.86)#16,082 |
| 91. | Dunstan | 7.8% | 10.9%(-3.08)#91 | 9.8%(-1.94)#16,199 |
| 92. | Old Orchard Beach | 7.7% | 10.9%(-3.20)#92 | 9.8%(-2.06)#16,376 |
| 93. | Brunswick | 7.7% | 10.9%(-3.24)#93 | 9.8%(-2.10)#16,490 |
| 94. | Portland | 7.3% | 10.9%(-3.60)#94 | 9.8%(-2.46)#16,994 |
| 95. | Kittery | 7.1% | 10.9%(-3.80)#95 | 9.8%(-2.66)#17,361 |
| 96. | Cousins Island | 7.1% | 10.9%(-3.87)#96 | 9.8%(-2.73)#17,463 |
| 97. | Mechanic Falls | 6.7% | 10.9%(-4.20)#97 | 9.8%(-3.05)#17,914 |
| 98. | Old Town | 6.3% | 10.9%(-4.67)#98 | 9.8%(-3.53)#18,613 |
| 99. | Castine | 6.2% | 10.9%(-4.73)#99 | 9.8%(-3.59)#18,728 |
| 100. | Blue Hill | 5.7% | 10.9%(-5.18)#100 | 9.8%(-4.04)#19,370 |
1
2Common Questions
What are the Top 10 Cities with the Highest Percentage of Population with a Degree in Science and Engineering in Maine?
Top 10 Cities with the Highest Percentage of Population with a Degree in Science and Engineering in Maine are:
What city has the Highest Percentage of Population with a Degree in Science and Engineering in Maine?
Madison has the Highest Percentage of Population with a Degree in Science and Engineering in Maine with 51.2%.
What is the Percentage of Population with a Degree in Science and Engineering in the State of Maine?
Percentage of Population with a Degree in Science and Engineering in Maine is 10.9%.
What is the Percentage of Population with a Degree in Science and Engineering in the United States?
Percentage of Population with a Degree in Science and Engineering in the United States is 9.8%.