Cities with the Highest Percentage of Population with a Degree in Science and Engineering in Ohio
RELATED REPORTS & OPTIONS
Science and Engineering
Ohio
Compare Cities
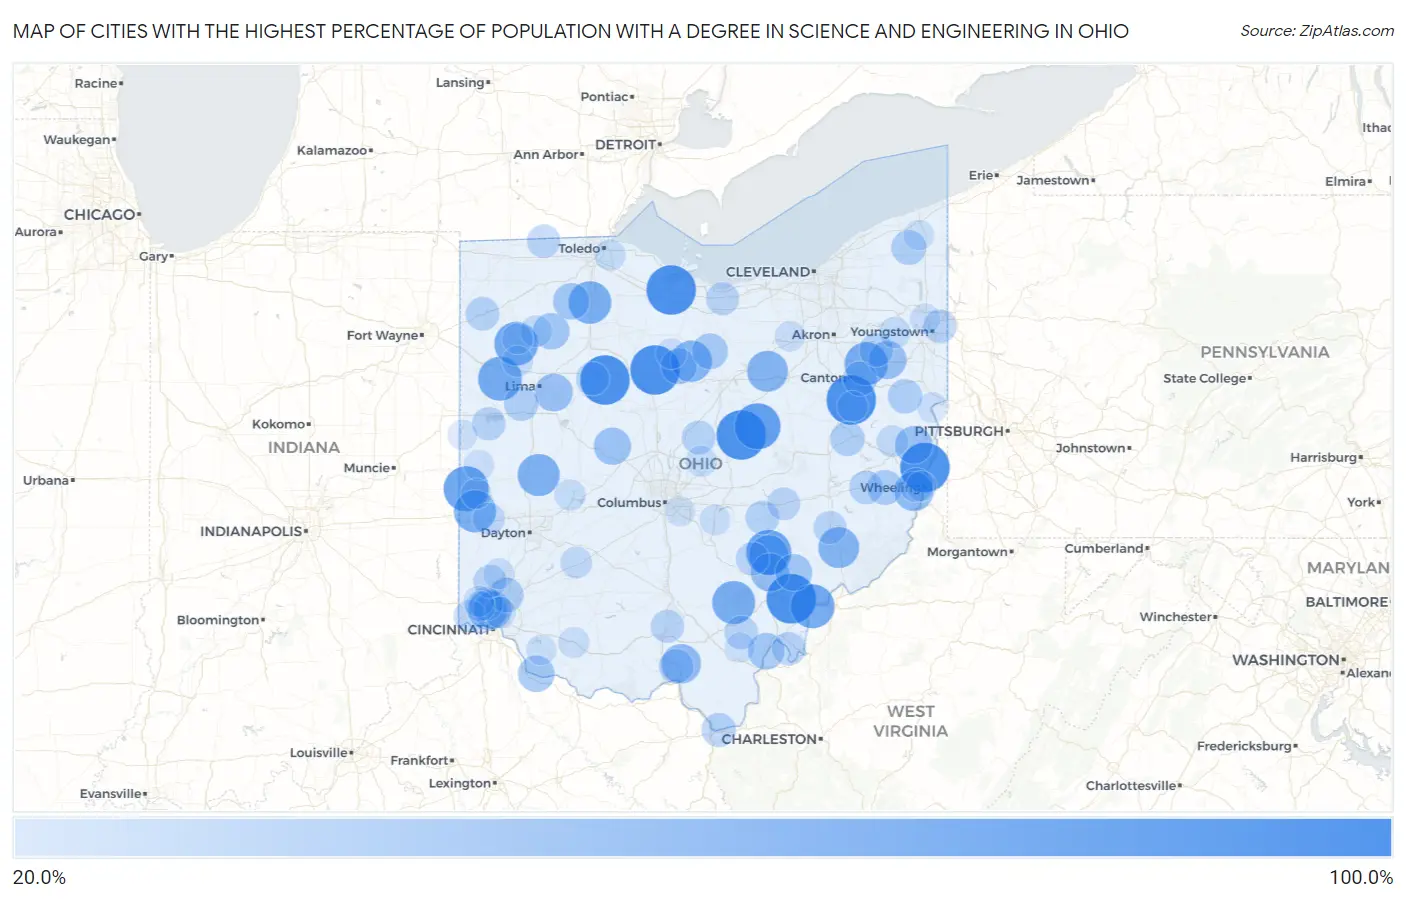
Map of Cities with the Highest Percentage of Population with a Degree in Science and Engineering in Ohio
0.0%
100.0%
Cities with the Highest Percentage of Population with a Degree in Science and Engineering in Ohio
| City | % Graduates | vs State | vs National | |
| 1. | Howard | 100.0% | 11.8%(+88.2)#1 | 9.8%(+90.2)#37 |
| 2. | Stewart | 100.0% | 11.8%(+88.2)#2 | 9.8%(+90.2)#54 |
| 3. | Vickery | 100.0% | 11.8%(+88.2)#3 | 9.8%(+90.2)#74 |
| 4. | Oceola | 100.0% | 11.8%(+88.2)#4 | 9.8%(+90.2)#75 |
| 5. | Patterson | 100.0% | 11.8%(+88.2)#5 | 9.8%(+90.2)#95 |
| 6. | Connorville | 100.0% | 11.8%(+88.2)#6 | 9.8%(+90.2)#131 |
| 7. | Sandyville | 100.0% | 11.8%(+88.2)#7 | 9.8%(+90.2)#183 |
| 8. | Gann Brinkhaven | 86.5% | 11.8%(+74.7)#8 | 9.8%(+76.7)#226 |
| 9. | Palestine | 83.3% | 11.8%(+71.5)#9 | 9.8%(+73.6)#233 |
| 10. | Rendville | 83.3% | 11.8%(+71.5)#10 | 9.8%(+73.6)#234 |
| 11. | Little Hocking | 78.9% | 11.8%(+67.1)#11 | 9.8%(+69.2)#250 |
| 12. | Venedocia | 77.8% | 11.8%(+66.0)#12 | 9.8%(+68.0)#255 |
| 13. | Cloverdale | 77.8% | 11.8%(+66.0)#13 | 9.8%(+68.0)#256 |
| 14. | Ai | 76.7% | 11.8%(+64.9)#14 | 9.8%(+66.9)#261 |
| 15. | Harrisburg | 75.8% | 11.8%(+64.0)#15 | 9.8%(+66.0)#263 |
| 16. | Zaleski | 75.0% | 11.8%(+63.2)#16 | 9.8%(+65.2)#266 |
| 17. | Rudolph | 73.7% | 11.8%(+61.9)#17 | 9.8%(+63.9)#286 |
| 18. | Eldorado | 72.0% | 11.8%(+60.1)#18 | 9.8%(+62.2)#291 |
| 19. | Fletcher | 71.4% | 11.8%(+59.6)#19 | 9.8%(+61.6)#292 |
| 20. | Tiro | 68.2% | 11.8%(+56.4)#20 | 9.8%(+58.4)#314 |
| 21. | New Pittsburg | 66.7% | 11.8%(+54.9)#21 | 9.8%(+56.9)#325 |
| 22. | Dexter City | 66.7% | 11.8%(+54.9)#22 | 9.8%(+56.9)#336 |
| 23. | Corning | 62.5% | 11.8%(+50.7)#23 | 9.8%(+52.7)#370 |
| 24. | Neffs | 61.4% | 11.8%(+49.5)#24 | 9.8%(+51.6)#387 |
| 25. | Minford | 61.0% | 11.8%(+49.2)#25 | 9.8%(+51.2)#392 |
| 26. | Skyline Acres | 60.5% | 11.8%(+48.7)#26 | 9.8%(+50.7)#397 |
| 27. | Trimble | 57.1% | 11.8%(+45.3)#27 | 9.8%(+47.4)#442 |
| 28. | Maple Ridge | 56.2% | 11.8%(+44.4)#28 | 9.8%(+46.5)#454 |
| 29. | Westminster | 56.0% | 11.8%(+44.2)#29 | 9.8%(+46.2)#462 |
| 30. | Pleasant Hills | 54.7% | 11.8%(+42.8)#30 | 9.8%(+44.9)#483 |
| 31. | Bloomingdale | 54.5% | 11.8%(+42.7)#31 | 9.8%(+44.8)#488 |
| 32. | Raymond | 53.3% | 11.8%(+41.5)#32 | 9.8%(+43.6)#502 |
| 33. | Chesterhill | 51.6% | 11.8%(+39.8)#33 | 9.8%(+41.8)#525 |
| 34. | West Leipsic | 50.0% | 11.8%(+38.2)#34 | 9.8%(+40.2)#567 |
| 35. | Milton Center | 50.0% | 11.8%(+38.2)#35 | 9.8%(+40.2)#579 |
| 36. | Cheshire | 50.0% | 11.8%(+38.2)#36 | 9.8%(+40.2)#595 |
| 37. | Chilo | 50.0% | 11.8%(+38.2)#37 | 9.8%(+40.2)#634 |
| 38. | Sulphur Springs | 48.0% | 11.8%(+36.2)#38 | 9.8%(+38.2)#677 |
| 39. | Shiloh | 47.9% | 11.8%(+36.1)#39 | 9.8%(+38.1)#678 |
| 40. | Sharon Center | 45.4% | 11.8%(+33.6)#40 | 9.8%(+35.6)#735 |
| 41. | Morristown | 45.2% | 11.8%(+33.3)#41 | 9.8%(+35.4)#741 |
| 42. | Rock Creek | 44.4% | 11.8%(+32.6)#42 | 9.8%(+34.7)#758 |
| 43. | Olde West Chester | 43.8% | 11.8%(+31.9)#43 | 9.8%(+34.0)#792 |
| 44. | Buckland | 42.9% | 11.8%(+31.0)#44 | 9.8%(+33.1)#833 |
| 45. | Summitville | 42.9% | 11.8%(+31.0)#45 | 9.8%(+33.1)#834 |
| 46. | Clarktown | 42.8% | 11.8%(+31.0)#46 | 9.8%(+33.0)#847 |
| 47. | Tuscarawas | 42.5% | 11.8%(+30.7)#47 | 9.8%(+32.8)#853 |
| 48. | East Canton | 42.4% | 11.8%(+30.5)#48 | 9.8%(+32.6)#859 |
| 49. | Burlington | 41.5% | 11.8%(+29.7)#49 | 9.8%(+31.8)#894 |
| 50. | Lansing | 41.5% | 11.8%(+29.7)#50 | 9.8%(+31.7)#897 |
| 51. | Massieville | 41.2% | 11.8%(+29.4)#51 | 9.8%(+31.5)#904 |
| 52. | Sparta | 40.0% | 11.8%(+28.2)#52 | 9.8%(+30.2)#965 |
| 53. | Limaville | 40.0% | 11.8%(+28.2)#53 | 9.8%(+30.2)#966 |
| 54. | Fultonham | 40.0% | 11.8%(+28.2)#54 | 9.8%(+30.2)#968 |
| 55. | Cecil | 40.0% | 11.8%(+28.2)#55 | 9.8%(+30.2)#969 |
| 56. | Fairview | 40.0% | 11.8%(+28.2)#56 | 9.8%(+30.2)#979 |
| 57. | Racine | 39.8% | 11.8%(+28.0)#57 | 9.8%(+30.0)#983 |
| 58. | Mount Healthy Heights | 39.4% | 11.8%(+27.5)#58 | 9.8%(+29.6)#993 |
| 59. | Maplewood Park | 39.3% | 11.8%(+27.5)#59 | 9.8%(+29.5)#995 |
| 60. | Wilkesville | 39.0% | 11.8%(+27.2)#60 | 9.8%(+29.2)#1,011 |
| 61. | Montezuma | 38.9% | 11.8%(+27.1)#61 | 9.8%(+29.1)#1,023 |
| 62. | Lyons | 38.4% | 11.8%(+26.5)#62 | 9.8%(+28.6)#1,055 |
| 63. | Dunkirk | 38.3% | 11.8%(+26.5)#63 | 9.8%(+28.5)#1,059 |
| 64. | New Straitsville | 38.2% | 11.8%(+26.4)#64 | 9.8%(+28.5)#1,061 |
| 65. | Waverly | 38.0% | 11.8%(+26.2)#65 | 9.8%(+28.2)#1,070 |
| 66. | New Miami | 37.5% | 11.8%(+25.7)#66 | 9.8%(+27.7)#1,082 |
| 67. | Berlin Heights | 37.5% | 11.8%(+25.7)#67 | 9.8%(+27.7)#1,085 |
| 68. | Belle Valley | 37.5% | 11.8%(+25.7)#68 | 9.8%(+27.7)#1,102 |
| 69. | Pleasant Grove | 37.2% | 11.8%(+25.3)#69 | 9.8%(+27.4)#1,120 |
| 70. | Grandview | 35.3% | 11.8%(+23.4)#70 | 9.8%(+25.5)#1,224 |
| 71. | Lewisburg | 34.3% | 11.8%(+22.5)#71 | 9.8%(+24.5)#1,273 |
| 72. | Jewett | 33.3% | 11.8%(+21.5)#72 | 9.8%(+23.6)#1,321 |
| 73. | Port William | 33.3% | 11.8%(+21.5)#73 | 9.8%(+23.6)#1,339 |
| 74. | Miller City | 33.3% | 11.8%(+21.5)#74 | 9.8%(+23.6)#1,373 |
| 75. | Arlington Heights | 31.5% | 11.8%(+19.7)#75 | 9.8%(+21.7)#1,524 |
| 76. | Lake Milton | 31.5% | 11.8%(+19.6)#76 | 9.8%(+21.7)#1,529 |
| 77. | Tremont City | 31.2% | 11.8%(+19.4)#77 | 9.8%(+21.5)#1,546 |
| 78. | Hartford Croton | 31.0% | 11.8%(+19.2)#78 | 9.8%(+21.3)#1,571 |
| 79. | Northwood | 30.8% | 11.8%(+19.0)#79 | 9.8%(+21.0)#1,589 |
| 80. | Fort Jennings | 30.4% | 11.8%(+18.5)#80 | 9.8%(+20.6)#1,634 |
| 81. | Sardinia | 30.0% | 11.8%(+18.2)#81 | 9.8%(+20.2)#1,659 |
| 82. | Thurston | 30.0% | 11.8%(+18.2)#82 | 9.8%(+20.2)#1,664 |
| 83. | Dunlap | 29.7% | 11.8%(+17.9)#83 | 9.8%(+19.9)#1,716 |
| 84. | Suffield | 29.7% | 11.8%(+17.9)#84 | 9.8%(+19.9)#1,717 |
| 85. | Trenton | 29.7% | 11.8%(+17.9)#85 | 9.8%(+19.9)#1,723 |
| 86. | Dupont | 29.0% | 11.8%(+17.2)#86 | 9.8%(+19.3)#1,809 |
| 87. | Mineral City | 28.9% | 11.8%(+17.1)#87 | 9.8%(+19.1)#1,828 |
| 88. | Ansonia | 28.8% | 11.8%(+17.0)#88 | 9.8%(+19.0)#1,831 |
| 89. | Chatfield | 28.6% | 11.8%(+16.8)#89 | 9.8%(+18.8)#1,869 |
| 90. | Wellsville | 28.5% | 11.8%(+16.7)#90 | 9.8%(+18.7)#1,905 |
| 91. | Chippewa Lake | 28.5% | 11.8%(+16.6)#91 | 9.8%(+18.7)#1,909 |
| 92. | Mckinley Heights | 28.4% | 11.8%(+16.5)#92 | 9.8%(+18.6)#1,917 |
| 93. | Wayne Lakes | 28.0% | 11.8%(+16.2)#93 | 9.8%(+18.3)#1,952 |
| 94. | Bethel | 27.9% | 11.8%(+16.1)#94 | 9.8%(+18.1)#1,962 |
| 95. | Dry Ridge | 27.9% | 11.8%(+16.1)#95 | 9.8%(+18.1)#1,963 |
| 96. | Jefferson | 27.8% | 11.8%(+16.0)#96 | 9.8%(+18.0)#1,977 |
| 97. | Bridgeport | 27.5% | 11.8%(+15.7)#97 | 9.8%(+17.8)#2,011 |
| 98. | Blacklick Estates | 27.4% | 11.8%(+15.6)#98 | 9.8%(+17.7)#2,023 |
| 99. | Vinton | 27.3% | 11.8%(+15.5)#99 | 9.8%(+17.5)#2,057 |
| 100. | Fort Recovery | 27.1% | 11.8%(+15.3)#100 | 9.8%(+17.3)#2,084 |
Common Questions
What are the Top 10 Cities with the Highest Percentage of Population with a Degree in Science and Engineering in Ohio?
Top 10 Cities with the Highest Percentage of Population with a Degree in Science and Engineering in Ohio are:
#1
100.0%
#2
100.0%
#3
100.0%
#4
100.0%
#5
100.0%
#6
100.0%
#7
100.0%
#8
86.5%
#9
83.3%
#10
83.3%
What city has the Highest Percentage of Population with a Degree in Science and Engineering in Ohio?
Howard has the Highest Percentage of Population with a Degree in Science and Engineering in Ohio with 100.0%.
What is the Percentage of Population with a Degree in Science and Engineering in the State of Ohio?
Percentage of Population with a Degree in Science and Engineering in Ohio is 11.8%.
What is the Percentage of Population with a Degree in Science and Engineering in the United States?
Percentage of Population with a Degree in Science and Engineering in the United States is 9.8%.