Cities with the Highest Percentage of Population with a Degree in Science and Engineering in North Dakota
RELATED REPORTS & OPTIONS
Science and Engineering
North Dakota
Compare Cities
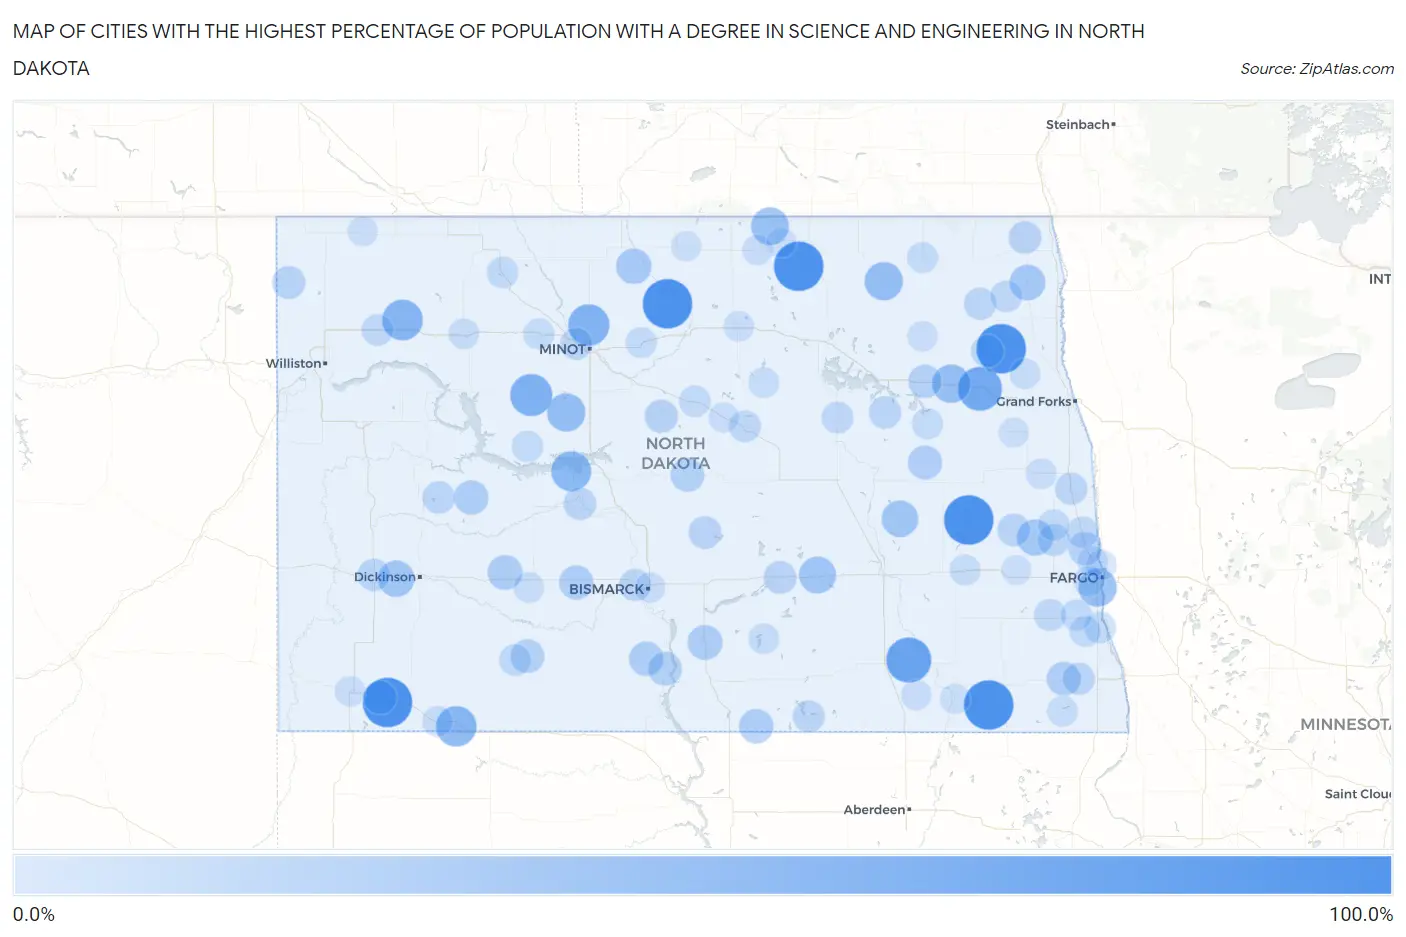
Map of Cities with the Highest Percentage of Population with a Degree in Science and Engineering in North Dakota
0.0%
100.0%
Cities with the Highest Percentage of Population with a Degree in Science and Engineering in North Dakota
| City | % Graduates | vs State | vs National | |
| 1. | Cogswell | 100.0% | 15.0%(+85.0)#1 | 9.8%(+90.2)#126 |
| 2. | Blacktail | 100.0% | 15.0%(+85.0)#2 | 9.8%(+90.2)#127 |
| 3. | Gascoyne | 100.0% | 15.0%(+85.0)#3 | 9.8%(+90.2)#195 |
| 4. | Sibley | 100.0% | 15.0%(+85.0)#4 | 9.8%(+90.2)#202 |
| 5. | Perth | 100.0% | 15.0%(+85.0)#5 | 9.8%(+90.2)#203 |
| 6. | Conway | 100.0% | 15.0%(+85.0)#6 | 9.8%(+90.2)#208 |
| 7. | Bantry | 100.0% | 15.0%(+85.0)#7 | 9.8%(+90.2)#211 |
| 8. | Berlin | 80.0% | 15.0%(+65.0)#8 | 9.8%(+70.2)#246 |
| 9. | Niagara | 75.0% | 15.0%(+60.0)#9 | 9.8%(+65.2)#279 |
| 10. | Makoti | 66.7% | 15.0%(+51.7)#10 | 9.8%(+56.9)#341 |
| 11. | Ruthville | 63.6% | 15.0%(+48.7)#11 | 9.8%(+53.9)#360 |
| 12. | Tioga | 60.6% | 15.0%(+45.6)#12 | 9.8%(+50.8)#395 |
| 13. | Haynes | 60.0% | 15.0%(+45.0)#13 | 9.8%(+50.2)#418 |
| 14. | Pick City | 57.1% | 15.0%(+42.2)#14 | 9.8%(+47.4)#445 |
| 15. | Michigan City | 50.6% | 15.0%(+35.6)#15 | 9.8%(+40.8)#539 |
| 16. | Douglas | 50.0% | 15.0%(+35.0)#16 | 9.8%(+40.2)#604 |
| 17. | Prairie Rose | 50.0% | 15.0%(+35.0)#17 | 9.8%(+40.2)#626 |
| 18. | Alsen | 50.0% | 15.0%(+35.0)#18 | 9.8%(+40.2)#631 |
| 19. | St John | 48.0% | 15.0%(+33.0)#19 | 9.8%(+38.2)#676 |
| 20. | Medina | 44.1% | 15.0%(+29.1)#20 | 9.8%(+34.3)#778 |
| 21. | Courtenay | 42.1% | 15.0%(+27.1)#21 | 9.8%(+32.3)#869 |
| 22. | South Heart | 41.7% | 15.0%(+26.7)#22 | 9.8%(+31.9)#882 |
| 23. | Erie | 41.2% | 15.0%(+26.2)#23 | 9.8%(+31.4)#908 |
| 24. | St Thomas | 38.7% | 15.0%(+23.7)#24 | 9.8%(+28.9)#1,033 |
| 25. | Newburg | 37.5% | 15.0%(+22.5)#25 | 9.8%(+27.7)#1,112 |
| 26. | Hebron | 35.4% | 15.0%(+20.4)#26 | 9.8%(+25.6)#1,209 |
| 27. | Hazelton | 35.3% | 15.0%(+20.3)#27 | 9.8%(+25.5)#1,217 |
| 28. | Halliday | 33.3% | 15.0%(+18.3)#28 | 9.8%(+23.6)#1,335 |
| 29. | Zeeland | 33.3% | 15.0%(+18.3)#29 | 9.8%(+23.6)#1,391 |
| 30. | Solen | 33.3% | 15.0%(+18.3)#30 | 9.8%(+23.6)#1,396 |
| 31. | New Salem | 32.8% | 15.0%(+17.8)#31 | 9.8%(+23.0)#1,431 |
| 32. | Binford | 32.1% | 15.0%(+17.2)#32 | 9.8%(+22.4)#1,474 |
| 33. | Wyndmere | 31.8% | 15.0%(+16.8)#33 | 9.8%(+22.0)#1,497 |
| 34. | Cannon Ball | 30.9% | 15.0%(+15.9)#34 | 9.8%(+21.1)#1,580 |
| 35. | Elgin | 30.6% | 15.0%(+15.6)#35 | 9.8%(+20.8)#1,619 |
| 36. | Mcclusky | 30.2% | 15.0%(+15.2)#36 | 9.8%(+20.5)#1,647 |
| 37. | Scranton | 29.3% | 15.0%(+14.3)#37 | 9.8%(+19.5)#1,770 |
| 38. | Lakota | 29.2% | 15.0%(+14.2)#38 | 9.8%(+19.4)#1,782 |
| 39. | Argusville | 28.7% | 15.0%(+13.7)#39 | 9.8%(+18.9)#1,840 |
| 40. | Butte | 28.6% | 15.0%(+13.6)#40 | 9.8%(+18.8)#1,893 |
| 41. | Grenora | 27.7% | 15.0%(+12.7)#41 | 9.8%(+17.9)#1,999 |
| 42. | Tappen | 26.7% | 15.0%(+11.7)#42 | 9.8%(+16.9)#2,135 |
| 43. | Bathgate | 26.7% | 15.0%(+11.7)#43 | 9.8%(+16.9)#2,146 |
| 44. | Wing | 26.3% | 15.0%(+11.3)#44 | 9.8%(+16.5)#2,190 |
| 45. | Page | 26.3% | 15.0%(+11.3)#45 | 9.8%(+16.5)#2,194 |
| 46. | Stanton | 25.7% | 15.0%(+10.7)#46 | 9.8%(+15.9)#2,289 |
| 47. | Fordville | 25.7% | 15.0%(+10.7)#47 | 9.8%(+15.9)#2,290 |
| 48. | Belfield | 25.0% | 15.0%(+10.0)#48 | 9.8%(+15.2)#2,390 |
| 49. | Dunn Center | 25.0% | 15.0%(+10.0)#49 | 9.8%(+15.2)#2,401 |
| 50. | Warwick | 25.0% | 15.0%(+10.0)#50 | 9.8%(+15.2)#2,472 |
| 51. | Barney | 25.0% | 15.0%(+10.0)#51 | 9.8%(+15.2)#2,491 |
| 52. | Edinburg | 24.5% | 15.0%(+9.50)#52 | 9.8%(+14.7)#2,560 |
| 53. | Hillsboro | 24.1% | 15.0%(+9.14)#53 | 9.8%(+14.3)#2,626 |
| 54. | Arthur | 23.8% | 15.0%(+8.82)#54 | 9.8%(+14.0)#2,691 |
| 55. | Mandan | 23.6% | 15.0%(+8.59)#55 | 9.8%(+13.8)#2,738 |
| 56. | Burlington | 23.4% | 15.0%(+8.40)#56 | 9.8%(+13.6)#2,792 |
| 57. | Ashley | 23.2% | 15.0%(+8.25)#57 | 9.8%(+13.5)#2,834 |
| 58. | Gardner | 23.1% | 15.0%(+8.09)#58 | 9.8%(+13.3)#2,896 |
| 59. | Hoople | 22.9% | 15.0%(+7.87)#59 | 9.8%(+13.1)#2,939 |
| 60. | Leonard | 22.8% | 15.0%(+7.82)#60 | 9.8%(+13.0)#2,945 |
| 61. | Harvey | 22.7% | 15.0%(+7.69)#61 | 9.8%(+12.9)#2,984 |
| 62. | Sheyenne | 22.6% | 15.0%(+7.60)#62 | 9.8%(+12.8)#3,015 |
| 63. | New Leipzig | 22.6% | 15.0%(+7.60)#63 | 9.8%(+12.8)#3,018 |
| 64. | Ray | 21.8% | 15.0%(+6.85)#64 | 9.8%(+12.1)#3,219 |
| 65. | Drake | 21.4% | 15.0%(+6.44)#65 | 9.8%(+11.6)#3,355 |
| 66. | Kenmare | 21.4% | 15.0%(+6.40)#66 | 9.8%(+11.6)#3,378 |
| 67. | Christine | 21.2% | 15.0%(+6.23)#67 | 9.8%(+11.4)#3,435 |
| 68. | Hunter | 20.6% | 15.0%(+5.60)#68 | 9.8%(+10.8)#3,625 |
| 69. | White Shield | 20.5% | 15.0%(+5.53)#69 | 9.8%(+10.7)#3,648 |
| 70. | Kindred | 20.2% | 15.0%(+5.24)#70 | 9.8%(+10.4)#3,727 |
| 71. | Walcott | 20.0% | 15.0%(+5.01)#71 | 9.8%(+10.2)#3,833 |
| 72. | Pekin | 20.0% | 15.0%(+5.01)#72 | 9.8%(+10.2)#3,896 |
| 73. | Granville | 19.2% | 15.0%(+4.25)#73 | 9.8%(+9.45)#4,138 |
| 74. | Langdon | 18.9% | 15.0%(+3.95)#74 | 9.8%(+9.15)#4,248 |
| 75. | Berthold | 18.9% | 15.0%(+3.93)#75 | 9.8%(+9.14)#4,259 |
| 76. | Valley City | 18.8% | 15.0%(+3.76)#76 | 9.8%(+8.97)#4,328 |
| 77. | Napoleon | 18.5% | 15.0%(+3.56)#77 | 9.8%(+8.77)#4,440 |
| 78. | Esmond | 18.2% | 15.0%(+3.20)#78 | 9.8%(+8.40)#4,638 |
| 79. | North River | 18.2% | 15.0%(+3.20)#79 | 9.8%(+8.40)#4,643 |
| 80. | Hettinger | 18.1% | 15.0%(+3.09)#80 | 9.8%(+8.30)#4,676 |
| 81. | Glen Ullin | 17.9% | 15.0%(+2.93)#81 | 9.8%(+8.13)#4,744 |
| 82. | Lidgerwood | 17.9% | 15.0%(+2.93)#82 | 9.8%(+8.13)#4,745 |
| 83. | Gilby | 17.8% | 15.0%(+2.79)#83 | 9.8%(+8.00)#4,801 |
| 84. | Stanley | 17.7% | 15.0%(+2.69)#84 | 9.8%(+7.90)#4,846 |
| 85. | West Fargo | 17.4% | 15.0%(+2.45)#85 | 9.8%(+7.65)#4,982 |
| 86. | Mayville | 17.4% | 15.0%(+2.38)#86 | 9.8%(+7.59)#5,024 |
| 87. | Bowman | 17.0% | 15.0%(+2.03)#87 | 9.8%(+7.23)#5,217 |
| 88. | Rugby | 16.7% | 15.0%(+1.76)#88 | 9.8%(+6.97)#5,338 |
| 89. | Fullerton | 16.7% | 15.0%(+1.68)#89 | 9.8%(+6.89)#5,489 |
| 90. | Martin | 16.7% | 15.0%(+1.68)#90 | 9.8%(+6.89)#5,492 |
| 91. | Lawton | 16.7% | 15.0%(+1.68)#91 | 9.8%(+6.89)#5,499 |
| 92. | Bismarck | 16.4% | 15.0%(+1.40)#92 | 9.8%(+6.61)#5,615 |
| 93. | Shell Valley | 16.3% | 15.0%(+1.31)#93 | 9.8%(+6.51)#5,671 |
| 94. | Bottineau | 16.0% | 15.0%(+1.02)#94 | 9.8%(+6.23)#5,841 |
| 95. | Harwood | 16.0% | 15.0%(+0.977)#95 | 9.8%(+6.18)#5,879 |
| 96. | Oakes | 15.9% | 15.0%(+0.865)#96 | 9.8%(+6.07)#5,952 |
| 97. | Northwood | 15.7% | 15.0%(+0.677)#97 | 9.8%(+5.88)#6,094 |
| 98. | Crosby | 15.5% | 15.0%(+0.469)#98 | 9.8%(+5.67)#6,226 |
| 99. | Buffalo | 15.4% | 15.0%(+0.399)#99 | 9.8%(+5.60)#6,315 |
| 100. | Rolla | 15.3% | 15.0%(+0.348)#100 | 9.8%(+5.55)#6,344 |
Common Questions
What are the Top 10 Cities with the Highest Percentage of Population with a Degree in Science and Engineering in North Dakota?
Top 10 Cities with the Highest Percentage of Population with a Degree in Science and Engineering in North Dakota are:
What city has the Highest Percentage of Population with a Degree in Science and Engineering in North Dakota?
Cogswell has the Highest Percentage of Population with a Degree in Science and Engineering in North Dakota with 100.0%.
What is the Percentage of Population with a Degree in Science and Engineering in the State of North Dakota?
Percentage of Population with a Degree in Science and Engineering in North Dakota is 15.0%.
What is the Percentage of Population with a Degree in Science and Engineering in the United States?
Percentage of Population with a Degree in Science and Engineering in the United States is 9.8%.