Rancho Calaveras, CA Map & Demographics
Rancho Calaveras Map
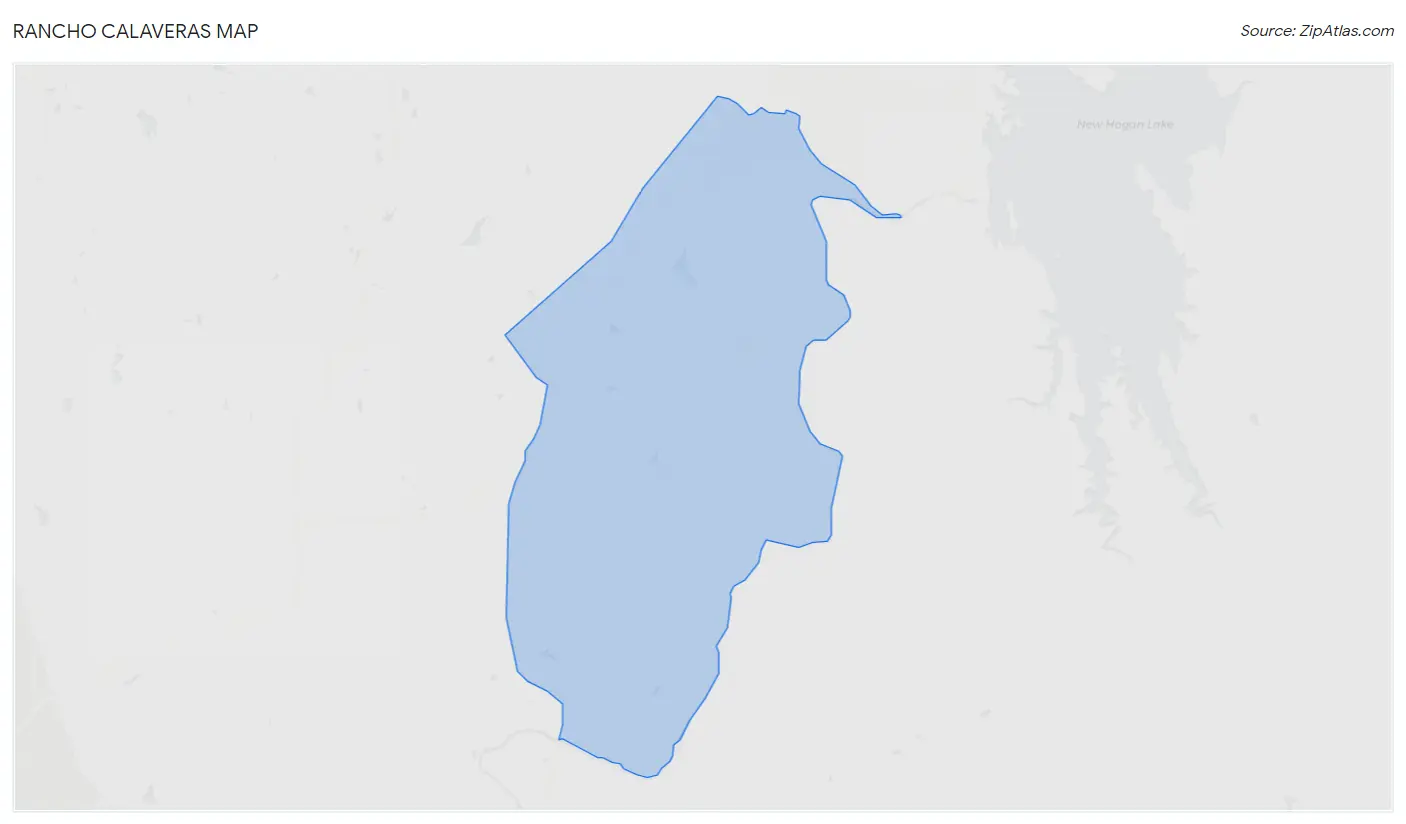
Rancho Calaveras Overview
$36,824
PER CAPITA INCOME
$88,684
AVG FAMILY INCOME
$81,144
AVG HOUSEHOLD INCOME
40.1%
WAGE / INCOME GAP [ % ]
59.9¢/ $1
WAGE / INCOME GAP [ $ ]
0.40
INEQUALITY / GINI INDEX
6,089
TOTAL POPULATION
3,074
MALE POPULATION
3,015
FEMALE POPULATION
101.96
MALES / 100 FEMALES
98.08
FEMALES / 100 MALES
46.0
MEDIAN AGE
3.0
AVG FAMILY SIZE
2.9
AVG HOUSEHOLD SIZE
2,719
LABOR FORCE [ PEOPLE ]
55.6%
PERCENT IN LABOR FORCE
6.5%
UNEMPLOYMENT RATE
Income in Rancho Calaveras
Income Overview in Rancho Calaveras
Per Capita Income in Rancho Calaveras is $36,824, while median incomes of families and households are $88,684 and $81,144 respectively.
| Characteristic | Number | Measure |
| Per Capita Income | 6,089 | $36,824 |
| Median Family Income | 1,646 | $88,684 |
| Mean Family Income | 1,646 | $107,123 |
| Median Household Income | 2,135 | $81,144 |
| Mean Household Income | 2,135 | $108,342 |
| Income Deficit | 1,646 | $0 |
| Wage / Income Gap (%) | 6,089 | 40.15% |
| Wage / Income Gap ($) | 6,089 | 59.85¢ per $1 |
| Gini / Inequality Index | 6,089 | 0.40 |
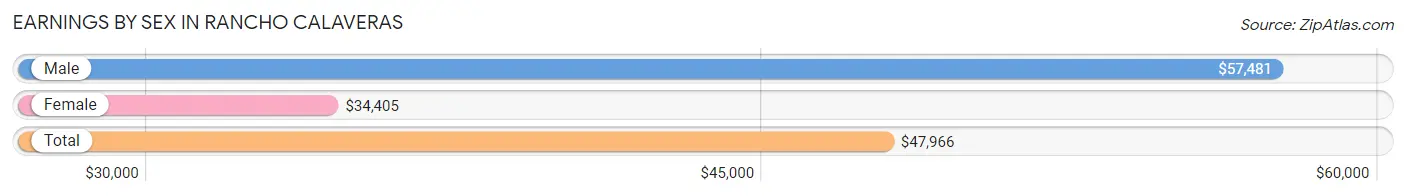
Earnings by Sex in Rancho Calaveras
Average Earnings in Rancho Calaveras are $47,966, $57,481 for men and $34,405 for women, a difference of 40.2%.
| Sex | Number | Average Earnings |
| Male | 1,422 (52.3%) | $57,481 |
| Female | 1,296 (47.7%) | $34,405 |
| Total | 2,718 (100.0%) | $47,966 |
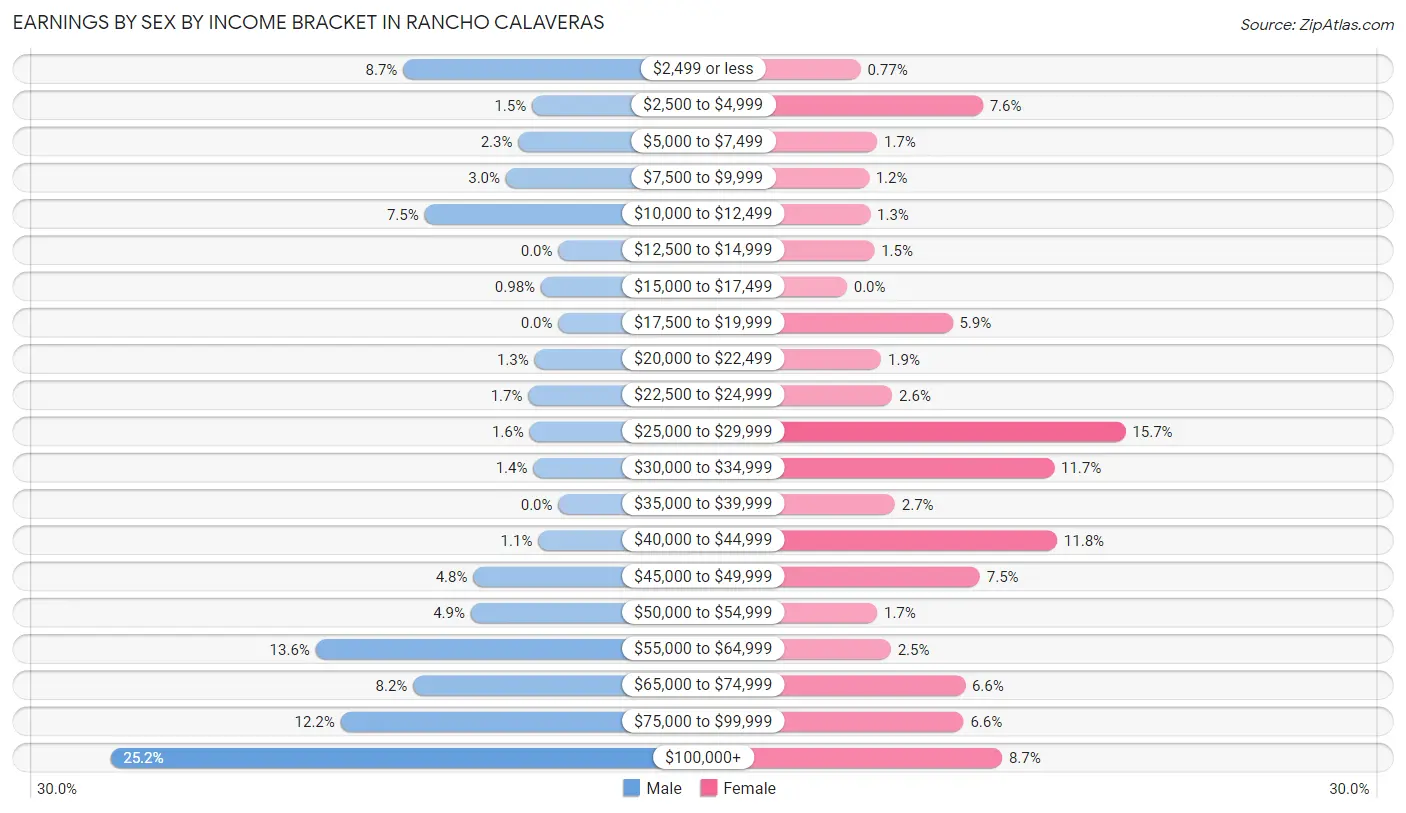
Earnings by Sex by Income Bracket in Rancho Calaveras
The most common earnings brackets in Rancho Calaveras are $100,000+ for men (358 | 25.2%) and $25,000 to $29,999 for women (203 | 15.7%).
| Income | Male | Female |
| $2,499 or less | 124 (8.7%) | 10 (0.8%) |
| $2,500 to $4,999 | 21 (1.5%) | 99 (7.6%) |
| $5,000 to $7,499 | 32 (2.2%) | 22 (1.7%) |
| $7,500 to $9,999 | 42 (2.9%) | 16 (1.2%) |
| $10,000 to $12,499 | 107 (7.5%) | 17 (1.3%) |
| $12,500 to $14,999 | 0 (0.0%) | 20 (1.5%) |
| $15,000 to $17,499 | 14 (1.0%) | 0 (0.0%) |
| $17,500 to $19,999 | 0 (0.0%) | 77 (5.9%) |
| $20,000 to $22,499 | 19 (1.3%) | 25 (1.9%) |
| $22,500 to $24,999 | 24 (1.7%) | 33 (2.5%) |
| $25,000 to $29,999 | 23 (1.6%) | 203 (15.7%) |
| $30,000 to $34,999 | 20 (1.4%) | 151 (11.7%) |
| $35,000 to $39,999 | 0 (0.0%) | 35 (2.7%) |
| $40,000 to $44,999 | 16 (1.1%) | 153 (11.8%) |
| $45,000 to $49,999 | 68 (4.8%) | 97 (7.5%) |
| $50,000 to $54,999 | 70 (4.9%) | 22 (1.7%) |
| $55,000 to $64,999 | 194 (13.6%) | 32 (2.5%) |
| $65,000 to $74,999 | 116 (8.2%) | 86 (6.6%) |
| $75,000 to $99,999 | 174 (12.2%) | 85 (6.6%) |
| $100,000+ | 358 (25.2%) | 113 (8.7%) |
| Total | 1,422 (100.0%) | 1,296 (100.0%) |
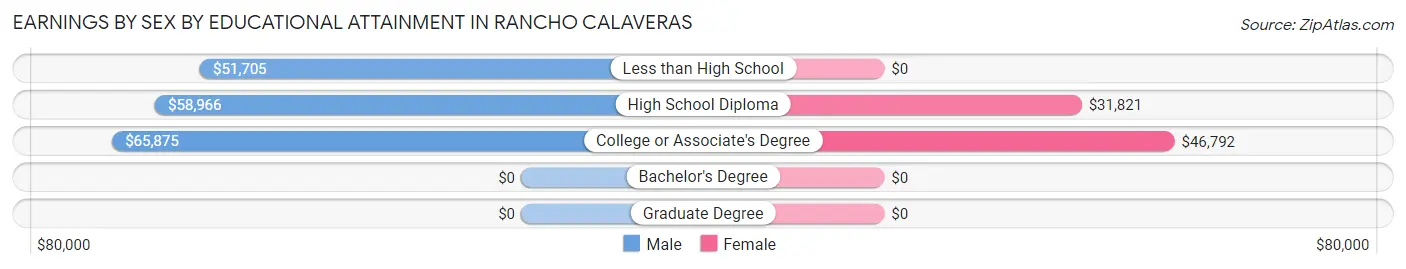
Earnings by Sex by Educational Attainment in Rancho Calaveras
Average earnings in Rancho Calaveras are $65,438 for men and $39,464 for women, a difference of 39.7%. Men with an educational attainment of college or associate's degree enjoy the highest average annual earnings of $65,875, while those with less than high school education earn the least with $51,705. Women with an educational attainment of college or associate's degree earn the most with the average annual earnings of $46,792, while those with high school diploma education have the smallest earnings of $31,821.
| Educational Attainment | Male Income | Female Income |
| Less than High School | $51,705 | $0 |
| High School Diploma | $58,966 | $31,821 |
| College or Associate's Degree | $65,875 | $46,792 |
| Bachelor's Degree | - | - |
| Graduate Degree | - | - |
| Total | $65,438 | $39,464 |
Family Income in Rancho Calaveras
Family Income Brackets in Rancho Calaveras
According to the Rancho Calaveras family income data, there are 412 families falling into the $100,000 to $149,999 income range, which is the most common income bracket and makes up 25.0% of all families.
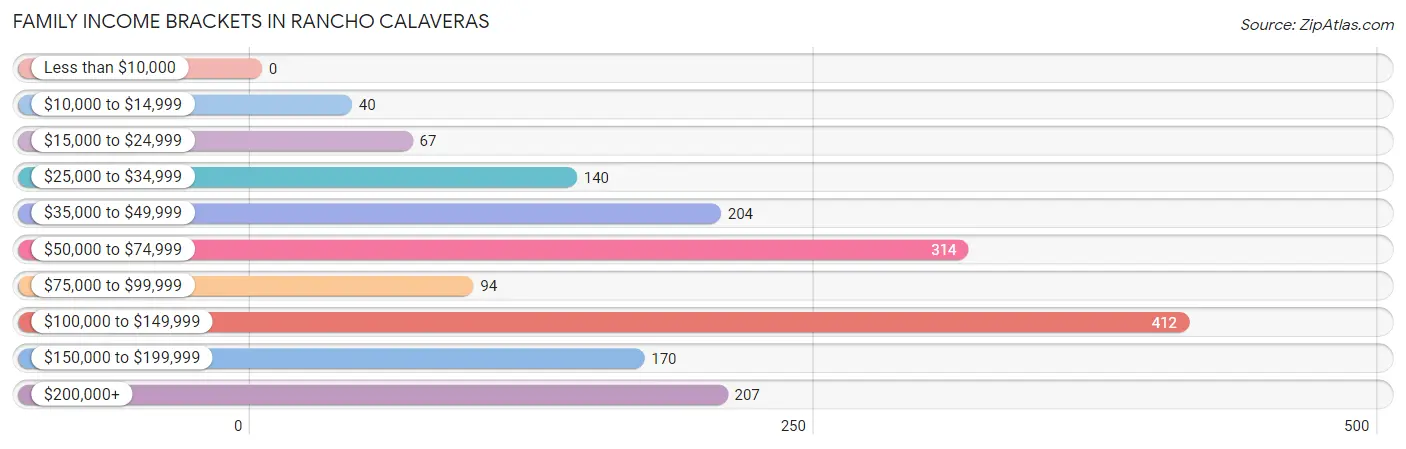
| Income Bracket | # Families | % Families |
| Less than $10,000 | 0 | 0.0% |
| $10,000 to $14,999 | 40 | 2.4% |
| $15,000 to $24,999 | 67 | 4.1% |
| $25,000 to $34,999 | 140 | 8.5% |
| $35,000 to $49,999 | 204 | 12.4% |
| $50,000 to $74,999 | 314 | 19.1% |
| $75,000 to $99,999 | 94 | 5.7% |
| $100,000 to $149,999 | 412 | 25.0% |
| $150,000 to $199,999 | 170 | 10.3% |
| $200,000+ | 207 | 12.6% |
Family Income by Famaliy Size in Rancho Calaveras
3-person families (318 | 19.3%) account for the highest median family income in Rancho Calaveras with $124,545 per family, while 2-person families (889 | 54.0%) have the highest median income of $43,832 per family member.
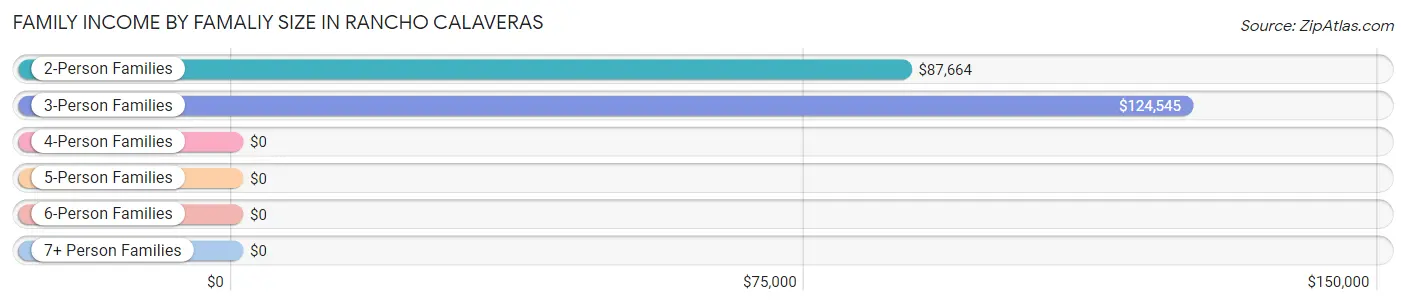
| Income Bracket | # Families | Median Income |
| 2-Person Families | 889 (54.0%) | $87,664 |
| 3-Person Families | 318 (19.3%) | $124,545 |
| 4-Person Families | 351 (21.3%) | $0 |
| 5-Person Families | 42 (2.5%) | $0 |
| 6-Person Families | 31 (1.9%) | $0 |
| 7+ Person Families | 15 (0.9%) | $0 |
| Total | 1,646 (100.0%) | $88,684 |
Family Income by Number of Earners in Rancho Calaveras
The median family income in Rancho Calaveras is $88,684, with families comprising 3+ earners (130) having the highest median family income of $138,424, while families with no earners (379) have the lowest median family income of $44,964, accounting for 7.9% and 23.0% of families, respectively.
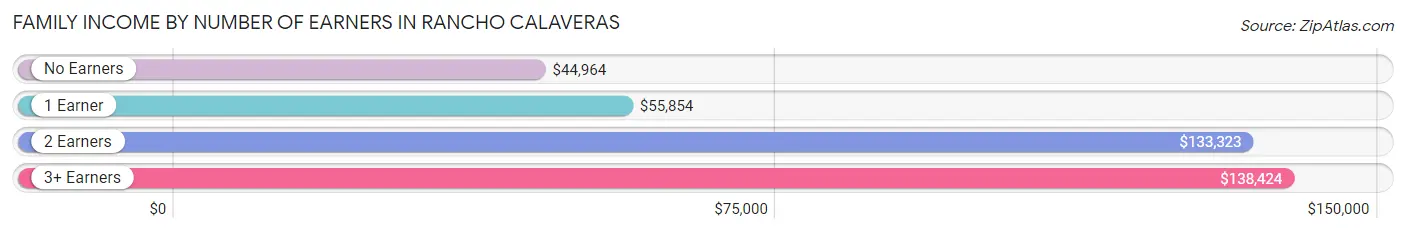
| Number of Earners | # Families | Median Income |
| No Earners | 379 (23.0%) | $44,964 |
| 1 Earner | 690 (41.9%) | $55,854 |
| 2 Earners | 447 (27.2%) | $133,323 |
| 3+ Earners | 130 (7.9%) | $138,424 |
| Total | 1,646 (100.0%) | $88,684 |
Household Income in Rancho Calaveras
Household Income Brackets in Rancho Calaveras
With 508 households falling in the category, the $100,000 to $149,999 income range is the most frequent in Rancho Calaveras, accounting for 23.8% of all households.
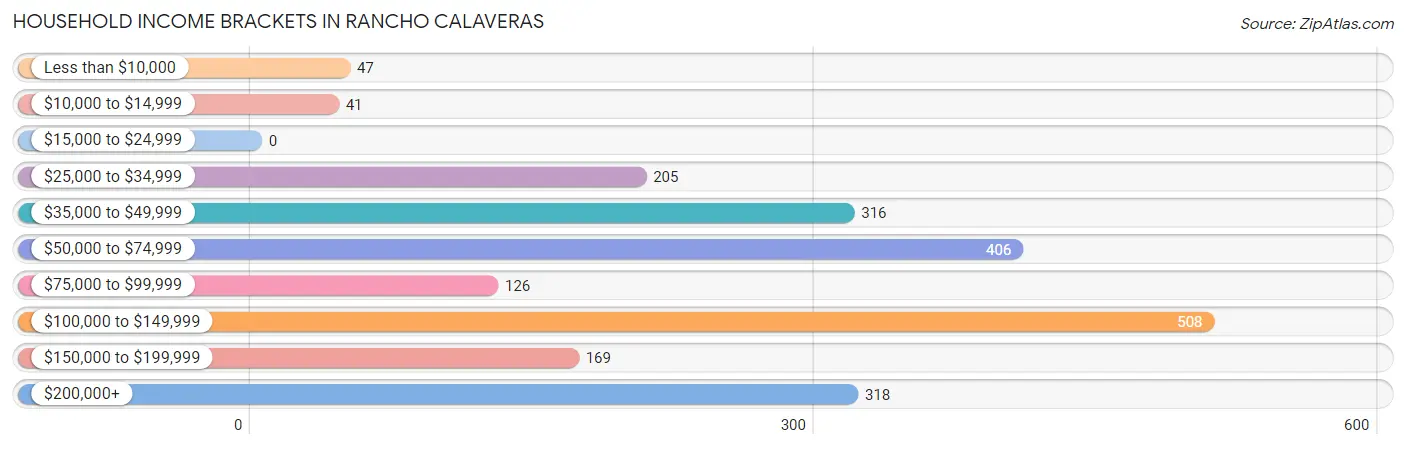
| Income Bracket | # Households | % Households |
| Less than $10,000 | 47 | 2.2% |
| $10,000 to $14,999 | 41 | 1.9% |
| $15,000 to $24,999 | 0 | 0.0% |
| $25,000 to $34,999 | 205 | 9.6% |
| $35,000 to $49,999 | 316 | 14.8% |
| $50,000 to $74,999 | 406 | 19.0% |
| $75,000 to $99,999 | 126 | 5.9% |
| $100,000 to $149,999 | 508 | 23.8% |
| $150,000 to $199,999 | 169 | 7.9% |
| $200,000+ | 318 | 14.9% |
Household Income by Householder Age in Rancho Calaveras
The median household income in Rancho Calaveras is $81,144, with the highest median household income of $121,530 found in the 45 to 64 years age bracket for the primary householder. A total of 1,057 households (49.5%) fall into this category.
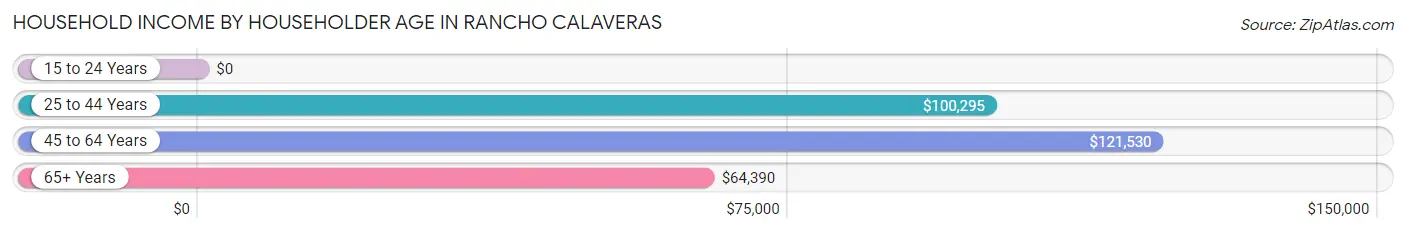
| Income Bracket | # Households | Median Income |
| 15 to 24 Years | 0 (0.0%) | $0 |
| 25 to 44 Years | 506 (23.7%) | $100,295 |
| 45 to 64 Years | 1,057 (49.5%) | $121,530 |
| 65+ Years | 572 (26.8%) | $64,390 |
| Total | 2,135 (100.0%) | $81,144 |
Poverty in Rancho Calaveras
Income Below Poverty by Sex and Age in Rancho Calaveras
With 4.7% poverty level for males and 16.2% for females among the residents of Rancho Calaveras, 25 to 34 year old males and 5 year old females are the most vulnerable to poverty, with 67 males (29.5%) and 86 females (100.0%) in their respective age groups living below the poverty level.
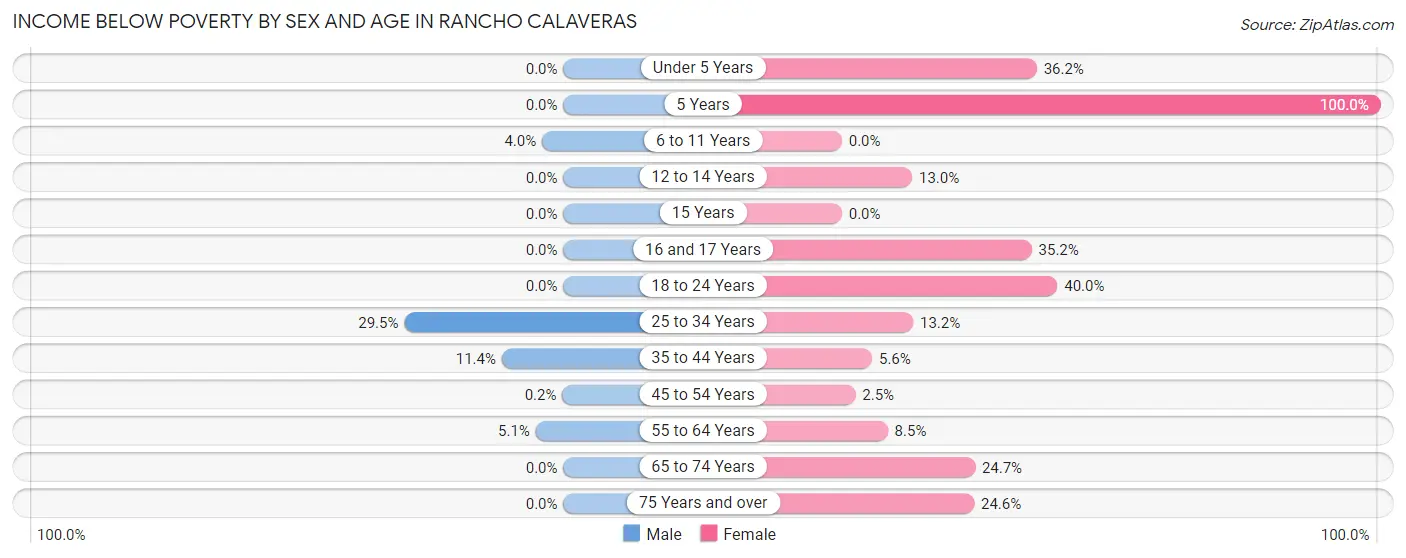
| Age Bracket | Male | Female |
| Under 5 Years | 0 (0.0%) | 55 (36.2%) |
| 5 Years | 0 (0.0%) | 86 (100.0%) |
| 6 to 11 Years | 12 (4.0%) | 0 (0.0%) |
| 12 to 14 Years | 0 (0.0%) | 12 (13.0%) |
| 15 Years | 0 (0.0%) | 0 (0.0%) |
| 16 and 17 Years | 0 (0.0%) | 31 (35.2%) |
| 18 to 24 Years | 0 (0.0%) | 52 (40.0%) |
| 25 to 34 Years | 67 (29.5%) | 34 (13.2%) |
| 35 to 44 Years | 40 (11.4%) | 17 (5.6%) |
| 45 to 54 Years | 1 (0.2%) | 15 (2.5%) |
| 55 to 64 Years | 24 (5.1%) | 44 (8.5%) |
| 65 to 74 Years | 0 (0.0%) | 85 (24.7%) |
| 75 Years and over | 0 (0.0%) | 54 (24.5%) |
| Total | 144 (4.7%) | 485 (16.2%) |
Income Above Poverty by Sex and Age in Rancho Calaveras
According to the poverty statistics in Rancho Calaveras, males aged under 5 years and females aged 6 to 11 years are the age groups that are most secure financially, with 100.0% of males and 100.0% of females in these age groups living above the poverty line.
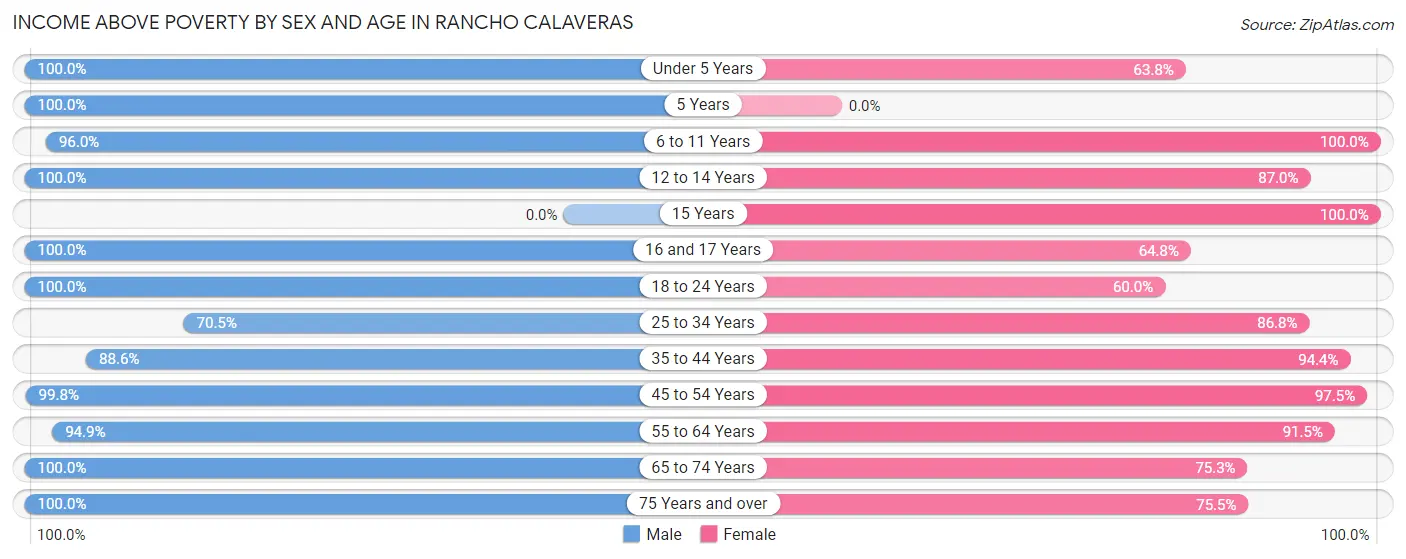
| Age Bracket | Male | Female |
| Under 5 Years | 182 (100.0%) | 97 (63.8%) |
| 5 Years | 93 (100.0%) | 0 (0.0%) |
| 6 to 11 Years | 291 (96.0%) | 191 (100.0%) |
| 12 to 14 Years | 33 (100.0%) | 80 (87.0%) |
| 15 Years | 0 (0.0%) | 24 (100.0%) |
| 16 and 17 Years | 60 (100.0%) | 57 (64.8%) |
| 18 to 24 Years | 306 (100.0%) | 78 (60.0%) |
| 25 to 34 Years | 160 (70.5%) | 223 (86.8%) |
| 35 to 44 Years | 310 (88.6%) | 286 (94.4%) |
| 45 to 54 Years | 502 (99.8%) | 580 (97.5%) |
| 55 to 64 Years | 443 (94.9%) | 473 (91.5%) |
| 65 to 74 Years | 270 (100.0%) | 259 (75.3%) |
| 75 Years and over | 254 (100.0%) | 166 (75.4%) |
| Total | 2,904 (95.3%) | 2,514 (83.8%) |
Income Below Poverty Among Married-Couple Families in Rancho Calaveras
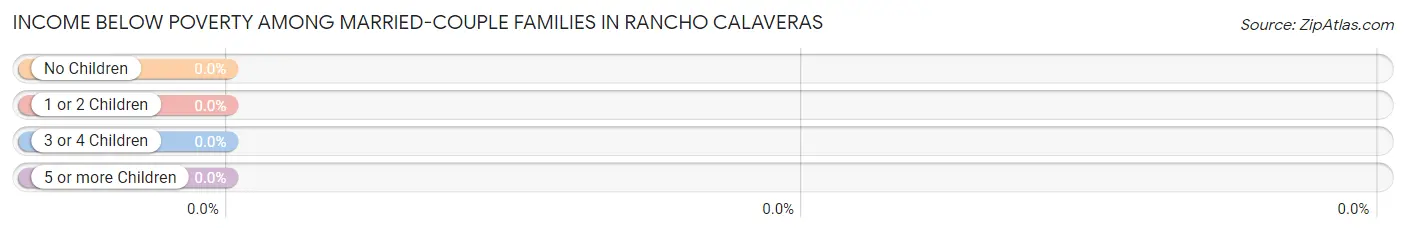
| Children | Above Poverty | Below Poverty |
| No Children | 788 (100.0%) | 0 (0.0%) |
| 1 or 2 Children | 459 (100.0%) | 0 (0.0%) |
| 3 or 4 Children | 34 (100.0%) | 0 (0.0%) |
| 5 or more Children | 0 (0.0%) | 0 (0.0%) |
| Total | 1,281 (100.0%) | 0 (0.0%) |
Income Below Poverty Among Single-Parent Households in Rancho Calaveras
According to the poverty data in Rancho Calaveras, 44.2% or 107 single-father households and 12.2% or 15 single-mother households are living below the poverty line. Among single-father households, those with 1 or 2 children have the highest poverty rate, with 107 households (60.8%) experiencing poverty. Likewise, among single-mother households, those with 3 or 4 children have the highest poverty rate, with 15 households (32.6%) falling below the poverty line.
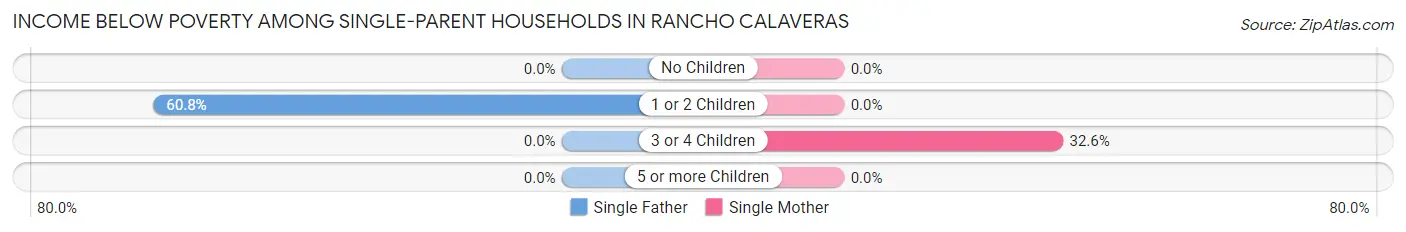
| Children | Single Father | Single Mother |
| No Children | 0 (0.0%) | 0 (0.0%) |
| 1 or 2 Children | 107 (60.8%) | 0 (0.0%) |
| 3 or 4 Children | 0 (0.0%) | 15 (32.6%) |
| 5 or more Children | 0 (0.0%) | 0 (0.0%) |
| Total | 107 (44.2%) | 15 (12.2%) |
Income Below Poverty Among Married-Couple vs Single-Parent Households in Rancho Calaveras
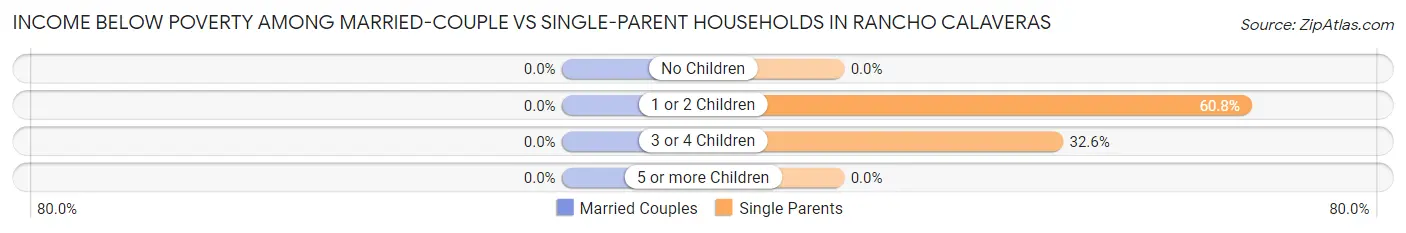
| Children | Married-Couple Families | Single-Parent Households |
| No Children | 0 (0.0%) | 0 (0.0%) |
| 1 or 2 Children | 0 (0.0%) | 107 (60.8%) |
| 3 or 4 Children | 0 (0.0%) | 15 (32.6%) |
| 5 or more Children | 0 (0.0%) | 0 (0.0%) |
| Total | 0 (0.0%) | 122 (33.4%) |
Race in Rancho Calaveras
The most populous races in Rancho Calaveras are White / Caucasian (4,531 | 74.4%), Hispanic or Latino (1,262 | 20.7%), and Two or more Races (656 | 10.8%).
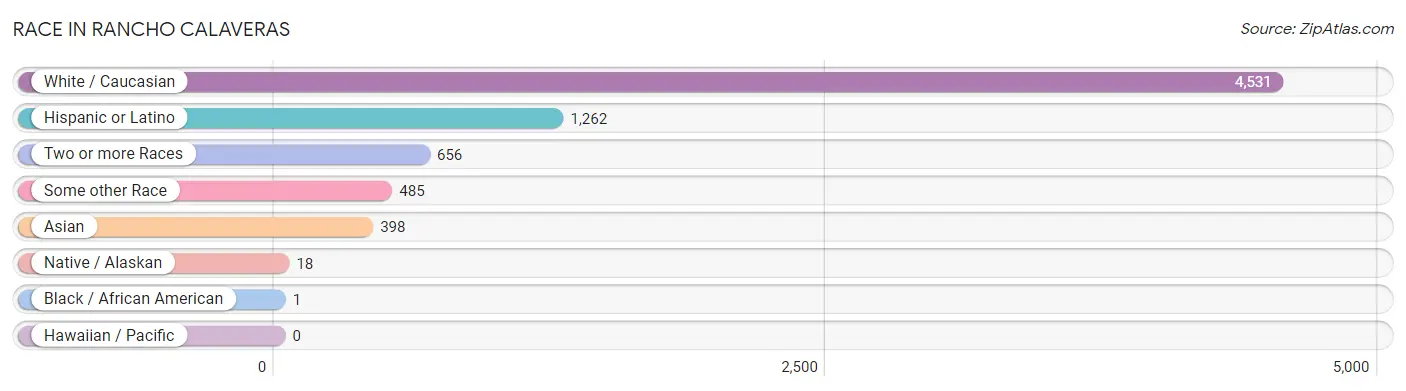
| Race | # Population | % Population |
| Asian | 398 | 6.5% |
| Black / African American | 1 | 0.0% |
| Hawaiian / Pacific | 0 | 0.0% |
| Hispanic or Latino | 1,262 | 20.7% |
| Native / Alaskan | 18 | 0.3% |
| White / Caucasian | 4,531 | 74.4% |
| Two or more Races | 656 | 10.8% |
| Some other Race | 485 | 8.0% |
| Total | 6,089 | 100.0% |
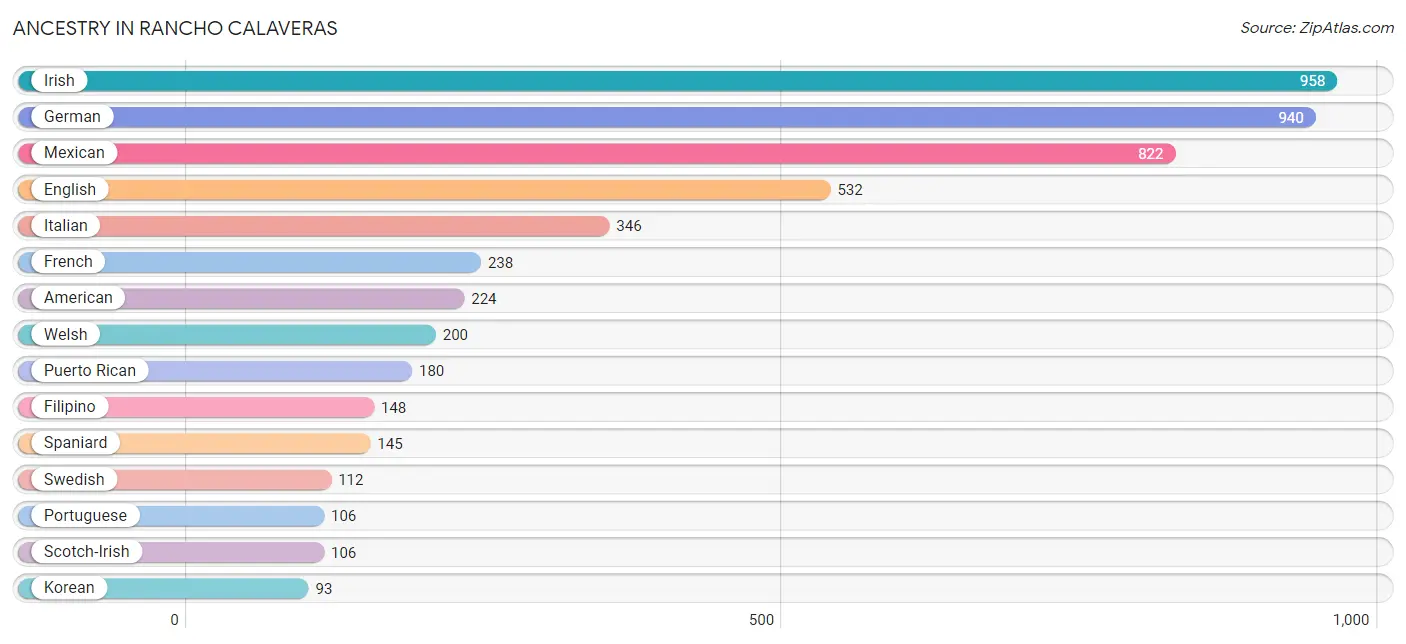
Ancestry in Rancho Calaveras
The most populous ancestries reported in Rancho Calaveras are Irish (958 | 15.7%), German (940 | 15.4%), Mexican (822 | 13.5%), English (532 | 8.7%), and Italian (346 | 5.7%), together accounting for 59.1% of all Rancho Calaveras residents.
| Ancestry | # Population | % Population |
| American | 224 | 3.7% |
| Arab | 21 | 0.3% |
| Bhutanese | 40 | 0.7% |
| British | 67 | 1.1% |
| Canadian | 49 | 0.8% |
| Cherokee | 17 | 0.3% |
| Dutch | 23 | 0.4% |
| Eastern European | 20 | 0.3% |
| English | 532 | 8.7% |
| European | 74 | 1.2% |
| Filipino | 148 | 2.4% |
| Finnish | 17 | 0.3% |
| French | 238 | 3.9% |
| French Canadian | 47 | 0.8% |
| German | 940 | 15.4% |
| Greek | 72 | 1.2% |
| Hungarian | 18 | 0.3% |
| Indian (Asian) | 30 | 0.5% |
| Irish | 958 | 15.7% |
| Israeli | 23 | 0.4% |
| Italian | 346 | 5.7% |
| Korean | 93 | 1.5% |
| Mexican | 822 | 13.5% |
| Native Hawaiian | 55 | 0.9% |
| Norwegian | 14 | 0.2% |
| Polish | 41 | 0.7% |
| Portuguese | 106 | 1.7% |
| Puerto Rican | 180 | 3.0% |
| Scandinavian | 16 | 0.3% |
| Scotch-Irish | 106 | 1.7% |
| Spaniard | 145 | 2.4% |
| Spanish | 68 | 1.1% |
| Swedish | 112 | 1.8% |
| Syrian | 21 | 0.3% |
| Welsh | 200 | 3.3% | View All 35 Rows |
Immigrants in Rancho Calaveras
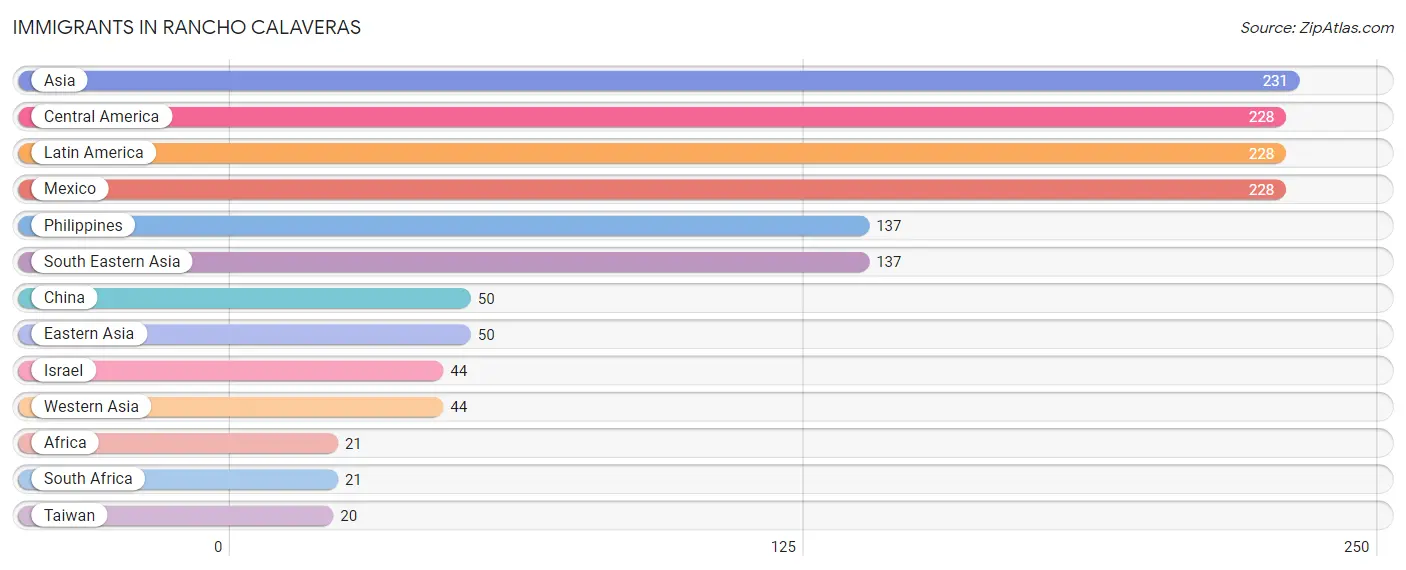
The most numerous immigrant groups reported in Rancho Calaveras came from Asia (231 | 3.8%), Central America (228 | 3.7%), Latin America (228 | 3.7%), Mexico (228 | 3.7%), and Philippines (137 | 2.2%), together accounting for 17.3% of all Rancho Calaveras residents.
| Immigration Origin | # Population | % Population |
| Africa | 21 | 0.3% |
| Asia | 231 | 3.8% |
| Central America | 228 | 3.7% |
| China | 50 | 0.8% |
| Eastern Asia | 50 | 0.8% |
| Israel | 44 | 0.7% |
| Latin America | 228 | 3.7% |
| Mexico | 228 | 3.7% |
| Philippines | 137 | 2.2% |
| South Africa | 21 | 0.3% |
| South Eastern Asia | 137 | 2.2% |
| Taiwan | 20 | 0.3% |
| Western Asia | 44 | 0.7% | View All 13 Rows |
Sex and Age in Rancho Calaveras
Sex and Age in Rancho Calaveras
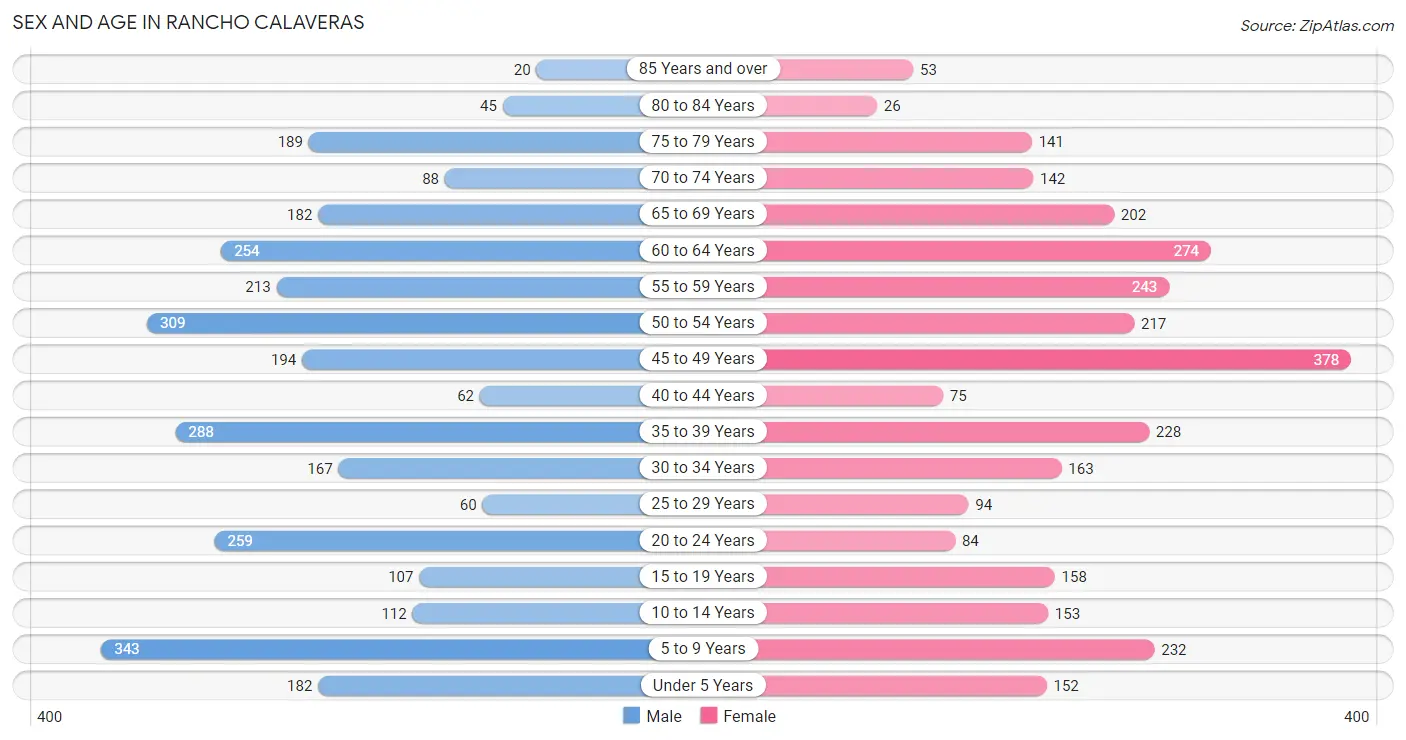
The most populous age groups in Rancho Calaveras are 5 to 9 Years (343 | 11.2%) for men and 45 to 49 Years (378 | 12.5%) for women.
| Age Bracket | Male | Female |
| Under 5 Years | 182 (5.9%) | 152 (5.0%) |
| 5 to 9 Years | 343 (11.2%) | 232 (7.7%) |
| 10 to 14 Years | 112 (3.6%) | 153 (5.1%) |
| 15 to 19 Years | 107 (3.5%) | 158 (5.2%) |
| 20 to 24 Years | 259 (8.4%) | 84 (2.8%) |
| 25 to 29 Years | 60 (1.9%) | 94 (3.1%) |
| 30 to 34 Years | 167 (5.4%) | 163 (5.4%) |
| 35 to 39 Years | 288 (9.4%) | 228 (7.6%) |
| 40 to 44 Years | 62 (2.0%) | 75 (2.5%) |
| 45 to 49 Years | 194 (6.3%) | 378 (12.5%) |
| 50 to 54 Years | 309 (10.1%) | 217 (7.2%) |
| 55 to 59 Years | 213 (6.9%) | 243 (8.1%) |
| 60 to 64 Years | 254 (8.3%) | 274 (9.1%) |
| 65 to 69 Years | 182 (5.9%) | 202 (6.7%) |
| 70 to 74 Years | 88 (2.9%) | 142 (4.7%) |
| 75 to 79 Years | 189 (6.1%) | 141 (4.7%) |
| 80 to 84 Years | 45 (1.5%) | 26 (0.9%) |
| 85 Years and over | 20 (0.6%) | 53 (1.8%) |
| Total | 3,074 (100.0%) | 3,015 (100.0%) |
Families and Households in Rancho Calaveras
Median Family Size in Rancho Calaveras
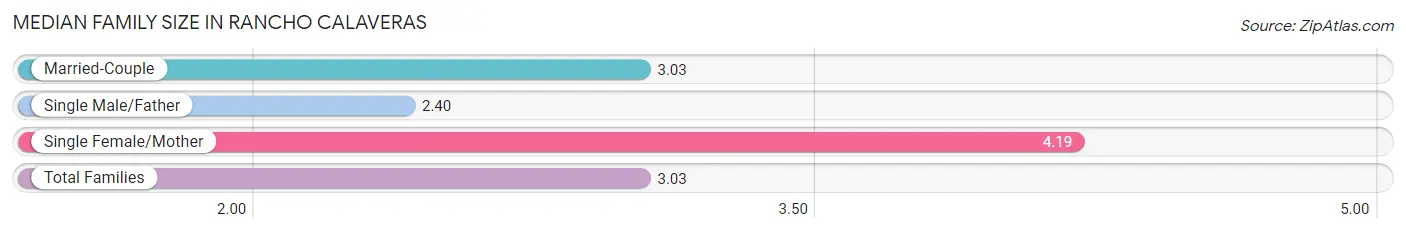
The median family size in Rancho Calaveras is 3.03 persons per family, with single female/mother families (123 | 7.5%) accounting for the largest median family size of 4.19 persons per family. On the other hand, single male/father families (242 | 14.7%) represent the smallest median family size with 2.40 persons per family.
| Family Type | # Families | Family Size |
| Married-Couple | 1,281 (77.8%) | 3.03 |
| Single Male/Father | 242 (14.7%) | 2.40 |
| Single Female/Mother | 123 (7.5%) | 4.19 |
| Total Families | 1,646 (100.0%) | 3.03 |
Median Household Size in Rancho Calaveras
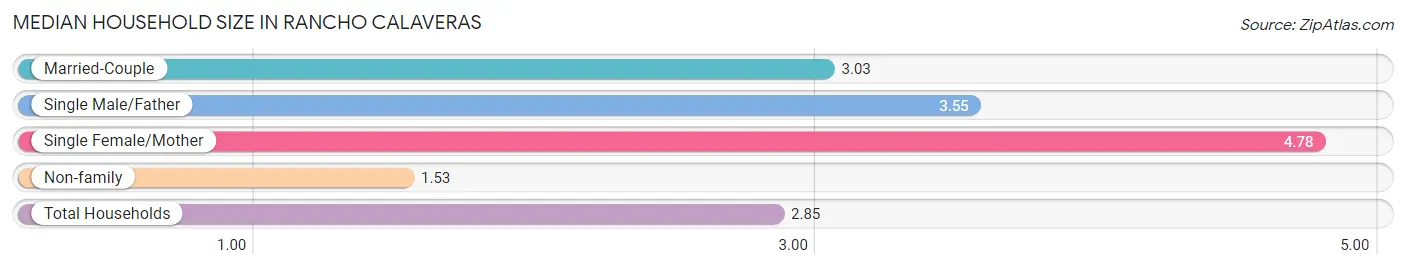
The median household size in Rancho Calaveras is 2.85 persons per household, with single female/mother households (123 | 5.8%) accounting for the largest median household size of 4.78 persons per household. non-family households (489 | 22.9%) represent the smallest median household size with 1.53 persons per household.
| Household Type | # Households | Household Size |
| Married-Couple | 1,281 (60.0%) | 3.03 |
| Single Male/Father | 242 (11.3%) | 3.55 |
| Single Female/Mother | 123 (5.8%) | 4.78 |
| Non-family | 489 (22.9%) | 1.53 |
| Total Households | 2,135 (100.0%) | 2.85 |
Household Size by Marriage Status in Rancho Calaveras
Out of a total of 2,135 households in Rancho Calaveras, 1,646 (77.1%) are family households, while 489 (22.9%) are nonfamily households. The most numerous type of family households are 2-person households, comprising 794, and the most common type of nonfamily households are 2-person households, comprising 245.
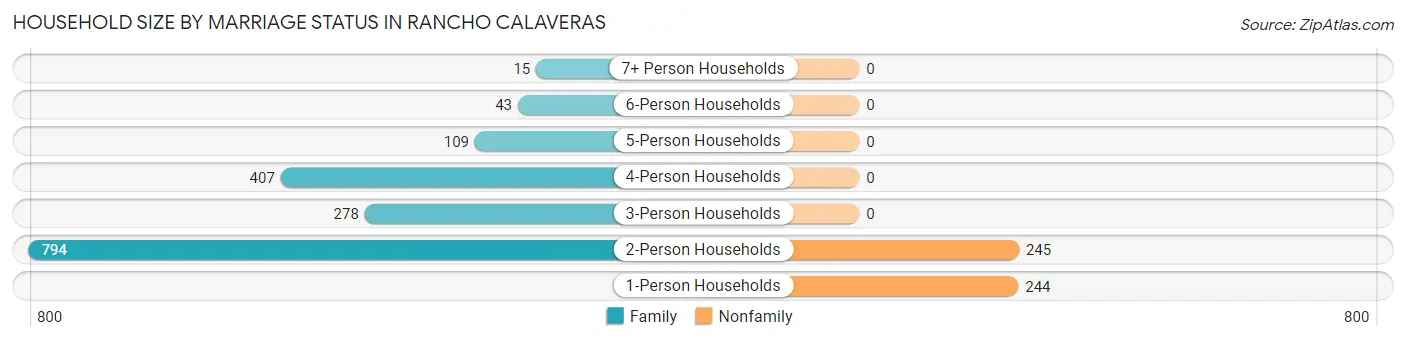
| Household Size | Family Households | Nonfamily Households |
| 1-Person Households | - | 244 (11.4%) |
| 2-Person Households | 794 (37.2%) | 245 (11.5%) |
| 3-Person Households | 278 (13.0%) | 0 (0.0%) |
| 4-Person Households | 407 (19.1%) | 0 (0.0%) |
| 5-Person Households | 109 (5.1%) | 0 (0.0%) |
| 6-Person Households | 43 (2.0%) | 0 (0.0%) |
| 7+ Person Households | 15 (0.7%) | 0 (0.0%) |
| Total | 1,646 (77.1%) | 489 (22.9%) |
Female Fertility in Rancho Calaveras
Fertility by Age in Rancho Calaveras
Average fertility rate in Rancho Calaveras is 55.0 births per 1,000 women. Women in the age bracket of 20 to 34 years have the highest fertility rate with 191.0 births per 1,000 women. Women in the age bracket of 20 to 34 years acount for 100.0% of all women with births.
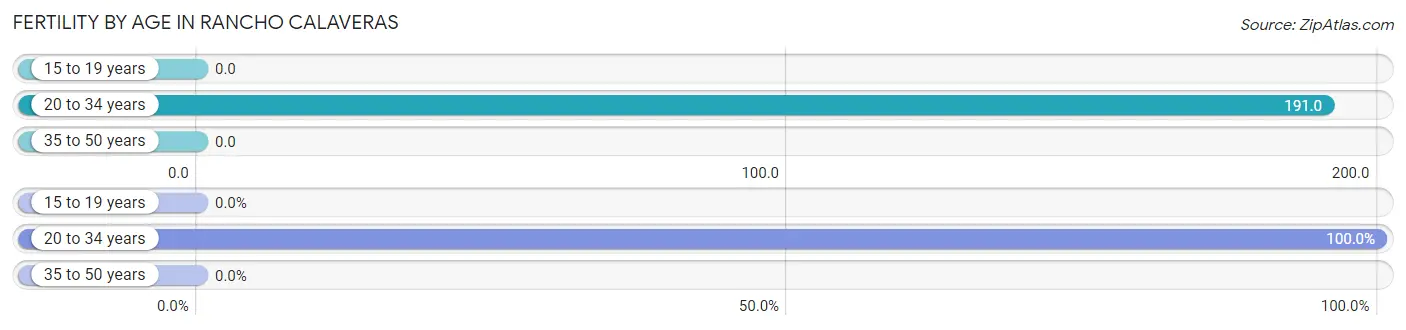
| Age Bracket | Women with Births | Births / 1,000 Women |
| 15 to 19 years | 0 (0.0%) | 0.0 |
| 20 to 34 years | 65 (100.0%) | 191.0 |
| 35 to 50 years | 0 (0.0%) | 0.0 |
| Total | 65 (100.0%) | 55.0 |
Fertility by Age by Marriage Status in Rancho Calaveras
47.7% of women with births (65) in Rancho Calaveras are married. The highest percentage of unmarried women with births falls into 20 to 34 years age bracket with 52.3% of them unmarried at the time of birth, while the lowest percentage of unmarried women with births belong to 20 to 34 years age bracket with 52.3% of them unmarried.
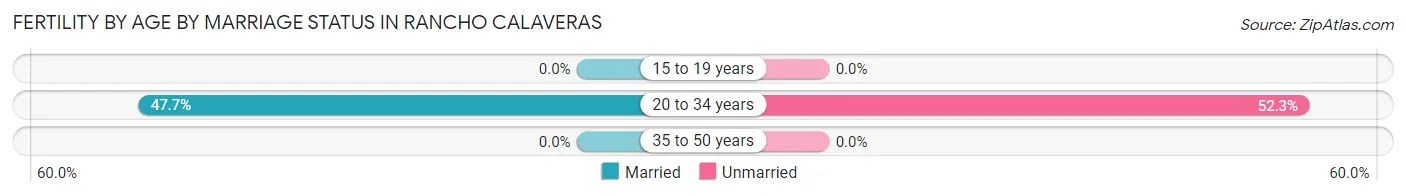
| Age Bracket | Married | Unmarried |
| 15 to 19 years | 0 (0.0%) | 0 (0.0%) |
| 20 to 34 years | 31 (47.7%) | 34 (52.3%) |
| 35 to 50 years | 0 (0.0%) | 0 (0.0%) |
| Total | 31 (47.7%) | 34 (52.3%) |
Fertility by Education in Rancho Calaveras
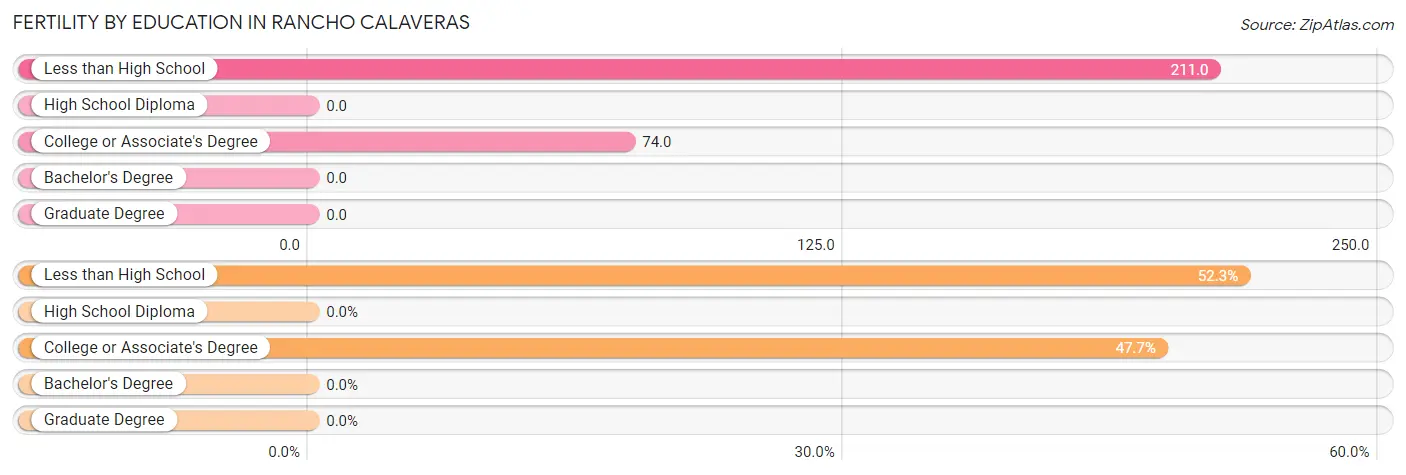
| Educational Attainment | Women with Births | Births / 1,000 Women |
| Less than High School | 34 (52.3%) | 211.0 |
| High School Diploma | 0 (0.0%) | 0.0 |
| College or Associate's Degree | 31 (47.7%) | 74.0 |
| Bachelor's Degree | 0 (0.0%) | 0.0 |
| Graduate Degree | 0 (0.0%) | 0.0 |
| Total | 65 (100.0%) | 55.0 |
Fertility by Education by Marriage Status in Rancho Calaveras
52.3% of women with births in Rancho Calaveras are unmarried. Women with the educational attainment of college or associate's degree are most likely to be married with 100.0% of them married at childbirth, while women with the educational attainment of less than high school are least likely to be married with 100.0% of them unmarried at childbirth.
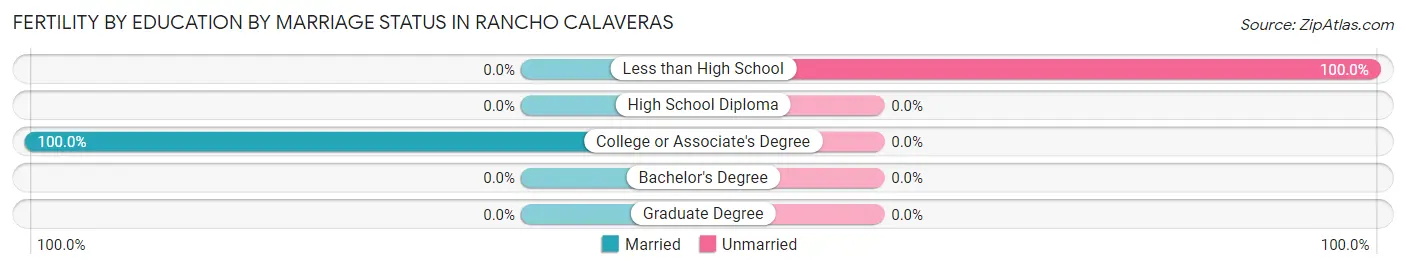
| Educational Attainment | Married | Unmarried |
| Less than High School | 0 (0.0%) | 34 (100.0%) |
| High School Diploma | 0 (0.0%) | 0 (0.0%) |
| College or Associate's Degree | 31 (100.0%) | 0 (0.0%) |
| Bachelor's Degree | 0 (0.0%) | 0 (0.0%) |
| Graduate Degree | 0 (0.0%) | 0 (0.0%) |
| Total | 31 (47.7%) | 34 (52.3%) |
Employment Characteristics in Rancho Calaveras
Employment by Class of Employer in Rancho Calaveras
Among the 2,472 employed individuals in Rancho Calaveras, private company employees (1,478 | 59.8%), local government employees (326 | 13.2%), and self-employed (not incorporated) (317 | 12.8%) make up the most common classes of employment.
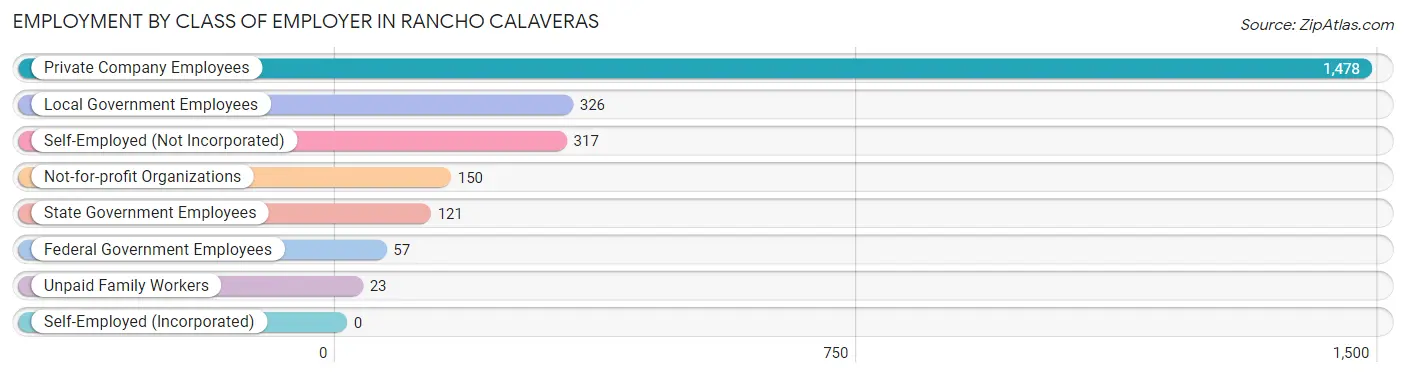
| Employer Class | # Employees | % Employees |
| Private Company Employees | 1,478 | 59.8% |
| Self-Employed (Incorporated) | 0 | 0.0% |
| Self-Employed (Not Incorporated) | 317 | 12.8% |
| Not-for-profit Organizations | 150 | 6.1% |
| Local Government Employees | 326 | 13.2% |
| State Government Employees | 121 | 4.9% |
| Federal Government Employees | 57 | 2.3% |
| Unpaid Family Workers | 23 | 0.9% |
| Total | 2,472 | 100.0% |
Employment Status by Age in Rancho Calaveras
According to the labor force statistics for Rancho Calaveras, out of the total population over 16 years of age (4,891), 55.6% or 2,719 individuals are in the labor force, with 6.5% or 177 of them unemployed. The age group with the highest labor force participation rate is 30 to 34 years, with 100.0% or 330 individuals in the labor force. Within the labor force, the 75 years and over age range has the highest percentage of unemployed individuals, with 100.0% or 18 of them being unemployed.
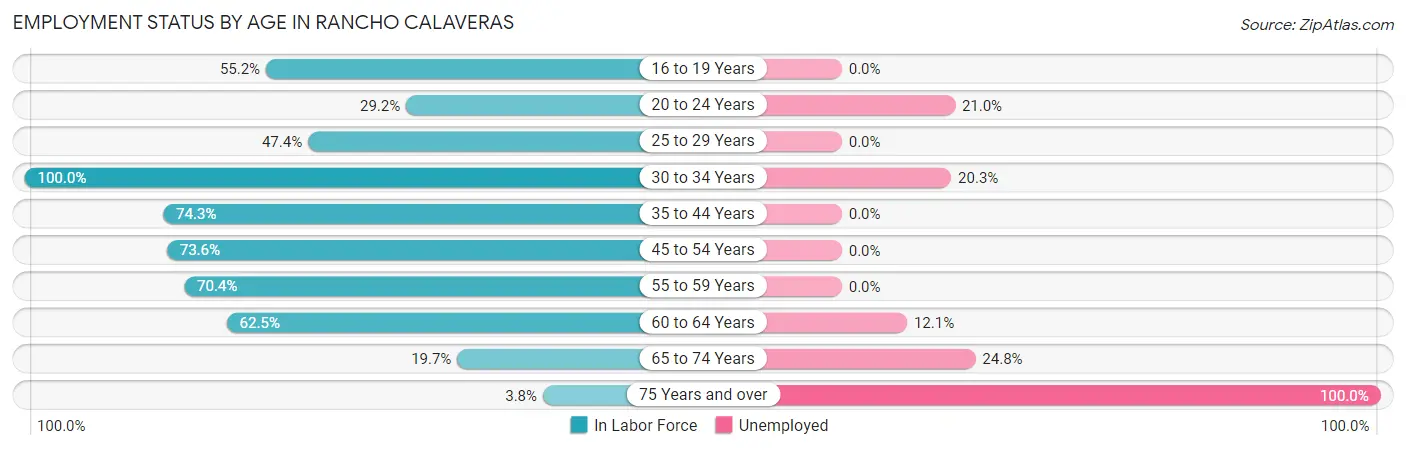
| Age Bracket | In Labor Force | Unemployed |
| 16 to 19 Years | 133 (55.2%) | 0 (0.0%) |
| 20 to 24 Years | 100 (29.2%) | 21 (21.0%) |
| 25 to 29 Years | 73 (47.4%) | 0 (0.0%) |
| 30 to 34 Years | 330 (100.0%) | 67 (20.3%) |
| 35 to 44 Years | 485 (74.3%) | 0 (0.0%) |
| 45 to 54 Years | 808 (73.6%) | 0 (0.0%) |
| 55 to 59 Years | 321 (70.4%) | 0 (0.0%) |
| 60 to 64 Years | 330 (62.5%) | 40 (12.1%) |
| 65 to 74 Years | 121 (19.7%) | 30 (24.8%) |
| 75 Years and over | 18 (3.8%) | 18 (100.0%) |
| Total | 2,719 (55.6%) | 177 (6.5%) |
Employment Status by Educational Attainment in Rancho Calaveras
According to labor force statistics for Rancho Calaveras, 72.9% of individuals (2,347) out of the total population between 25 and 64 years of age (3,219) are in the labor force, with 4.6% or 108 of them being unemployed. The group with the highest labor force participation rate are those with the educational attainment of bachelor's degree or higher, with 81.9% or 303 individuals in the labor force. Within the labor force, individuals with high school diploma education have the highest percentage of unemployment, with 8.1% or 67 of them being unemployed.
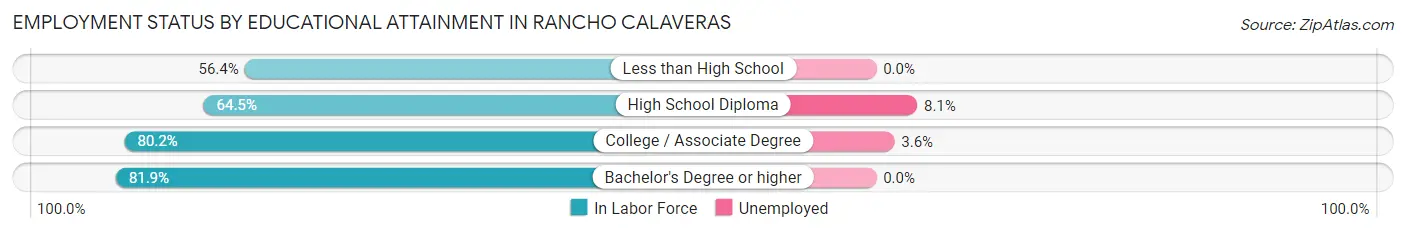
| Educational Attainment | In Labor Force | Unemployed |
| Less than High School | 93 (56.4%) | 0 (0.0%) |
| High School Diploma | 830 (64.5%) | 104 (8.1%) |
| College / Associate Degree | 1,120 (80.2%) | 50 (3.6%) |
| Bachelor's Degree or higher | 303 (81.9%) | 0 (0.0%) |
| Total | 2,347 (72.9%) | 148 (4.6%) |
Employment Occupations by Sex in Rancho Calaveras
Management, Business, Science and Arts Occupations
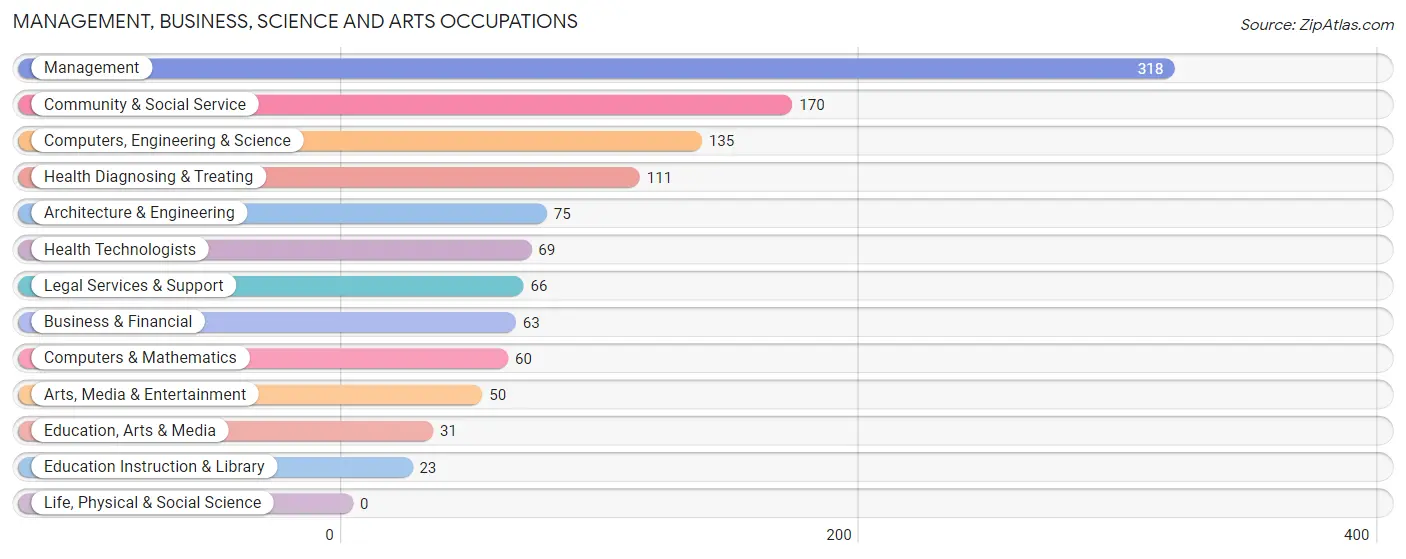
The most common Management, Business, Science and Arts occupations in Rancho Calaveras are Management (318 | 12.5%), Community & Social Service (170 | 6.7%), Computers, Engineering & Science (135 | 5.3%), Health Diagnosing & Treating (111 | 4.4%), and Architecture & Engineering (75 | 2.9%).
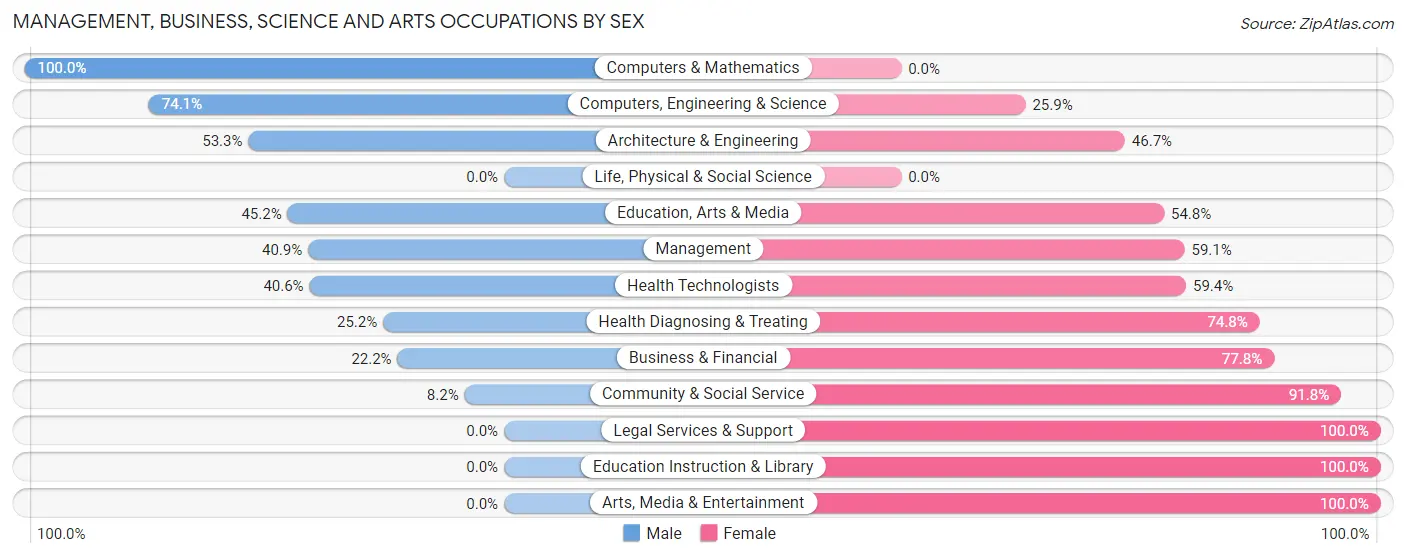
Management, Business, Science and Arts Occupations by Sex
Within the Management, Business, Science and Arts occupations in Rancho Calaveras, the most male-oriented occupations are Computers & Mathematics (100.0%), Computers, Engineering & Science (74.1%), and Architecture & Engineering (53.3%), while the most female-oriented occupations are Legal Services & Support (100.0%), Education Instruction & Library (100.0%), and Arts, Media & Entertainment (100.0%).
| Occupation | Male | Female |
| Management | 130 (40.9%) | 188 (59.1%) |
| Business & Financial | 14 (22.2%) | 49 (77.8%) |
| Computers, Engineering & Science | 100 (74.1%) | 35 (25.9%) |
| Computers & Mathematics | 60 (100.0%) | 0 (0.0%) |
| Architecture & Engineering | 40 (53.3%) | 35 (46.7%) |
| Life, Physical & Social Science | 0 (0.0%) | 0 (0.0%) |
| Community & Social Service | 14 (8.2%) | 156 (91.8%) |
| Education, Arts & Media | 14 (45.2%) | 17 (54.8%) |
| Legal Services & Support | 0 (0.0%) | 66 (100.0%) |
| Education Instruction & Library | 0 (0.0%) | 23 (100.0%) |
| Arts, Media & Entertainment | 0 (0.0%) | 50 (100.0%) |
| Health Diagnosing & Treating | 28 (25.2%) | 83 (74.8%) |
| Health Technologists | 28 (40.6%) | 41 (59.4%) |
| Total (Category) | 286 (35.9%) | 511 (64.1%) |
| Total (Overall) | 1,280 (50.3%) | 1,263 (49.7%) |
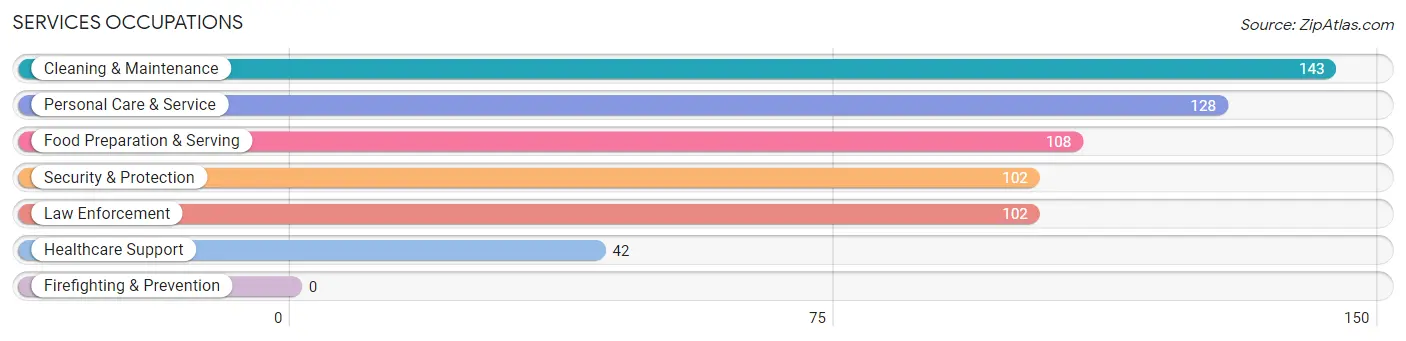
Services Occupations
The most common Services occupations in Rancho Calaveras are Cleaning & Maintenance (143 | 5.6%), Personal Care & Service (128 | 5.0%), Food Preparation & Serving (108 | 4.3%), Security & Protection (102 | 4.0%), and Law Enforcement (102 | 4.0%).
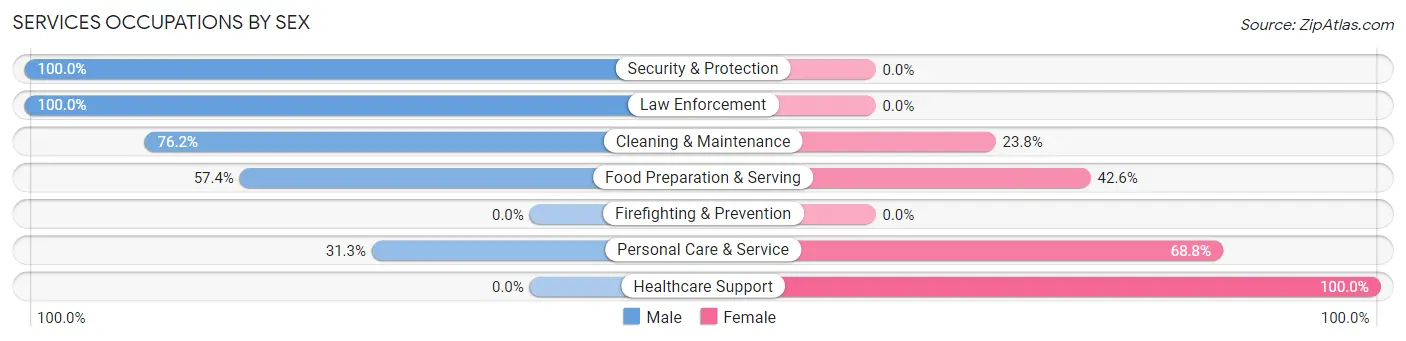
Services Occupations by Sex
Within the Services occupations in Rancho Calaveras, the most male-oriented occupations are Security & Protection (100.0%), Law Enforcement (100.0%), and Cleaning & Maintenance (76.2%), while the most female-oriented occupations are Healthcare Support (100.0%), Personal Care & Service (68.8%), and Food Preparation & Serving (42.6%).
| Occupation | Male | Female |
| Healthcare Support | 0 (0.0%) | 42 (100.0%) |
| Security & Protection | 102 (100.0%) | 0 (0.0%) |
| Firefighting & Prevention | 0 (0.0%) | 0 (0.0%) |
| Law Enforcement | 102 (100.0%) | 0 (0.0%) |
| Food Preparation & Serving | 62 (57.4%) | 46 (42.6%) |
| Cleaning & Maintenance | 109 (76.2%) | 34 (23.8%) |
| Personal Care & Service | 40 (31.2%) | 88 (68.8%) |
| Total (Category) | 313 (59.9%) | 210 (40.2%) |
| Total (Overall) | 1,280 (50.3%) | 1,263 (49.7%) |
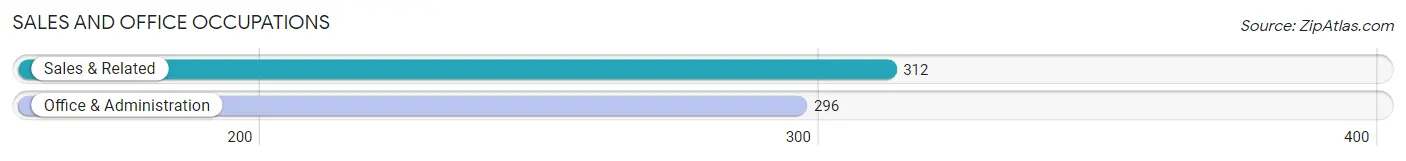
Sales and Office Occupations
The most common Sales and Office occupations in Rancho Calaveras are Sales & Related (312 | 12.3%), and Office & Administration (296 | 11.6%).
Sales and Office Occupations by Sex
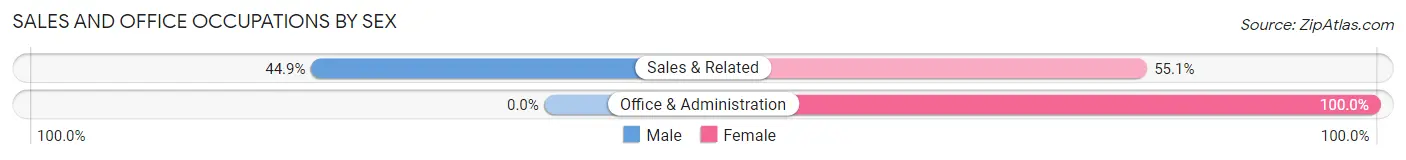
| Occupation | Male | Female |
| Sales & Related | 140 (44.9%) | 172 (55.1%) |
| Office & Administration | 0 (0.0%) | 296 (100.0%) |
| Total (Category) | 140 (23.0%) | 468 (77.0%) |
| Total (Overall) | 1,280 (50.3%) | 1,263 (49.7%) |
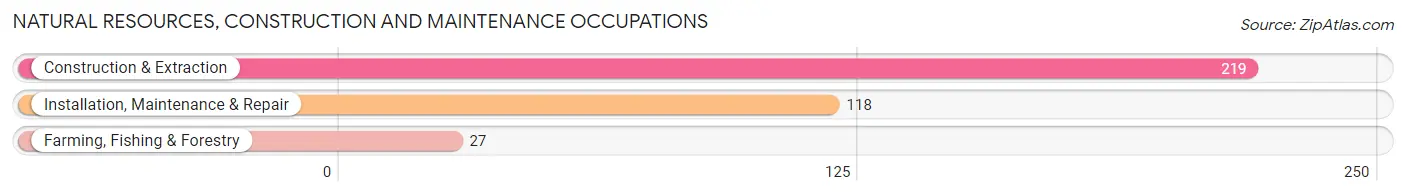
Natural Resources, Construction and Maintenance Occupations
The most common Natural Resources, Construction and Maintenance occupations in Rancho Calaveras are Construction & Extraction (219 | 8.6%), Installation, Maintenance & Repair (118 | 4.6%), and Farming, Fishing & Forestry (27 | 1.1%).
Natural Resources, Construction and Maintenance Occupations by Sex
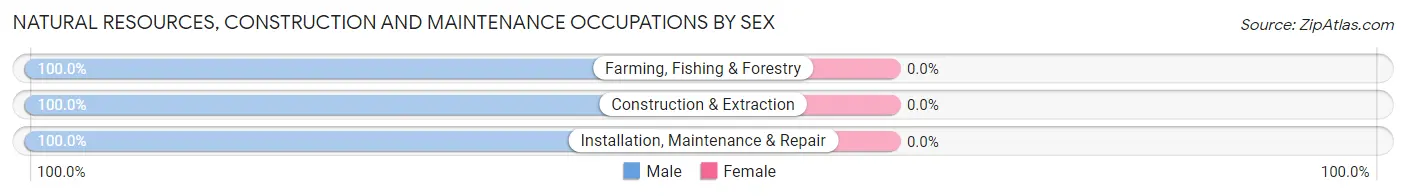
| Occupation | Male | Female |
| Farming, Fishing & Forestry | 27 (100.0%) | 0 (0.0%) |
| Construction & Extraction | 219 (100.0%) | 0 (0.0%) |
| Installation, Maintenance & Repair | 118 (100.0%) | 0 (0.0%) |
| Total (Category) | 364 (100.0%) | 0 (0.0%) |
| Total (Overall) | 1,280 (50.3%) | 1,263 (49.7%) |
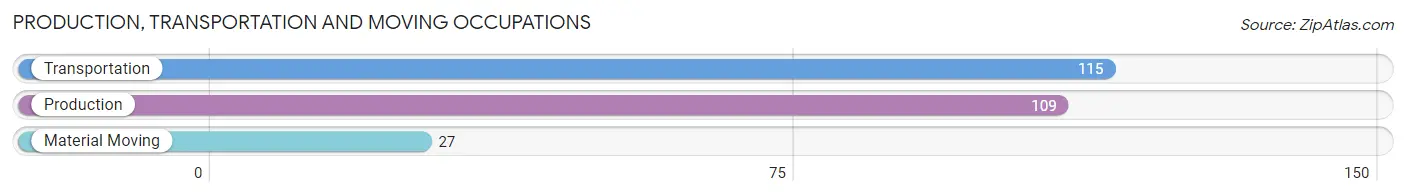
Production, Transportation and Moving Occupations
The most common Production, Transportation and Moving occupations in Rancho Calaveras are Transportation (115 | 4.5%), Production (109 | 4.3%), and Material Moving (27 | 1.1%).
Production, Transportation and Moving Occupations by Sex
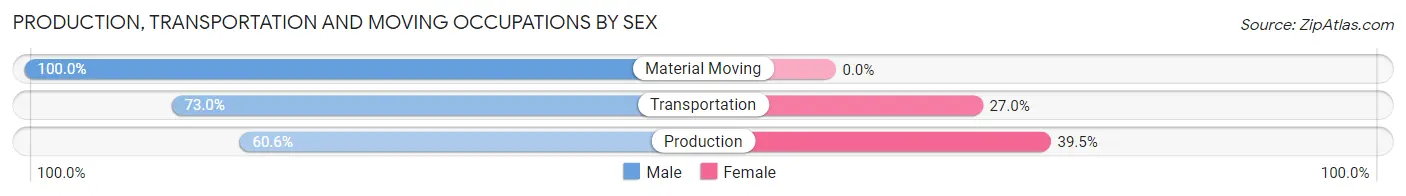
| Occupation | Male | Female |
| Production | 66 (60.6%) | 43 (39.5%) |
| Transportation | 84 (73.0%) | 31 (27.0%) |
| Material Moving | 27 (100.0%) | 0 (0.0%) |
| Total (Category) | 177 (70.5%) | 74 (29.5%) |
| Total (Overall) | 1,280 (50.3%) | 1,263 (49.7%) |
Employment Industries by Sex in Rancho Calaveras
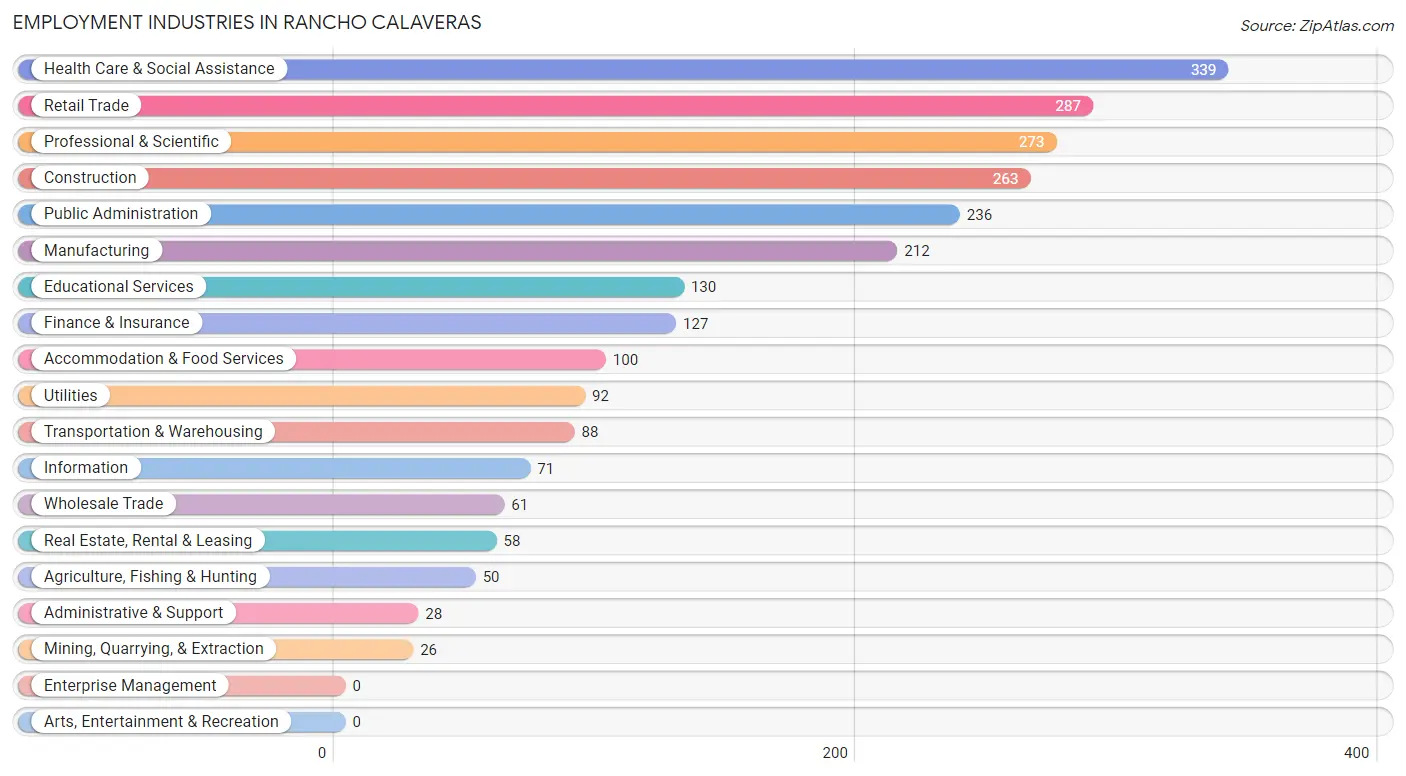
Employment Industries in Rancho Calaveras
The major employment industries in Rancho Calaveras include Health Care & Social Assistance (339 | 13.3%), Retail Trade (287 | 11.3%), Professional & Scientific (273 | 10.7%), Construction (263 | 10.3%), and Public Administration (236 | 9.3%).
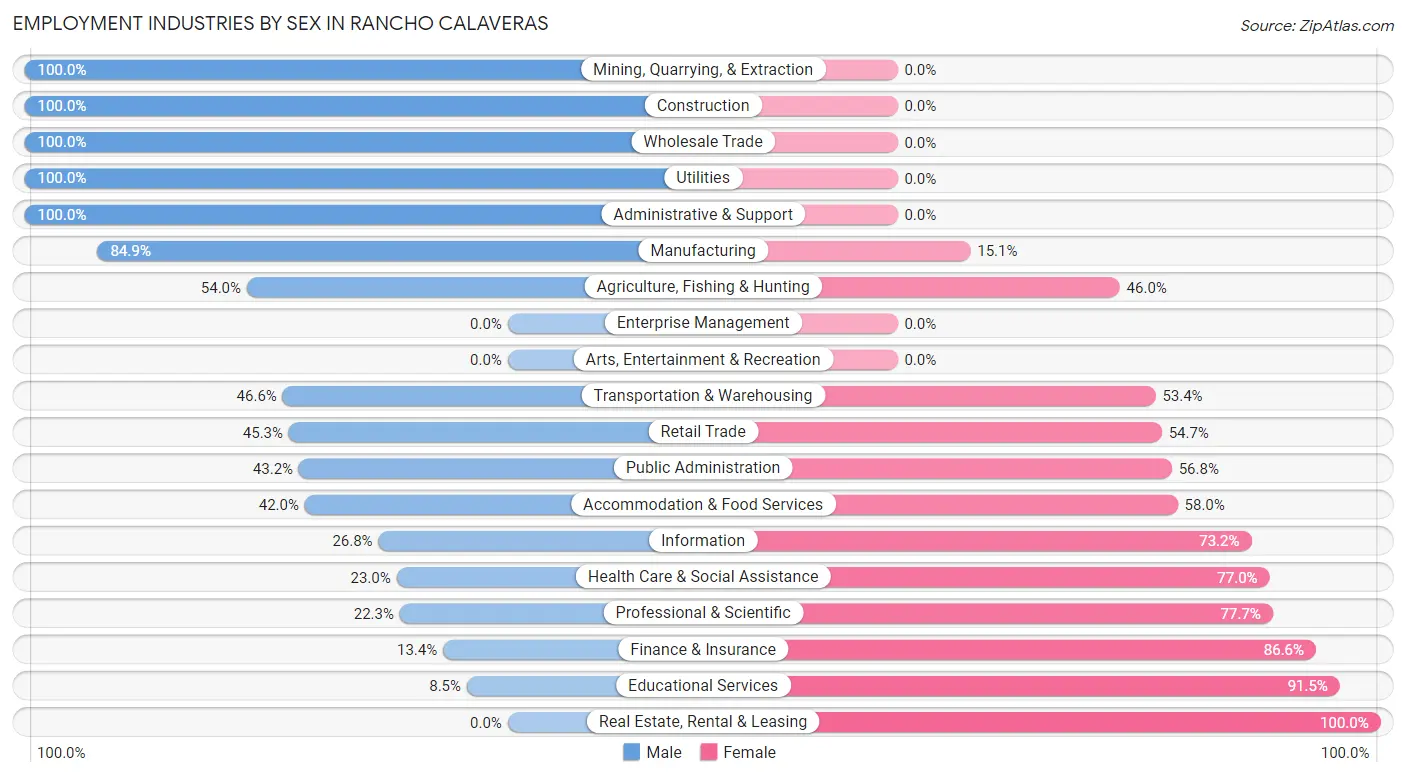
Employment Industries by Sex in Rancho Calaveras
The Rancho Calaveras industries that see more men than women are Mining, Quarrying, & Extraction (100.0%), Construction (100.0%), and Wholesale Trade (100.0%), whereas the industries that tend to have a higher number of women are Real Estate, Rental & Leasing (100.0%), Educational Services (91.5%), and Finance & Insurance (86.6%).
| Industry | Male | Female |
| Agriculture, Fishing & Hunting | 27 (54.0%) | 23 (46.0%) |
| Mining, Quarrying, & Extraction | 26 (100.0%) | 0 (0.0%) |
| Construction | 263 (100.0%) | 0 (0.0%) |
| Manufacturing | 180 (84.9%) | 32 (15.1%) |
| Wholesale Trade | 61 (100.0%) | 0 (0.0%) |
| Retail Trade | 130 (45.3%) | 157 (54.7%) |
| Transportation & Warehousing | 41 (46.6%) | 47 (53.4%) |
| Utilities | 92 (100.0%) | 0 (0.0%) |
| Information | 19 (26.8%) | 52 (73.2%) |
| Finance & Insurance | 17 (13.4%) | 110 (86.6%) |
| Real Estate, Rental & Leasing | 0 (0.0%) | 58 (100.0%) |
| Professional & Scientific | 61 (22.3%) | 212 (77.7%) |
| Enterprise Management | 0 (0.0%) | 0 (0.0%) |
| Administrative & Support | 28 (100.0%) | 0 (0.0%) |
| Educational Services | 11 (8.5%) | 119 (91.5%) |
| Health Care & Social Assistance | 78 (23.0%) | 261 (77.0%) |
| Arts, Entertainment & Recreation | 0 (0.0%) | 0 (0.0%) |
| Accommodation & Food Services | 42 (42.0%) | 58 (58.0%) |
| Public Administration | 102 (43.2%) | 134 (56.8%) |
| Total | 1,280 (50.3%) | 1,263 (49.7%) |
Education in Rancho Calaveras
School Enrollment in Rancho Calaveras
The most common levels of schooling among the 1,280 students in Rancho Calaveras are high school (313 | 24.4%), elementary school (302 | 23.6%), and kindergarten (219 | 17.1%).
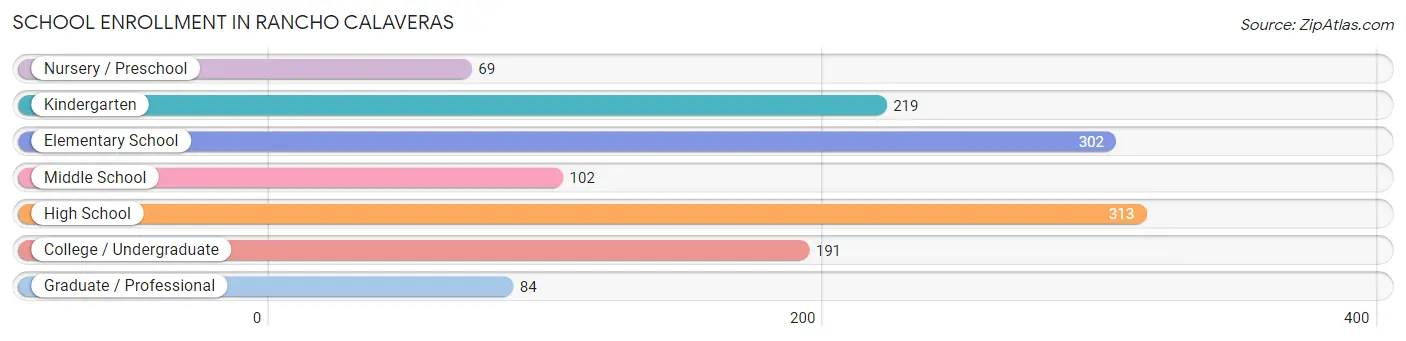
| School Level | # Students | % Students |
| Nursery / Preschool | 69 | 5.4% |
| Kindergarten | 219 | 17.1% |
| Elementary School | 302 | 23.6% |
| Middle School | 102 | 8.0% |
| High School | 313 | 24.4% |
| College / Undergraduate | 191 | 14.9% |
| Graduate / Professional | 84 | 6.6% |
| Total | 1,280 | 100.0% |
School Enrollment by Age by Funding Source in Rancho Calaveras
Out of a total of 1,280 students who are enrolled in schools in Rancho Calaveras, 59 (4.6%) attend a private institution, while the remaining 1,221 (95.4%) are enrolled in public schools. The age group of 18 to 19 year olds has the highest likelihood of being enrolled in private schools, with 42 (59.2% in the age bracket) enrolled. Conversely, the age group of 5 to 9 year old has the lowest likelihood of being enrolled in a private school, with 563 (100.0% in the age bracket) attending a public institution.
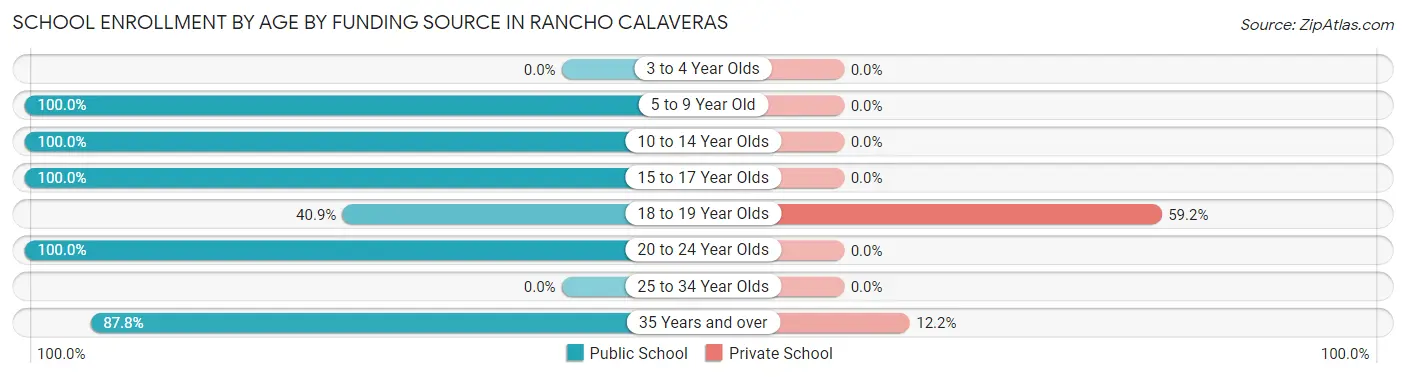
| Age Bracket | Public School | Private School |
| 3 to 4 Year Olds | 0 (0.0%) | 0 (0.0%) |
| 5 to 9 Year Old | 563 (100.0%) | 0 (0.0%) |
| 10 to 14 Year Olds | 265 (100.0%) | 0 (0.0%) |
| 15 to 17 Year Olds | 172 (100.0%) | 0 (0.0%) |
| 18 to 19 Year Olds | 29 (40.8%) | 42 (59.2%) |
| 20 to 24 Year Olds | 70 (100.0%) | 0 (0.0%) |
| 25 to 34 Year Olds | 0 (0.0%) | 0 (0.0%) |
| 35 Years and over | 122 (87.8%) | 17 (12.2%) |
| Total | 1,221 (95.4%) | 59 (4.6%) |
Educational Attainment by Field of Study in Rancho Calaveras
Science & technology (169 | 33.3%), communications (67 | 13.2%), business (60 | 11.8%), engineering (50 | 9.9%), and social sciences (49 | 9.7%) are the most common fields of study among 507 individuals in Rancho Calaveras who have obtained a bachelor's degree or higher.
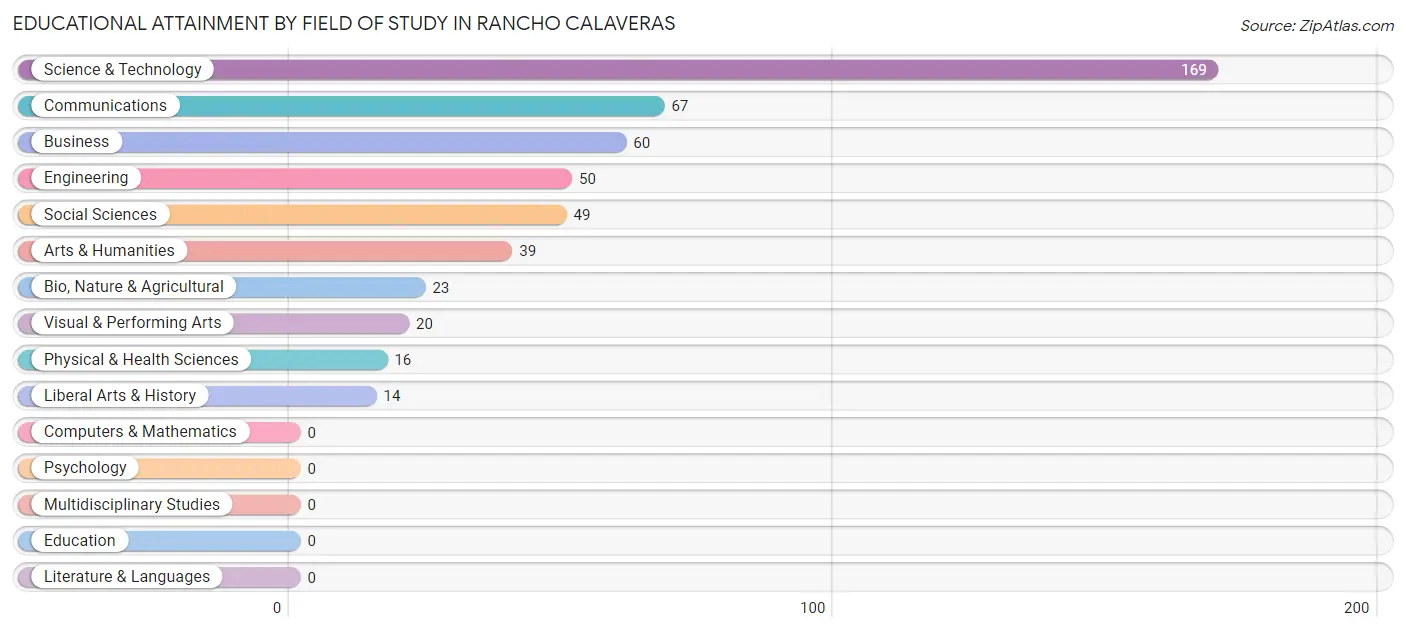
| Field of Study | # Graduates | % Graduates |
| Computers & Mathematics | 0 | 0.0% |
| Bio, Nature & Agricultural | 23 | 4.5% |
| Physical & Health Sciences | 16 | 3.2% |
| Psychology | 0 | 0.0% |
| Social Sciences | 49 | 9.7% |
| Engineering | 50 | 9.9% |
| Multidisciplinary Studies | 0 | 0.0% |
| Science & Technology | 169 | 33.3% |
| Business | 60 | 11.8% |
| Education | 0 | 0.0% |
| Literature & Languages | 0 | 0.0% |
| Liberal Arts & History | 14 | 2.8% |
| Visual & Performing Arts | 20 | 3.9% |
| Communications | 67 | 13.2% |
| Arts & Humanities | 39 | 7.7% |
| Total | 507 | 100.0% |
Transportation & Commute in Rancho Calaveras
Vehicle Availability by Sex in Rancho Calaveras
The most prevalent vehicle ownership categories in Rancho Calaveras are males with 3 vehicles (452, accounting for 36.5%) and females with 3 vehicles (392, making up 36.7%).
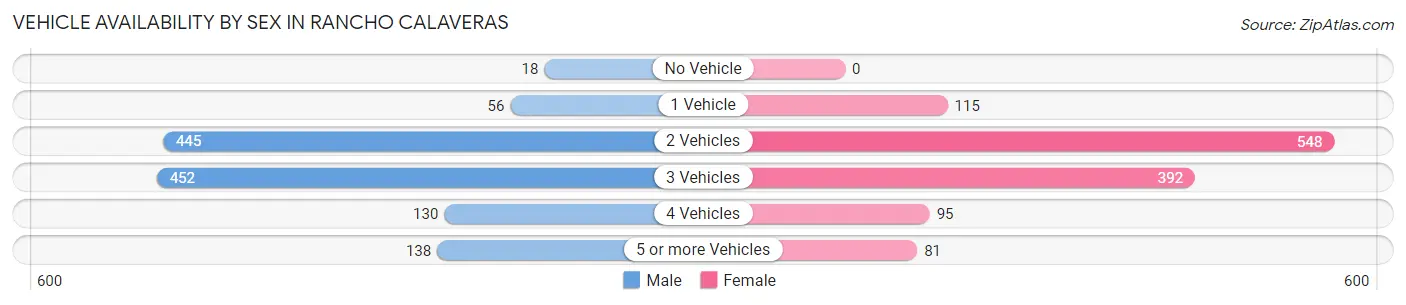
| Vehicles Available | Male | Female |
| No Vehicle | 18 (1.5%) | 0 (0.0%) |
| 1 Vehicle | 56 (4.5%) | 115 (9.3%) |
| 2 Vehicles | 445 (35.9%) | 548 (44.5%) |
| 3 Vehicles | 452 (36.5%) | 392 (31.8%) |
| 4 Vehicles | 130 (10.5%) | 95 (7.7%) |
| 5 or more Vehicles | 138 (11.1%) | 81 (6.6%) |
| Total | 1,239 (100.0%) | 1,231 (100.0%) |
Commute Time in Rancho Calaveras
The most frequently occuring commute durations in Rancho Calaveras are 45 to 59 minutes (438 commuters, 19.9%), 60 to 89 minutes (424 commuters, 19.2%), and 40 to 44 minutes (324 commuters, 14.7%).
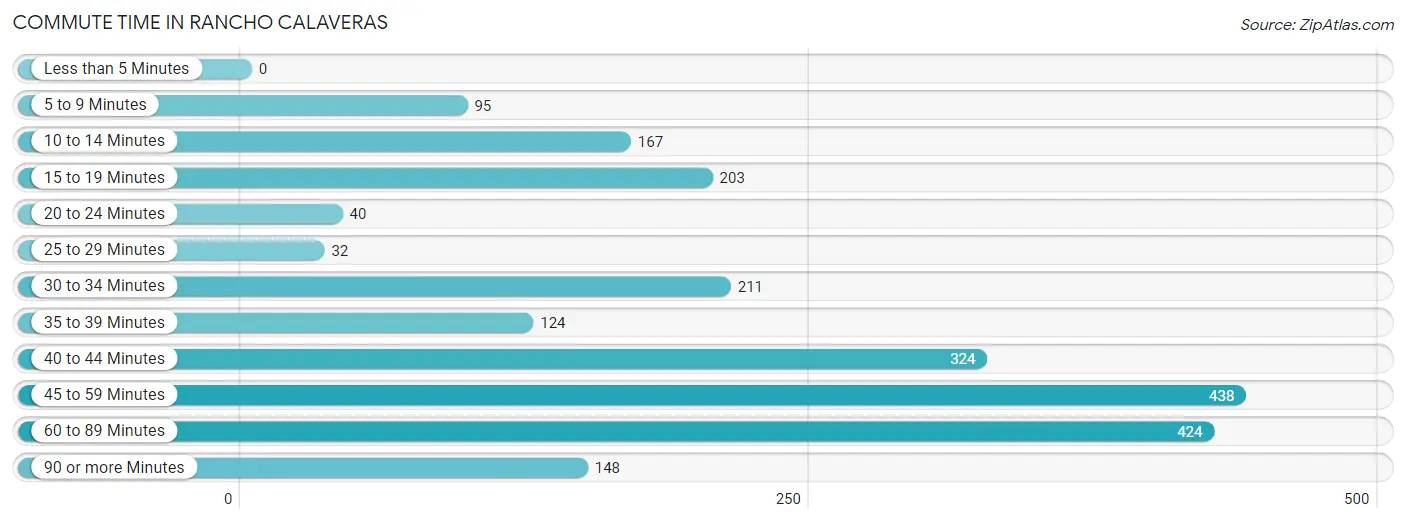
| Commute Time | # Commuters | % Commuters |
| Less than 5 Minutes | 0 | 0.0% |
| 5 to 9 Minutes | 95 | 4.3% |
| 10 to 14 Minutes | 167 | 7.6% |
| 15 to 19 Minutes | 203 | 9.2% |
| 20 to 24 Minutes | 40 | 1.8% |
| 25 to 29 Minutes | 32 | 1.5% |
| 30 to 34 Minutes | 211 | 9.6% |
| 35 to 39 Minutes | 124 | 5.6% |
| 40 to 44 Minutes | 324 | 14.7% |
| 45 to 59 Minutes | 438 | 19.9% |
| 60 to 89 Minutes | 424 | 19.2% |
| 90 or more Minutes | 148 | 6.7% |
Commute Time by Sex in Rancho Calaveras
The most common commute times in Rancho Calaveras are 60 to 89 minutes (250 commuters, 21.9%) for males and 45 to 59 minutes (285 commuters, 26.8%) for females.
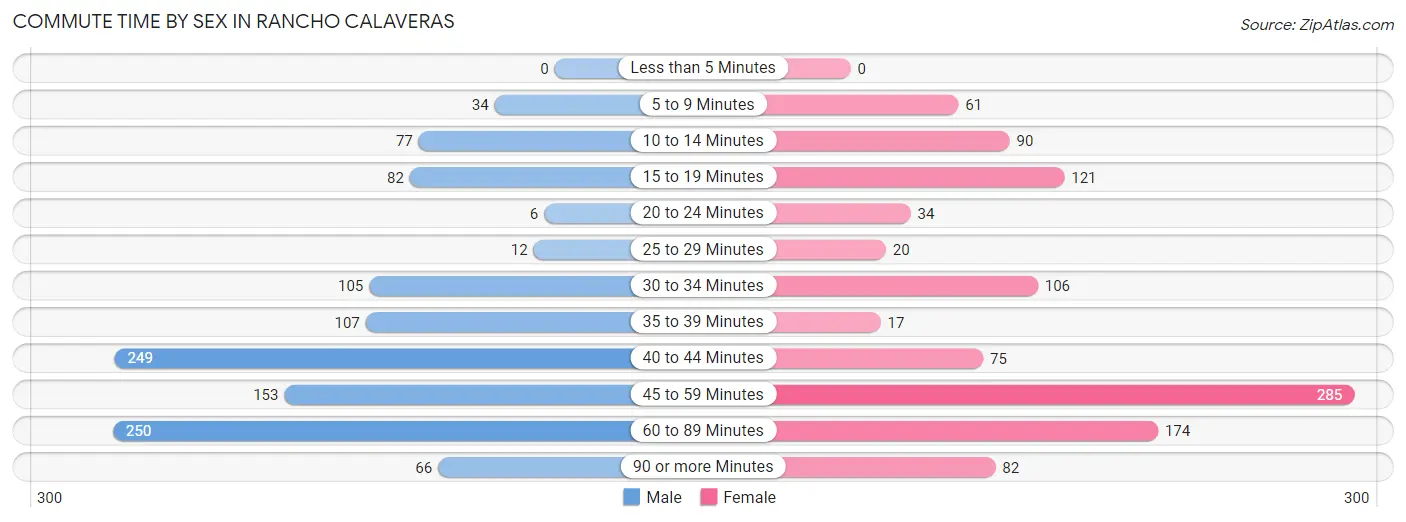
| Commute Time | Male | Female |
| Less than 5 Minutes | 0 (0.0%) | 0 (0.0%) |
| 5 to 9 Minutes | 34 (3.0%) | 61 (5.7%) |
| 10 to 14 Minutes | 77 (6.8%) | 90 (8.5%) |
| 15 to 19 Minutes | 82 (7.2%) | 121 (11.4%) |
| 20 to 24 Minutes | 6 (0.5%) | 34 (3.2%) |
| 25 to 29 Minutes | 12 (1.1%) | 20 (1.9%) |
| 30 to 34 Minutes | 105 (9.2%) | 106 (10.0%) |
| 35 to 39 Minutes | 107 (9.4%) | 17 (1.6%) |
| 40 to 44 Minutes | 249 (21.8%) | 75 (7.0%) |
| 45 to 59 Minutes | 153 (13.4%) | 285 (26.8%) |
| 60 to 89 Minutes | 250 (21.9%) | 174 (16.3%) |
| 90 or more Minutes | 66 (5.8%) | 82 (7.7%) |
Time of Departure to Work by Sex in Rancho Calaveras
The most frequent times of departure to work in Rancho Calaveras are 12:00 AM to 4:59 AM (367, 32.2%) for males and 7:00 AM to 7:29 AM (296, 27.8%) for females.
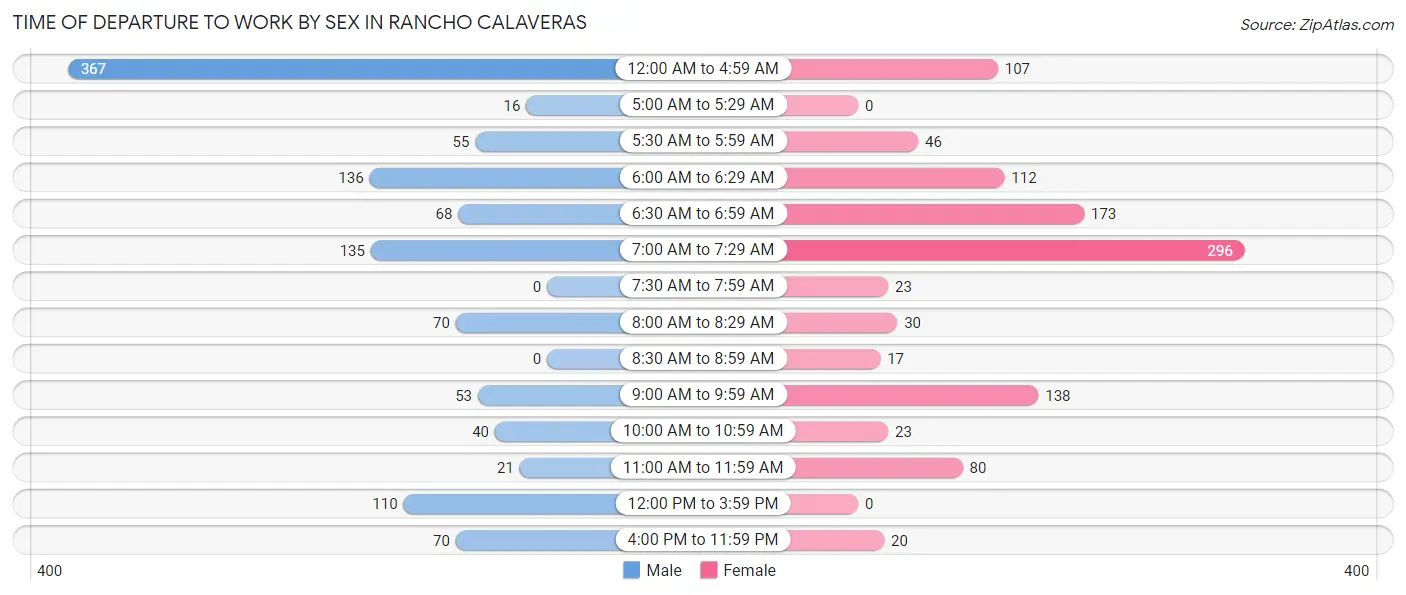
| Time of Departure | Male | Female |
| 12:00 AM to 4:59 AM | 367 (32.2%) | 107 (10.1%) |
| 5:00 AM to 5:29 AM | 16 (1.4%) | 0 (0.0%) |
| 5:30 AM to 5:59 AM | 55 (4.8%) | 46 (4.3%) |
| 6:00 AM to 6:29 AM | 136 (11.9%) | 112 (10.5%) |
| 6:30 AM to 6:59 AM | 68 (6.0%) | 173 (16.2%) |
| 7:00 AM to 7:29 AM | 135 (11.8%) | 296 (27.8%) |
| 7:30 AM to 7:59 AM | 0 (0.0%) | 23 (2.2%) |
| 8:00 AM to 8:29 AM | 70 (6.1%) | 30 (2.8%) |
| 8:30 AM to 8:59 AM | 0 (0.0%) | 17 (1.6%) |
| 9:00 AM to 9:59 AM | 53 (4.6%) | 138 (13.0%) |
| 10:00 AM to 10:59 AM | 40 (3.5%) | 23 (2.2%) |
| 11:00 AM to 11:59 AM | 21 (1.8%) | 80 (7.5%) |
| 12:00 PM to 3:59 PM | 110 (9.6%) | 0 (0.0%) |
| 4:00 PM to 11:59 PM | 70 (6.1%) | 20 (1.9%) |
| Total | 1,141 (100.0%) | 1,065 (100.0%) |
Housing Occupancy in Rancho Calaveras
Occupancy by Ownership in Rancho Calaveras
Of the total 2,135 dwellings in Rancho Calaveras, owner-occupied units account for 1,935 (90.6%), while renter-occupied units make up 200 (9.4%).
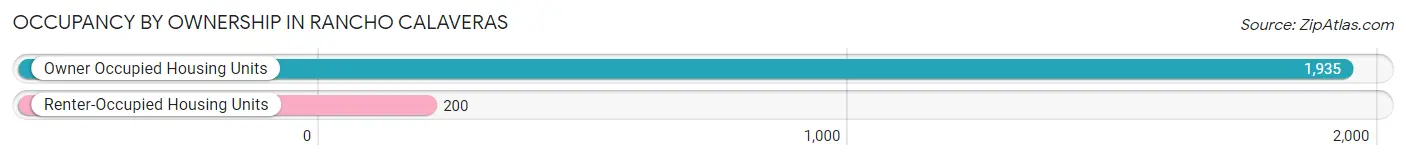
| Occupancy | # Housing Units | % Housing Units |
| Owner Occupied Housing Units | 1,935 | 90.6% |
| Renter-Occupied Housing Units | 200 | 9.4% |
| Total Occupied Housing Units | 2,135 | 100.0% |
Occupancy by Household Size in Rancho Calaveras
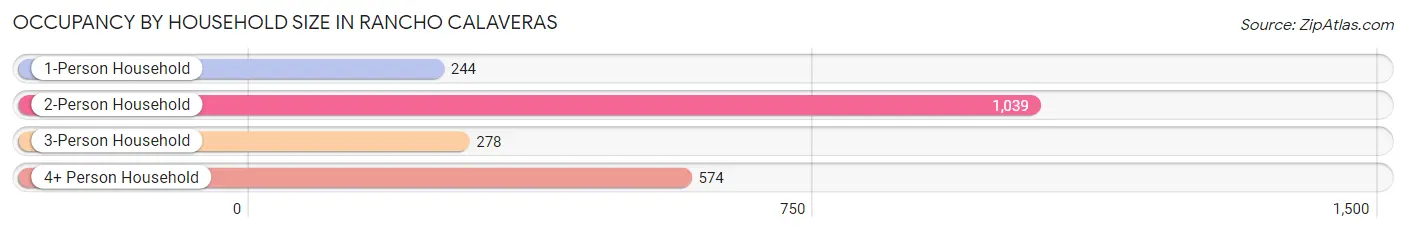
| Household Size | # Housing Units | % Housing Units |
| 1-Person Household | 244 | 11.4% |
| 2-Person Household | 1,039 | 48.7% |
| 3-Person Household | 278 | 13.0% |
| 4+ Person Household | 574 | 26.9% |
| Total Housing Units | 2,135 | 100.0% |
Occupancy by Ownership by Household Size in Rancho Calaveras
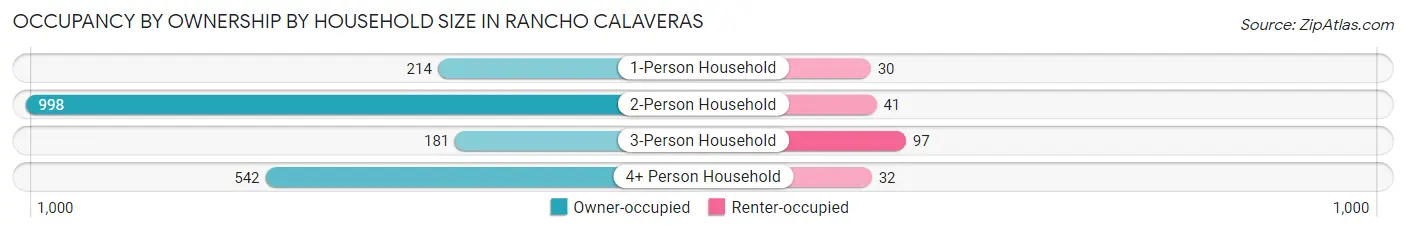
| Household Size | Owner-occupied | Renter-occupied |
| 1-Person Household | 214 (87.7%) | 30 (12.3%) |
| 2-Person Household | 998 (96.1%) | 41 (4.0%) |
| 3-Person Household | 181 (65.1%) | 97 (34.9%) |
| 4+ Person Household | 542 (94.4%) | 32 (5.6%) |
| Total Housing Units | 1,935 (90.6%) | 200 (9.4%) |
Occupancy by Educational Attainment in Rancho Calaveras
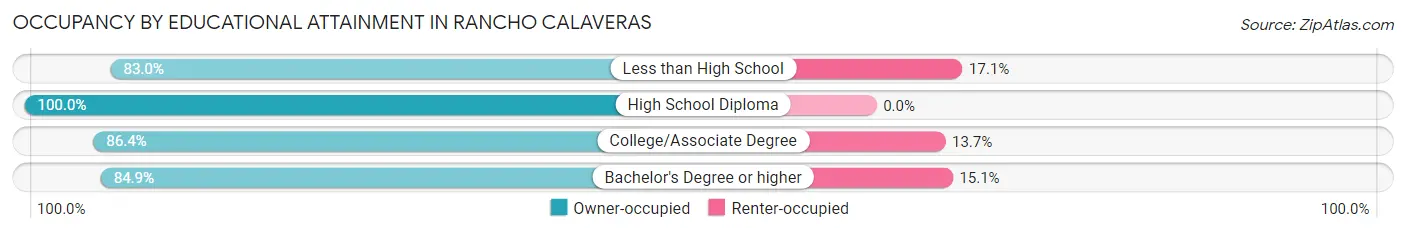
| Household Size | Owner-occupied | Renter-occupied |
| Less than High School | 73 (83.0%) | 15 (17.1%) |
| High School Diploma | 723 (100.0%) | 0 (0.0%) |
| College/Associate Degree | 892 (86.4%) | 141 (13.7%) |
| Bachelor's Degree or higher | 247 (84.9%) | 44 (15.1%) |
Occupancy by Age of Householder in Rancho Calaveras
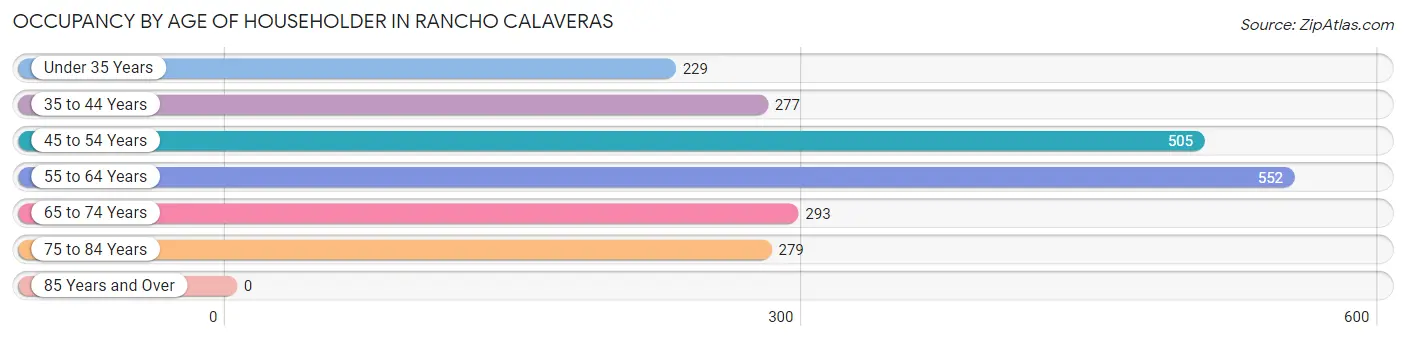
| Age Bracket | # Households | % Households |
| Under 35 Years | 229 | 10.7% |
| 35 to 44 Years | 277 | 13.0% |
| 45 to 54 Years | 505 | 23.6% |
| 55 to 64 Years | 552 | 25.9% |
| 65 to 74 Years | 293 | 13.7% |
| 75 to 84 Years | 279 | 13.1% |
| 85 Years and Over | 0 | 0.0% |
| Total | 2,135 | 100.0% |
Housing Finances in Rancho Calaveras
Median Income by Occupancy in Rancho Calaveras
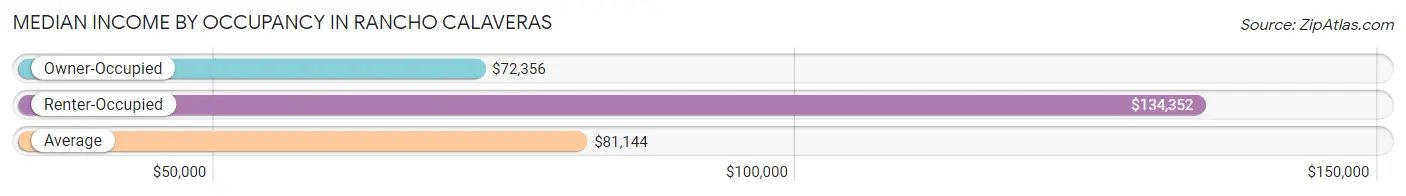
| Occupancy Type | # Households | Median Income |
| Owner-Occupied | 1,935 (90.6%) | $72,356 |
| Renter-Occupied | 200 (9.4%) | $134,352 |
| Average | 2,135 (100.0%) | $81,144 |
Occupancy by Householder Income Bracket in Rancho Calaveras
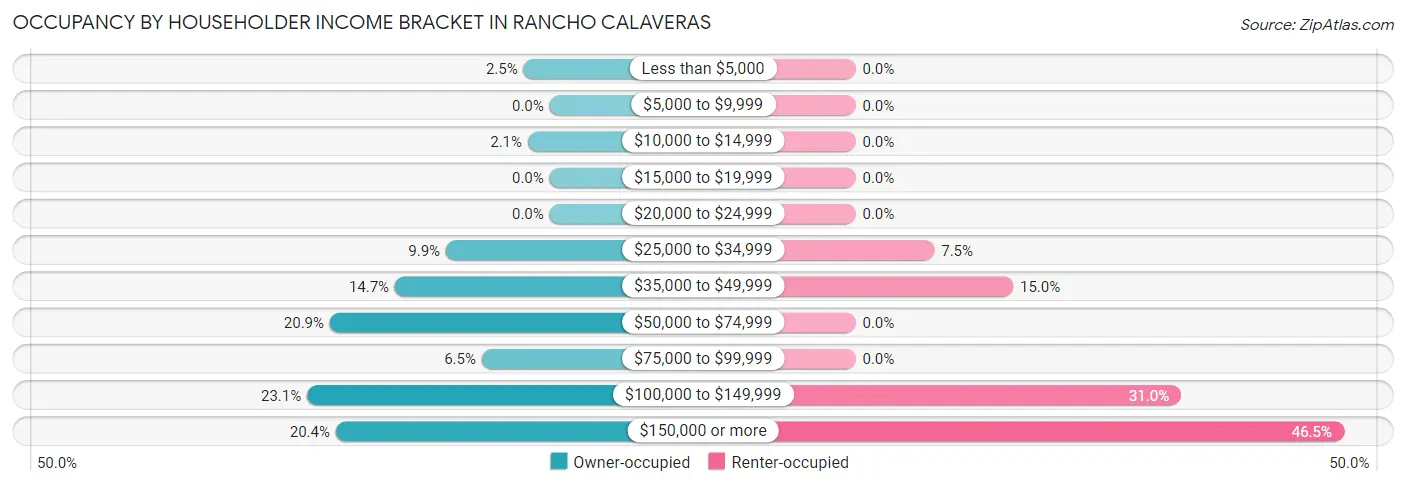
| Income Bracket | Owner-occupied | Renter-occupied |
| Less than $5,000 | 48 (2.5%) | 0 (0.0%) |
| $5,000 to $9,999 | 0 (0.0%) | 0 (0.0%) |
| $10,000 to $14,999 | 40 (2.1%) | 0 (0.0%) |
| $15,000 to $19,999 | 0 (0.0%) | 0 (0.0%) |
| $20,000 to $24,999 | 0 (0.0%) | 0 (0.0%) |
| $25,000 to $34,999 | 191 (9.9%) | 15 (7.5%) |
| $35,000 to $49,999 | 285 (14.7%) | 30 (15.0%) |
| $50,000 to $74,999 | 405 (20.9%) | 0 (0.0%) |
| $75,000 to $99,999 | 125 (6.5%) | 0 (0.0%) |
| $100,000 to $149,999 | 447 (23.1%) | 62 (31.0%) |
| $150,000 or more | 394 (20.4%) | 93 (46.5%) |
| Total | 1,935 (100.0%) | 200 (100.0%) |
Monthly Housing Cost Tiers in Rancho Calaveras
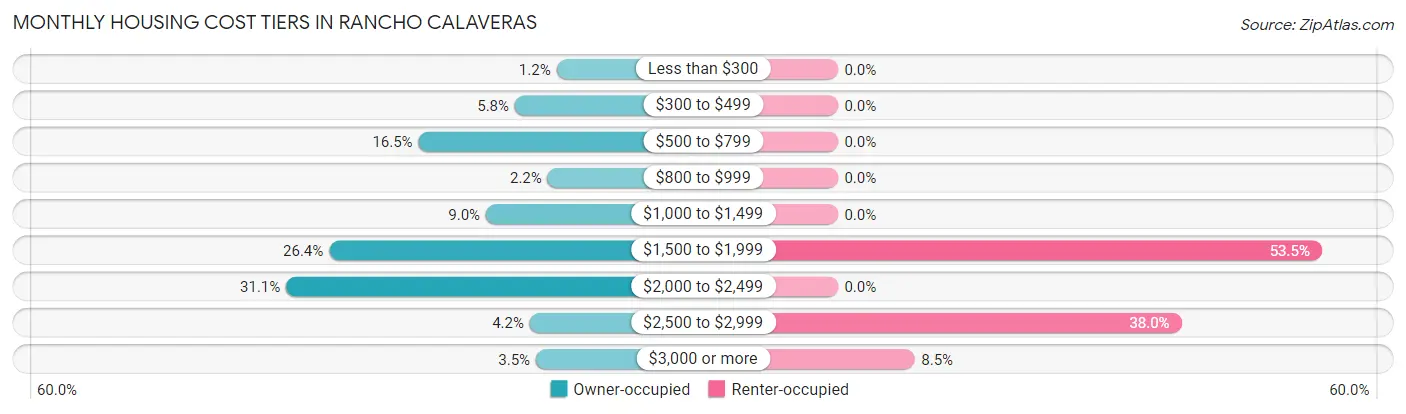
| Monthly Cost | Owner-occupied | Renter-occupied |
| Less than $300 | 24 (1.2%) | 0 (0.0%) |
| $300 to $499 | 113 (5.8%) | 0 (0.0%) |
| $500 to $799 | 319 (16.5%) | 0 (0.0%) |
| $800 to $999 | 43 (2.2%) | 0 (0.0%) |
| $1,000 to $1,499 | 175 (9.0%) | 0 (0.0%) |
| $1,500 to $1,999 | 510 (26.4%) | 107 (53.5%) |
| $2,000 to $2,499 | 602 (31.1%) | 0 (0.0%) |
| $2,500 to $2,999 | 81 (4.2%) | 76 (38.0%) |
| $3,000 or more | 68 (3.5%) | 17 (8.5%) |
| Total | 1,935 (100.0%) | 200 (100.0%) |
Physical Housing Characteristics in Rancho Calaveras
Housing Structures in Rancho Calaveras
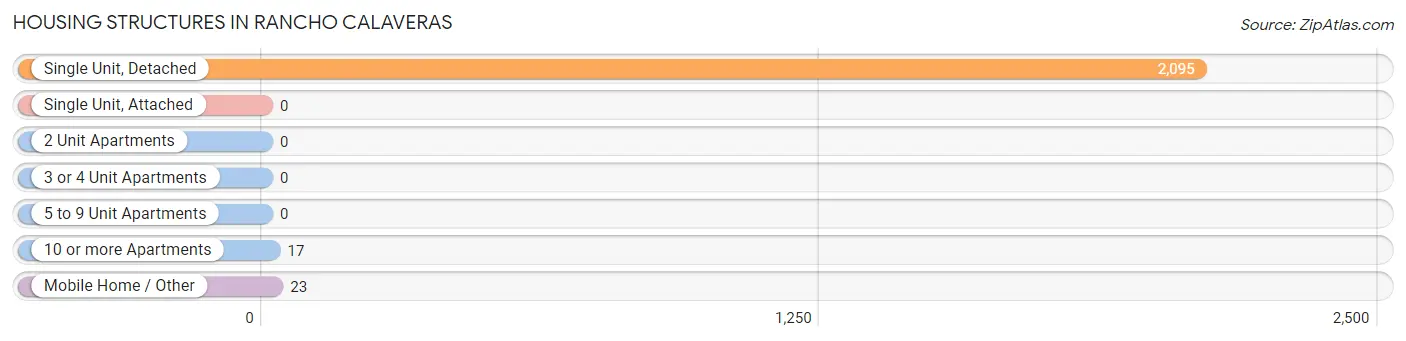
| Structure Type | # Housing Units | % Housing Units |
| Single Unit, Detached | 2,095 | 98.1% |
| Single Unit, Attached | 0 | 0.0% |
| 2 Unit Apartments | 0 | 0.0% |
| 3 or 4 Unit Apartments | 0 | 0.0% |
| 5 to 9 Unit Apartments | 0 | 0.0% |
| 10 or more Apartments | 17 | 0.8% |
| Mobile Home / Other | 23 | 1.1% |
| Total | 2,135 | 100.0% |
Housing Structures by Occupancy in Rancho Calaveras
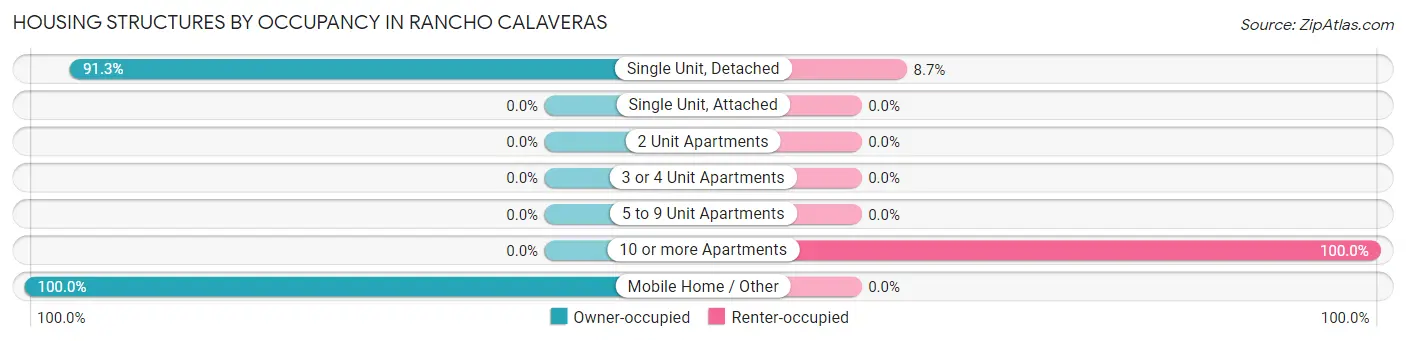
| Structure Type | Owner-occupied | Renter-occupied |
| Single Unit, Detached | 1,912 (91.3%) | 183 (8.7%) |
| Single Unit, Attached | 0 (0.0%) | 0 (0.0%) |
| 2 Unit Apartments | 0 (0.0%) | 0 (0.0%) |
| 3 or 4 Unit Apartments | 0 (0.0%) | 0 (0.0%) |
| 5 to 9 Unit Apartments | 0 (0.0%) | 0 (0.0%) |
| 10 or more Apartments | 0 (0.0%) | 17 (100.0%) |
| Mobile Home / Other | 23 (100.0%) | 0 (0.0%) |
| Total | 1,935 (90.6%) | 200 (9.4%) |
Housing Structures by Number of Rooms in Rancho Calaveras
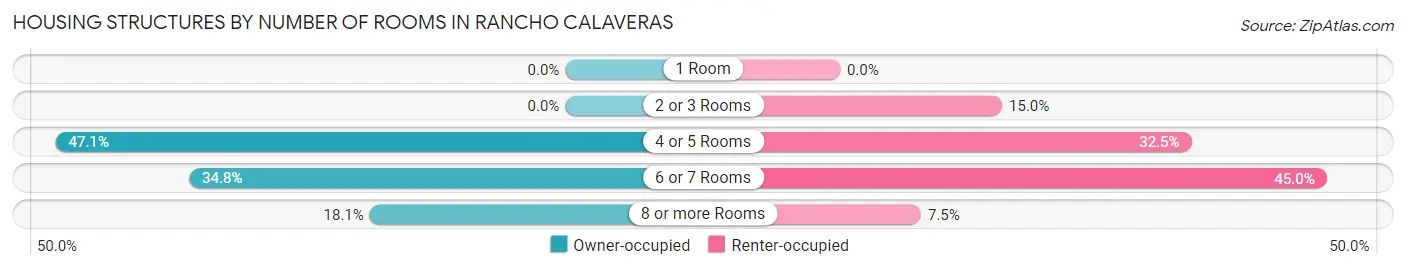
| Number of Rooms | Owner-occupied | Renter-occupied |
| 1 Room | 0 (0.0%) | 0 (0.0%) |
| 2 or 3 Rooms | 0 (0.0%) | 30 (15.0%) |
| 4 or 5 Rooms | 912 (47.1%) | 65 (32.5%) |
| 6 or 7 Rooms | 673 (34.8%) | 90 (45.0%) |
| 8 or more Rooms | 350 (18.1%) | 15 (7.5%) |
| Total | 1,935 (100.0%) | 200 (100.0%) |
Housing Structure by Heating Type in Rancho Calaveras
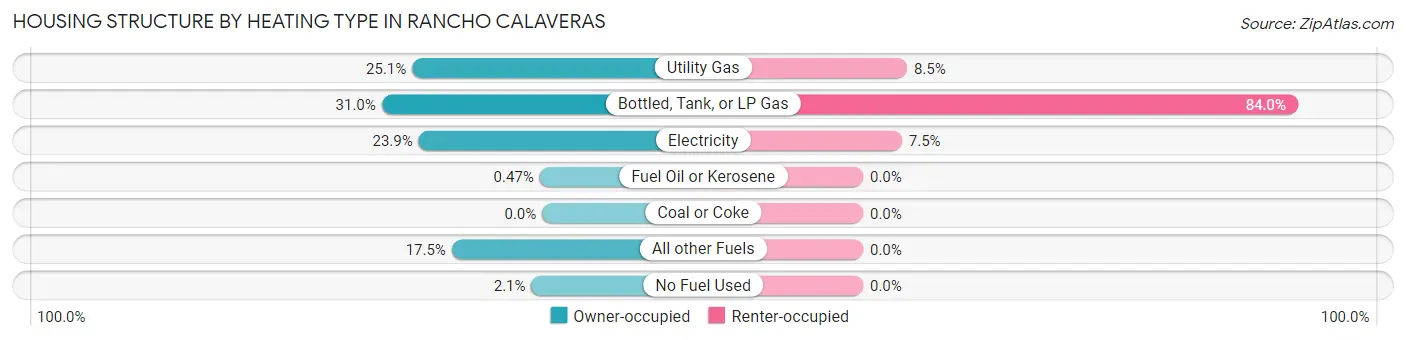
| Heating Type | Owner-occupied | Renter-occupied |
| Utility Gas | 486 (25.1%) | 17 (8.5%) |
| Bottled, Tank, or LP Gas | 600 (31.0%) | 168 (84.0%) |
| Electricity | 462 (23.9%) | 15 (7.5%) |
| Fuel Oil or Kerosene | 9 (0.5%) | 0 (0.0%) |
| Coal or Coke | 0 (0.0%) | 0 (0.0%) |
| All other Fuels | 338 (17.5%) | 0 (0.0%) |
| No Fuel Used | 40 (2.1%) | 0 (0.0%) |
| Total | 1,935 (100.0%) | 200 (100.0%) |
Household Vehicle Usage in Rancho Calaveras
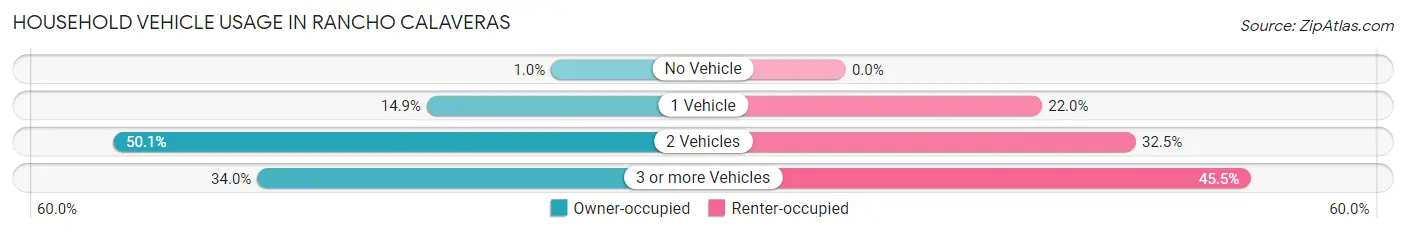
| Vehicles per Household | Owner-occupied | Renter-occupied |
| No Vehicle | 20 (1.0%) | 0 (0.0%) |
| 1 Vehicle | 289 (14.9%) | 44 (22.0%) |
| 2 Vehicles | 969 (50.1%) | 65 (32.5%) |
| 3 or more Vehicles | 657 (34.0%) | 91 (45.5%) |
| Total | 1,935 (100.0%) | 200 (100.0%) |
Real Estate & Mortgages in Rancho Calaveras
Real Estate and Mortgage Overview in Rancho Calaveras
| Characteristic | Without Mortgage | With Mortgage |
| Housing Units | 600 | 1,335 |
| Median Property Value | $413,900 | $383,800 |
| Median Household Income | $64,390 | $242 |
| Monthly Housing Costs | $686 | $68 |
| Real Estate Taxes | $3,153 | $28 |
Property Value by Mortgage Status in Rancho Calaveras
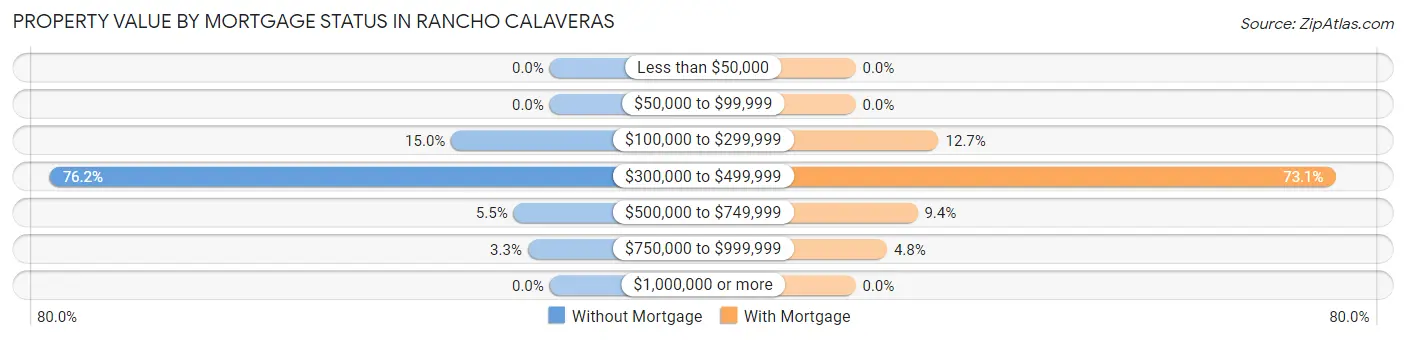
| Property Value | Without Mortgage | With Mortgage |
| Less than $50,000 | 0 (0.0%) | 0 (0.0%) |
| $50,000 to $99,999 | 0 (0.0%) | 0 (0.0%) |
| $100,000 to $299,999 | 90 (15.0%) | 169 (12.7%) |
| $300,000 to $499,999 | 457 (76.2%) | 976 (73.1%) |
| $500,000 to $749,999 | 33 (5.5%) | 126 (9.4%) |
| $750,000 to $999,999 | 20 (3.3%) | 64 (4.8%) |
| $1,000,000 or more | 0 (0.0%) | 0 (0.0%) |
| Total | 600 (100.0%) | 1,335 (100.0%) |
Household Income by Mortgage Status in Rancho Calaveras
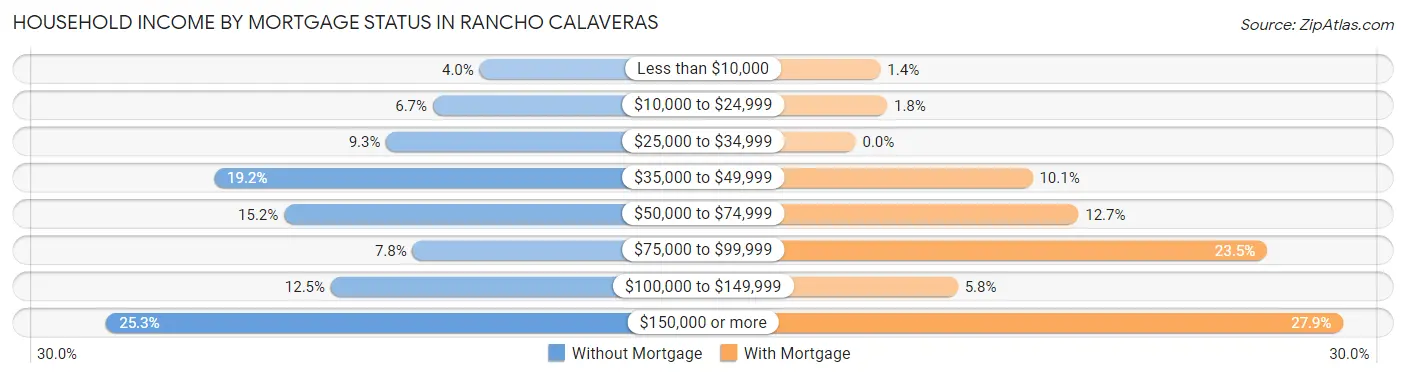
| Household Income | Without Mortgage | With Mortgage |
| Less than $10,000 | 24 (4.0%) | 19 (1.4%) |
| $10,000 to $24,999 | 40 (6.7%) | 24 (1.8%) |
| $25,000 to $34,999 | 56 (9.3%) | 0 (0.0%) |
| $35,000 to $49,999 | 115 (19.2%) | 135 (10.1%) |
| $50,000 to $74,999 | 91 (15.2%) | 170 (12.7%) |
| $75,000 to $99,999 | 47 (7.8%) | 314 (23.5%) |
| $100,000 to $149,999 | 75 (12.5%) | 78 (5.8%) |
| $150,000 or more | 152 (25.3%) | 372 (27.9%) |
| Total | 600 (100.0%) | 1,335 (100.0%) |
Property Value to Household Income Ratio in Rancho Calaveras
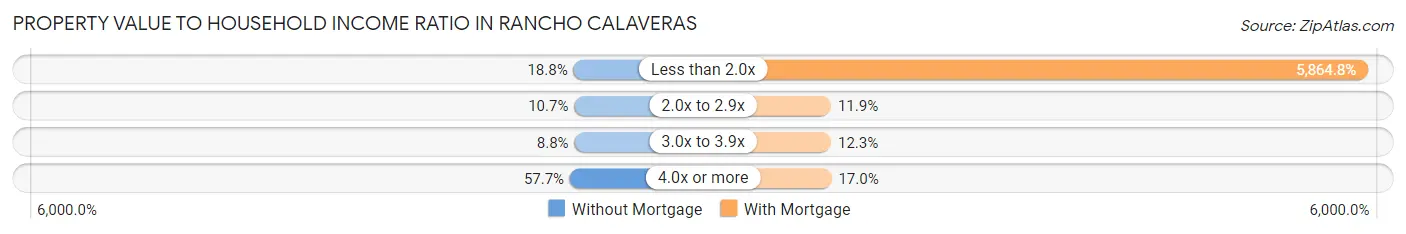
| Value-to-Income Ratio | Without Mortgage | With Mortgage |
| Less than 2.0x | 113 (18.8%) | 78,295 (5,864.8%) |
| 2.0x to 2.9x | 64 (10.7%) | 159 (11.9%) |
| 3.0x to 3.9x | 53 (8.8%) | 164 (12.3%) |
| 4.0x or more | 346 (57.7%) | 227 (17.0%) |
| Total | 600 (100.0%) | 1,335 (100.0%) |
Real Estate Taxes by Mortgage Status in Rancho Calaveras
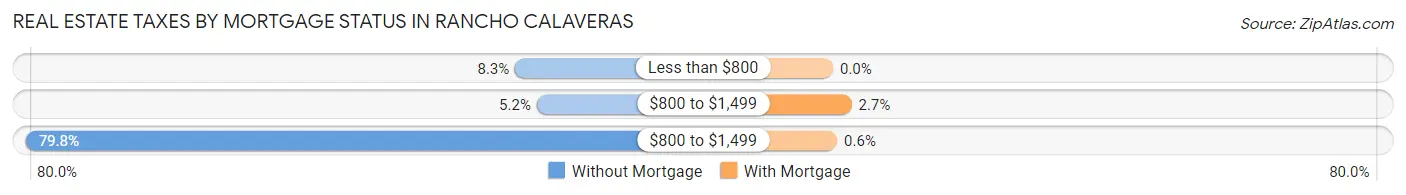
| Property Taxes | Without Mortgage | With Mortgage |
| Less than $800 | 50 (8.3%) | 0 (0.0%) |
| $800 to $1,499 | 31 (5.2%) | 36 (2.7%) |
| $800 to $1,499 | 479 (79.8%) | 8 (0.6%) |
| Total | 600 (100.0%) | 1,335 (100.0%) |
Health & Disability in Rancho Calaveras
Health Insurance Coverage by Age in Rancho Calaveras
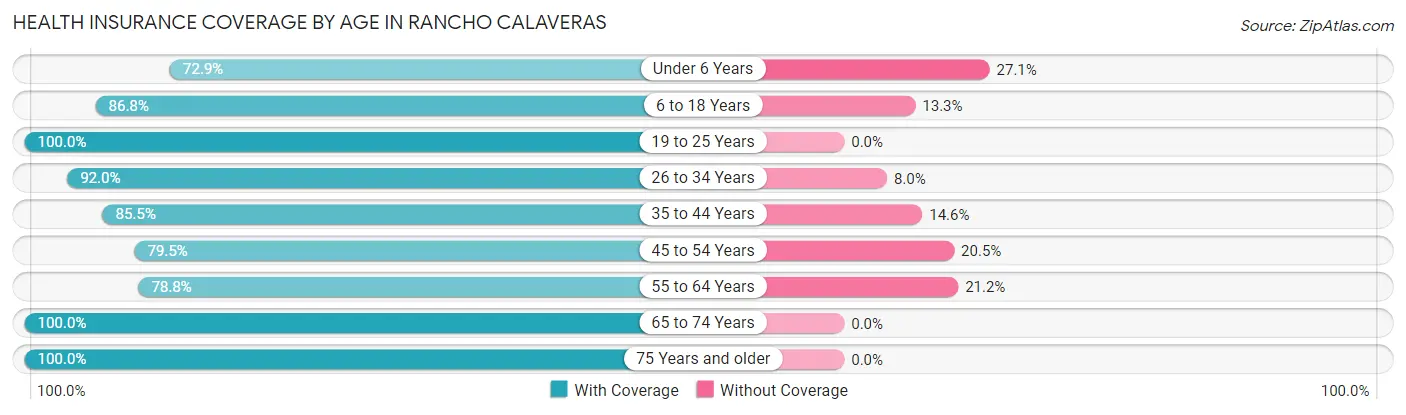
| Age Bracket | With Coverage | Without Coverage |
| Under 6 Years | 374 (72.9%) | 139 (27.1%) |
| 6 to 18 Years | 727 (86.8%) | 111 (13.3%) |
| 19 to 25 Years | 488 (100.0%) | 0 (0.0%) |
| 26 to 34 Years | 393 (92.0%) | 34 (8.0%) |
| 35 to 44 Years | 558 (85.5%) | 95 (14.5%) |
| 45 to 54 Years | 873 (79.5%) | 225 (20.5%) |
| 55 to 64 Years | 775 (78.8%) | 209 (21.2%) |
| 65 to 74 Years | 614 (100.0%) | 0 (0.0%) |
| 75 Years and older | 474 (100.0%) | 0 (0.0%) |
| Total | 5,276 (86.7%) | 813 (13.4%) |
Health Insurance Coverage by Citizenship Status in Rancho Calaveras
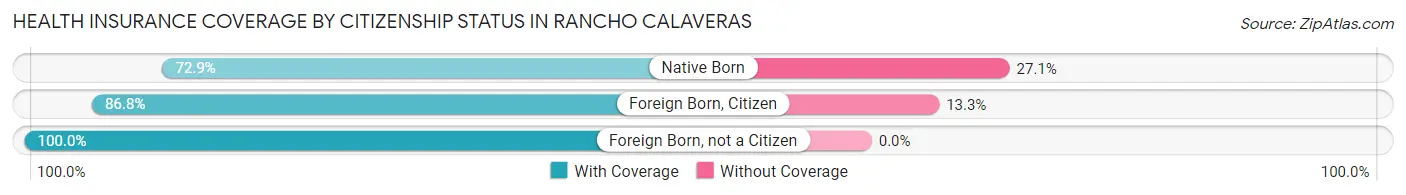
| Citizenship Status | With Coverage | Without Coverage |
| Native Born | 374 (72.9%) | 139 (27.1%) |
| Foreign Born, Citizen | 727 (86.8%) | 111 (13.3%) |
| Foreign Born, not a Citizen | 488 (100.0%) | 0 (0.0%) |
Health Insurance Coverage by Household Income in Rancho Calaveras
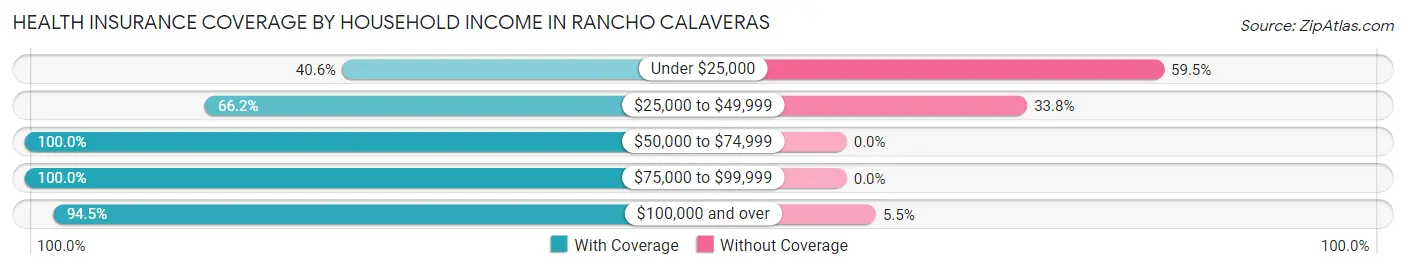
| Household Income | With Coverage | Without Coverage |
| Under $25,000 | 88 (40.6%) | 129 (59.5%) |
| $25,000 to $49,999 | 1,012 (66.2%) | 517 (33.8%) |
| $50,000 to $74,999 | 996 (100.0%) | 0 (0.0%) |
| $75,000 to $99,999 | 280 (100.0%) | 0 (0.0%) |
| $100,000 and over | 2,892 (94.5%) | 167 (5.5%) |
Public vs Private Health Insurance Coverage by Age in Rancho Calaveras
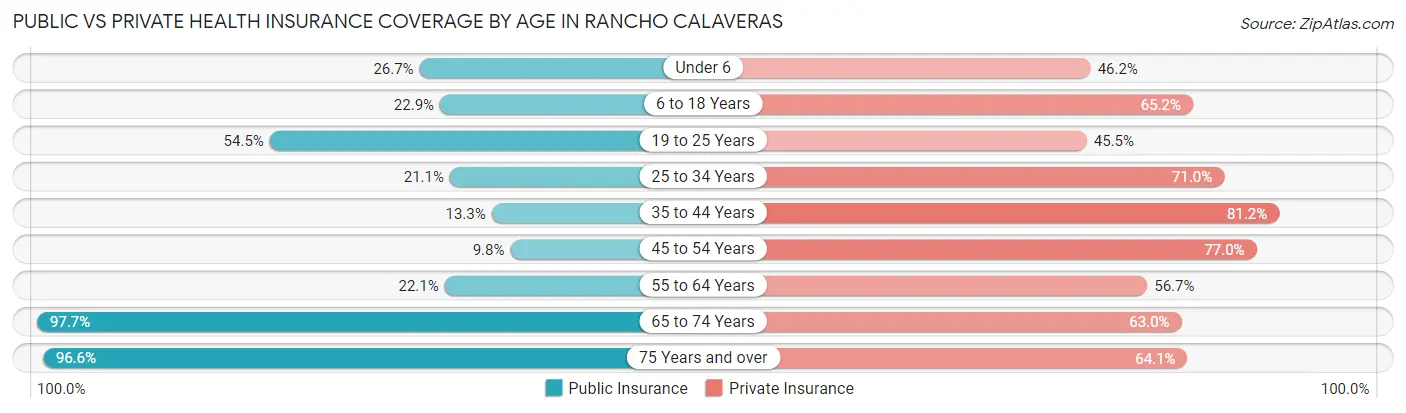
| Age Bracket | Public Insurance | Private Insurance |
| Under 6 | 137 (26.7%) | 237 (46.2%) |
| 6 to 18 Years | 192 (22.9%) | 546 (65.2%) |
| 19 to 25 Years | 266 (54.5%) | 222 (45.5%) |
| 25 to 34 Years | 90 (21.1%) | 303 (71.0%) |
| 35 to 44 Years | 87 (13.3%) | 530 (81.2%) |
| 45 to 54 Years | 108 (9.8%) | 845 (77.0%) |
| 55 to 64 Years | 217 (22.1%) | 558 (56.7%) |
| 65 to 74 Years | 600 (97.7%) | 387 (63.0%) |
| 75 Years and over | 458 (96.6%) | 304 (64.1%) |
| Total | 2,155 (35.4%) | 3,932 (64.6%) |
Disability Status by Sex by Age in Rancho Calaveras
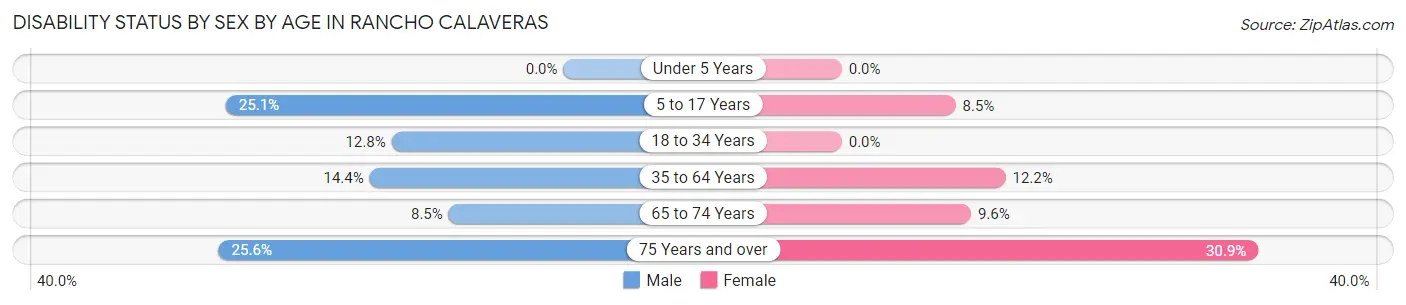
| Age Bracket | Male | Female |
| Under 5 Years | 0 (0.0%) | 0 (0.0%) |
| 5 to 17 Years | 129 (25.1%) | 42 (8.5%) |
| 18 to 34 Years | 68 (12.8%) | 0 (0.0%) |
| 35 to 64 Years | 190 (14.4%) | 172 (12.2%) |
| 65 to 74 Years | 23 (8.5%) | 33 (9.6%) |
| 75 Years and over | 65 (25.6%) | 68 (30.9%) |
Disability Class by Sex by Age in Rancho Calaveras
Disability Class: Hearing Difficulty
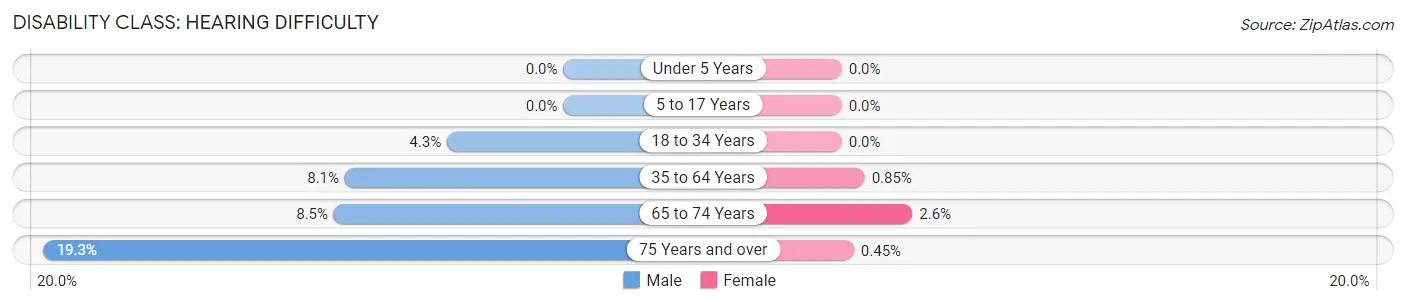
| Age Bracket | Male | Female |
| Under 5 Years | 0 (0.0%) | 0 (0.0%) |
| 5 to 17 Years | 0 (0.0%) | 0 (0.0%) |
| 18 to 34 Years | 23 (4.3%) | 0 (0.0%) |
| 35 to 64 Years | 107 (8.1%) | 12 (0.9%) |
| 65 to 74 Years | 23 (8.5%) | 9 (2.6%) |
| 75 Years and over | 49 (19.3%) | 1 (0.4%) |
Disability Class: Vision Difficulty
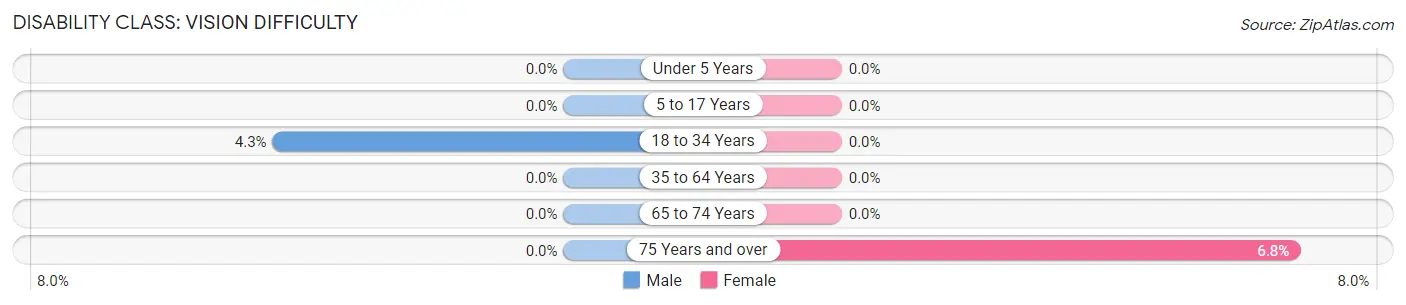
| Age Bracket | Male | Female |
| Under 5 Years | 0 (0.0%) | 0 (0.0%) |
| 5 to 17 Years | 0 (0.0%) | 0 (0.0%) |
| 18 to 34 Years | 23 (4.3%) | 0 (0.0%) |
| 35 to 64 Years | 0 (0.0%) | 0 (0.0%) |
| 65 to 74 Years | 0 (0.0%) | 0 (0.0%) |
| 75 Years and over | 0 (0.0%) | 15 (6.8%) |
Disability Class: Cognitive Difficulty
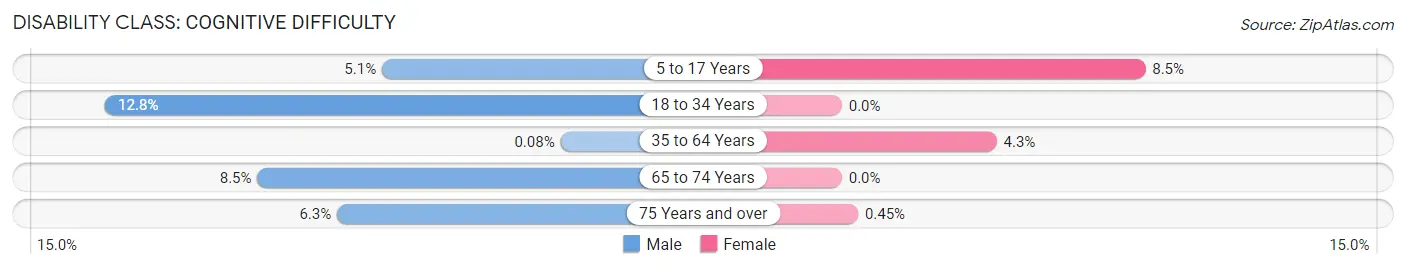
| Age Bracket | Male | Female |
| 5 to 17 Years | 26 (5.1%) | 42 (8.5%) |
| 18 to 34 Years | 68 (12.8%) | 0 (0.0%) |
| 35 to 64 Years | 1 (0.1%) | 61 (4.3%) |
| 65 to 74 Years | 23 (8.5%) | 0 (0.0%) |
| 75 Years and over | 16 (6.3%) | 1 (0.4%) |
Disability Class: Ambulatory Difficulty
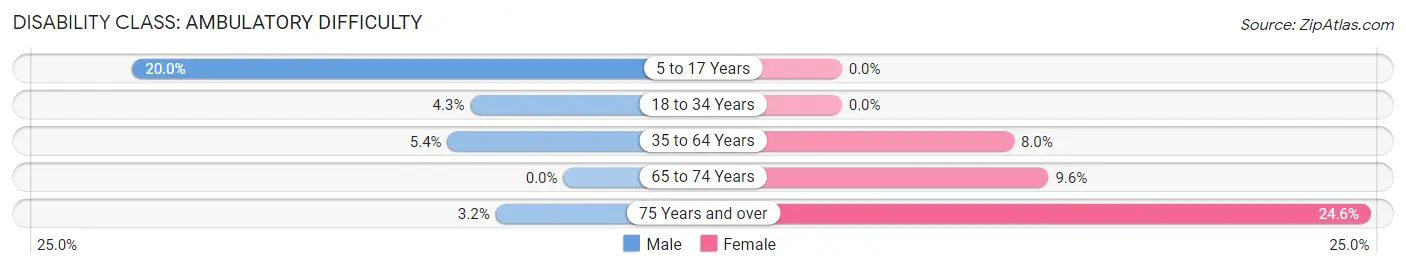
| Age Bracket | Male | Female |
| 5 to 17 Years | 103 (20.0%) | 0 (0.0%) |
| 18 to 34 Years | 23 (4.3%) | 0 (0.0%) |
| 35 to 64 Years | 71 (5.4%) | 113 (8.0%) |
| 65 to 74 Years | 0 (0.0%) | 33 (9.6%) |
| 75 Years and over | 8 (3.2%) | 54 (24.5%) |
Disability Class: Self-Care Difficulty
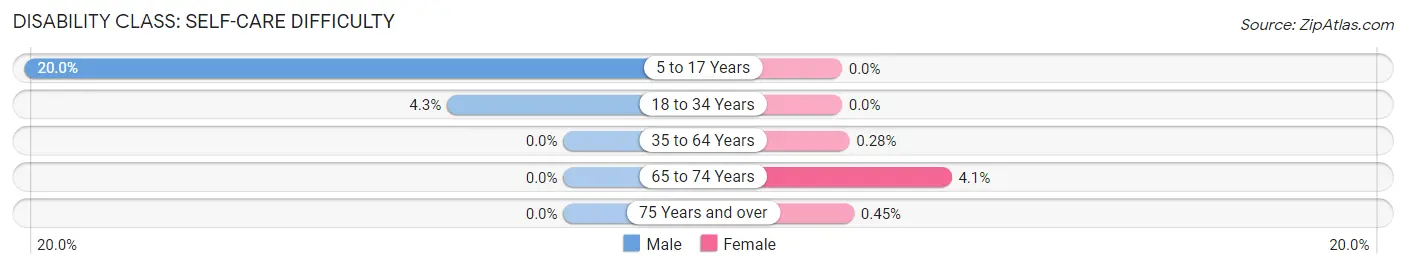
| Age Bracket | Male | Female |
| 5 to 17 Years | 103 (20.0%) | 0 (0.0%) |
| 18 to 34 Years | 23 (4.3%) | 0 (0.0%) |
| 35 to 64 Years | 0 (0.0%) | 4 (0.3%) |
| 65 to 74 Years | 0 (0.0%) | 14 (4.1%) |
| 75 Years and over | 0 (0.0%) | 1 (0.4%) |
Technology Access in Rancho Calaveras
Computing Device Access in Rancho Calaveras
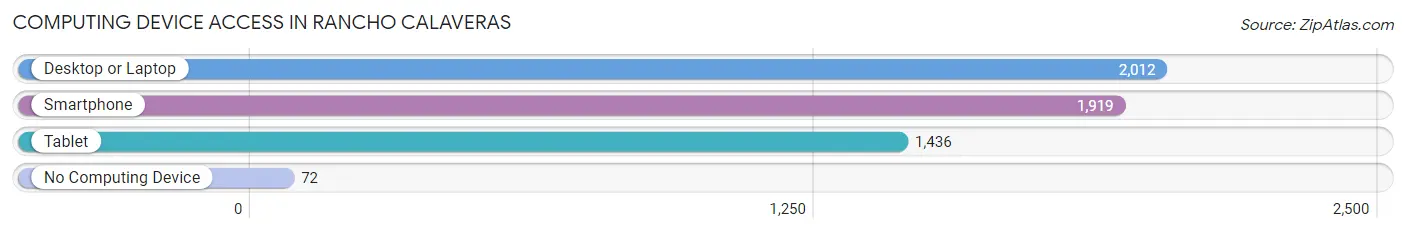
| Device Type | # Households | % Households |
| Desktop or Laptop | 2,012 | 94.2% |
| Smartphone | 1,919 | 89.9% |
| Tablet | 1,436 | 67.3% |
| No Computing Device | 72 | 3.4% |
| Total | 2,135 | 100.0% |
Internet Access in Rancho Calaveras
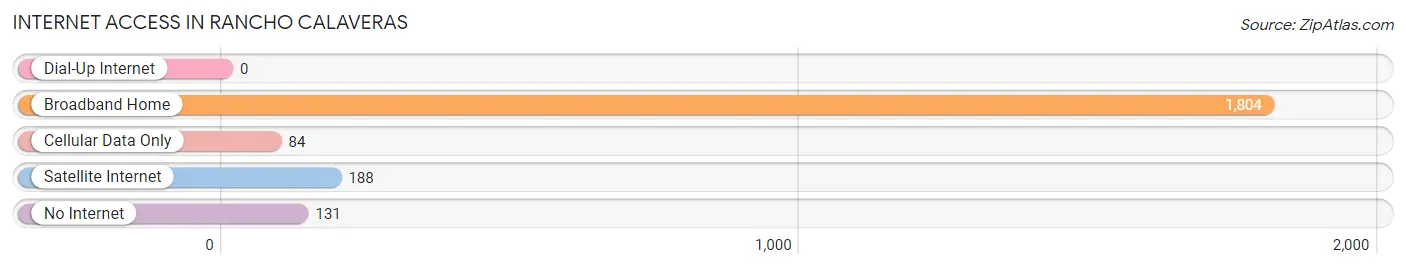
| Internet Type | # Households | % Households |
| Dial-Up Internet | 0 | 0.0% |
| Broadband Home | 1,804 | 84.5% |
| Cellular Data Only | 84 | 3.9% |
| Satellite Internet | 188 | 8.8% |
| No Internet | 131 | 6.1% |
| Total | 2,135 | 100.0% |
Rancho Calaveras Summary
Rancho Calaveras is a census-designated place (CDP) located in Calaveras County, California, United States. The population was 4,845 at the 2010 census, up from 4,717 at the 2000 census. It is located in the foothills of the Sierra Nevada mountain range, approximately 8 miles (13 km) east of the city of Angels Camp.
History
Rancho Calaveras was originally part of the Rancho Calaveras Mexican land grant, which was granted to Jose Maria Amador in 1844. The grant encompassed an area of approximately 8,846 acres (35.9 km2). The land was used for cattle grazing and farming.
In the late 1800s, the area was settled by miners and ranchers. The town of Rancho Calaveras was established in the early 1900s. The town was named after the original Mexican land grant.
Geography
Rancho Calaveras is located at 38 10 17 N 120 37 17 W 38 171445 120 621445
According to the United States Census Bureau, the CDP has a total area of 8.3 square miles (21.5 km2), all of it land.
Economy
Rancho Calaveras is primarily a rural community, with most of its residents employed in the agricultural and tourism industries. The area is known for its apple orchards, vineyards, and wineries. The area also has a number of small businesses, including restaurants, gas stations, and convenience stores.
Demographics
As of the census of 2000, there were 4,717 people, 1,717 households, and 1,310 families residing in the CDP. The population density was 568.2 people per square mile (219.7/km2). There were 1,817 housing units at an average density of 220.2 per square mile (85.1/km2). The racial makeup of the CDP was 87.2% White, 0.7% African American, 1.2% Native American, 0.7% Asian, 0.1% Pacific Islander, 7.2% from other races, and 3.0% from two or more races. Hispanic or Latino of any race were 14.2% of the population.
There were 1,717 households, out of which 37.2% had children under the age of 18 living with them, 58.2% were married couples living together, 10.7% had a female householder with no husband present, and 25.7% were non-families. 20.2% of all households were made up of individuals, and 8.2% had someone living alone who was 65 years of age or older. The average household size was 2.75 and the average family size was 3.17.
In the CDP, the population was spread out, with 28.2% under the age of 18, 7.2% from 18 to 24, 28.2% from 25 to 44, 24.2% from 45 to 64, and 12.2% who were 65 years of age or older. The median age was 37 years. For every 100 females, there were 97.2 males. For every 100 females age 18 and over, there were 94.2 males.
The median income for a household in the CDP was $45,938, and the median income for a family was $50,000. Males had a median income of $41,250 versus $27,500 for females. The per capita income for the CDP was $19,945. About 8.2% of families and 10.2% of the population were below the poverty line, including 13.2% of those under age 18 and 4.2% of those age 65 or over.
Common Questions
What is Per Capita Income in Rancho Calaveras?
Per Capita income in Rancho Calaveras is $36,824.
What is the Median Family Income in Rancho Calaveras?
Median Family Income in Rancho Calaveras is $88,684.
What is the Median Household income in Rancho Calaveras?
Median Household Income in Rancho Calaveras is $81,144.
What is Income or Wage Gap in Rancho Calaveras?
Income or Wage Gap in Rancho Calaveras is 40.1%.
Women in Rancho Calaveras earn 59.9 cents for every dollar earned by a man.
What is Inequality or Gini Index in Rancho Calaveras?
Inequality or Gini Index in Rancho Calaveras is 0.40.
What is the Total Population of Rancho Calaveras?
Total Population of Rancho Calaveras is 6,089.
What is the Total Male Population of Rancho Calaveras?
Total Male Population of Rancho Calaveras is 3,074.
What is the Total Female Population of Rancho Calaveras?
Total Female Population of Rancho Calaveras is 3,015.
What is the Ratio of Males per 100 Females in Rancho Calaveras?
There are 101.96 Males per 100 Females in Rancho Calaveras.
What is the Ratio of Females per 100 Males in Rancho Calaveras?
There are 98.08 Females per 100 Males in Rancho Calaveras.
What is the Median Population Age in Rancho Calaveras?
Median Population Age in Rancho Calaveras is 46.0 Years.
What is the Average Family Size in Rancho Calaveras
Average Family Size in Rancho Calaveras is 3.0 People.
What is the Average Household Size in Rancho Calaveras
Average Household Size in Rancho Calaveras is 2.9 People.
How Large is the Labor Force in Rancho Calaveras?
There are 2,719 People in the Labor Forcein in Rancho Calaveras.
What is the Percentage of People in the Labor Force in Rancho Calaveras?
55.6% of People are in the Labor Force in Rancho Calaveras.
What is the Unemployment Rate in Rancho Calaveras?
Unemployment Rate in Rancho Calaveras is 6.5%.