Cities with the Highest Percentage of Population with a Degree in Science and Engineering in South Dakota
RELATED REPORTS & OPTIONS
Science and Engineering
South Dakota
Compare Cities
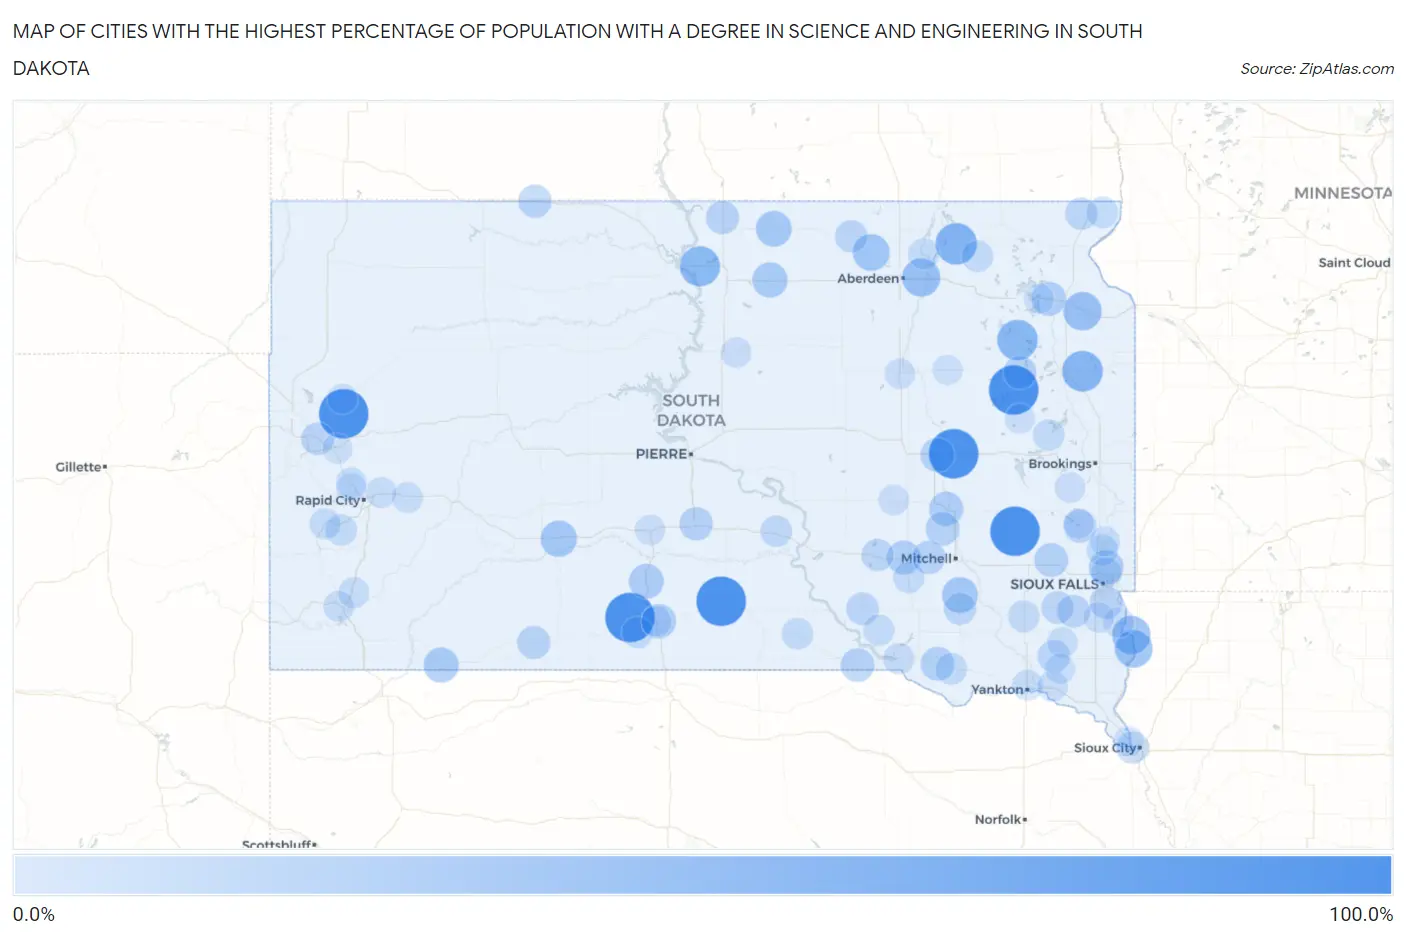
Map of Cities with the Highest Percentage of Population with a Degree in Science and Engineering in South Dakota
0.0%
100.0%
Cities with the Highest Percentage of Population with a Degree in Science and Engineering in South Dakota
| City | % Graduates | vs State | vs National | |
| 1. | Soldier Creek | 100.0% | 12.8%(+87.2)#1 | 9.8%(+90.2)#57 |
| 2. | Cavour | 100.0% | 12.8%(+87.2)#2 | 9.8%(+90.2)#90 |
| 3. | Canova | 100.0% | 12.8%(+87.2)#3 | 9.8%(+90.2)#106 |
| 4. | Vale | 100.0% | 12.8%(+87.2)#4 | 9.8%(+90.2)#138 |
| 5. | Naples | 100.0% | 12.8%(+87.2)#5 | 9.8%(+90.2)#149 |
| 6. | New Witten | 100.0% | 12.8%(+87.2)#6 | 9.8%(+90.2)#154 |
| 7. | Claremont | 64.3% | 12.8%(+51.5)#7 | 9.8%(+54.5)#356 |
| 8. | Kranzburg | 61.1% | 12.8%(+48.3)#8 | 9.8%(+51.3)#390 |
| 9. | Wallace | 60.0% | 12.8%(+47.2)#9 | 9.8%(+50.2)#415 |
| 10. | Glenham | 58.3% | 12.8%(+45.5)#10 | 9.8%(+48.6)#437 |
| 11. | West Brule | 50.0% | 12.8%(+37.2)#11 | 9.8%(+40.2)#551 |
| 12. | Fairview | 50.0% | 12.8%(+37.2)#12 | 9.8%(+40.2)#603 |
| 13. | Bath | 50.0% | 12.8%(+37.2)#13 | 9.8%(+40.2)#619 |
| 14. | Marvin | 50.0% | 12.8%(+37.2)#14 | 9.8%(+40.2)#636 |
| 15. | Hudson | 48.1% | 12.8%(+35.4)#15 | 9.8%(+38.4)#668 |
| 16. | Wetonka | 43.8% | 12.8%(+31.0)#16 | 9.8%(+34.0)#794 |
| 17. | Kadoka | 41.7% | 12.8%(+28.9)#17 | 9.8%(+31.9)#883 |
| 18. | Dimock | 40.0% | 12.8%(+27.2)#18 | 9.8%(+30.2)#976 |
| 19. | Eureka | 39.6% | 12.8%(+26.8)#19 | 9.8%(+29.8)#989 |
| 20. | Bowdle | 37.3% | 12.8%(+24.5)#20 | 9.8%(+27.5)#1,114 |
| 21. | Angostura | 37.0% | 12.8%(+24.3)#21 | 9.8%(+27.3)#1,123 |
| 22. | Pine Ridge | 36.8% | 12.8%(+24.1)#22 | 9.8%(+27.1)#1,126 |
| 23. | White River | 36.4% | 12.8%(+23.6)#23 | 9.8%(+26.6)#1,145 |
| 24. | Renner Corner | 35.3% | 12.8%(+22.5)#24 | 9.8%(+25.5)#1,216 |
| 25. | New Elm Spring Colony | 34.4% | 12.8%(+21.6)#25 | 9.8%(+24.6)#1,272 |
| 26. | Antelope | 34.1% | 12.8%(+21.3)#26 | 9.8%(+24.3)#1,288 |
| 27. | Ortley | 33.3% | 12.8%(+20.5)#27 | 9.8%(+23.6)#1,406 |
| 28. | Forestburg | 33.3% | 12.8%(+20.5)#28 | 9.8%(+23.6)#1,407 |
| 29. | Plankinton | 32.7% | 12.8%(+19.9)#29 | 9.8%(+22.9)#1,436 |
| 30. | Lyons | 32.3% | 12.8%(+19.5)#30 | 9.8%(+22.5)#1,463 |
| 31. | Morningside | 32.0% | 12.8%(+19.2)#31 | 9.8%(+22.2)#1,481 |
| 32. | Montrose | 31.8% | 12.8%(+19.0)#32 | 9.8%(+22.0)#1,499 |
| 33. | Dante | 31.2% | 12.8%(+18.5)#33 | 9.8%(+21.5)#1,551 |
| 34. | Letcher | 30.8% | 12.8%(+18.0)#34 | 9.8%(+21.0)#1,604 |
| 35. | Fairfax | 30.8% | 12.8%(+18.0)#35 | 9.8%(+21.0)#1,605 |
| 36. | Vivian | 30.0% | 12.8%(+17.2)#36 | 9.8%(+20.2)#1,689 |
| 37. | Herreid | 28.9% | 12.8%(+16.1)#37 | 9.8%(+19.1)#1,826 |
| 38. | Mount Vernon | 28.8% | 12.8%(+16.0)#38 | 9.8%(+19.0)#1,834 |
| 39. | Martin | 28.6% | 12.8%(+15.8)#39 | 9.8%(+18.8)#1,850 |
| 40. | Henry | 28.6% | 12.8%(+15.8)#40 | 9.8%(+18.8)#1,870 |
| 41. | Brant Lake South | 28.6% | 12.8%(+15.8)#41 | 9.8%(+18.8)#1,873 |
| 42. | Morristown | 28.6% | 12.8%(+15.8)#42 | 9.8%(+18.8)#1,895 |
| 43. | Wonderland Homes | 28.0% | 12.8%(+15.2)#43 | 9.8%(+18.2)#1,959 |
| 44. | Harrisburg | 27.3% | 12.8%(+14.6)#44 | 9.8%(+17.6)#2,028 |
| 45. | Crook | 27.3% | 12.8%(+14.5)#45 | 9.8%(+17.5)#2,064 |
| 46. | Chancellor | 27.0% | 12.8%(+14.2)#46 | 9.8%(+17.2)#2,090 |
| 47. | Evergreen Colony | 27.0% | 12.8%(+14.2)#47 | 9.8%(+17.2)#2,092 |
| 48. | Whitewood | 26.7% | 12.8%(+13.9)#48 | 9.8%(+16.9)#2,125 |
| 49. | Leola | 26.2% | 12.8%(+13.4)#49 | 9.8%(+16.4)#2,204 |
| 50. | Platte | 26.1% | 12.8%(+13.4)#50 | 9.8%(+16.4)#2,215 |
| 51. | Parker | 26.0% | 12.8%(+13.2)#51 | 9.8%(+16.3)#2,229 |
| 52. | Irene | 25.9% | 12.8%(+13.1)#52 | 9.8%(+16.1)#2,261 |
| 53. | White Lake | 25.0% | 12.8%(+12.2)#53 | 9.8%(+15.2)#2,408 |
| 54. | New Effington | 25.0% | 12.8%(+12.2)#54 | 9.8%(+15.2)#2,440 |
| 55. | Parkston | 24.9% | 12.8%(+12.1)#55 | 9.8%(+15.1)#2,500 |
| 56. | Dakota Dunes | 24.1% | 12.8%(+11.3)#56 | 9.8%(+14.3)#2,640 |
| 57. | Mina | 23.5% | 12.8%(+10.8)#57 | 9.8%(+13.8)#2,743 |
| 58. | Reliance | 22.6% | 12.8%(+9.79)#58 | 9.8%(+12.8)#3,019 |
| 59. | Avon | 22.5% | 12.8%(+9.69)#59 | 9.8%(+12.7)#3,044 |
| 60. | Badger | 22.2% | 12.8%(+9.44)#60 | 9.8%(+12.4)#3,120 |
| 61. | Rosebud | 22.0% | 12.8%(+9.21)#61 | 9.8%(+12.2)#3,175 |
| 62. | Freeman | 22.0% | 12.8%(+9.18)#62 | 9.8%(+12.2)#3,183 |
| 63. | Baltic | 21.8% | 12.8%(+9.02)#63 | 9.8%(+12.0)#3,233 |
| 64. | Langford | 21.6% | 12.8%(+8.84)#64 | 9.8%(+11.8)#3,287 |
| 65. | Stickney | 21.6% | 12.8%(+8.84)#65 | 9.8%(+11.8)#3,291 |
| 66. | Keystone | 21.3% | 12.8%(+8.49)#66 | 9.8%(+11.5)#3,409 |
| 67. | Gregory | 21.3% | 12.8%(+8.47)#67 | 9.8%(+11.5)#3,414 |
| 68. | Rosholt | 21.1% | 12.8%(+8.27)#68 | 9.8%(+11.3)#3,473 |
| 69. | Hill City | 20.3% | 12.8%(+7.54)#69 | 9.8%(+10.5)#3,699 |
| 70. | Columbia | 20.0% | 12.8%(+7.21)#70 | 9.8%(+10.2)#3,857 |
| 71. | Geddes | 20.0% | 12.8%(+7.21)#71 | 9.8%(+10.2)#3,872 |
| 72. | Pickstown | 19.3% | 12.8%(+6.49)#72 | 9.8%(+9.50)#4,116 |
| 73. | Buffalo Gap | 19.0% | 12.8%(+6.26)#73 | 9.8%(+9.27)#4,216 |
| 74. | Meadow View Addition | 18.8% | 12.8%(+5.96)#74 | 9.8%(+8.97)#4,337 |
| 75. | New Underwood | 18.8% | 12.8%(+5.96)#75 | 9.8%(+8.97)#4,340 |
| 76. | Hot Springs | 18.6% | 12.8%(+5.86)#76 | 9.8%(+8.87)#4,395 |
| 77. | Prairiewood | 18.6% | 12.8%(+5.84)#77 | 9.8%(+8.85)#4,406 |
| 78. | Box Elder | 18.3% | 12.8%(+5.56)#78 | 9.8%(+8.56)#4,538 |
| 79. | Yankton | 18.3% | 12.8%(+5.51)#79 | 9.8%(+8.52)#4,561 |
| 80. | Canton | 18.2% | 12.8%(+5.41)#80 | 9.8%(+8.42)#4,594 |
| 81. | Viborg | 18.2% | 12.8%(+5.40)#81 | 9.8%(+8.40)#4,604 |
| 82. | Nunda | 18.2% | 12.8%(+5.40)#82 | 9.8%(+8.40)#4,644 |
| 83. | Worthing | 18.1% | 12.8%(+5.33)#83 | 9.8%(+8.33)#4,661 |
| 84. | Redfield | 18.0% | 12.8%(+5.18)#84 | 9.8%(+8.18)#4,720 |
| 85. | Wessington Springs | 17.6% | 12.8%(+4.86)#85 | 9.8%(+7.87)#4,869 |
| 86. | Gayville | 17.5% | 12.8%(+4.76)#86 | 9.8%(+7.76)#4,931 |
| 87. | Gettysburg | 17.5% | 12.8%(+4.70)#87 | 9.8%(+7.71)#4,962 |
| 88. | Mission | 17.3% | 12.8%(+4.50)#88 | 9.8%(+7.50)#5,054 |
| 89. | Summerset | 17.3% | 12.8%(+4.47)#89 | 9.8%(+7.48)#5,066 |
| 90. | Murdo | 17.2% | 12.8%(+4.38)#90 | 9.8%(+7.38)#5,126 |
| 91. | Newell | 16.9% | 12.8%(+4.10)#91 | 9.8%(+7.10)#5,281 |
| 92. | Bryant | 16.7% | 12.8%(+3.88)#92 | 9.8%(+6.89)#5,382 |
| 93. | Waubay | 16.7% | 12.8%(+3.88)#93 | 9.8%(+6.89)#5,403 |
| 94. | Wakonda | 16.7% | 12.8%(+3.88)#94 | 9.8%(+6.89)#5,407 |
| 95. | Doland | 16.7% | 12.8%(+3.88)#95 | 9.8%(+6.89)#5,441 |
| 96. | Dell Rapids | 16.4% | 12.8%(+3.62)#96 | 9.8%(+6.62)#5,610 |
| 97. | Brant Lake | 16.4% | 12.8%(+3.58)#97 | 9.8%(+6.58)#5,631 |
| 98. | Blackhawk | 16.2% | 12.8%(+3.44)#98 | 9.8%(+6.45)#5,711 |
| 99. | North Sioux City | 16.2% | 12.8%(+3.43)#99 | 9.8%(+6.44)#5,713 |
| 100. | Sturgis | 16.2% | 12.8%(+3.41)#100 | 9.8%(+6.41)#5,733 |
Common Questions
What are the Top 10 Cities with the Highest Percentage of Population with a Degree in Science and Engineering in South Dakota?
Top 10 Cities with the Highest Percentage of Population with a Degree in Science and Engineering in South Dakota are:
#1
100.0%
#2
100.0%
#3
100.0%
#4
100.0%
#5
100.0%
#6
100.0%
#7
64.3%
#8
61.1%
#9
60.0%
#10
58.3%
What city has the Highest Percentage of Population with a Degree in Science and Engineering in South Dakota?
Soldier Creek has the Highest Percentage of Population with a Degree in Science and Engineering in South Dakota with 100.0%.
What is the Percentage of Population with a Degree in Science and Engineering in the State of South Dakota?
Percentage of Population with a Degree in Science and Engineering in South Dakota is 12.8%.
What is the Percentage of Population with a Degree in Science and Engineering in the United States?
Percentage of Population with a Degree in Science and Engineering in the United States is 9.8%.