Cities with the Highest Percentage of Population with a Degree in Science and Engineering in Louisiana
RELATED REPORTS & OPTIONS
Science and Engineering
Louisiana
Compare Cities
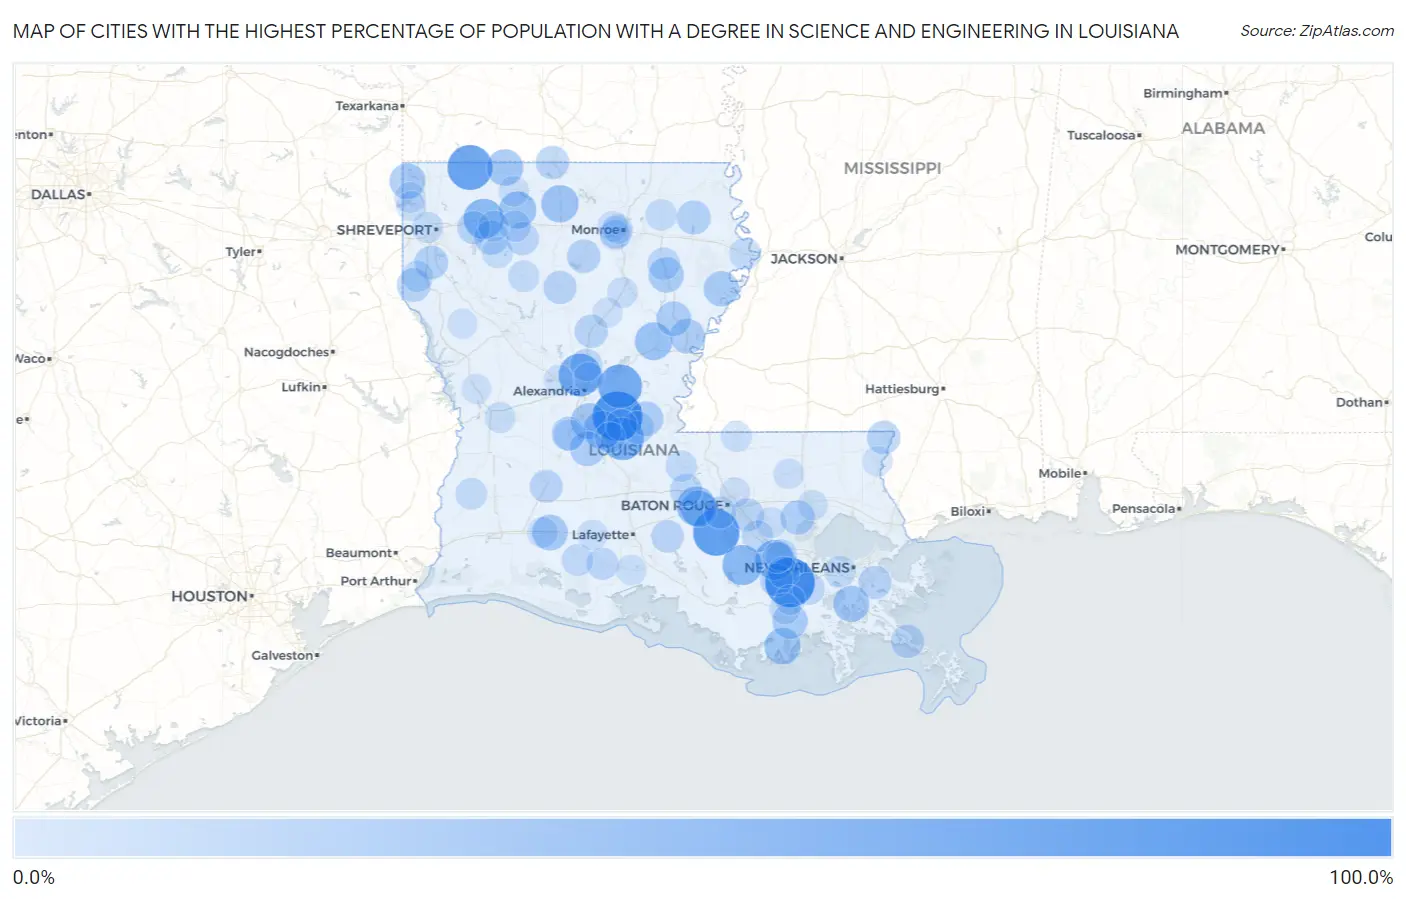
Map of Cities with the Highest Percentage of Population with a Degree in Science and Engineering in Louisiana
0.0%
100.0%
Cities with the Highest Percentage of Population with a Degree in Science and Engineering in Louisiana
| City | % Graduates | vs State | vs National | |
| 1. | Fifth Ward | 100.0% | 12.6%(+87.4)#1 | 9.8%(+90.2)#3 |
| 2. | Kraemer | 100.0% | 12.6%(+87.4)#2 | 9.8%(+90.2)#4 |
| 3. | Crescent | 86.5% | 12.6%(+73.9)#3 | 9.8%(+76.7)#225 |
| 4. | Cullen | 80.8% | 12.6%(+68.2)#4 | 9.8%(+71.0)#241 |
| 5. | Deville | 74.8% | 12.6%(+62.2)#5 | 9.8%(+65.0)#281 |
| 6. | Creola | 71.4% | 12.6%(+58.8)#6 | 9.8%(+61.6)#294 |
| 7. | Evergreen | 70.6% | 12.6%(+58.0)#7 | 9.8%(+60.8)#301 |
| 8. | Dixie Inn | 60.0% | 12.6%(+47.4)#8 | 9.8%(+50.2)#406 |
| 9. | Hester | 59.7% | 12.6%(+47.2)#9 | 9.8%(+50.0)#420 |
| 10. | Paincourtville | 59.4% | 12.6%(+46.8)#10 | 9.8%(+49.6)#422 |
| 11. | Rosedale | 56.2% | 12.6%(+43.6)#11 | 9.8%(+46.4)#458 |
| 12. | Cheneyville | 51.7% | 12.6%(+39.1)#12 | 9.8%(+41.9)#522 |
| 13. | Wallace Ridge | 49.5% | 12.6%(+36.9)#13 | 9.8%(+39.7)#641 |
| 14. | Dubach | 48.2% | 12.6%(+35.6)#14 | 9.8%(+38.4)#666 |
| 15. | Athens | 48.1% | 12.6%(+35.6)#15 | 9.8%(+38.4)#669 |
| 16. | Grosse Tete | 45.5% | 12.6%(+32.9)#16 | 9.8%(+35.7)#729 |
| 17. | Haynesville | 44.9% | 12.6%(+32.3)#17 | 9.8%(+35.1)#746 |
| 18. | Dulac | 44.4% | 12.6%(+31.9)#18 | 9.8%(+34.7)#757 |
| 19. | Lecompte | 43.5% | 12.6%(+30.9)#19 | 9.8%(+33.7)#803 |
| 20. | Lafitte | 43.4% | 12.6%(+30.8)#20 | 9.8%(+33.6)#811 |
| 21. | Vivian | 42.8% | 12.6%(+30.2)#21 | 9.8%(+33.0)#848 |
| 22. | Roanoke | 42.3% | 12.6%(+29.7)#22 | 9.8%(+32.5)#861 |
| 23. | Newellton | 40.0% | 12.6%(+27.4)#23 | 9.8%(+30.2)#943 |
| 24. | Presquille | 39.9% | 12.6%(+27.3)#24 | 9.8%(+30.1)#982 |
| 25. | Winnsboro | 39.7% | 12.6%(+27.1)#25 | 9.8%(+29.9)#986 |
| 26. | Turkey Creek | 38.5% | 12.6%(+25.9)#26 | 9.8%(+28.7)#1,042 |
| 27. | Clayton | 38.5% | 12.6%(+25.9)#27 | 9.8%(+28.7)#1,045 |
| 28. | Sicily Island | 38.1% | 12.6%(+25.5)#28 | 9.8%(+28.3)#1,066 |
| 29. | Bordelonville | 37.0% | 12.6%(+24.4)#29 | 9.8%(+27.2)#1,124 |
| 30. | Killian | 35.9% | 12.6%(+23.4)#30 | 9.8%(+26.2)#1,175 |
| 31. | Heflin | 35.7% | 12.6%(+23.1)#31 | 9.8%(+25.9)#1,191 |
| 32. | Mcnary | 35.3% | 12.6%(+22.7)#32 | 9.8%(+25.5)#1,219 |
| 33. | Epps | 34.8% | 12.6%(+22.2)#33 | 9.8%(+25.0)#1,251 |
| 34. | Stonewall | 33.5% | 12.6%(+20.9)#34 | 9.8%(+23.7)#1,308 |
| 35. | Longstreet | 33.3% | 12.6%(+20.7)#35 | 9.8%(+23.6)#1,385 |
| 36. | Chatham | 32.6% | 12.6%(+20.0)#36 | 9.8%(+22.9)#1,438 |
| 37. | Junction City | 32.4% | 12.6%(+19.8)#37 | 9.8%(+22.6)#1,453 |
| 38. | Angie | 32.4% | 12.6%(+19.8)#38 | 9.8%(+22.6)#1,455 |
| 39. | Empire | 31.8% | 12.6%(+19.2)#39 | 9.8%(+22.0)#1,486 |
| 40. | Dodson | 31.8% | 12.6%(+19.2)#40 | 9.8%(+22.0)#1,490 |
| 41. | Georgetown | 31.6% | 12.6%(+19.0)#41 | 9.8%(+21.8)#1,515 |
| 42. | Poydras | 31.4% | 12.6%(+18.8)#42 | 9.8%(+21.6)#1,534 |
| 43. | Old Jefferson | 31.4% | 12.6%(+18.8)#43 | 9.8%(+21.6)#1,536 |
| 44. | Doyline | 31.2% | 12.6%(+18.7)#44 | 9.8%(+21.5)#1,543 |
| 45. | Oberlin | 30.4% | 12.6%(+17.9)#45 | 9.8%(+20.7)#1,624 |
| 46. | Moreauville | 30.0% | 12.6%(+17.4)#46 | 9.8%(+20.2)#1,660 |
| 47. | Bryceland | 30.0% | 12.6%(+17.4)#47 | 9.8%(+20.2)#1,680 |
| 48. | Chackbay | 30.0% | 12.6%(+17.4)#48 | 9.8%(+20.2)#1,692 |
| 49. | Catahoula | 29.6% | 12.6%(+17.0)#49 | 9.8%(+19.8)#1,732 |
| 50. | Livonia | 29.2% | 12.6%(+16.6)#50 | 9.8%(+19.4)#1,779 |
| 51. | Baskin | 28.6% | 12.6%(+16.0)#51 | 9.8%(+18.8)#1,883 |
| 52. | Pollock | 28.3% | 12.6%(+15.7)#52 | 9.8%(+18.6)#1,922 |
| 53. | Des Allemands | 27.8% | 12.6%(+15.2)#53 | 9.8%(+18.0)#1,976 |
| 54. | Brownsville | 27.3% | 12.6%(+14.7)#54 | 9.8%(+17.5)#2,033 |
| 55. | Kaplan | 27.2% | 12.6%(+14.6)#55 | 9.8%(+17.4)#2,073 |
| 56. | Brusly | 26.3% | 12.6%(+13.7)#56 | 9.8%(+16.5)#2,198 |
| 57. | Lutcher | 25.7% | 12.6%(+13.1)#57 | 9.8%(+15.9)#2,286 |
| 58. | Gueydan | 25.7% | 12.6%(+13.1)#58 | 9.8%(+15.9)#2,293 |
| 59. | Gonzales | 25.6% | 12.6%(+13.0)#59 | 9.8%(+15.8)#2,302 |
| 60. | Oretta | 25.0% | 12.6%(+12.4)#60 | 9.8%(+15.2)#2,389 |
| 61. | Hessmer | 25.0% | 12.6%(+12.4)#61 | 9.8%(+15.2)#2,395 |
| 62. | Morganza | 25.0% | 12.6%(+12.4)#62 | 9.8%(+15.2)#2,398 |
| 63. | Saline | 25.0% | 12.6%(+12.4)#63 | 9.8%(+15.2)#2,428 |
| 64. | Keachi | 25.0% | 12.6%(+12.4)#64 | 9.8%(+15.2)#2,446 |
| 65. | Oak Ridge | 25.0% | 12.6%(+12.4)#65 | 9.8%(+15.2)#2,476 |
| 66. | Mound | 25.0% | 12.6%(+12.4)#66 | 9.8%(+15.2)#2,497 |
| 67. | South Vacherie | 24.8% | 12.6%(+12.2)#67 | 9.8%(+15.0)#2,517 |
| 68. | Gibsland | 24.4% | 12.6%(+11.8)#68 | 9.8%(+14.6)#2,575 |
| 69. | Harahan | 24.4% | 12.6%(+11.8)#69 | 9.8%(+14.6)#2,581 |
| 70. | Jamestown | 23.5% | 12.6%(+10.9)#70 | 9.8%(+13.7)#2,760 |
| 71. | Lakeview | 23.4% | 12.6%(+10.8)#71 | 9.8%(+13.6)#2,776 |
| 72. | Bayou Blue | 23.0% | 12.6%(+10.4)#72 | 9.8%(+13.2)#2,907 |
| 73. | Glenmora | 22.6% | 12.6%(+10.1)#73 | 9.8%(+12.9)#2,994 |
| 74. | Fort Polk North | 22.5% | 12.6%(+9.97)#74 | 9.8%(+12.8)#3,024 |
| 75. | Dubberly | 22.5% | 12.6%(+9.92)#75 | 9.8%(+12.7)#3,034 |
| 76. | Norwood | 22.5% | 12.6%(+9.92)#76 | 9.8%(+12.7)#3,037 |
| 77. | French Settlement | 22.1% | 12.6%(+9.56)#77 | 9.8%(+12.4)#3,144 |
| 78. | Grand Point | 22.1% | 12.6%(+9.53)#78 | 9.8%(+12.3)#3,148 |
| 79. | Welsh | 21.9% | 12.6%(+9.31)#79 | 9.8%(+12.1)#3,201 |
| 80. | Oil City | 21.9% | 12.6%(+9.29)#80 | 9.8%(+12.1)#3,207 |
| 81. | Grayson | 21.4% | 12.6%(+8.84)#81 | 9.8%(+11.6)#3,343 |
| 82. | Claiborne | 21.3% | 12.6%(+8.71)#82 | 9.8%(+11.5)#3,404 |
| 83. | Bunkie | 21.2% | 12.6%(+8.61)#83 | 9.8%(+11.4)#3,442 |
| 84. | Crowley | 21.0% | 12.6%(+8.42)#84 | 9.8%(+11.2)#3,483 |
| 85. | Homer | 20.9% | 12.6%(+8.30)#85 | 9.8%(+11.1)#3,516 |
| 86. | Montpelier | 20.8% | 12.6%(+8.25)#86 | 9.8%(+11.1)#3,534 |
| 87. | New Orleans Station | 20.7% | 12.6%(+8.15)#87 | 9.8%(+11.0)#3,565 |
| 88. | Bawcomville | 20.5% | 12.6%(+7.96)#88 | 9.8%(+10.8)#3,635 |
| 89. | Ponchatoula | 20.5% | 12.6%(+7.95)#89 | 9.8%(+10.8)#3,639 |
| 90. | Erath | 20.2% | 12.6%(+7.59)#90 | 9.8%(+10.4)#3,746 |
| 91. | Ball | 20.1% | 12.6%(+7.49)#91 | 9.8%(+10.3)#3,766 |
| 92. | Brownfields | 20.0% | 12.6%(+7.39)#92 | 9.8%(+10.2)#3,904 |
| 93. | West Monroe | 19.9% | 12.6%(+7.32)#93 | 9.8%(+10.1)#3,916 |
| 94. | Bogalusa | 19.9% | 12.6%(+7.29)#94 | 9.8%(+10.1)#3,922 |
| 95. | Raceland | 19.8% | 12.6%(+7.23)#95 | 9.8%(+10.0)#3,937 |
| 96. | Pleasant Hill | 19.6% | 12.6%(+6.98)#96 | 9.8%(+9.78)#4,007 |
| 97. | Hornbeck | 19.4% | 12.6%(+6.86)#97 | 9.8%(+9.66)#4,054 |
| 98. | Mooringsport | 19.4% | 12.6%(+6.86)#98 | 9.8%(+9.66)#4,055 |
| 99. | Olla | 19.4% | 12.6%(+6.82)#99 | 9.8%(+9.62)#4,069 |
| 100. | Boyce | 19.4% | 12.6%(+6.77)#100 | 9.8%(+9.57)#4,087 |
Common Questions
What are the Top 10 Cities with the Highest Percentage of Population with a Degree in Science and Engineering in Louisiana?
Top 10 Cities with the Highest Percentage of Population with a Degree in Science and Engineering in Louisiana are:
#1
100.0%
#2
100.0%
#3
86.5%
#4
80.8%
#5
74.8%
#6
71.4%
#7
70.6%
#8
60.0%
#9
59.7%
#10
59.4%
What city has the Highest Percentage of Population with a Degree in Science and Engineering in Louisiana?
Fifth Ward has the Highest Percentage of Population with a Degree in Science and Engineering in Louisiana with 100.0%.
What is the Percentage of Population with a Degree in Science and Engineering in the State of Louisiana?
Percentage of Population with a Degree in Science and Engineering in Louisiana is 12.6%.
What is the Percentage of Population with a Degree in Science and Engineering in the United States?
Percentage of Population with a Degree in Science and Engineering in the United States is 9.8%.